Auditory/Speech Perception
Auditory/Speech Perception
Auditory/Speech Perception

You also want an ePaper? Increase the reach of your titles
YUMPU automatically turns print PDFs into web optimized ePapers that Google loves.
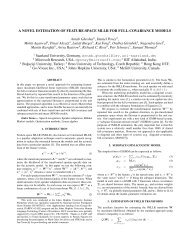
<strong>Auditory</strong>/<strong>Speech</strong><strong>Perception</strong> LabNima Mesgarani1
setup• addpath /home/nmesgara/Matlab/ws20092
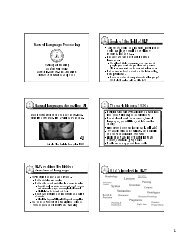
The goal of <strong>Auditory</strong><strong>Perception</strong> Workshop1. Learn about auditory cortical neurons: howthey respond to phonemes2. make a model of neural transformationbased on 1, and investigate the usefulness ofsuch representation3
Projects1. Having the actual responses of 6 corticalneurons to continuous speech, exploretheir average responses to phonemes2. Using a model of cortical transformations,observe the representation of speech andnoise, and separate them.4
The brain• Brain is divided into regions in whichparticular functions are localized6
Neuron’s anatomy• Dendrites: inputs of the cell• Cell body: integrative zone• Axon: output of the neuron• Synapses: connections to other neurons7
Action potentials• Electrical signals that convey informationfrom one cell to the next• Fixed amplitude and shape. Only frequencychanges with input8
Physiology setup9
<strong>Auditory</strong> corticalneurons• we have the response of 6 primary auditorycortex neurons to 30 sentences fromTIMIT• The goal is to understand the way theyrespond to speech10
Neural response to asentence• [data , waveform] = NeuralResp (N);• example: display the waveform andresponse of neural 1 to the first sentence:• [d,w] = NeuralResp (1);• subplot(2,1,1); plot(w(1,:)); axis tight;• subplot(2,1,2); plot(d(1,:)); axis tight;11
Average responses tophonemes• Find segments of the response thatcorrespond to a particular phoneme andaverage them.12
Mean phoneme response:spectrogramNeuralresponse+ Average spectrogramof phoneme ‘eh’Average neuralresponse ofphoneme ‘eh’13
Selected phonemes: average spectrogramsih aa t b s shFrequencyTime• Vowel /ih/ (as in bit) /aa/ (as in bott)• formant positions• Plosives /ta/ /ba/• rapid temporal changes, broadband burst• Fricatives /s/ /sh/• slow temporal dynamics, narrowband14
Average neuralresponse to phonemes• to get the response of neuron N to phoneme /x/, use the AverageNeuralResp.mscript.• example: response of the first neuron to phoneme /s/:• data = AverageNeuralResp ( 1 , ‘s’ );• data is a time * phoneme matrix ( for this example: 35 * 47). 35 correspondsto 350ms windows (35 frames) in which the phonemes start at frame 11.• 47 is number of ‘s’ phonemes in the selected data set.• to see the response to all instances: imagesc (data’);• to see the average response: plot ( mean(data,2) );15
Average neural response tophonemes• Find the average response of all the 6neurons to the following phonemes:• /ih/ /aa/ /t/ /b/ /s/ /sh/• display the responses of each neuron tothe phonemes in one figure using• subplot (1,6,c)16
A model of corticalneurons• We saw that the transfer function ofdifferent neurons varies in manydimensions, including frequency, temporaland spectral modulations• Use a bank of filters, with varyingfrequency, temporal and spectralmodulation to analyze the spectrogram17
<strong>Auditory</strong> Model• The proposed auditory model has two basicstages:• Early auditory stage: Spectral Estimation• Cortex stage: Analysis18
Early <strong>Auditory</strong> StageSound waveform is converted to a two-dimensionalpattern of time-frequency representation19
Cortical Stage• The spectrogram is analyzed by a bank ofcortical Spectro-Temporal Receptive Fields(STRF).20
STRF varies in severaldimensions±: Rate (Hz): Scale (Cyc/Oct)FrequencyTime21
Cortical processes22
cortical output• is a 4-D representation: scale, rate, time,frequency• is invertible: we can modify therepresentation and go back to sound• Use the GUI interface to play with themodel:• MultiresolutionGUI.m23
Using the gui• ‘refresh’ loads the list of sound samples• ‘wav2aud’ calculates the auditoryrepresentation• ‘aud2cor’ generates the corticalrepresentation24
Sound samples• For each sound, estimate the <strong>Auditory</strong> Spectrogram, and theModulation representation• Display the Modulation representation by collapsing differentdimensions: rate-time, scale-time, rate-scale, rate-scale-time, and full.• Ripple noise: starts slow and sparse -> fast and sparse -> fast anddense -> and ends slow and dense.• <strong>Speech</strong>• <strong>Speech</strong> in ripple noise25
Cortical representationof speech and noise• what is the representation of ripple noise and speech?• in which domain is there a better separation between speechand noise?• how could you suppress the noise? what representation youuse?26
A simple noisesuppression• Find the modulation representation of <strong>Speech</strong> In RippleNoise (load the sound, hit wav2aud and aud2cor buttons)• global nsl;• nsl.rcor = nsl.cor;• nsl.rcor (3,11,:,:) = 0; % this is where the noise is• reconstruct the sound spectrogram using the modifiedrepresentation.27
Noise Suppression28