Chapter 3 - Pearson Learning Solutions
Chapter 3 - Pearson Learning Solutions
Chapter 3 - Pearson Learning Solutions

Create successful ePaper yourself
Turn your PDF publications into a flip-book with our unique Google optimized e-Paper software.
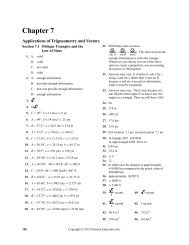
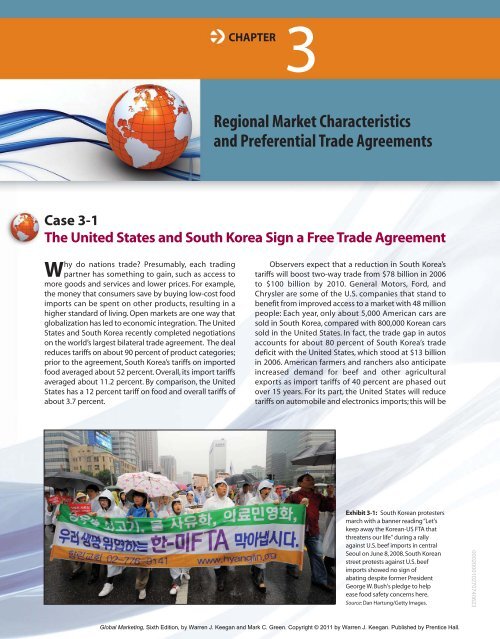
CHAPTER3Regional Market Characteristicsand Preferential Trade AgreementsCase 3-1The United States and South Korea Sign a Free Trade AgreementWhy do nations trade? Presumably, each tradingpartner has something to gain, such as access tomore goods and services and lower prices. For example,the money that consumers save by buying low-cost foodimports can be spent on other products, resulting in ahigher standard of living. Open markets are one way thatglobalization has led to economic integration. The UnitedStates and South Korea recently completed negotiationson the world’s largest bilateral trade agreement. The dealreduces tariffs on about 90 percent of product categories;prior to the agreement, South Korea’s tariffs on importedfood averaged about 52 percent. Overall, its import tariffsaveraged about 11.2 percent. By comparison, the UnitedStates has a 12 percent tariff on food and overall tariffs ofabout 3.7 percent.Observers expect that a reduction in South Korea’stariffs will boost two-way trade from $78 billion in 2006to $100 billion by 2010. General Motors, Ford, andChrysler are some of the U.S. companies that stand tobenefit from improved access to a market with 48 millionpeople: Each year, only about 5,000 American cars aresold in South Korea, compared with 800,000 Korean carssold in the United States. In fact, the trade gap in autosaccounts for about 80 percent of South Korea’s tradedeficit with the United States, which stood at $13 billionin 2006. American farmers and ranchers also anticipateincreased demand for beef and other agriculturalexports as import tariffs of 40 percent are phased outover 15 years. For its part, the United States will reducetariffs on automobile and electronics imports; this will beExhibit 3-1: South Korean protestersmarch with a banner reading “Let'skeep away the Korean-US FTA thatthreatens our life" during a rallyagainst U.S. beef imports in centralSeoul on June 8, 2008. South Koreanstreet protests against U.S. beefimports showed no sign ofabating despite former PresidentGeorge W. Bush's pledge to helpease food safety concerns here.Source: Dan Hartung/Getty Images.000200010270740623Global Marketing, Sixth Edition, by Warren J. Keegan and Mark C. Green. Copyright © 2011 by Warren J. Keegan. Published by Prentice Hall.
a boon for Hyundai, Samsung, LG, and other industryleaders in South Korea. On paper, it appears that bothsides will benefit from the free trade agreement. If that istrue, why are some people adamantly opposed to theagreement (see Exhibit 3-1)? When you have finishedreading <strong>Chapter</strong> 3, turn to Case 3-1 for more discussionof the pros as well as possible “cons.”Since World War II, there has been a tremendous interestamong nations in furthering the cause of economiccooperation and integration.The agreement between theUnited States and South Korea illustrates the fact thattrade deals can be limited to two nations; however, tradenegotiations and trade agreements also occur at theregional and global levels. Our survey of the world tradeenvironment begins at the global level with the WTO andits predecessor, the GATT. Next, the four main types ofbilateral and regional preferential trade agreements areidentified and described. An introduction to individualcountries in the world’s major market regions follows;each section also includes detailed discussion of thespecific preferential trade agreements in which thosecountries participate. Important marketing issues in eachregion are also discussed. Several important emergingcountry markets were described in <strong>Chapter</strong> 2; in thischapter, special attention will be given to individualcountry markets that were not previously discussed.000200010270740623THE WORLD TRADE ORGANIZATION AND GATTThe year 2007 marked the sixtieth anniversary of the General Agreement on Tariffs and Trade(GATT), a treaty among nations whose governments agree, at least in principle, to promote tradeamong members. GATT was intended to be a multilateral, global initiative, and GATT negotiatorsdid succeed in liberalizing world merchandise trade. GATT was also an organization thathandled 300 trade disputes—many involving food—during its half century of existence. GATTitself had no enforcement power (the losing party in a dispute was entitled to ignore the ruling),and the process of dealing with disputes sometimes stretched on for years. Little wonder, then,that some critics referred to GATT as the “General Agreement to Talk and Talk.”The successor to GATT, the World Trade Organization (WTO), came into existence onJanuary 1, 1995. From its base in Geneva, the WTO provides a forum for trade-related negotiationsamong its 150 members. The WTO’s staff of neutral trade experts also serve as mediatorsin global trade disputes. The WTO has a Dispute Settlement Body (DSB) that mediatescomplaints concerning unfair trade barriers and other issues between the WTO’s member countries.During a 60-day consultation period, parties to a complaint are expected to engage in goodfaithnegotiations and reach an amicable resolution. If that fails, the complainant can ask theDSB to appoint a three-member panel of trade experts to hear the case behind closed doors. Afterconvening, the panel has nine months within which to issue its ruling. 1 The DSB is empoweredto act on the panel’s recommendations. The losing party has the option of turning to a sevenmemberappellate body. If, after due process, a country’s trade policies are found to violate WTOrules, it is expected to change those policies. If changes are not forthcoming, the WTO canauthorize trade sanctions against the loser. Table 3-1 lists some recent cases that have beenbrought to the WTO.Trade ministers representing the WTO member nations meet annually to work on improvingworld trade. It remains to be seen whether the WTO will live up to expectations when it comes toadditional major policy initiatives on such vexing issues as foreign investment and agricultural1 Scott Miller, “Global Dogfight: Airplane Battle Spotlights Power of a Quirky Court,” The Wall Street Journal (June 1,2005), pp. A1, A14.75Global Marketing, Sixth Edition, by Warren J. Keegan and Mark C. Green. Copyright © 2011 by Warren J. Keegan. Published by Prentice Hall.
76 PART 2 • THE GLOBAL MARKETING ENVIRONMENTTABLE 3-1 Recent WTO CasesCountries Involved in DisputeUnited States, European Union,Canada versus ChinaUnited States versus BrazilAntigua and Barbuda versus theUnited StatesUnited States versus European UnionNature of Dispute and OutcomeIn 2006, the complainants asked the DSB to consider Chinese tariffs on imported autoparts. The complainants argued that their auto manufacturers were at a disadvantagebecause Beijing required them to buy components locally or pay high tariffs. In 2008,the WTO ruled that China had violated trade rules.In 2003, Brazil filed a complaint against the United States charging that cotton subsidiesdepressed prices and disadvantaged producers in emerging markets. In 2004, the DSB,in its first-ever ruling on agricultural subsidies, agreed that cotton subsidies violateinternational trade rules.In 2003, Antigua filed suit charging that, by prohibiting Internet gambling, the UnitedStates was violating global trade agreements. In 2004, the WTO ruled in favor ofAntigua.In 2002, U.S. President Bush imposed 30 percent tariffs on a range of steel importsfor a period of three years. The EU lodged a protest, and in 2003, the WTO ruled thatthe tariffs were illegal. President Bush responded by lifting the tariffs.“For the WTO processto work, countrieshave to startliberalizing policiesin politically sensitivesectors.” 2Daniel Griswold, Center forTrade Policy Studies, CatoInstitutesubsidies. The current round of WTO negotiations began in 2001; the talks collapsed in 2005 andattempts to revive them in the years since have not been successful. For more on the trade talks,turn to the Strategic Decision Making box on page 79.PREFERENTIAL TRADE AGREEMENTSThe GATT treaty promotes free trade on a global basis; in addition, countries in each ofthe world’s regions are seeking to liberalize trade within their regions. A preferential tradeagreement is a mechanism that confers special treatment on select trading partners. By favoringcertain countries, such agreements frequently discriminate against others. For that reason, it iscustomary for countries to notify the WTO when they enter into preferential trade agreements. Inrecent years, the WTO has been notified of approximately 300 preferential trade agreements.Few fully conform to WTO requirements; none, however, has been disallowed.Free Trade AreaA free trade area (FTA) is formed when two or more countries agree to eliminate tariffs andother barriers that restrict trade. When trading partners successfully negotiate a free tradeagreement (also abbreviated FTA), the ultimate goal of which is to have zero duties on goodsthat cross borders between the partners, it creates a free trade area. In some instances, duties areeliminated on the day the agreement takes effect; in other cases, duties are phased out over a setperiod of time. Countries that belong to an FTA can maintain independent trade policies withrespect to third countries. Rules of origin discourage the importation of goods into the membercountry with the lowest external tariff for transshipment to one or more FTA members withhigher external tariffs; customs inspectors police the borders between members.For example, because Chile and Canada established an FTA in 1997, a Canadian-builtCaterpillar grader tractor imported into Chile would not be subject to duty. If the same piece ofequipment was imported from a factory in the United States, the importer would pay about $13,000in duties. Could Caterpillar send the U.S.-built tractor to Chile by way of Canada, thereby allowingthe importer to avoid paying the duty? No, because the tractor would bear a “Made in the U.S.A.”certificate of origin indicating it was subject to the duty. Little wonder, then, that the U.S. governmentnegotiated its own bilateral free trade agreement with Chile that entered into force in 2003.According to the Business Roundtable, to date more than 300 free trade agreements havebeen negotiated globally; roughly 50 percent of global trade takes place among nations linked byFTAs (see Table 3-2). Additional examples of FTAs include the European Economic Area, a freetrade area that includes the 27-nation EU plus Norway, Liechtenstein, and Iceland; the Group of2 Scott Miller, “Trade Talks Twist in the Wind,” The Wall Street Journal (November 8, 2005), p. A14.000200010270740623Global Marketing, Sixth Edition, by Warren J. Keegan and Mark C. Green. Copyright © 2011 by Warren J. Keegan. Published by Prentice Hall.
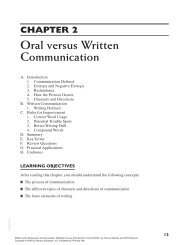
CHAPTER 3 • REGIONAL MARKET CHARACTERISTICS AND PREFERENTIAL TRADE AGREEMENTS 77TABLE 3-2 Free Trade Agreements Around the WorldFTAs negotiated globally300 (approx.)FTAs negotiated since 2002 in Asia Pacific 119Percentage of world trade occurring through FTAs 50%Countries with which China is negotiating or has proposed FTAs 28EU FTAs 21U.S. FTAs 10Source: Business Roundtable, March 2007. Reprinted by permission of Business Roundtable.Three (G-3), an FTA encompassing Colombia, Mexico, and Venezuela; and the CloserEconomic Partnership Agreement, a free trade agreement between China and Hong Kong. Asnoted in the chapter introduction, the United States is currently negotiating an FTA with SouthKorea; negotiations are also ongoing with Panama and Colombia (see Exhibit 3-2).Exhibit 3-2: Many smallbusiness owners areadvocates of free tradeagreements. Speaking onbehalf of the ConsumerElectronics Association,the CEO of electronicsmanufacturer Thiel notes,“Today we’re a leadingmaker of high-performancespeakers with 30 Americanemployees and thousandsof global trade partners.We’re also one of 2,200 CEAmembers growing oureconomy thanks to freetrade. Speak out for freetrade. Support free tradeagreements with Colombia,Panama, and South Korea.”Source: Used by permission ofConsumer ElectronicAssociation.000200010270740623Global Marketing, Sixth Edition, by Warren J. Keegan and Mark C. Green. Copyright © 2011 by Warren J. Keegan. Published by Prentice Hall.
78 PART 2 • THE GLOBAL MARKETING ENVIRONMENTTABLE 3-3 Forms of Regional Economic IntegrationStage ofIntegrationElimination ofTariffs and QuotasAmong MembersCommon ExternalTariff (CET)and Quota SystemElimination ofRestrictions onFactor MovementsHarmonization andUnification of Economicand Social Policiesand InstitutionsFree Trade Area Yes No No NoCustoms Union Yes Yes No NoCommon Market Yes Yes Yes NoEconomic Union Yes Yes Yes YesCustoms UnionA customs union represents the logical evolution of a free trade area. In addition to eliminatinginternal barriers to trade, members of a customs union agree to the establishment of common externaltariffs (CETs). In 1996, for example, the European Union and Turkey initiated a customs unionin an effort to boost two-way trade above the average annual level of $20 billion. The arrangementcalled for the elimination of tariffs averaging 14 percent that added $1.5 billion each year to the costof European goods imported by Turkey. Other customs unions discussed in this chapter are theAndean Community, the Central American Integration System (SICA), Mercosur, and CARICOM.Common MarketA common market is the next level of economic integration. In addition to the removal ofinternal barriers to trade and the establishment of common external tariffs, the common marketallows for free movement of factors of production, including labor and capital. The AndeanCommunity, the SICA, and CARICOM, which currently function as customs unions, mayultimately evolve into true common markets.Economic UnionAn economic union builds upon the elimination of the internal tariff barriers, the establishment ofcommon external barriers, and the free flow of factors. It seeks to coordinate and harmonize economicand social policy within the union to facilitate the free flow of capital, labor, and goods andservices from country to country. An economic union is a common marketplace not only for goodsbut also for services and capital. For example, if professionals are going to be able to work anywherein the EU, the members must harmonize their practice licensing so that a doctor or lawyer qualifiedin one country may practice in any other. The full evolution of an economic union would involve thecreation of a unified central bank, the use of a single currency, and common policies on agriculture,social services and welfare, regional development, transport, taxation, competition, and mergers. Atrue economic union requires extensive political unity, which makes it similar to a nation. Thefurther integration of nations that were members of fully developed economic unions would be theformation of a central government that would bring together independent political states into a singlepolitical framework. The EU is approaching its target of completing most of the steps required tobecome a full economic union, with one notable setback. Despite the fact that 16 member nationsratified a proposed European Constitution, the initiative was derailed after voters in France and theNetherlands voted against the measure. Table 3-3 compares the various forms of regional economicintegration.NORTH AMERICANorth America, which includes Canada, the United States, and Mexico, comprises a distinctiveregional market. The United States combines great wealth, a large population, vast space, andplentiful natural resources in a single national economic and political environment and presentsunique marketing characteristics. High product-ownership levels are associated with high income000200010270740623Global Marketing, Sixth Edition, by Warren J. Keegan and Mark C. Green. Copyright © 2011 by Warren J. Keegan. Published by Prentice Hall.
CHAPTER 3 • REGIONAL MARKET CHARACTERISTICS AND PREFERENTIAL TRADE AGREEMENTS 79STRATEGIC DECISION MAKING IN GLOBAL MARKETINGSixty Years of Trade Negotiation000200010270740623Between 1947 and 1994, the member countries of GATTcompleted eight rounds of multilateral trade negotiations.Tariffs have been reduced from an average of 40 percent in 1945to 5 percent today. The result has been a tremendous growth intrade: In the three decades from 1945 to 1975, the volume ofworld trade expanded by roughly 500 percent. The seventh roundof negotiations was launched in Tokyo and ran from 1973 to1979. These talks succeeded in cutting duties on industrialproducts valued at $150 billion by another 30 percent so that theremaining tariffs averaged about 6 percent. In terms of agriculturaltrade, there was a standoff between the United States, Europe,and Japan. The confrontation pitted the interests of the Americanfarm lobby against the equally politically powerful farmers ofEurope and Japan. Deep-rooted differences resulted in littlechange in the agricultural area during the Tokyo round. The mostnotable feature of the Tokyo round was not the duty cuts, butrather a series of nine new agreements on nontariff trade barriers.GATT officials also devoted considerable attention to theservices industry, addressing market-entry barriers in banking,insurance, telecommunications, and other sectors. The servicesissue was so contentious that the opening of the Uruguay roundwas delayed from 1982 until 1986. In addition to trade in services,these negotiations revisited the issue of nontariff measures thatrestrict or distort trade, including agricultural trade policy, intellectualproperty protection, and restrictions on foreign investment.Agricultural subsidies and quotas that developed outside themultilateral framework remain a divisive issue. Critics argue thattrade patterns are distorted when affluent countries protect andsubsidize farm production. While home-market consumers payhigher prices, surplus output is sold abroad at artificially low prices.According to the Organization for Economic Cooperation andDevelopment, in the mid-1990s, the total cost of these subsidies torich-country taxpayers and consumers was more than $200 billion ayear. Critics also believe that subsidies deny poor countries a naturalpath out of poverty, namely food exports. For example, in a 2002report, Oxfam International estimated that U.S. cotton subsidies costcotton farmers in Africa $300 million in lost exports each year.The Uruguay negotiations were suspended in December 1990after 30,000 French farmers took to the streets of Brussels toprotest a proposed 30 percent cut in agricultural export subsidies.Negotiations resumed a few months later against the backgroundof the united Western war effort in the Persian Gulf War. Negotiatorsfinally succeeded in reaching an agreement by the December 15,1993, deadline. A stalemate over agricultural subsidies was broken,with France and the EU nations agreeing to reductions. The U.S.Congress voted in favor of GATT at the end of 1994.Competitive companies will benefit as tariffs are cut oreliminated entirely. The Triad nations agreed to end tariffs inpharmaceuticals, construction and agricultural equipment,Scotch whisky, furniture, paper, steel, and medical equipment.Also, U.S. restrictions on textile and apparel imports from developingcountries were phased out over a 10-year period. Majorissues remain unresolved in the entertainment industry; Francehas insisted on preferences and subsidies for French producers oftelevision programming and motion pictures in order to limitwhat they feel is “cultural imperialism.” Talks aimed at reducingEuropean broadcast restrictions on U.S.-produced movies andtelevision programming were unsuccessful.Efforts to break the deadlock over agriculture have met withsome success. For one thing, the EU’s Common Agricultural Policy(CAP) is distinctly different than it was two decades ago. In 1999, EUgovernments agreed on Agenda 2000 reforms that have resulted inprice support reductions and increased attention to environmentalissues. In 2003, the EU undertook further reform of CAP bydecoupling agricultural income support from production. In 2004,Brazil successfully challenged the EU sugar regime at the WTO. In2005, the EU proposed cutting subsidies for agricultural exports; italso agreed to cut sugar subsidies by 36 percent over a four-yearperiod. Meanwhile, industry trade groups such as the Committee ofProfessional Agriculture Organizations and the General Confederationof Agricultural Cooperatives (COPA-COGECA) in the EUare steadfast in their efforts to serve the interests of farmers andprovide input to policymakers; COPA-COGECA also is an advocatefor sustainable development and related issues.For its part, the U.S. government has proposed cappingsubsidies at a maximum of $250,000 per farmer per year. In 2005,the WTO ruled in favor of Brazil’s challenge to U.S. cotton subsidies;meanwhile, a grassroots anti-subsidy movement is gaining traction.As Jerry Moran, a Republican congressman from Kansas, told theWall Street Journal, “There are a growing number of people whowant to weigh in on farm policy. They care about Africa. They careabout the environment. They care about nutrition.”Sources: Alan Beattie, “Weight of Expectation Buries Deal,” FinancialTimes (July 25, 2006), p. 2; Scott Killman and Roger Thurow, “Pork Chops:In Fight Against Farm Subsidies, Even Farmers Are Joining Foes,” The WallStreet Journal (March 14, 2006), pp. A1, A16; Keith Bradsher, “Trade TalksNow Expected to Focus on Exports of Poorest Nations,” The New YorkTimes (December 12, 2005), pp. C1, C3; Noelle Knox, “French RallyAround Farmers at WTO Talks,” USA Today (November 30, 2005), p. 5B;Scott Miller, “Trade Talks Twist in the Wind,” The Wall Street Journal(November 8, 2005), pp. A14, A15; Shailagh Murray, “Subsidies ShackleEU Competitiveness,” The Wall Street Journal (October 28, 1996), p. A13;“GATT’s Last Gasp,” Economist (December 1, 1990), p. 16; Joseph A.McKinney, “How Multilateral Trade Talks Affect the U.S.,” Baylor BusinessReview (Fall 1991), pp. 24–25; Bob Davis, “Squeaky Wheels: GATT TalksResume, with France and India Calling Many of the Shots,” The Wall StreetJournal (January 31, 1992), pp. A1, A13; “Free Trade’s Fading Champion,”Economist (April 11, 1992), p. 65; Davis and Lawrence Ingrassia, “TradeAcceptance: After Years of Talks, GATT Is at Last Ready to Sign Off On aPact,” The Wall Street Journal (December 15, 1993), pp. A1, A7.and relatively high receptivity to innovations and new ideas both in consumer and industrialproducts. The United States is home to more global industry leaders than any other nation in theworld. For example, U.S. companies are the dominant producers in the computer, software, aerospace,entertainment, medical equipment, and jet engine industry sectors.Global Marketing, Sixth Edition, by Warren J. Keegan and Mark C. Green. Copyright © 2011 by Warren J. Keegan. Published by Prentice Hall.
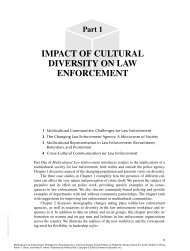
80 PART 2 • THE GLOBAL MARKETING ENVIRONMENTIn 1988, the United States and Canada signed a free trade agreement (U.S.-Canada Free TradeAgreement, or CFTA); the Canada-U.S. Free Trade Area formally came into existence in 1989.This helps explain the fact that more than $400 billion per year in goods and services flowsbetween Canada and the United States, the biggest trading relationship between any two singlenations. Canada takes 20 percent of U.S. exports and the United States buys approximately85 percent of Canada’s exports. Figure 3-1 illustrates the economic integration of North America:Canada is the number one trading partner of the United States, Mexico is second, and China ranksthird. American companies have more invested in Canada than in any other country. Many U.S.manufacturers, including GE and IBM, use their Canadian operations as major global suppliers forsome product lines. By participating in the Canadian auto market, U.S. automakers gain greatereconomies of scale. The CFTA, which was fully implemented when all duties were eliminatedeffective January 1998, is creating a true continental market for most other products.In 1992, representatives from the United States, Canada, and Mexico concluded negotiationsfor the North American Free Trade Agreement (NAFTA). The agreement was approved by bothhouses of the U.S. Congress and became effective on January 1, 1994. The result is a free tradearea with a combined population of roughly 430 million and a total GNI of almost $14 trillion (seeTable 3-4 and Figure 3-2).Why does NAFTA create a free trade area as opposed to a customs union or a commonmarket? The governments of all three nations pledge to promote economic growth through tariffFIGURE 3-1U.S. Trade Partners2008Source: U.S. Bureau of theCensus, www.census.gov.CanadaMexicoChinaJapanGermanyUnited KingdomNetherlandsSouth KoreaBrazilFranceTotal U.S. 2008 Goods Exports $1.27 trillion261.4151.571.566.654.753.840.234.832.929.2ChinaCanadaMexicoJapanGermanyUnited Kingdom0 100 200 300 400Billions of dollarsTotal U.S. 2008 Goods Imports $2.1 trillion337.8335.6215.9139.297.658.6Saudi ArabiaVenezuelaSouth KoreaFrance54.851.448.1440 100 200 300 400Billions of dollars000200010270740623Global Marketing, Sixth Edition, by Warren J. Keegan and Mark C. Green. Copyright © 2011 by Warren J. Keegan. Published by Prentice Hall.
CHAPTER 3 • REGIONAL MARKET CHARACTERISTICS AND PREFERENTIAL TRADE AGREEMENTS 81TABLE 3-4 NAFTA Income and Population2006 GNI(in millions)2006 Population(in thousands)2006GNI per CapitaUnited States $13,386,875 299,398 $44,710Canada 1,196,626 32,649 36,650Mexico 815,841 104,221 7,830Total/Mean GNI per capita $15,399,342 436,268 $35,298**Indicates meanSource: Reprinted by permission of Warren Keegan Associates, Inc.elimination and expanded trade and investment. At present, however, there are no commonexternal tariffs nor have restrictions on labor and other factor movements been eliminated. Theissue of illegal immigration from Mexico into the United States remains a contentious one. Thebenefits of continental free trade will enable all three countries to meet the economic challengesof the decades to come. The gradual elimination of barriers to the flow of goods, services, andinvestment, coupled with strong protection of intellectual property rights (patents, trademarks,and copyrights), will further benefit businesses, workers, farmers, and consumers.The agreement does leave the door open for discretionary protectionism, however. For example,California avocado growers won government protection for a market worth $250 million; Mexicanavocado growers can only ship their fruit to the United States during the winter months, and only tostates in the northeast. Moreover, Mexican avocados are subject to quotas so only $30 million worthof avocados reach the United States each year. Mexican farmer Ricardo Salgado complained, “TheCalifornia growers want to control all of the supply—that way they get the best prices. We’d love tohave a bigger selling season, but right now we have to wait for the U.S. Congress to give us permission.”3 Mexico engages in some protectionism of its own; for example, in 2003, a 98.8 percent tariffwas imposed on chicken leg quarters beyond the first 50,000 metric tons imported. In addition,Mexico imposed a 46.6 percent tariff on red and golden delicious apples.FIGURE 3-2Map of NAFTACountriesCanadaUnited StatesMexico0002000102707406233 Joel Millman, “Bitter Fruit: Spats Persist Despite NAFTA,” The Wall Street Journal (June 19, 2000), p. A23.Global Marketing, Sixth Edition, by Warren J. Keegan and Mark C. Green. Copyright © 2011 by Warren J. Keegan. Published by Prentice Hall.
82 PART 2 • THE GLOBAL MARKETING ENVIRONMENTCULTURE WATCHThe United States and CanadaThe United States and Canada are bound together by manythings, including a trade agreement, a shared border, and acommon language. Still, the two nations do not always see eyeto-eye,as evidenced by various trade-related issues that havearisen in recent years. Take, for example, U.S. exports of itemsrelated to popular culture. On one side is the American entertainmentindustry. Exports of music, print publications, televisionshows, and Hollywood movies all contribute to the U.S. tradesurplus in services. In Canada, policymakers, arts organizations,and cultural activists point with concern to statistics indicatingthat 95 percent of the movies shown in theaters are notCanadian and that 84 percent of the recorded music thatCanadians buy is foreign.Competition is one facet of the issue; Canadians fear thattheir own national industries will not be able to survive the globaljuggernaut originating south of the border. Canadians are alsoconcerned about cultural preservation. In the late 1990s, Arthur C.Eggleton, Canada’s minister for international trade, said, “There isa very strong dominance in the cultural industries of the Canadianmarketplace by the United States. We come at this from the pointof preserving culture and identity, while the U.S. comes at it fromthe standpoint of wanting to do business in our country.”Since the 1960s, Canada has enacted various pieces of legislationthat restrict foreign ownership in the book publishing,telecommunications, and broadcasting industries. There are alsoregulations governing the percentage of Canadian programmingthat is broadcast by radio and television stations. In the negotiationsleading to NAFTA, Canada was successful in excluding cultureindustries from the liberalized trade and investment framework.The issue came to a head in 1995, when Canada’s Parliamentimposed an 80 percent excise tax on advertising in the Canadianedition of Time Warner’s Sport’s Illustrated. The dispute focused onsplit-run magazines, in which the U.S. and Canadian editions arevirtually identical in terms of editorial content but carry differentadvertising. Canadian publishers complained that Time Warner andother U.S. media companies possessed the resources to dominateCanadian culture. The United States took the matter to the WorldTrade Organization; a trade panel ruled that Canada’s actionsviolated international trade agreements. After the initial ruling wasissued, Canada filed an appeal but did not receive a favorableruling. The U.S. trade representative Charlene Barshefsky hailed thedecision, saying it “makes clear WTO rules prevent governmentfrom using ‘culture’ as a pretense for discriminating againstimports.”Despite the WTO’s ruling in this case, France and othernations share Canada’s concerns. OECD member nations haveconducted meetings to discuss a multilateral agreement oninvestment (MAI) that would eliminate barriers to foreign investment;France, Canada, and other nations are seeking to excludecultural industries from the pact. In 1998, Canada convened aconference of 20 culture ministers in Ottawa in the hope of draftinga trade agreement that would ensure that culture industriesreceived special treatment in trade rules. The agreement would benegotiated in Geneva at the World Trade Organization. SheilaCopps, Canadian heritage minister and host of the meeting, saidattendees had agreed to establish a permanent network. In thefuture, she said, steps would be taken so that “culture is nottreated simply like every other commodity.” Copps also notedthat the United States was not invited to take part in the conferencebecause it does not have a culture minister.Sources: Roger Ricklefs, “Canada Fights to Fend Off American Tastesand Tunes,” The Wall Street Journal (September 24, 1998), pp. B1, B8;Anthony DePalma, “Happy 4th of July, Canada!” The New York Times(July 5, 1998), p. 3; Rosanna Tamburri, “Canada to Promote Pact to CurbU.S.’s Cultural Exports,” The Wall Street Journal (June 29, 1998), p. B5;Tamburri, “Canada Considers New Stand Against American Culture,”The Wall Street Journal (February 4, 1998), p. A18; Bernard Simon,“Canada Scrambles to Protect Magazines,” Financial Times (July 2,1997), p. 6; John Urquhart, “Canada Appealing Panel Ruling BackingU.S. Complaints on Magazines,” The Wall Street Journal (March 17,1997), p. B8; Anthony DePalma, “Trade vs. Cultural Identity in Canada,”The New York Times (October 7, 1996), p. D9.LATIN AMERICA: SICA, ANDEAN COMMUNITY, MERCOSUR,CARICOMLatin America includes the Caribbean and Central and South America (because of NAFTA,Mexico is grouped with North America). The allure of the Latin American market has been itsconsiderable size and huge resource base. After a decade of no growth, crippling inflation,increasing foreign debt, protectionism, and bloated government payrolls, the countries of LatinAmerica have begun the process of economic transformation. Balanced budgets are a priorityand privatization is underway. Free markets, open economies, and deregulation have begunto replace the policies of the past. In many countries, tariffs that sometimes reached as much as100 percent or more have been lowered to 10 to 20 percent.000200010270740623Global Marketing, Sixth Edition, by Warren J. Keegan and Mark C. Green. Copyright © 2011 by Warren J. Keegan. Published by Prentice Hall.
CHAPTER 3 • REGIONAL MARKET CHARACTERISTICS AND PREFERENTIAL TRADE AGREEMENTS 83With the exception of Cuba, most elected governments in Latin America are democratic.However, there is widespread skepticism about the benefits of participating fully in the globaleconomy. As left-leaning politicians such as Venezuela’s President Hugo Chávez become morepopular, concern is growing that free-market forces may lose momentum in the region. Globalcorporations are watching developments closely. They are encouraged by import liberalization,the prospects for lower tariffs within subregional trading groups, and the potential for establishingmore efficient regional production. Many observers envision a free trade area throughout thehemisphere. The four most important preferential trading arrangements in Latin America are theCentral American Integration System (SICA), the Andean Community, the Common Market ofthe South (Mercosur), and the Caribbean Community and Common Market (CARICOM).Central American Integration SystemCentral America is trying to revive its common market, which was set up in the early 1960s. Thefive original members—El Salvador, Honduras, Guatemala, Nicaragua, and Costa Rica—decided in July 1991 to reestablish the Central American Common Market (CACM). Efforts toimprove regional integration gained momentum with the granting of observer status to Panama.In 1997, with Panama as a member, the group’s name was changed to the Central AmericanIntegration System (Sistema de la Integración Centroamericana or SICA; see Figure 3-3).Table 3-5 shows the income and population data in the region.The Secretariat for Central American Economic Integration, headquartered in GuatemalaCity, helps to coordinate the progress toward a true Central American common market. Commonrules of origin were also adopted, allowing for freer movement of goods among SICA countries.SICA countries agreed to conform to a common external tariff (CET) of 5 to 20 percent for mostgoods by the mid-1990s; many tariffs had previously exceeded 100 percent. Starting in 2000,import duties converged to a range of 0 to 15 percent.Implementation of the Central American Free Trade Agreement with the United Statescreated a free trade area known as DR-CAFTA that includes five SICA members (El Salvador,Honduras, Guatemala, Nicaragua, and Costa Rica; Panama is excluded) plus the DominicanRepublic. Implementation has been slow but some changes have already taken effect. Forexample, 80 percent of U.S. goods and more than half of U.S. agriculture products can now beimported into Central America on a duty-free basis. Benefits to Central American companiesinclude a streamlining of export paper work and the adoption of an online application process.The region will attract more direct foreign investment as foreign companies see reduced riskFIGURE 3-3Map of SICACountriesHonduras000200010270740623GuatemalaEl SalvadorCosta RicaNicaraguaPanamaGlobal Marketing, Sixth Edition, by Warren J. Keegan and Mark C. Green. Copyright © 2011 by Warren J. Keegan. Published by Prentice Hall.
84 PART 2 • THE GLOBAL MARKETING ENVIRONMENTTABLE 3-5 SICA Income and Population2006 GNI(in millions)2006 Population(in thousands)2006 GNIper CapitaCosta Rica $21,894 4,399 $4,980El Salvador 18,096 6,762 2,680Guatemala 33,725 13,029 2,590Honduras 8,844 6,969 1,270Nicaragua 5,163 5,532 930Panama 16,442 3,288 5,000Total/Mean GNI per capita $104,164 39,979 $2,605**Indicates meanSource: Reprinted by permission of Warren Keegan Associates, Inc.thanks to clearer rules. In addition, a significant number of companies in Central Americaoperated in the “shadow economy” with many commercial transactions going unreported.Government tax revenues should increase as companies join the formal economy to take advantageof CAFTA’s benefits. 4Despite progress, attempts to achieve integration in Central America have been described asuncoordinated, inefficient, and costly. There are still tariffs on imports of products—sugar,coffee, and alcoholic beverages, for example—that are also produced in the importing country.As one Guatemalan analyst remarked, “Only when I see Salvadoran beer on sale in Guatemalaand Guatemalan beer on sale in El Salvador will I believe that trade liberalization and integrationis a reality.” 5Andean CommunityThe Andean Community (Comunidad Andina de Naciones or CAN; see Figure 3-4 and Table 3-6)was formed in 1969 to accelerate the development of member states Bolivia, Colombia, Ecuador,Peru, and Venezuela through economic and social integration. Members agreed to lower tariffs onintragroup trade and to work together to decide what products each country should produce. At thesame time, foreign goods and companies were kept out as much as possible. One Boliviandescribed the unfortunate result of this lack of competition in the following way: “We had agreed,‘You buy our overpriced goods and we’ll buy yours.’” 6In 1988, the group members decided to get a fresh start. Beginning in 1992, the AndeanPact signatories agreed to form Latin America’s first operating subregional free trade area. Thepact abolished all foreign exchange, financial and fiscal incentives, and export subsidies atthe end of 1992. Common external tariffs were established, marking the transition to a truecustoms union. Overall, the region’s rural residents and urban poor have become frustrated andimpatient with the lack of progress. As one Andean scholar put it, “After 10 or 15 years ofoperating with free-market policies, paradise hasn’t come. People start wondering if the gospelwas as good as advertised.” 7Within the Andean group members, individual country situations vary. Ecuador, forexample, has experienced years of economic and political instability. In 2000, in an attempt tobring rampant inflation under control, the government adopted the U.S. dollar as Ecuador’sofficial currency.Venezuela is reaping the rewards of booming demand for oil; oil revenues account for75 percent of its exports. President Hugo Chávez is a self-proclaimed revolutionary firebrand;4 Adam Thomson, “Trade Deal Has Hidden Qualities,” Financial Times Special Report: Central America Finance &Investment (September 19, 2008), p. 3.5 Johanna Tuckman, “Central Americans Start to Act Together,” Financial Times (July 9, 1997), p. 4.6 “NAFTA Is Not Alone,” The Economist (June 18, 1994), pp. 47–48.7 Marc Lifsher, “The Andean Arc of Instability,” The Wall Street Journal (February 24, 2003), p. A13.000200010270740623Global Marketing, Sixth Edition, by Warren J. Keegan and Mark C. Green. Copyright © 2011 by Warren J. Keegan. Published by Prentice Hall.
CHAPTER 3 • REGIONAL MARKET CHARACTERISTICS AND PREFERENTIAL TRADE AGREEMENTS 85EcuadorColombiaVenezuelaFIGURE 3-4Map of AndeanCommunity andMERCOSURPeruBrazilBoliviaParaguayChileArgentinaUruguayAndean Groupand MercosurMercosurAndean GroupTABLE 3-6 Andean Community Income and Population2006 GNI(in millions)2006 Population(in thousands)2006 GNIper CapitaBolivia $10,293 9,354 $1,100Colombia 141,982 45,558 3,120Ecuador 38,481 13,202 2,910Peru 82,201 27,589 2,980Venezuela 163,959 27,021 6,070Total/Mean GNP per capita $436,916 122,724 $3,560**Indicates meanSource: Reprinted by permission of Warren Keegan Associates, Inc.000200010270740623after being elected in 1998, he proclaimed that his vision for Ecuador is “socialism for thetwenty-first century.” Even so, there are significant market opportunities for global companies.General Motors produces vehicles at a plant in Valencia; even running three shifts per day, it isunable to meet demand. Procter & Gamble’s Latin American headquarters are located inCaracas. Other global companies with operations in Venezuela include Cargill, Chevron, ExxonMobil, Ford, Kellogg, 3M, and Toyota. 88 David J. Lynch, “Venezuelan Consumers Gobble Up U.S. Goods,” USA Today (March 28, 2007), pp. 1B, 2B.Global Marketing, Sixth Edition, by Warren J. Keegan and Mark C. Green. Copyright © 2011 by Warren J. Keegan. Published by Prentice Hall.
86 PART 2 • THE GLOBAL MARKETING ENVIRONMENTCommon Market of the South (Mercosur)March 2006 marked the fifteenth anniversary of the signing of the Asunción Treaty. The treatysignified the agreement by the governments of Argentina, Brazil, Paraguay, and Uruguay to formthe Common Market of the South (Mercado Común del Sur or Mercosur; see Figure 3-4 andTable 3-7). The four countries agreed to begin phasing in tariff reform on January 1, 1995.Internal tariffs were eliminated, and CETs of 20 percent or less were established. In theory,goods, services, and factors of production will ultimately move freely throughout the membercountries; until this goal is achieved, however, Mercosur will actually operate as a customs unionrather than a true common market. Today, about 90 percent of goods are traded freely; however,individual members of Mercosur can change both internal and external tariffs when it suits therespective government.Much depends on the successful outcome of this experiment in regional cooperation. Theearly signs were positive, as trade between the four full member nations grew dramaticallyduring the 1990s. The region has experienced a series of financial crises; for example, Brazil’scurrency was devalued in 1995 and again in 1999.Argentina provides a case study in how a country can emerge from an economic crisis as astronger global competitor. Argentina’s economy minister responded to the financial crisis of2001–2002 by implementing emergency measures that included a 29 percent currency devaluationfor exports and capital transactions. Argentina was allowed to break from the CET andraise duties on consumer goods. The crisis had a silver lining: virtually overnight, Argentina’swine exports to the United States were worth four times more when dollar revenues were convertedinto pesos. The currency devaluation also makes Argentine vineyard property cheaperfor foreign buyers. Low prices for land, inexpensive labor, and ideal growing conditions for theMalbec grape have combined to make Argentina’s wine industry a major player in world markets.As one winemaker noted, “You can make better wine here for less money than anywherein the world.” A new challenge looms, however; the dollar’s weakness relative to the euromeans that winemakers are paying 25 percent more for oak aging barrels imported fromFrance. 9The trade agreement landscape in the region continues to evolve. In 1996, Chile becamean associate member of Mercosur. Policymakers opted against full membership because Chilealready had lower external tariffs than the rest of Mercosur; ironically, full membership wouldhave required raising them. (In other words, Chile participates in the free trade area aspect ofTABLE 3-7 Mercosur Income and Population2006 GNI(in millions)2006 Population(in thousands)2006 GNIper CapitaArgentina $201,347 39,134 $5,150Bolivia* 10,293 9,354 1,100Brazil 892,639 189,323 4,710Chile* 111,869 16,433 6,810Ecuador* 38,481 13,202 2,910Paraguay 6,016 8,461 1,410Peru* 82,201 27,589 2,980Uruguay 17,591 3,314 5,310Venezuela 163,959 27,021 6,070Total/Mean GNI per capita** $1,524,396 333,831 $4,050***Associate members that participate in free trade area only**Indicates meanSource: Reprinted by permission of Warren Keegan Associates, Inc.9 David J. Lynch, “Golden Days for Argentine Wine Could Turn a Bit Cloudy,” USA Today (November 16, 2007), pp. 1B, 2B.000200010270740623Global Marketing, Sixth Edition, by Warren J. Keegan and Mark C. Green. Copyright © 2011 by Warren J. Keegan. Published by Prentice Hall.
CHAPTER 3 • REGIONAL MARKET CHARACTERISTICS AND PREFERENTIAL TRADE AGREEMENTS 87BrazilAs the figures in Table 3-7 clearly show, Brazil is an economicpowerhouse in South America. Brazil has the largestgeographical territory and the largest population in the region.Between 1994 and 2004, Brazil’s exports grew at an annual rateof 8.78 percent; rapid economic growth has given policymakers,including President Lúiz Inácio Lula da Silva, a greater presenceon the global stage and more clout at global trade talks.One symbol of Brazil’s new role in the global economy:Embraer, a jet aircraft manufacturer (see Exhibit 3-3). Specializingin regional jets that seat fewer than 100 passengers, Embraer haswon orders from JetBlue, Air Canada, Saudi Arabian Airlines, andother carriers. Embraer shared the cost of developing new modelssuch as the E-170/175 with more than one dozen partners,including General Electric and Honeywell. In order to sell moreregional jets to China, Embraer has also established a $50 millionjoint venture with China Aviation Industry Corporation.Brazil’s agricultural sector is also a leading exporter. Brazil isthe world’s number one exporter of beef, coffee, orange juice(check the label on your orange juice carton), and sugar. Brazil israpidly gaining a reputation as a producer of sugar-basedethanol, which can serve as a sustainable substitute for expensivegasoline. Industry observers expect Brazil to double its sugar caneprocessing capacity by 2010. As Ermor Zambello, manager of theGrupo Farias sugar mill, notes, “Globalization has made us thinkmore about foreign markets. Now, we have more of a global outlook,and we are concerned about global production.”The central issue in the Doha Round is agriculture. Brazil andIndia are taking the lead of a so-called Group of 20 developingnations calling for agricultural sector reform. For example, theaverage tariff on Brazil’s exports to the 30 OECD nations is 27 percent.Government subsidies are also a key issue. In the EU, governmentspending accounts for about one-third of gross farmreceipts; in the United States, the government provides about onequarterof gross farm receipts. By contrast, Brazil’s spending onfarm support amounts to only about 3 percent of farm receipts.Moving forward, Brazil faces a number of other challenges.Steady appreciation of Brazil’s currency, the real, may requireexporters to raise prices. Embraer faces tough competition fromCanada’s Bombardier. The country’s infrastructure remainswoefully underdeveloped; significant investment is required toimprove highways, railroads, and ports. Businesspeople speakof “the Brazil cost,” a phrase that refers to delays related toexcessive red tape. Trade with China is presenting both opportunitiesand threats. From 1995 to 2005, Brazil’s total two-waytrade with China increased from $2.2 billion to $12.2 billion.China’s explosive economic growth has created great demandfor iron ore and other Brazilian commodity exports. However,Brazilian manufacturers in light-industry sectors such as toys,eyeglasses, and footwear are facing increased competition fromlow-priced Chinese imports.Sources: Antonia Regalado, “Soccer, Samba, and Outsourcing?” TheWall Street Journal (January 25, 2007), pp. B1, B8; David J. Lynch,“Brazil Hopes to Build On Its Ethanol Success,” USA Today (March 29,2006), pp. 1B, 2B; Lynch, “China’s Growing Pull Puts Brazil in a Bind,”USA Today (March 21, 2006), pp. 1B, 2B; Lynch, “Comeback KidEmbraer Has Hot New Jet, and Fiery CEO to Match,” USA Today (March 7,2006), pp. 1B, 2B; Lynch, “Brazil’s Agricultural Exports Cast LongShadow,” USA Today (March 10, 2006), pp. 1B, 2B.Exhibit 3-3: Embraer isthe world’s fourth-largestaircraft manufacturer;however, in the regionalaircraft sector, Embraer issecond only to Canada’sBombardier.Source: Alexandre Meneghini/AP Wide World Photos.000200010270740623Global Marketing, Sixth Edition, by Warren J. Keegan and Mark C. Green. Copyright © 2011 by Warren J. Keegan. Published by Prentice Hall.
88 PART 2 • THE GLOBAL MARKETING ENVIRONMENTMercosur, not the customs union.) Chile’s export-driven success makes it a role model forthe rest of Latin America as well as Central and Eastern Europe. In 2004 Mercosur signed acooperation agreement with the Andean Community; as a result, Bolivia, Colombia, Ecuador,and Peru have also become associate members. Venezuela became a full Mercosur member in2006. The EU is Mercosur’s number one trading partner; Mercosur has signed an agreementwith the EU to establish a free trade area. Germany and France are opposed to such an agreementon the grounds that low-cost agricultural exports from South America will harm farmersin Europe.Caribbean Community and Common Market (CARICOM)CARICOM was formed in 1973 as a movement toward unity in the Caribbean. It replaced theCaribbean Free Trade Association (CARIFTA) founded in 1965. The members are Antigua andBarbuda, Bahamas, Barbados, Belize, Dominica, Grenada, Guyana, Haiti, Jamaica, Montserrat,St. Kitts and Nevis, St. Lucia, St. Vincent and the Grenadines, Suriname, and Trinidadand Tobago. The population of the entire 15-member CARICOM is about 15 million; disparatelevels of economic development can be seen by comparing GNI per capita in Dominica andGrenada with that of Haiti (see Table 3-8).To date, CARICOM’s main objective has been to achieve a deepening of economic integrationby means of a Caribbean common market. However, CARICOM was largely stagnant during its firsttwo decades of existence. At its annual meeting in July 1991, member countries agreed to speedintegration; a customs union was established with common external tariffs. At the 1998 summitmeeting, leaders from the 15 countries agreed to move quickly to establish an economic union witha common currency. A recent study of the issue has suggested, however, that the limited extent ofintraregional trade would limit the potential gains from lower transaction costs. 10TABLE 3-8 CARICOM Income and Population2006 GNI(in millions)2006 Population(in thousands)2006 GNIper CapitaAntigua and Barbuda $929 84 $11,050Bahamas 4,684 327 15,100Barbados na 293 naBelize 1,114 298 3,740Dominica 262 72 3,670Grenada 397 108 3,750Guyana 849 739 1,150Haiti 4,044 9,446 430Jamaica 9,504 2,667 3,560Montserrat na na naSt. Kitts and Nevis 326 48 6,980St. Lucia 684 166 4,180St. Vincent and Grenadines 403 120 3,400Suriname 1,918 455 4,210Trinidad and Tobago 16,612 1,328 12,500Total/Mean GNI per capita $33,788 15,006 $2,293* , a*Indicates meana Excludes Barbados and MontserratSource: Reprinted by permission of Warren Keegan Associates, Inc.10 Myrvin L. Anthony and Andrew Hughes Hallett, “Is the Case for Economic and Monetary Union in the CaribbeanRealistic?” World Economy 23, no. 1 (January 2000), pp. 119–144.000200010270740623Global Marketing, Sixth Edition, by Warren J. Keegan and Mark C. Green. Copyright © 2011 by Warren J. Keegan. Published by Prentice Hall.
CHAPTER 3 • REGIONAL MARKET CHARACTERISTICS AND PREFERENTIAL TRADE AGREEMENTS 89If the original 1973 treaty were revised, CARICOM nations could qualify for membership ina proposed Free Trade Area of the Americas (FTAA). As Owen Arthur, then prime minister ofBarbados, explained, “The old treaty limited the movement of capital, skills, and business in theregion. The treaty has to be changed so that regional trade policy can be widened to deal with theFTAA and the EU, and such matters as bilateral investments treaties, intellectual property rights,and trade in services.” 11The English-speaking CARICOM members in the eastern Caribbean are also concernedwith defending their privileged trading position with the United States. That status dates tothe Caribbean Basin Initiative (CBI) of 1984, which promoted export production of certainproducts by providing duty-free U.S. market access to 20 countries, including members ofCARICOM. Recently, CBI members requested that the CBI be expanded. The CaribbeanBasin Trade Partnership Act, which went into effect on October 1, 2000, exempts textile andapparel exports from the Caribbean to the United States from duties and tariffs. CARICOM isshown in Figure 3-5.Current Trade-Related IssuesOne of the biggest trade-related issues in the Western Hemisphere is the creation of a FreeTrade Area of the Americas (FTAA). However, leaders in several Latin American countries—Brazil in particular—are frustrated by Washington’s tendency to dictate trade terms that willbenefit special interests in the United States. For example, a bipartisan coalition of U.S.policymakers favors the inclusion of labor and other non-trade-related requirements in tradetreaties such as the FTAA. Labor law enforcement was included in the texts of the free tradeagreements that the United States signed with Jordan and Morocco. However, BrazilianPresident Luiz Icácio Lula da Silva and other Latin American leaders are opposed to includinglabor standards in the FTAA. Now Brazil and its Mercosur partners are advocating aslower, three-stage approach to negotiations with the United States. The first stage wouldinclude discussions on business facilitation issues such as standardized customs forms andindustry deregulation; the second would focus on dispute settlement and rules of origin; andthe third would focus on tariffs. Meanwhile, as previously noted, Mercosur, CARICOM,SICA, and the Andean Community are taking steps toward further intra-regional integrationand also aligning with Europe.BahamasAtlanticOceanCARICOM (Caribbean Communityand Common Market)Member countries730 km450 miFIGURE 3-5CARICOMBelizeJamaicaC a ri b bHaitie an Se aAntigua andSt. Kitts-NevisBarbudaMontserratDominicaSt. VincentGrenadaSt. LuciaBarbadosTrinidad andTobago000200010270740623PacificOceanSouth AmericaGuyanaSuriname11 Canute James, “Caribbean Community Grapples with Challenge of Creating a Single Market,” Financial Times(July 10, 1998), p. 7.Global Marketing, Sixth Edition, by Warren J. Keegan and Mark C. Green. Copyright © 2011 by Warren J. Keegan. Published by Prentice Hall.
90 PART 2 • THE GLOBAL MARKETING ENVIRONMENTASIA-PACIFIC: THE ASSOCIATION OF SOUTHEASTASIAN NATIONS (ASEAN)The Association of Southeast Asian Nations (ASEAN) was established in 1967 as an organizationfor economic, political, social, and cultural cooperation among its member countries.Brunei, Indonesia, Malaysia, the Philippines, Singapore, and Thailand were the originalsix members. Vietnam became the first Communist nation in the group when it was admitted toASEAN in July 1995. Cambodia and Laos were admitted at the organization’s thirtieth anniversarymeeting in July 1997. Burma (known as Myanmar by the ruling military junta) joined in1998, following delays related to the country’s internal politics and human rights record (seeFigure 3-6 and Table 3-9).Individually and collectively, ASEAN countries are active in regional and global trade.ASEAN’s top trading partners include Japan ($161.8 billion in total 2006 trade), the UnitedStates ($161.2 billion in total 2006 trade), the EU ($160.6 billion in total 2006 trade), and China($140 billion in total 2006 trade). A few years ago, ASEAN officials realized that broad commongoals were not enough to keep the association alive. A constant problem was the strict need forconsensus among all members before proceeding with any form of cooperative effort. Althoughthe ASEAN member countries are geographically close, they have historically been divided inmany respects. In 1994, economic ministers from the member nations agreed to implement anASEAN Free Trade Area (AFTA); recent progress at reducing intra-regional tariff reductionsmeans that the free trade area has finally become a reality.Recently, Japan, China, and Korea were informally added to the member roster; someobservers called this configuration “ASEAN plus three.” When the roster expanded again toinclude Australia, New Zealand, and India, it was dubbed “ASEAN plus six.” The latter is workingto establish an East Asian Community, with the first step being the establishment of an EastAsian Free Trade Area. 12 Although China’s participation has met with some opposition, China’sdynamic growth and increasing power in the region required a response. As ASEAN SecretaryGeneral Rodolfo Severino noted, “You can either close yourself off from China and crouch inFIGURE 3-6Map of ASEANMyanmarLaosAsiaThailandASEAN (Assoc. of SoutheastAsian Nations)Member countries970 km600 miCambodiaVietnamPhilippinesSouthChinaSeaPacificOceanMalaysiaBruneiSingaporeIndonesia12 Bernard Gordon, “The FTA Fetish,” The Wall Street Journal (November 17, 2005), p. A16.000200010270740623Global Marketing, Sixth Edition, by Warren J. Keegan and Mark C. Green. Copyright © 2011 by Warren J. Keegan. Published by Prentice Hall.
CHAPTER 3 • REGIONAL MARKET CHARACTERISTICS AND PREFERENTIAL TRADE AGREEMENTS 91TABLE 3-9 ASEAN Income and Population2006 GNI(in millions)2006 Population(in thousands)2006 GNIper CapitaBrunei na 366 naCambodia $6,990 14,197 $490Indonesia 315,845 223,042 1,420Laos 2,279 5,792 390Malaysia 146,754 26,114 5,620Myanmar na 48,379 naPhilippines 120,190 86,264 1,390Singapore 128,816 4,484 28,730Thailand 193,734 63,444 3,050Vietnam 58,506 84,108 700Total/Mean GNI per capita $770,756 a 544,155 $1,561* , a*Indicates meana Excluding Brunei and MyanmarSource: Reprinted by permission of Warren Keegan Associates, Inc.fear or engage more closely. Although some industries will get hurt, the overall impact on bothChina and ASEAN would be beneficial.” 13Singapore represents a special case among the ASEAN nations. In fewer than three decades,Singapore transformed itself from a British colony to a vibrant, 240-square-mile industrialpower. Singapore has an extremely efficient infrastructure—the Port of Singapore is the world’ssecond-largest container port (Hong Kong’s ranks first)—and a standard of living second in theregion only to Japan. Singapore’s 4.2 million citizens have played a critical role in the country’seconomic achievements by readily accepting the notion that “the country with the mostknowledge will win” in global competition. Excellent training programs and a 93 percent literacyrate help explain why Singapore has more engineers per capita than the United States.Singapore’s Economic Development Board has also actively recruited business interest in thenation. The manufacturing companies that have been attracted to Singapore read like a who’swho of global marketing and include Hewlett-Packard, IBM, Philips, and Apple; in all, morethan 3,000 companies have operations or investments in Singapore.Singapore alone accounts for more than one-third of U.S. trading activities with ASEANcountries; U.S. exports to Singapore in 2007 totaled $26.2 billion, while imports totaled$18.3 billion. Singapore is closely tied with its neighbors; more than 32 percent of imports arere-exported to other Asian countries. Singapore’s efforts to fashion a civil society have gainedthe country some notoriety; crime is nearly nonexistent, thanks to the long-ruling People’sAction Party’s severe treatment of criminals.Marketing Issues in the Asia-Pacific Region000200010270740623Mastering the Japanese market takes flexibility, ambition, and a long-term commitment. Japan haschanged from being a closed market to one that’s just tough. There are barriers in Japan in terms ofattitudes as well as laws. Any organization wishing to compete in Japan must be committed toproviding top-quality products and services. In many cases, products and marketing must betailored to local tastes. Repeat visits and extended socializing with distributors are necessary tobuild trust. Marketers must also master the keiretsu system of tightly knit corporate alliances.On the lighter side, it is worth noting that many consumer packaged goods marketed inJapan—including items that are not imported—have English, French, or German on the labels tosuggest a cosmopolitan image and Western look. A Westerner may wonder, however, whatthe actual communication task is. For example, the label of City Original Coffee proclaims “Ease13 Amy Kazmin, “ASEAN and China Sign Deal for Free Trade Area,” Financial Times (November 5, 2002), p. 6.Global Marketing, Sixth Edition, by Warren J. Keegan and Mark C. Green. Copyright © 2011 by Warren J. Keegan. Published by Prentice Hall.
92 PART 2 • THE GLOBAL MARKETING ENVIRONMENTYour Bosoms. This coffee has carefully selected high quality beans and roasted by our all theexperience.” The intended message: Drinking our coffee provides a relaxing break and “takes aload off your chest.” Casual wear and sports apparel are also emblazoned with fracturedmessages. Japanese retailers do not seem at all concerned that the messages are syntacticallysuspect. As one shopkeeper explained, the point is that a message in English, French, or Germancan convey hipness and help sell a product. “I don’t expect people to read it,” she said. 14WESTERN, CENTRAL, AND EASTERN EUROPEThe countries of Western Europe are among the most prosperous in the world. Despite the factthat there are significant differences in income between the north and the south and obviousdifferences in language and culture, the once-varied societies of Western Europe have grownremarkably alike. Still, enough differences remain that many observers view Western Europe interms of three tiers. Many Britons view themselves as somewhat apart from the rest of the continent;Euro-skepticism is widespread, and the country still has problems seeing eye-to-eye withhistoric rivals Germany and France. Meanwhile, across the English Channel, Portugal, Italy,Greece, and Spain have struggled mightily to overcome the stigma of being called “Club Med”nations and other derogatory nicknames by their northern neighbors. 15 Still, as they enter the firstdecade of the twenty-first century, the governments of Western Europe are achieving hithertounprecedented levels of economic integration.The European Union (EU)The origins of the European Union (EU) can be traced back to the 1958 Treaty of Rome. The sixoriginal members of the European Community (EC), as the group was called then, were Belgium,France, Holland, Italy, Luxembourg, and West Germany. In 1973, Great Britain, Denmark, andIreland were admitted, followed by Greece in 1981, and Spain and Portugal in 1986. Beginning in1987, the 12 countries that were EC members set about the difficult task of creating a genuine singlemarket in goods, services, and capital; in other words, an economic union. Adopting the SingleEuropean Act by the end of 1992 was a major EC achievement; the Council of Ministers adoptedmore than 200 pieces of legislation and regulations to make the single market a reality.The objective of the EU member countries is to harmonize national laws and regulations sothat goods, services, people, and eventually money can flow freely across national boundaries.December 31, 1992, marked the dawn of the new economic era in Europe. Finland, Sweden, andAustria officially joined on January 1, 1995. (In November 1994, voters in Norway rejected amembership proposal.) Evidence that this is more than a free trade area, customs union, orcommon market is the fact that citizens of member countries are now able to freely cross borderswithin the union. The EU is encouraging the development of a community-wide labor pool; it isalso attempting to shake up Europe’s cartel mentality by handing down rules of competitionpatterned after U.S. antitrust law. Improvements to highway and rail networks are now beingcoordinated as well. Further EU enlargement is the big story in this region today. Cyprus, theCzech Republic, Estonia, Hungary, Poland, Latvia, Lithuania, Malta, the Slovak Republic, andSlovenia became full EU members on May 1, 2004. Bulgaria and Romania joined in 2007.Today, the 27 nations of the EU represent 490 million people and a combined GNI of nearly$15 trillion (see Table 3-10). The map in Figure 3-7 shows the EU member nations.During the two decades between 1979 and 1999, the European Monetary System (EMS) was animportant foundation of Western European commerce. The EMS was based on the Europeancurrency unit (ECU), a unit of account comprised of a hypothetical basket of “weighted” currencies.The ECU did not take the form of an actual currency; it existed physically in the form of checks andelectronically in computers. Some companies priced their raw materials and products in ECU,thereby saving the time and cost of exchange transactions. The 1991 Maastricht Treaty set the stagefor the transition from the EMS to an economic and monetary union (EMU) that includes a14 Howard W. French, “To Grandparents, English Word Trend Isn’t ’Naisu,’” The New York Times (October 23, 2002), p. A4.15 Thomas Kamm, “Snobbery: The Latest Hitch in Unifying Europe,” The Wall Street Journal (November 6, 1996),p. A17; Kyle Pope, “More Than Water Divides UK, Europe,” The Wall Street Journal (June 30, 1995), p. A12.000200010270740623Global Marketing, Sixth Edition, by Warren J. Keegan and Mark C. Green. Copyright © 2011 by Warren J. Keegan. Published by Prentice Hall.
CHAPTER 3 • REGIONAL MARKET CHARACTERISTICS AND PREFERENTIAL TRADE AGREEMENTS 93TABLE 3-10 The 27 Nations of the EU—Income and Population2006 GNI(in millions)2006 Population(in thousands)2006 GNIper CapitaAustria $329,183 8,281 $39,750Belgium 405,419 10,541 38,460Bulgaria 30,669 7,693 3,990Cyprus 17,948 771 23,270Czech Republic 131,404 10,270 12,790Denmark 283,316 5,437 52,110Estonia 15,302 1,342 11,400Finland 217,803 5,266 41,360France 2,306,714 61,257 36,560Germany 3,032,617 82,375 36,810Greece 305,308 11,147 27,390Hungary 109,461 10,067 10,870Ireland 191,315 4,268 44,830Italy 1,882,544 58,843 31,990Latvia 18,525 2,288 8,100Lithuania 26,917 3,395 7,930Luxembourg 32,904 462 71,240Malta 6,216 406 15,310Netherlands 703,484 16,340 43,050Poland 312,994 38,129 8,210Portugal 189,017 10,589 17,850Romania 104,382 21,590 4,830Slovak Republic 51,807 5,390 9,610Slovenia 37,445 2,007 18,660Spain 1,206,169 44,121 27,340Sweden 395,411 9,084 43,530United Kingdom 2,455,691 60,550 40,560Total/Mean GNI per capita $14,799,965 491,909 $30,087**Indicates meanSource: Reprinted by permission of Warren Keegan Associates, Inc.European central bank and a single European currency known as the euro. In May 1998, Austria,Belgium, Finland, Ireland, the Netherlands, France, Germany, Italy, Luxembourg, Portugal, andSpain were chosen as the 11 charter members of the euro zone.The single currency era, which officially began on January 1, 1999, has brought many benefitsto companies in the euro zone, such as eliminating costs associated with currency conversion andexchange rate uncertainty. The euro existed as a unit of account until January 1, 2002, when actualcoins and paper money were issued and national currencies such as the French franc were withdrawnfrom circulation. Greece joined in 2001; Slovenia became the thirteenth member on January 1, 2007.Cyrus and Malta joined in 2008, and Slovakia adopted the euro on January 1, 2009 (see Exhibit 3-4).000200010270740623Marketing Issues in the European UnionThe European Commission establishes directives and sets deadlines for their implementation bylegislation in individual nations. The business environment in Europe has undergone considerabletransformation since 1992, with significant implications for all elements of the marketing mix.Table 3-11 summarizes some of the marketing mix issues that must be addressed in Europe’s singlemarket. For example, harmonization means that content and other product standards that variedGlobal Marketing, Sixth Edition, by Warren J. Keegan and Mark C. Green. Copyright © 2011 by Warren J. Keegan. Published by Prentice Hall.
94 PART 2 • THE GLOBAL MARKETING ENVIRONMENTFIGURE 3-7MAP of EUTwelve newest membersSwedenFinlandUnitedKingdomEstoniaDenmarkLatviaIrelandNetherlandsLithuaniaCzech RepublicBelgiumGermanyPolandSlovakiaLuxembourgFranceAustriaHungaryRomaniaPortugalSpainItalySloveniaBulgariaGreeceMaltaCyprusExhibit 3-4: Fireworksexploded over the Danubeas Slovakia became thesixteenth member of theeuro zone on January 1,2009. Slovakia qualified formembership because thegovernment has keptinflation low and the budgetdeficit below 3 percentof GDP. Tiny Slovenia(population 2 million) joinedon January 1, 2007; Cyprusand Malta joined the eurozone in 2008.Source: Newscom.among nations have been brought into alignment. As a result, companies may have an opportunityto reap economies by cutting back on the number of product adaptations.Case Europe, for example, manufactures and markets farm machinery. When it introduced theMagnum tractor in Europe in 1988, it offered 17 different versions because of country regulationsregarding placement of lights and brakes. Thanks to harmonization, Case offers the current model,000200010270740623Global Marketing, Sixth Edition, by Warren J. Keegan and Mark C. Green. Copyright © 2011 by Warren J. Keegan. Published by Prentice Hall.
CHAPTER 3 • REGIONAL MARKET CHARACTERISTICS AND PREFERENTIAL TRADE AGREEMENTS 95TABLE 3-11 Marketing Strategies in the European UnionChanges Affecting StrategiesThreats to Marketers’PlanningManagement’sStrategic OptionsProductStrategiesPricingStrategiesPromotionStrategiesDistributionStrategiesHarmonization in productstandards, testing, andcertification processCommon patenting and brandingHarmonization in packaging,labeling, and processingrequirementsMore competitive environmentLifting of restrictions on foreignproductsAntimonopoly measuresOpening up of the publicprocurement marketCommon guidelines on TVbroadcastingDeregulation of nationalbroadcasting monopoliesUniform standards for TVcommercialsSimplification of transitdocuments and proceduresElimination of customsformalitiesIncorporating changesmandated by EC directivesComplying with rulesof originLocal content rulesDifferences in marketingresearchParallel importingDifferent taxationof goodsLess freedom in settingtransfer pricesRestrictions on alcoholand tobacco advertisingLimits on foreign TVproductionDifferences in permissiblepromotional techniquesIncrease in distributors’marginsLack of direct marketinginfrastructureRestrictions in the useof computer databasesConsolidate productionSeek marketing economiesShift from brand to benefit segmentationStandardize packaging and labelingwhere possibleExploit different excise and value-added taxesUnderstand price elasticity of consumer demandEmphasize high-margin productsIntroduce low-cost brandsCoordinate components of promotional mix viaintegrated marketing communications (IMC)Exploit advantage of pan-European mediaPosition products according to local marketpreferencesConsolidate manufacturing facilitiesCentralize distributionDevelop nontraditional channels(direct marketing, telemarketing)Source: Reprinted from Long Range Planning, Vol. 5, G. Guido, “Implementing a Pan-European Marketing Strategy,” p. 32, 1991,with permission from Elsevier.000200010270740623the Magnum MX, in one version. However, because different types of implements and trailers areused in different countries, the MX is available with different kinds of hitches. 16The advent of the euro on January 1, 1999, brought about more changes. Direct comparabilityof prices in the euro zone will force companies to review pricing policies. The marketingchallenge is to develop strategies to take advantage of opportunities in one of the largest,wealthiest, most stable markets in the world. Corporations must assess the extent to which theycan treat the region as one entity and how to change organizational policies and structures toadapt to and take advantage of a unified Europe.The music industry is a case in point; long before online music distribution and MP3 file swappinghad become issues, the major record companies faced a number of challenges. The single marketmeant that, for the first time, music retailers in Europe were allowed to buy CDs and tapes fromdistributors throughout the EU. This practice, known as transshipment, had not been permitted priorto the single market. Now, for example, a music retailer in Germany is no longer tied to a localsupplier in Germany if better prices are available elsewhere. The change means that EMI, Sony BMG,Universal Music Group, and Warner have been forced to adopt more uniform pricing policies acrossEurope. This, in turn, has required them to find ways to cut costs without compromising the need torespond quickly to consumer demand. One solution has been to realign distribution via joint venturesor other arrangements; previously, each company had maintained its own distribution system. In1998, however, Warner and Sony merged their distribution facilities in the United Kingdom. 1716 George Russel, “Marketing in the ‘Old Country’: The Diversity of Europe Presents Unique Challenges,” AgriMarketing 37, no. 1 (January 1999), p. 38.17 Jeff Clark-Meads, “The Year in Europe: Union Members Confront Parallel Imports and Universes,” Billboard 107(December 23, 1995), p. YE14; Alice Rawsthorn, “Music’s ‘Big Five’ Dip Toes in Common Distribution Pool,” FinancialTimes (August 14, 1998), p. 60.Global Marketing, Sixth Edition, by Warren J. Keegan and Mark C. Green. Copyright © 2011 by Warren J. Keegan. Published by Prentice Hall.
96 PART 2 • THE GLOBAL MARKETING ENVIRONMENTThe enlargement of the EU will further impact marketing strategies. For example, food safetylaws in the EU are different from those in some Central European countries. As a result, Coca-Cola had to delay launching its Powerade sports drink and other beverage products. Specifically,Polish and EU food law require the use of different ingredients. In addition to the harmonizationof laws, the very size of the expanded EU offers opportunities. For example, Procter & Gambleexecutives foresee that, in the event of shortages in a particular country, they will be able to shiftproducts from one market to another. A 27-nation EU also allows for more flexibility in the placementof factories. There will also be challenges. For example, South American banana growersnow face 75 percent tariffs on exports to the new EU countries; previously, tariffs on bananas werevirtually nonexistent. Also, because tariffs and quotas protect sugar production in the EU, bothconsumers and food producers such as Kraft will face rising costs. 18Because they are in transition, the markets of Central and Eastern Europe present interestingopportunities and challenges. Global companies view the region as an important new source ofgrowth, and the first company to penetrate a country market often emerges as the industry leader.Exporting has been favored as a market entry mode, but direct investment in the region is on therise; with wage rates much lower than those in Spain, Portugal, and Greece, the region offersattractive locations for low-cost manufacturing. For consumer products, distribution is a criticalmarketing mix element because availability is the key to sales.One study examined the approaches utilized by 3M International, McDonald’s, PhilipsElectronics, Henkel, Südzucker AG, and several other companies operating in Central Europe.Consumers and businesses in the region are eagerly embracing well-known global brands that wereonce available only to government elites and others in privileged positions. The study found a highdegree of standardization of marketing program elements; in particular, the core product and brandelements were largely unchanged from those used in Western Europe. Consumer companies generallytarget high-end segments of the market and focus on brand image and product quality; industrialmarketers concentrate on opportunities to do business with the largest firms in a given country. 19THE MIDDLE EASTThe Middle East includes 16 countries: Afghanistan, Bahrain, Cyprus, Egypt, Iran, Iraq, Israel,Jordan, Kuwait, Lebanon, Oman, Qatar, Saudi Arabia, Syria, the United Arab Emirates (whichinclude Abu Dhabi and Dubai), and Yemen (see Exhibit 3-5). The majority of the population isArab, a large percentage is Persian, and a small percentage is Jewish. Persians and most Arabsshare the same religion, beliefs, and Islamic traditions, making the population 95 percent Muslimand 5 percent Christian and Jewish.Despite this apparent homogeneity, many differences exist. Middle Eastern countries are distributedacross the index of economic freedom discussed in <strong>Chapter</strong> 2; Bahrain ranks the highest interms of freedom, at 16. Kuwait, Saudi Arabia, and the United Arab Emirates are clustered in themid-50s. Moreover, the Middle East does not have a single societal type with a typical belief,behavior, and tradition. Each capital and major city in the Middle East has a variety of social groupsthat can be differentiated on the basis of religion, social class, education, and degree of wealth.The price of oil drives business in the Middle East. Seven of the countries have high oilrevenues: Bahrain, Iraq, Iran, Kuwait, Oman, Qatar, and Saudi Arabia hold significant world oilreserves. Oil revenues have widened the gap between poor and rich nations in the Middle East,and the disparities contribute to political and social instability in the area. Saudi Arabia, a monarchywith 22 million people and 25 percent of the world’s known oil reserves, remains the mostimportant market in this region.In the past, pan-Arabism, a form of nationalism and loyalty that transcends borders andamounts to anti-Western dogma, characterized the region. During the Persian Gulf War in theearly 1990s, this pan-Arabism weakened somewhat. To defeat Iraq, the Gulf Arabs and theirallies broke many of their unwritten rules, including the acceptance of help from the UnitedStates, a traditional ally of Israel. However, anti-Americanism was ignited in 2003 following18 Scott Miller, “Trading Partners Meet New EU,” The Wall Street Journal (May 4, 2004), p. A17.19 Arnold Shuh, “Global Standardization as a Success Formula for Marketing in Central Eastern Europe,” Journal ofWorld Business 35, no. 2 (Summer 2000), pp. 133–148.000200010270740623Global Marketing, Sixth Edition, by Warren J. Keegan and Mark C. Green. Copyright © 2011 by Warren J. Keegan. Published by Prentice Hall.
CHAPTER 3 • REGIONAL MARKET CHARACTERISTICS AND PREFERENTIAL TRADE AGREEMENTS 97President George W. Bush’s decision to invade Iraq and remove Saddam Hussein from power.The repercussions of America’s military action continue to be felt throughout the region. Theworld community is watching to see whether political and social reform can take root in Iraq.Exhibit 3-5: Dubai is one ofthe seven emirates thatmake up the United ArabEmirates (UAE). Comparedto its neighbors, Dubai’seconomy is relativelydiversified: It is an importantbusiness hub for themanufacturing, IT, andfinance sectors. Dubai hasalso become a populartourism destination in theregion. The global economiccrisis has had a major impacton Dubai. Following sixyears of economic growthfueled by a building boomand lavish consumerspending, real estate priceshave collapsed and majorconstruction projects havebeen canceled. Workers—many of whom areexpatriates—are losing theirjobs and visas.Source: Kamran Jebreili/AP WideWorld Photos.Cooperation Council for the Arab States of the GulfThe key regional organization is the Gulf Cooperation Council (GCC), which was established in1981 by Bahrain, Kuwait, Oman, Qatar, Saudi Arabia, and the United Arab Emirates (Table 3-12and Figure 3-8). These six countries hold about 45 percent of the world’s known oil reserves,but production is only about 18 percent of world oil output. Ironically, Saudi Arabia and severalother Middle Eastern countries post current-account deficits, largely because they mustimport most of the goods and services that their citizens consume. The countries are heavilydependent on oil revenues to pay for their imports; efforts toward economic diversification areunderway. For example, Saudi Arabia has developed new businesses in the petrochemical,cement, and iron industries; Bahrain is expanding its banking and insurance sectors; and theUnited Arab Emirates is focusing on information technology, media, and telecommunications. 20The organization provides a means of realizing coordination, integration, and cooperation in alleconomic, social, and cultural affairs. Gulf finance ministers drew up an economic cooperationTABLE 3-12 GCC Income and Population2006 GNI(in millions)2006 Population(in thousands)2006 GNIper Capita000200010270740623Bahrain $10,288 739 $14,370Kuwait 55,255 2,599 22,470Oman 22,994 2,546 9,070Qatar na 821 naSaudi Arabia 331,041 23,679 13,980United Arab Emirates 102,693 4,248 23,770Total/Mean GNI per capita $434,169 a 34,757 $12,777* ,a*Indicates meana Excluding QatarSource: Reprinted by permission of Warren Keegan Associates, Inc.20 Moin A. Siddiqi, “GCC: A Force to Be Reckoned With,” Middle East (December 2003).Global Marketing, Sixth Edition, by Warren J. Keegan and Mark C. Green. Copyright © 2011 by Warren J. Keegan. Published by Prentice Hall.
98 PART 2 • THE GLOBAL MARKETING ENVIRONMENTFIGURE 3-8Map of GCCCountriesKuwaitBahrainQatarUnitedArabEmiratesSaudi ArabiaOmanagreement covering investment, petroleum, the abolition of customs duties, harmonization of bankingregulations, and financial and monetary coordination. GCC committees coordinate trade developmentin the region, industrial strategy, agricultural policy, and uniform petroleum policies and prices.Current goals include establishing an Arab common market and increasing trade ties with Asia.The GCC is one of three newer regional organizations. In 1989, two other organizationswere established. Morocco, Algeria, Mauritania, Tunisia, and Libya banded together in the ArabMaghreb Union (AMU); Egypt, Iraq, Jordan, and North Yemen created the Arab CooperationCouncil (ACC). Many Arabs see their new regional groups—the GCC, ACC, and AMU—asembryonic economic communities that will foster the development of inter-Arab trade andinvestment. The newer organizations are more promising than the Arab League, which consistsof 21 member states and has a constitution that requires unanimous decisions.Marketing Issues in the Middle EastConnection is a key word in conducting business in the Middle East. Those who take the time todevelop relationships with key business and government figures are more likely to cut throughred tape than those who do not. A predilection for bargaining is culturally ingrained, and thevisiting businessperson must be prepared for some old-fashioned haggling. Establishing personalrapport, mutual trust, and respect are essentially the most important factors leading to a successfulbusiness relationship. Decisions are usually not made by correspondence or telephone.The Arab businessperson does business with the individual, not with the company. Most socialcustoms are based on the Arab male-dominated society. Women are usually not part of thebusiness or entertainment scene for traditional Muslim Arabs.AFRICAThe African continent is an enormous landmass with a territory of 11.7 million square miles; theUnited States would fit into Africa about three and a half times. It is not really possible to treatAfrica as a single economic unit. The 54 nations on the continent can be divided into threedistinct areas: the Republic of South Africa, North Africa, and sub-Saharan or Black Africa,000200010270740623Global Marketing, Sixth Edition, by Warren J. Keegan and Mark C. Green. Copyright © 2011 by Warren J. Keegan. Published by Prentice Hall.
CHAPTER 3 • REGIONAL MARKET CHARACTERISTICS AND PREFERENTIAL TRADE AGREEMENTS 99located between the Sahara in the north and the Zambezi River in the south. With 1.3 percent ofthe world’s wealth and 11.5 percent of its population, Africa is a developing region with an averageper capita income of less than $600. Many African nations are former colonies of Europe,and the EU remains the continent’s most important trading partner.The Arabs living in North Africa are differentiated politically and economically. The sixnorthern nations are richer and more developed, and several—notably Libya, Algeria, andEgypt—benefit from large oil resources. The Middle East and North Africa are sometimesviewed as a regional entity known as “Mena”; as oil prices have soared, the InternationalMonetary Fund (IMF) is encouraging Mena policymakers to invest the petrodollar windfall ininfrastructure improvements as a way of sustaining economic growth. 21 Most governments in thearea are working to reduce their reliance on oil revenues and their public aid levels. Theeconomies of non-oil, “emerging Mena” countries, which include Jordan, Lebanon, Morocco,and Tunisia, have also performed well in recent years.Economic Community of West African States (ECOWAS)The Treaty of Lagos establishing the Economic Community of West African States (ECOWAS)was signed in May 1975 by 16 states with the object of promoting trade, cooperation, and selfreliancein West Africa. The members are Benin, Burkina Faso, Cape Verde, Côte d’Ivoire, TheGambia, Ghana, Guinea, Guinea-Bissau, Liberia, Mali, Mauritania, Niger, Nigeria, Senegal, SierraLeone, and Togo (see Table 3-13 and Figure 3-9). In 1980, the member countries agreed toestablish a free trade area for unprocessed agricultural products and handicrafts. Tariffs on industrialgoods were also to be abolished; however, there were implementation delays. By January1990, tariffs on 25 items manufactured in ECOWAS member states had been eliminated. Theorganization installed a computer system to process customs and trade statistics and to calculate theFIGURE 3-9Map of ECOWASand SADCCountriesSenegalBurkinaFasoCapeVerdeMauritaniaGambiaMaliNigerGuinea-GuineaNigeriaBissauSierraLeoneGhanaBeninLiberiaCôte Togod’lvoireCongoTanzaniaMalawiSeychelles000200010270740623ECOWASSADCAngolaNamibiaZambiaBotswanaSouthAfricaMozambiqueZimbabweSwazilandLesotho21 Victoria Robson, “Window of Opportunity,” Middle East Economic Digest 49, no. 18 (May 6, 2005), p. 6.MauritiusGlobal Marketing, Sixth Edition, by Warren J. Keegan and Mark C. Green. Copyright © 2011 by Warren J. Keegan. Published by Prentice Hall.
100 PART 2 • THE GLOBAL MARKETING ENVIRONMENTTABLE 3-13 ECOWAS Income and Population2006 GNI(in millions)2006 Population(in thousands)2006 GNIper CapitaBenin $4,665 8,760 $530Burkina Faso 6,249 14,359 440Cape Verde 1,105 519 2,130Côte d’Ivoire 16,578 18,914 880The Gambia 488 1,663 290Ghana 11,778 23,008 510Guinea 3,713 9,181 400Guinea-Bissau 307 1,646 190Liberia 469 3,579 130Mali 5,546 11,968 460Mauritania 2,325 3,044 760Niger 3,665 13,737 270Nigeria 90,025 144,720 620Senegal 9,117 12,072 760Sierra Leone 1,353 5,743 240Togo 2,265 6,410 350Total/Mean GNI per capita $159,648 279,323 $572**Indicates meanSource: Reprinted by permission of Warren Keegan Associates, Inc.loss of revenue resulting from the liberalization of inter-community trade. In June 1990, ECOWASadopted measures that would create a single monetary zone in the region by 1994. Despite suchachievements, economic development has occurred unevenly in the region. In recent years, theeconomies of Benin, Côte d’Ivoire, and Ghana have performed impressively, while Liberia andSierra Leone are still experiencing political conflict and economic decline.East African CooperationIn 1996, the presidents of Kenya, Uganda, and Tanzania established a formal mechanism topromote free trade and economic integration. Tariff issues will be resolved and prospects for acustoms union are being explored. Efforts are also underway to develop regional ties in tourismand coordinate energy projects. Although Kenya is the most developed of the three nations,Francis Muthaura, the executive secretary of the secretariat of the Commission of East AfricanCooperation, expressed optimism that all three will benefit: “A free market is going to generatecompetition and already we are seeing a lot of cross-border investment. If you have free movementof capital and goods and labor, imbalances will be sorted out in the long term.” 22Southern African Development Community (SADC)In 1992, the South African Development Community (SADC) superseded the South AfricanDevelopment Coordination Council as a mechanism by which the region’s black-ruled states couldpromote trade, cooperation, and economic integration. The members are Angola, Botswana,Democratic Republic of Congo (formerly Zaire), Lesotho, Malawi, Mauritius, Mozambique,Namibia, South Africa, Seychelles, Swaziland, Tanzania, Zambia, and Zimbabwe (see Figure 3-9and Table 3-14). South Africa joined the community in 1994; it represents about 75 percent of theincome in the region and 86 percent of intra-regional exports. The SADC’s ultimate goal is a fullydeveloped customs union; in 2000, an 11-nation free trade area was finally established (Angola, the22 Michael Holman, “<strong>Learning</strong> from the Past,” Financial Times Survey (November 5, 1996), p. 1.000200010270740623Global Marketing, Sixth Edition, by Warren J. Keegan and Mark C. Green. Copyright © 2011 by Warren J. Keegan. Published by Prentice Hall.
CHAPTER 3 • REGIONAL MARKET CHARACTERISTICS AND PREFERENTIAL TRADE AGREEMENTS 101TABLE 3-14 SADC Income and Population2006 GNI(in millions)2006 Population(in thousands)2006 GNIper CapitaAngola $32,646 16,557 $1,970Botswana 10,358 1,858 5,570Democratic Republic of Congo 7,742 60,644 130Lesotho 1,957 1,995 980Malawi 3,143 13,571 230Mauritius 6,812 1,253 5,430Mozambique 6,453 20,971 310Namibia 6,573 2,047 3,210Seychelles 751 85 8,870South Africa 255,389 47,391 5,390Swaziland 2,737 1,138 2,400Tanzania 13,404 39,459 350Zambia 7,413 11,696 760Zimbabwe 8,016 13,228 620Total/Mean GNI per capita $239,724 218,940 $1,095**Indicates meanSource: Reprinted by permission of Warren Keegan Associates, Inc.Democratic Republic of Congo, and Seychelles are not participants). South Africa has been indiscussions with the EU about the formation of a free trade area; other SADC members are concernedthat such an arrangement would provide European global companies with a base fromwhich to dominate the continent. South Africa, Botswana, Lesotho, Namibia, and Swaziland alsobelong to the Southern African Customs Union (SACU). Another concern is war in the Congo,which threatens to have a severe impact on economic growth in the region. 23Marketing Issues in Africa000200010270740623In 2000, U.S. President George W. Bushed signed the African Growth and Opportunities Act(AGOA) into law (see www.agoa.gov). Created with the theme of “Trade, not Aid,” the law isdesigned to support African nations that make significant progress toward economic liberalization.Companies will find it easier to gain access to financing from the U.S. Export-Import Bank; AGOAalso represents a formal step toward a U.S.-Africa free trade area. One of the Act’s key provisionsgrants textile and apparel manufacturers in Kenya and Mauritius free access to the U.S. market upto a limit of $3.5 billion in exports each year. As Benjamin Kipkorir, Kenya’s ambassador to theUnited States, observed a decade ago, “Every country that has industrialized, starting from Englandin the eighteenth century, began with textiles. We’d like to do the same thing.”Under the Agreement on Textiles and Clothing negotiated during the Uruguay Round ofGATT negotiations, global textile quotas were eliminated in 2005. Nevertheless, the textile provisionin AGOA is controversial. The United States imports about $50 billion in textiles andapparel each year, much of it from Asia, Latin America, and Africa. Wary legislators fromtextile-producing states fear job losses among their constituents.Despite such initiatives, only about 3 percent of annual foreign direct investment goes to Africa.Still, some Persian Gulf states are creating closer ties with Africa, investing billions of dollars in keysectors such as infrastructure, agriculture, and telecommunications. For example, Dubai World, astate-owned company, is negotiating a deal in Nigeria’s energy sector that could be valued at severalbillion dollars. Dubai also funded construction of a container terminal that opened recently in23 Tony Hawkins and Michael Holman, “Trade Tensions Send Southern Africa Regional Link-Up Reeling,” FinancialTimes (September 2, 1998), p. 4.Global Marketing, Sixth Edition, by Warren J. Keegan and Mark C. Green. Copyright © 2011 by Warren J. Keegan. Published by Prentice Hall.
102 PART 2 • THE GLOBAL MARKETING ENVIRONMENTDjibouti. The largest terminal of its kind in sub-Saharan Africa, it will be managed by DP World, asubsidiary of Dubai World. Such investments are welcome at a time when investors in Europe, stungby losses in the developed world, are cutting spending. As Djibouti President Ismail Guelleh noted,“What the Arabs are doing for us is what colonialists should have done for Africa.” 24SummaryThis chapter examines the environment for world trade, focusing on the institutions and regionalcooperation agreements that affect trade patterns. The multilateral World Trade Organization,created in 1995 as the successor to the General Agreement on Tariffs and Trade, provides aforum for settling disputes among member nations and tries to set policy for world trade. Theworld trade environment is also characterized by preferential trade agreements amongsmaller numbers of countries on a regional and subregional basis. These agreements can beconceptualized on a continuum of increasing economic integration.Free trade areas such as the one created by the North American Free Trade Agreement(NAFTA) represent the lowest level of economic integration. The purpose of a free trade agreementis to eliminate tariffs and quotas. Rules of origin are used to verify the country from which goods areshipped. A customs union (e.g. Mercosur) represents a further degree of integration in the form ofcommon external tariffs. In a common market such as the Central American Integration System(SICA), restrictions on the movement of labor and capital are eased in an effort to further increaseintegration. An economic union such as the EU, the highest level of economic integration, is achievedby unification of economic policies and institutions. Harmonization, the coming together of varyingstandards and regulations, is a key characteristic of the EU.Other important cooperation arrangements include the Association of Southeast AsianNations (ASEAN) and the Cooperation Council for the Arab States of the Gulf (GCC). In Africa,the two main cooperation agreements are the Economic Community of West African States(ECOWAS) and the South African Development Community (SADC).Discussion Questions1. Explain the role of the World Trade Organization. Why has the Doha Round of trade talksstalled?2. Describe the similarities and differences between a free trade area, a customs union, acommon market, and an economic union. Give an example of each.3. The creation of the Single Market in Europe has led to harmonization. What does thismean? How does harmonization affect a company’s global marketing strategies?4. What are the criteria for joining the euro zone?5. Identify a regional economic organization or agreement in each of the following areas:Latin America, Asia/Pacific, Western Europe, Central Europe, the Middle East, and Africa.6. Several key dates mentioned in the chapter are listed here. Can you identify the eventassociated with each? (The answers follow.)January 1, 1994January 1, 1995January 1, 1999January 1, 2002May 1, 2004January 1, 2009Answers: January 1, 1994—NAFTA becomes effective; January 1, 1995—WTO becomes thesuccessor to GATT; January 1, 1999—introduction of the euro as unit of account; January 1,2002—euro currency goes into circulation; May 1, 2004 —EU enlargement to 25 members;January 1, 2009—Slovakia becomes the sixteenth member of the euro zone24 Margaret Coker, “Persian Gulf States Bet on Africa Despite Downturn,” The Wall Street Journal(February 24, 2009), p. A9.000200010270740623Global Marketing, Sixth Edition, by Warren J. Keegan and Mark C. Green. Copyright © 2011 by Warren J. Keegan. Published by Prentice Hall.
Case 3-1 Continued (refer to page 74)The United States and South Korea Sign a Free Trade Agreement:The AssignmentTrade deals require all parties to make concessions, and thenegotiations between the United States and South Korea are acase in point. American beef exports plunged after an outbreak ofBSE (mad-cow disease) in 2003. Before the mad cow scare, theAsian nation was the third-largest market for U.S. beef exports. Inthe spring of 2008, a few weeks after taking office, President LeeMyung-bak decided to lift a ban on U.S. beef; in return, the UnitedStates agreed to exclude South Korea’s rice industry from the tradeagreement.Why? Rice represents about half of South Korea’s agriculturaloutput; a high import tariff means that local rice farmers cancharge much higher prices for their crops than farmers in otherrice-producing nations such as China. Even though they pay up tothree times more for rice than consumers in other Asian countries,many Koreans sympathize with the farmers’ concerns; domesticrice production is a source of pride and a symbol of self-sufficiency.As one activist noted, “It is a right for a country to feed its ownpeople and a right for a country to produce its own food.”After President Lee’s decision was made public, news reportssuggested that mad cow disease could still be present in U.S.herds. Opposition politicians from the United Democratic Party,whose candidate was defeated in the most recent presidentialelection, took advantage of the negative publicity to suggest thatMr. Lee had caved in to demands by American trade negotiators.The rumors fueled a backlash that included rumors that Americanconsumers don’t eat the type of beef that is exported and thatconsumer products such as mascara contain beef by-products andcould be tainted. In May 2008, thousands of people gathered inSeoul to protest.For U.S. President George W. Bush, the trade pact with SouthKorea was an important political victory. Suspicion and doubt abouttrade and globalization was growing among CongressionalDemocrats. Proposed trade pacts with Colombia and Panama hadbeen given a cool reception. Although the accord with South Koreawas concluded in April 2007, it still had to be ratified by lawmakersin both countries. In 2009, a South Korean parliamentary committeeapproved the FTA; the U.S. Congress was scheduled to act on themeasure in 2009 as well. However, Ford, Chrysler, and the UnitedAuto Workers opposed the deal. Hyundai and Kia, the stars ofKorea’s auto industry, were enjoying great success in the UnitedStates despite the recession. Overall sales of both foreign anddomestic cars were down by nearly forty percent in the U.S. market.By contrast, sales for Hyundai and Kia were only down 3.6 percent.Meanwhile, South Korea was also pursuing a trade agreementwith the EU. Agriculture was not a key issue in the negotiations;however, regulations that protect Korea’s auto industry needed to beaddressed. Some observers have suggested that the backlash againstKorea’s trade accord with the United States would spill over andaffect Seoul’s negotiations with Brussels. As Richard Baldwin, aprofessor at the Graduate Institute of International Studies inGeneva, noted, “This shows that the idea that regionalism is easyand multilateralism is hard has been massively overblown.”Case 3-1 Discussion Questions1. When a trade deal is passed, there are winners and losers.Who stands to win if the U.S.-Korea free trade agreement isratified? Who stands to lose?2. Trade issues were central to the 2008 U.S. presidentialcampaign. In a telephone survey conducted in April 2008,48 percent of respondents indicated that free trade agreementshad a negative impact on the United States. Thirty-fivepercent said FTAs were a “good thing”; 17 percent answered,“Don’t know.”Then-Senator Barack Obama, the Democratic nominee,pledged that, as president, he would renegotiate the NorthAmerican Free Trade Agreement. He called for enforceablelabor and environmental standards that were not included inthe original agreement. Senator Obama also opposed theproposed new FTA with Colombia. In one campaign stop,Senator Obama said, “I think we should use the hammer of apotential opt-out as leverage to ensure that we actually getlabor and environmental standards enforced.”Greg Somers, a Canadian lawyer specializing in internationaltrade, takes exception with Senator Obama’s position.“What [Obama} is proposing would be far too intrusive onthe sovereignty of the laws of a country. That’s not the job ofa trade deal,” he said. Senator John McCain, Obama’sRepublican opponent, had this response: “You know whatthat message sends? That no agreement is sacred if someonedeclares that as president of the United States they wouldunilaterally renegotiate it.” 25Which candidate’s views on trade correspond most closelyto yours?Sources: Chris Woodyard, “Cars Hold Up S. Korean Trade Deal,” USAToday (May 13, 2009), p. 3B; Alan Beattie, “Hard Bargains,” FinancialTimes (June 17, 2008), p. 9; Evan Ramstad, “Korea’s Beef with the U.S.,”The Wall Street Journal (June 6, 2008), p. A11; Evan Ramstad and JulieYang, “South Korea Answers Uproar on U.S. Beef,” The Wall StreetJournal (May 3/4, 2008), p. A8; Choe Sang-hun, “U.S. and South KoreaAgree to Sweeping Trade Deal,” The New York Times (April 3, 2007),pp. C1, C8; Evan Ramstad, “Korea Trade Focus: Cars,” The Wall StreetJournal (March 29, 2007), p. A8; Evan Ramstad, “South Korea Ready toOpen Up,” The Wall Street Journal (March 28, 2007), p. A6.25 Amy Chozick, “Trade Stance Weighs on Obama’s Plan to StrengthenForeign Ties,” The Wall Street Journal (July 9, 2008), p. A6.000200010270740623103Global Marketing, Sixth Edition, by Warren J. Keegan and Mark C. Green. Copyright © 2011 by Warren J. Keegan. Published by Prentice Hall.
Case 3-2Ecuador’s Galápagos Islands and EcotourismEcuador boasts a dazzling mix of geographic wonders, includingcoastal lowlands, the Andes mountain range, the fabled jungles ofthe Amazon, and the legendary Galápagos Islands. The seventyvolcanic islands, located in the Pacific Ocean about 600 miles offEcuador’s coast, are known for their fragile ecosystems and endemictropical species. The giant tortoise, sea lion, iguana, blue-footedbooby, flightless cormorant, and waved albatross are just a few ofthe unique and wonderful species living here.Public fascination with the Galápagos dates back to the timethat Charles Darwin made his first trip to the isolated archipelagoin the early nineteenth century. It was there that Darwin began toformulate his ideas on evolution by means of natural selection.Although there are some who would dispute Darwin’s theory,there is little disagreement regarding the magnetic pull of theGalápagos Islands’ exotic beauty and abundant flora and fauna.In 1959, the 100th anniversary of the publication of Darwin’sOn the Origin of Species, the Ecuadorian government embarkedon concerted conservation efforts to safeguard the islands.Officially, the islands are a province of the Republic of Ecuador; thegovernment declared 97 percent of the islands’ land area asEcuador’s first national park. Habitation by humans is limited tothe remaining 3 percent. In 1986, the government designated19,300 square miles of water surrounding the archipelago as theGalápagos Marine Resources Reserve. In 1998, the Special Law ofthe Conservation and Sustainable Use of the Galápagos Provinceestablished the Galápagos Marine Reserve. Taken together, thesepieces of legislation were designed to fully protect both land andwater.Today, tourists are a constant presence on the islands. Tourismhas enabled Ecuador to diversify its export base, which traditionallyhas been heavily dependent on oil. Ecotourism has been a drivingforce behind Ecuador’s economic growth during the past decade.In 1999, Ecuador defaulted on its foreign debt; in 2000, it adoptedthe dollar as its official currency. In a process known as inwardmigration, many Ecuadorians left the mainland and went to theislands seeking work.A recent study in Environment and Development Economicsexamined the economy of the Province of Galápagos as a separateentity from the mainland, The study found that, from 1999 to2005, the islands’ GDP increased by approximately 78 percent. Thismeans that the Galápagos could be considered one of the world’sfastest-growing economies. Tourism played an important role,accounting for about two-thirds percent of the growth. However,income per person in the Province rose only by 1.8 percent annuallyduring the same period.Prior to the 1970s, access to the islands was primarily by largecargo ships coming from Guayaquil, Ecuador’s main port. Tourismgot a big boost after an old military airstrip was renovated on theisland of Baltra and Aerolíneas Galápagos and other commercialairlines established regular flights. The number of touristsincreased from 68,850 per year in 2000, to 108,400 in 2004.The Ecuadorian government and the National Parks Servicehave maintained stringent rules for the islands. All tourists mustbe accompanied by trained naturalist guides, and there is a $100per person entrance fee to the park. Visitors must follow a strictitinerary that limits them to the 50 designated sites on the islands.The influx of visitors has spurred hundreds of tourism-relatedbuilding projects such as hotels. More than half of Ecuador’stourist earnings are generated by the islands themselves andmuch of the money goes back into the islands to protect them.Of course, tourism also creates new jobs, and, as noted, manyimmigrants have come to the Galápagos seeking work in theservice sector. In the past decade, the human population on the104The clash of tourism and ofnatural habitat is apparent as raftboat drivers pull up to the shoresof Española IPunta Suarez.Theinactive lava terrain and colonyof Galápagos sea lions makethe shoreline a difficult loadingport for raft boats and waitingtourists.Source: Emily Beckmann.000200010270740623Global Marketing, Sixth Edition, by Warren J. Keegan and Mark C. Green. Copyright © 2011 by Warren J. Keegan. Published by Prentice Hall.
archipelago has doubled to 30,000 people. The growing immigrantpopulation is straining public services such as waste disposal.To address the issue, Ecuador’s government has expelled morethan 1,000 people from the province, an action that has provokeda backlash. One migrant was powerless to stop authorities fromputting her daughter on an airplane back to the mainland. Shesaid, “We are being told that a tortoise for a rich foreigner to photographis worth more than an Ecuadorean citizen.”Meanwhile, the livelihoods of the Ecuadorians who remain onthe Galápagos are also increasingly dependent on exotic seaspecies. Marine ecosystems are being destroyed as fish stocksfrom the marine reserves are being depleted by illegal catchingand bottom fishing. China’s growing demand for shark fins andsea cucumbers has resulted in overfishing. Environmentalists haveexpressed concern that Ecuador’s environment ministry and parksservice are giving in to the demands of the local fishing cooperative.Also, tourists frequently leave behind more than just dollars.There is a growing problem with invasive species; incomingaircraft and boats routinely bring rats, ant, roaches, moths, andother insects that pose a threat to the islands’ biodiversity.Preservation of the Galápagos Islands is not the sole environmentalconcern in Ecuador. Back on the mainland, environmentalistsare seeking ways to slow the rate of rain forestdestruction. One plan calls for lining up investors who will financethe conversion of some vulnerable parts of the rain forest intoprotected preserves. There are concerns, however, that ecotourismwill actually accelerate the area’s environmental degradation.Discussion Questions1. The case reports economic data showing that GDP in theProvince of Galápagos increased 78 percent over the six-yearperiod from 1999 to 2005. However, during the same period,per capita GDP showed an increase of less than 2 percent.What is the explanation for this? What are the implications forsustainable development of the Galápagos tourism industry?2. The Galápagos Islands are home to many different endemicspecies. Do you think that Ecuador’s policymakers have doneenough to ensure sustainable growth of the tourism sector?Are the limits on human inhabitants and visitors stringentenough? Too stringent?3. How do you market something such as the GalápagosIslands, which have such strict guidelines?This case was prepared by Research Assistant Emily Beckmann under thesupervision of Professor Mark Green.Sources: Simon Romero, “Puerto Ayora Journal: To Protect Galapagos,Ecuador Limits a Two-Legged Species,” The New York Times (October 5,2009), pp. A1, A8; J. Edward Taylor, Jared Hardner, and Micki Stewart,“Ecotourism and Economic Growth in the Galápagos: An IslandEconomy-wide Analysis,” Environment and Development Economics, 14,no. 2 (2009), 139–162; “Shellshock,” Economist (March 29, 2008), p. 97;Galápagos Conservation Trust, “Explore Galápagos” (2008); Steve Nash,“Ecotourism and Other Invasions,” Bioscience (February 2009); MarthaHoney and Ann Littlejohn, “Paying the Price of Ecotourism,” Americas(November/December 1994).000200010270740623105Global Marketing, Sixth Edition, by Warren J. Keegan and Mark C. Green. Copyright © 2011 by Warren J. Keegan. Published by Prentice Hall.