Download PDF - Nutricao de Plantas
Download PDF - Nutricao de Plantas
Download PDF - Nutricao de Plantas

You also want an ePaper? Increase the reach of your titles
YUMPU automatically turns print PDFs into web optimized ePapers that Google loves.
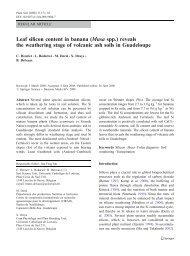
164 Plant Soil (2008) 304:157–168Relative values of Root Elongation Rates (K0/K+)1.61.41.210.80.6P2P3P40.40 50 100 150 200Thermal time since starvation (°C days)Fig. 7 Relative value of the root elongation rate (RER in K0/RER in K+), for axile roots from phytomers P2, P3 and P4, as afunction of thermal time after starvationsignificantly lower for K0 plants at the end of theexperiment: 1.36 and 1.14 mm for axile roots ofphytomer 3, 1.72 and 1.34 mm for axile roots ofphytomer 4, for treatments K+ and K0, respectively.The <strong>de</strong>lay between lateral root initiation an<strong>de</strong>mergence was calculated as the slope of therelationship between the length of the apical unbranchedzone (L unbr ) and the axile root elongationrate (RER), as proposed by Pellerin and Tabourel(1995). It was not significantly different between Ktreatments (54 <strong>de</strong>gree-days for both treatments). The<strong>de</strong>nsity of branching (number of first-or<strong>de</strong>r lateralroots per unit length of axile root) was slightly higherfor K0 plants, but the length of laterals of similar agewere generally significantly lower (see Table 2 forphytomer 3; the same trends were observed on otherphytomers). However, as mentioned previously,measurements on laterals were only possible on thosewhich had emerged during the last 10 days of theexperiment, so that no data were available on lateralswhose growing period occurred just after K starvation.Soluble sugar and starch concentrations in leavesand root apicesThe concentrations of soluble sugars measured in theroot apical zones were generally greater for the K0treatment (Table 3), although the difference was notalways significant. Glucose was the most abundantsugar (>70%), followed by fructose. No significantdifference was observed between K treatments in thesoluble sugar and starch content in mature leaves.DiscussionK concentrations observed in plants of the K+treatment compare well with, but are in the lowerrange of values reported by other authors for plantswell supplied with K. Classical values reported in theliterature range between 150–250 mM (40–60 mgKg −1 dry matter) (Koch and Estes 1975; Huber 1985;Leigh 1989; Barraclough and Leigh 1993). Valuesobserved in K-<strong>de</strong>prived plants at the end of theexperiment are close to or slightly below the criticalvalues reported in the literature for maximum growthTable 2 Density, length and diameter of first-or<strong>de</strong>r laterals on axile roots of phytomer 3, for 20 mm axile root segments observed atthe last sampling dateTT since starvation Age of laterals Density K0 Density K+ Length K0 Length K+ Diameter K0 Diameter K+°C days °C days (cm −1 ) (cm −1 ) (mm) (mm) (mm) (mm)185.6 10.6 14.6±2.2* 9.3±2.4 3.50±0.7* 4.90±0.7 0.34±0.05 0.39±0.1175.1 21.1 16.4±3.9 10.8±3 5.80±1.1* 8.72±1.2 0.31±0.02 0.5±0162.7 33.5 9.5±4.3 8.8±2.5 12.52±4.2 23.52±8.6 0.3±0.04** 0.41±0.03124.7 71.5 11.1±2.5 10.9±3.0 12.56±3.2** 32.11±8.1 0.28±0.03 0.31±0.05110.6 85.6 11.1±2.1 13.2±3.9 12.73±2.2** 30.67±4.5 0.3±0 0.3±0.0399.4 96.8 11.3±0.3* 7.9±1.5 14.04±2.4* 38.49±7.6 0.28±0.02 0.35±0.06The first column states the thermal time since starvation when lateral emerged on the root segment, whereas the second column statesfor the age of laterals when measured. * and ** indicate significance at p