SEG 45 Final_qx4 - Society of Economic Geologists
SEG 45 Final_qx4 - Society of Economic Geologists
SEG 45 Final_qx4 - Society of Economic Geologists

Create successful ePaper yourself
Turn your PDF publications into a flip-book with our unique Google optimized e-Paper software.
OCTOBER 2005 • No 63 <strong>SEG</strong> NEWSLETTER 9<br />
... from 5<br />
Exploring for Deposits Under Deep Cover Using Geochemistry (Continued)<br />
sulfide blanket up to 120 m thick that<br />
mainly underlies, but also overlaps,<br />
largely oxidized Au mineralization.<br />
Subsequent to supergene alteration, the<br />
deposit was covered by up to 240 m <strong>of</strong><br />
Eocene Carlin Formation comprised <strong>of</strong><br />
piedmont gravel, finer clastic sediments,<br />
waterlain tuff, and a basal conglomerate<br />
and regolith that contains mineralized<br />
(oxidized) clasts.<br />
The most probable mechanism for<br />
generating geochemical anomalies<br />
through 240 m <strong>of</strong> postmineral cover is<br />
by the movement <strong>of</strong> fluids or gases up<br />
faults in this cover. Dohrenwend and<br />
Moring (1991) carried out photo-geological<br />
interpretations <strong>of</strong> recent faulting in<br />
this region, and noted that faults could<br />
be identified by a number <strong>of</strong> criteria,<br />
the most relevant to the Mike area<br />
being “prominent alignments <strong>of</strong> linear<br />
drainageways, ridges and swales, active<br />
springs or spring deposits, and linear<br />
discontinuities <strong>of</strong> structure, rock type,<br />
and vegetation.” This faulting, which<br />
they assign to early to middle<br />
Pleistocene time (0.13 to 1.5 Ma), with a<br />
mean orientation <strong>of</strong> 028°, resulted in<br />
dissection <strong>of</strong> the surface. The topography<br />
<strong>of</strong> the Mike area (Fig. 1b) shows<br />
deeply incised dry stream beds with orientations<br />
close to 028°, which were<br />
interpreted by Cameron and Doherty<br />
(2001) to represent faults that cut the<br />
Carlin Formation. Interpreted fault A is<br />
marked by a stream and floodplain.<br />
Faults B and C are marked by steepsided<br />
valleys, which were dry during our<br />
visits. The east slope <strong>of</strong> the valley marking<br />
fault B is precipitous, which may<br />
indicate a fault scarp. Climate is semiarid,<br />
with sparse sagebrush vegetation.<br />
A soil sampling line was chosen that<br />
was normal to the strike <strong>of</strong> the interpreted<br />
faults cutting the Carlin Formation.<br />
Soils were collected from sites at 30<br />
m intervals; at each site, sub-samples<br />
were taken from a depth <strong>of</strong> 40 to 50 cm<br />
from five holes dug within a radius <strong>of</strong><br />
1.5 to 3.0 m. The five sub-samples were<br />
mixed to form a composite sample.<br />
Composite samples reduce sampling<br />
error, permitting less distinct anomalies<br />
to be identified. The soils were found to<br />
be immature with a weak B-horizon<br />
below 15 to 30 cm and a low organic<br />
content, except in alluvial soils around<br />
the stream that marks Channel A.<br />
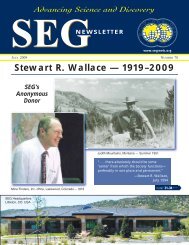
Analyses <strong>of</strong> the soils after aqua regia<br />
extraction are shown in Figure 2. There<br />
are strong anomalies for Au and Cu on<br />
the steep west-facing (scarp) slope <strong>of</strong> the<br />
dry valley along fault B. There are no<br />
recognizable anomalies for these elements<br />
where the sampling line crosses<br />
fault A. A number <strong>of</strong> other elements<br />
show anomalies along the sampling<br />
line, the most prominent being Zn and<br />
Cd Aqua Regia, ppm<br />
Cu Aqua Regia, ppm<br />
Au Aqua Regia, ppb<br />
2.0<br />
1.6<br />
1.2<br />
0.8<br />
0.4<br />
0.0<br />
60<br />
40<br />
20<br />
0<br />
16<br />
12<br />
8<br />
4<br />
0<br />
Cadmium<br />
Copper<br />
Gold<br />
Fault'A'<br />
Cd. Cadmium shows a distinct anomaly<br />
along the scarp slope <strong>of</strong> fault B and a<br />
weaker anomaly where the line crosses<br />
fault A.<br />
During the period <strong>of</strong> 1999 to 2001,<br />
when our work on Mike<br />
was being carried out, to page 10 ...<br />
Fault 'B'<br />
0 500 1000 1500 m<br />
FIGURE 2. Plots <strong>of</strong> Au, Cu, and Cd by aqua regia extraction in soils from the line shown in<br />
Figure 1. Zero on the horizontal scale is at the northwest limit <strong>of</strong> the line. The strongest<br />
anomalies are found in the eastern (scarp) slope <strong>of</strong> the valley formed by fault B. This valley<br />
is the surface expression <strong>of</strong> the Nebulous fracture zone that dips west to the basement<br />
to form the bounding structure for secondary mineralization in the West Mike (Norby and<br />
Orobona, 2002)