All-time Queensland First Class Statistics - Queensland Cricket
All-time Queensland First Class Statistics - Queensland Cricket
All-time Queensland First Class Statistics - Queensland Cricket

You also want an ePaper? Increase the reach of your titles
YUMPU automatically turns print PDFs into web optimized ePapers that Google loves.
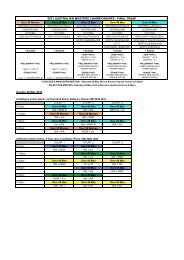
Domestic One Day <strong>Statistics</strong>84WIN/LOSS RECORDBatting <strong>First</strong>Batting SecondOpponent M W L NR P W % P W %Australian Capital Territory 3 3 - - 2 2 100.00 1 1 100.00New South Wales 37 17 20 - 16 6 37.50 21 11 52.38New Zealanders 1 - 1 - 0 0 - 1 0 0.00South Australia 30 23 7 - 16 11 68.75 14 12 85.71Tasmania 33 22 10 1 17 11 64.71 15 11 73.33Victoria 30 14 15 1 13 5 38.46 16 9 56.25Western Australia 36 16 18 2 21 9 42.86 13 7 53.85TOTAL 170 95 71 4 85 44 51.76 81 51 62.96ALL TIME RECORDSHighest total for <strong>Queensland</strong>: 4/405 v Western Australia at Brisbane 2003-04Highest total against <strong>Queensland</strong>: 9/313 by South Australia at Brisbane 2005-06Lowest total for <strong>Queensland</strong>: 62 v Western Australia at Perth 1976-77Lowest total against <strong>Queensland</strong>: 65 by Victoria at Ballarat 2002-03Highest score for <strong>Queensland</strong>: 187 JP Maher v Western Australia at Brisbane 2003-04Highest score against <strong>Queensland</strong>: 152* PA Jaques (New South Wales) at Sydney 2005-06Best bowling for <strong>Queensland</strong>: 7/34 CG Rackemann v South Australia at Adelaide 1988-89Best bowling against <strong>Queensland</strong>: 5/23 JP Marquet (Tasmania) at Hobart 1995-96HIGHEST INNINGS TOTALS BATTING FIRSTTotal Opponent Venue Season4/405 defeated Western Australia Brisbane 2003-044/320 defeated Tasmania Brisbane 1993-94HIGHEST INNINGS TOTALS BATTING SECONDTotal Opponent Venue Season7/284 defeated Western Australia Perth 1997-989/282 lost to Victoria Brisbane 2005-06RESULTS FOR QUEENSLANDBatting <strong>First</strong>Batting SecondOpponent Venue M W L NR T P W % P W %Australian Capital Territory Brisbane (Gabba) 1 1 - - - 0 0 - 1 1 100.00Australian Capital Territory Canberra (Manuka) 2 2 - - - 2 2 100.00 0 0 -New South Wales Brisbane (Albion) 1 1 - - - 0 0 - 1 1 100.00New South Wales Bankstown 1 - 1 - - 1 0 0.00 0 0 -New South Wales Brisbane (Gabba) 23 10 13 - - 11 4 36.36 12 6 50.00New South Wales Homebush 2 2 - - - 1 1 100.00 1 1 100.00New South Wales North Sydney 3 - 3 - - 1 0 0.00 2 0 0.00New South Wales Sydney 7 4 3 - - 2 1 50.00 5 3 60.00New Zealanders Brisbane (Gabba) 1 - 1 - - 0 0 - 1 0 0.00South Australia Adelaide 16 12 4 - - 9 5 55.56 7 7 100.00South Australia Football Park 1 1 - - - 0 0 - 1 1 100.00South Australia Brisbane (Albion) 1 1 - - - 1 1 100.00 0 0 -South Australia Brisbane (Gabba) 12 9 3 - - 6 5 83.33 6 4 66.67Tasmania Brisbane (Gabba) 18 14 3 1 - 8 6 75.00 9 8 88.89Tasmania Hobart (Bellerive) 9 5 4 - - 6 4 66.67 3 1 33.33RESULTS FOR QUEENSLAND (Continued)Batting <strong>First</strong>Batting SecondOpponent Venue M W L NR T P W % P W %Tasmania Hobart (TCA) 4 2 2 - - 2 1 50.00 2 1 50.00Tasmania Launceston 2 1 1 - - 1 0 0.00 1 1 100.00Victoria Ballarat 2 1 1 - - 0 0 - 2 1 50.00Victoria Brisbane (Gabba) 15 7 7 1 - 5 2 40.00 9 5 55.56Victoria Carlton 1 - 1 - - 1 - 0.00 0 0 -Victoria Melbourne 10 5 5 - - 6 3 50.00 4 2 50.00Victoria Richmond 1 1 - - - 0 0 - 1 1 100.00Victoria St Kilda 1 - 1 - - 1 0 0.00 0 0 0.00Western Australia Brisbane (Gabba) 17 10 7 - - 11 5 45.45 6 5 83.33Western Australia Melbourne 1 - 1 - - 0 0 - 1 0 0.00Western Australia Perth 18 6 10 2 - 10 4 40.00 6 2 33.33QUEENSLAND AT DIFFERENT VENUESBatting <strong>First</strong>Batting SecondVenue M NR T P W % P W %Sydney Dec 7 1969 7 - - 2 1 50.00 5 3 60.00Brisbane (Gabba) Nov 1 1970 87 2 - 41 22 53.66 44 29 65.91Adelaide Dec 6 1970 16 - - 9 5 55.56 7 7 100.00Melbourne Feb 6 1971 11 - - 6 3 50.00 5 2 40.00Perth Jan 12 1975 18 2 - 10 4 40.00 6 2 33.33Hobart (TCA) Jan 1 1976 4 - - 2 1 50.00 2 1 50.00Adelaide (Football Pk) Oct 18 1986 1 - - 0 0 - 1 1 100.00Launceston Feb 28 1988 2 - - 1 0 0.00 1 1 100.00Carlton Nov 15 1992 1 - - 1 0 0.00 0 0 -Hobart (Bellerive) Feb 6 1993 9 - - 6 4 66.67 3 1 33.33North Sydney Oct 15 1995 3 - - 1 0 0.00 2 0 0.00Canberra (Manuka) Jan 31 1998 2 - - 2 2 100.00 0 0 -Albion Feb 20 2000 2 - - 1 1 100.00 1 1 100.00Bankstown Oct 22 2000 1 - - 1 0 0.00 0 0 -Richmond Oct 28 2001 1 - - 0 0 - 1 1 100.00Ballarat Jan 26 2003 2 - - 0 0 - 2 1 50.00Homebush Jan 17 2003 2 - - 1 1 100.00 1 1 100.00St Kilda Dec 11 2005 1 - - 1 0 0.00 0 0 -RECENT PLACINGSState 95-96 96-97 97-98 98-99 99-00 00-01 01-02 02-03 03-04 04-05 05-06A.C.T. - - 6 6 7 - - - - - -New South Wales 3 3 2 2 3 1 1 1 4 6 1<strong>Queensland</strong> 1 2 1 3 2 4 2 3 2 2 6South Australia 4 6 4 4 4 3 3 6 5 5 2Tasmania 5 5 5 7 6 5 6 4 6 1 5Victoria 6 4 7 1 5 6 5 5 3 3 3Western Australia 2 1 3 5 1 2 4 2 1 4 4MOST APPEARANCESGames Player CareerGames Player Career94 JP Maher 1993-94 – 2005-0685 SG Law 1988-89 – 2003-0482 ML Love 1993-94 – 2005-0677 WA Seccombe 1994-95 – 2004-0576 MS Kasprowicz 1989-90 – 2005-0668 CT Perren 1997-98 – 2005-0667 AJ Bichel 1992-93 – 2005-0665 A Symonds 1993-94 – 2005-0656 ML Hayden 1992-93 – 2005-0654 JR Hopes 2000-01 – 2005-06