2010-2011 Budget - City of Saginaw MI
2010-2011 Budget - City of Saginaw MI
2010-2011 Budget - City of Saginaw MI

Create successful ePaper yourself
Turn your PDF publications into a flip-book with our unique Google optimized e-Paper software.
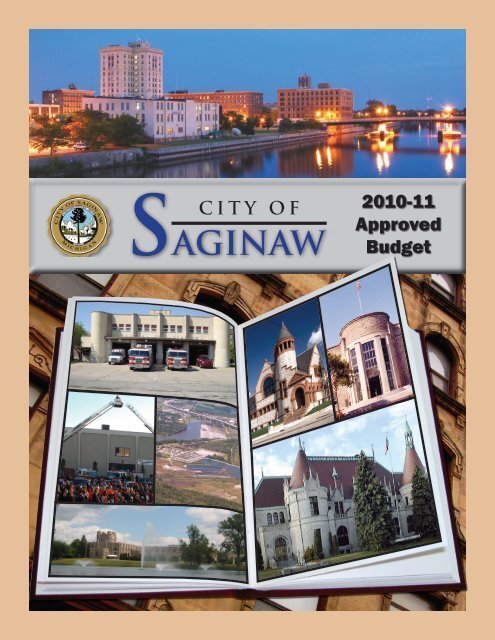
C I T Y O F <strong>2010</strong>-11Approved<strong>Budget</strong>SAGINAW
CITY OF SAGINAW,<strong>MI</strong>CHIGANHonorable Greg BranchMayorDarnell Earley<strong>City</strong> ManagerApproved to <strong>City</strong> CouncilMay 24, <strong>2010</strong>Honorable Amos O’Neal, Mayor Pro-TemDennis Browning, Council MemberDan Fitzpatrick, Council MemberWilliam G. Scharffe, Council MemberLarry Coulouris, Council MemberAmanda Kitterman-Miller, Council MemberPaul Virciglio, Council MemberAndrew Wendt, Council Member<strong>2010</strong>-<strong>2011</strong> APPROVED BUDGET
CITY OF SAGINAW,<strong>MI</strong>CHIGANPrepared by:Darnell Earley<strong>City</strong> ManagerYolanda M. JonesAssistant to the <strong>City</strong> Manager/<strong>Budget</strong>AdministratorHeather M. PozenelPayroll SpecialistTimothy R. MoralesAssistant <strong>City</strong> Manager forAdministrative ServicesShontaye R. BibbsAdministrative Support ClerkSpecial Acknowledgments:Diane Humphery-SnowdenExecutive Assistant to the <strong>City</strong> ManagerTracy BonnellApplication AnalystKaylene R. VanWagnerAccount Payable Coordinator<strong>2010</strong>-<strong>2011</strong> APPROVED BUDGET
This page is intentionally left blank
CITY OF SAGINAWTABLE OF CONTENTSPagePageINTRODUCTIONSPECIAL REVENUE FUNDS cont.<strong>City</strong> Manager Letter 1 Community Development Block Grant (SRF)How to Use the <strong>Budget</strong> Document 8 Comm. Development Block Grant (CDBG) 263Elected Officials 10 CDBG Residential Loans 274Organizational Chart 11 CDBG Rental Loans 279Organizational Structure 12 CDBG Block Grant Home Program 281Policies and Strategic Planning 16 CDBG Neighborhood Stab. Program 285Section 108 Loan 290BUDGET OVERVIEWSEDC Revolving Loan 292<strong>Budget</strong> and Finance 22 ENTERPRISE FUNDSResource Allocation 26Summary <strong>of</strong> Revenues 31 Celebration Park 295Summary <strong>of</strong> Expenditures 37 Parking Operations and Maintenance 299Expenditures by Category 43 Wave Pool Operations 305Summary <strong>of</strong> FTE Positions 45 Sewer Operations & Maintenance 307Undesignated Fund Balance 47 Water Operations & Maintenance 333GENERAL FUNDINTERNAL SERVICE FUNDSGeneral Fund Revenue Resource Allocation 49 Public Works Building 359Schedule <strong>of</strong> Ad-Valorem Taxable Value 50 Technical Services - GIS 364General Fund Revenue Summary 51 Technical Services - IS 369Revenue Analysis Summary 54 Radio Operations 374Revenue Analysis Detail 55 Motor Pool Operations 377General Fund Expenditures 60 Self-Insurance Fund 381General Fund Appropriation 61 Workers' Compensation Fund 384General Government 62Department <strong>of</strong> Fiscal Services 81 FIDUCIARY FUNDDepartment <strong>of</strong> Police 101Department <strong>of</strong> Fire 117 Unfunded Liabilities Fund 390Department <strong>of</strong> Development 132 Forest Lawn Cemetery 392Department <strong>of</strong> Public Services 139 Oakwood Cemetery 394Other General Fund 163 Police and Fire Pension Fund 396Bliss Park Expenditure Endowment 400SPECIAL REVENUE FUNDSDEBT SERVICE 402Street Funds (SRF)Major Streets Fund 164 CAPITAL IMPROVEMENT PLAN 406Local Streets Fund 187Rubbish Collection (SRF) 198 APPENDIXPublic Safety (SRF)Public Safety Fund 212 Community Pr<strong>of</strong>ile 445Public Safety Grants 220 Statiscal Section 471TIFA/LDFA/DDA (SRF) Glossary 475Andersen Enrichment Center 243GM Tower Payment 248Boat Launch 250TIFA/LDFA/Brownfields 253
INTRODUCTION
CITY OF SAGINAW1315 South Washington Avenue<strong>Saginaw</strong>, <strong>MI</strong> 48601-2599April 26, <strong>2010</strong>Honorable Mayor and <strong>City</strong> Council:In accordance with Section 43 <strong>of</strong> The Charter <strong>of</strong> the <strong>City</strong> <strong>of</strong> <strong>Saginaw</strong> and M.C.L.A. 141.421 et seq, theUniform <strong>Budget</strong>ing and Accounting Act, submitted to you is the <strong>City</strong> Manager’s Fiscal Year <strong>2011</strong>Approved <strong>Budget</strong>. The format <strong>of</strong> this budget document, you will notice, continues with improvementsthat have been made in past years. The purpose and intent is to publish a budget document that acts as apolicy statement, an operations guide, and a financial plan as well as a communication tool.The recommended budget reflects a “zero growth budget” that allocates very scarce resources towardfinancial and administrative stability and requires diligent review and monitoring throughout the fiscalyear.The major highlights <strong>of</strong> the fiscal year <strong>2011</strong> Approved <strong>Budget</strong> include:A General Fund budget total <strong>of</strong> $34,201,919 - This represents a “zero growth budget,” which actuallyequates to a decrease <strong>of</strong> $1,283,217 from the FY <strong>2010</strong> General Fund budget <strong>of</strong> $35,485,136.A recommended tax levy <strong>of</strong> 15.2508 mills – In <strong>2010</strong>, the tax levy is projected to increase .7127 millsfrom 2009. The General Fund property tax receipts will be limited by the gross revenue ceiling limitationin the <strong>City</strong> Charter.Millage Rate <strong>2010</strong><strong>City</strong> Operating 6.2976Trash Collections 2.9532Police & Fire Special Asmt. 6.0000Total 15.2508Rate <strong>of</strong> Growth <strong>of</strong> Property Tax Base – Proposal A (a 1994 amendment to the State constitution)requires that the increase in taxable value be capped at the Consumer Price Index or 5%, whichever isless, but shall not exceed state equalized value. For the <strong>2010</strong> tax year, the Proposal A cap is -.3%. As aresult <strong>of</strong> all these factors, and the overall decrease to state equalized value, the net taxable value decreasedby 11.3% from $685,551,914 to $607,971,876.General Fund staffing complement - The General Fund complement is anticipated to decrease by fourpositions in FY <strong>2011</strong>. Portions <strong>of</strong> two other positions were also eliminated from the general fund. Inactuality, eight positions were eliminated from the general fund; however, four positions were added as a1
esult <strong>of</strong> the staffing and efficiency study. Following are positional changes within the General Fundcomplement: the Chief Assistant <strong>City</strong> Attorney, one Clerical I position, the Property and MaintenanceSupervisor (Police Department), the Staff Pr<strong>of</strong>essional (Police Department), two part-time Property andSupply Clerks, Code Enforcement Inspector, and one Service Person Mechanic were eliminated. Theadded positions include one part-time HR Support Staff employee, an Administrative (<strong>Budget</strong>) Analyst,the Assistant <strong>City</strong> Manager for Public Safety, and a Technical Services Supervisor (Police Department).Since the General Fund continues to operate under declining financial resources, the <strong>City</strong> is unable toexpand its complement in other departments. The funding distribution <strong>of</strong> eleven positions is beingchanged based upon the type <strong>of</strong> activities that the individuals perform for the <strong>City</strong>. Following are thosechanges: 10% <strong>of</strong> the Director <strong>of</strong> Development and 30% <strong>of</strong> the Assistant Director, 50% <strong>of</strong> the LicensedInspector from the General Fund to the Neighborhood Stabilization Program Fund (NSP); 10% <strong>of</strong> a LaborForeman Streets/Building Operations from General Funds Building and Grounds Maintenance Division tothe Public Works Building Fund; 100% <strong>of</strong> a Traffic Electrician II, 50% <strong>of</strong> a Traffic Electrician, 100% <strong>of</strong> aTraffic Maintenance Technician, 30% <strong>of</strong> a Traffic Maintenance Technician II, 100% <strong>of</strong> a TrafficElectrician, 10% <strong>of</strong> a Traffic Maintenance Technician I from the General Fund to the Major and LocalStreets Funds.Non-General Funds account for 76% <strong>of</strong> the $140,407,556 <strong>City</strong> budget. Water and Sewer UtilityEnterprise Funds make up 40% <strong>of</strong> the total Non-General Fund spending with a combined budget <strong>of</strong>$56,861,399.This year’s budget message covers three major topic areas: <strong>Budget</strong> Preparation and Presentation, FY<strong>2011</strong> <strong>Budget</strong> Highlights, and a brief comment on the Public Safety Millage. The <strong>2011</strong> “zero growth”approach to spending is indicative <strong>of</strong> the economy in Michigan and has represented the direction <strong>of</strong>budget development and implementation in the <strong>City</strong> <strong>of</strong> <strong>Saginaw</strong> for the past two budget cycles. Exceptwhere inflationary differences, contractual obligations, and organizational changes have been noted, noother areas reflect significant budgetary changes.The <strong>2011</strong> Approved <strong>Budget</strong> also reflects the strategic planning efforts and priorities as discussed inongoing strategic planning sessions. Our intent for <strong>2011</strong> is to continue services at current levels, balancethe budget, retain staffing levels as much as possible, and at the same time continue the ongoingevaluation <strong>of</strong> the structure and efficiencies <strong>of</strong> all city departments. We have achieved that objective withthis approved spending plan. In order to retain current services for FY <strong>2011</strong>, approximately $750,000 <strong>of</strong>the undesignated fund balance will have to be appropriated to balance the budget. This is the same aswhat was projected to be used in the FY <strong>2010</strong> budget. As we project forward to the end <strong>of</strong> this currentfiscal year, we anticipate that because <strong>of</strong> diligent budgeting and monitoring, aggressive revenuecollections, and regular budget adjustments, expenditures will be balanced to revenues. This budget useis in compliance with the Uniform <strong>Budget</strong>ing and Accounting Act.<strong>Budget</strong> Preparation and PresentationThe FY <strong>2011</strong> <strong>Budget</strong> uses a format recommended by the Government Finance Officers Association <strong>of</strong> theU.S. and Canada and used by cities throughout the two countries. The document has been further refinedfor FY <strong>2011</strong> to make the budget useful as a management tool, communication device, and policydocument.2
FY <strong>2011</strong> <strong>Budget</strong> HighlightsGeneral Fund RevenuesThe following chart indicates the various General Fund Revenue Sources for <strong>2010</strong>/<strong>2011</strong> and the approvedrelative percentage supplied by each.<strong>2010</strong>/<strong>2011</strong> APPROVED BUDGETGENERAL FUND REVENUES3.57%2.85%0.72%5.40%1.28%25.72%3.97%11.77%35.32%Property Tax <strong>City</strong> Income Tax State Revenue SharingGrants Licenses, Permits, and Fees Changes for Service & SalesFines and Forfeiture Interest ReimbursementsOther Revenues9.41%Tax RateThe <strong>2011</strong> <strong>Budget</strong> calls for a total <strong>City</strong> tax levy <strong>of</strong> 15.2508 mills. This represents a .7127 increase in theoverall millage rate from 2009. Declining property values have resulted in a necessary higher millagerate.It is important to note that the ceiling <strong>of</strong> $3,828,778, as per the <strong>City</strong> <strong>of</strong> <strong>Saginaw</strong> Charter, has been reachedand thereby the maximum allowable general operating millage rate <strong>of</strong> 7.5000 has decreased to 6.2976.This is the result <strong>of</strong> the overall increase in the tax base <strong>of</strong> the <strong>City</strong> <strong>of</strong> <strong>Saginaw</strong> since 1979.Property Tax Millage RatesThe <strong>City</strong> Council has authority for the <strong>2010</strong>/<strong>2011</strong> fiscal year, to levy a tax rate <strong>of</strong> up to 15.2508 without avote <strong>of</strong> the citizens, as indicated below.Millage RateHistory 2005-2006 2006-2007 2007-2008 2008-2009 2009-<strong>2010</strong> <strong>2010</strong>-<strong>2011</strong><strong>City</strong>OperatingTrashCollectionPolice & FireSpecial Asmt.5.4185 5.2598 5.1701 5.3056 5.5849 6.29762.9532 2.9532 2.9532 2.9532 2.9532 2.95320.0000 6.0000 6.0000 6.0000 6.0000 6.00008.3717 14.2130 14.1233 14.2588 14.5381 15.25083
Tax ShiftThe taxable value <strong>of</strong> residential properties decreased from $445,170,091 to $388,236,562 a decrease <strong>of</strong>12.8%. The total taxable value projected for FY <strong>2011</strong> is $607,971,876 <strong>of</strong> which real property will be$514,330,876, and personal property will be $93,641,000.Income TaxThe Uniform <strong>City</strong> Income Tax Ordinance empowers the <strong>City</strong> to collect an income tax <strong>of</strong> one and one-halfpercent or three-quarters percent, depending on the individual residency status and/or place <strong>of</strong>employment. Income Tax revenue for FY <strong>2011</strong> is projected to be $12,079,000 (a 0.45% increase fromthe FY <strong>2010</strong> projection <strong>of</strong> $12,025,000). Income tax revenue relies heavily upon the financial health <strong>of</strong>businesses operating in the <strong>Saginaw</strong> area.It should be noted that $954,000 <strong>of</strong> the projected income tax revenue for <strong>2011</strong> is related to delinquenttaxes. As the <strong>City</strong> has been experiencing a decline in the Income Tax base and other revenue sources inprevious years, an aggressive approach towards delinquent revenue collections has been undertaken. Aspart <strong>of</strong> the process <strong>of</strong> collecting revenue owed to the <strong>City</strong>, departments throughout the <strong>City</strong> have beenworking with Plante & Moran, Inc. in the Department <strong>of</strong> Fiscal Services and other key personnel todevelop, implement, and structure the revenue collections effort. Going forward, it will be imperativethat the monies that are owed to the <strong>City</strong> be collected.Cost Allocation PlanIn an effort to accurately reflect the cost <strong>of</strong> providing and administering services in all departments, the<strong>City</strong> began completing a cost allocation plan annually in 2008. This was instituted because the <strong>City</strong>strives to continuously improve the budget process. The implementation <strong>of</strong> this plan has ensured thatcosts are spread equitably among <strong>City</strong> departments and administered accurately. The <strong>2011</strong> <strong>Budget</strong> reflectsthe continued use and updating <strong>of</strong> the cost allocation plan.Unfunded Liabilities/Retiree Health CareThe <strong>City</strong> <strong>of</strong> <strong>Saginaw</strong> provides post-employment health care coverage under a traditional insured plan toretired employees, their qualified spouses, and other dependents as mandated by collective bargainingagreements. Historically, the <strong>City</strong> has recognized the cost <strong>of</strong> this benefit on a “pay-as-you-go” basis forthose current recipients <strong>of</strong> the benefit, as well as pre-funding a portion <strong>of</strong> these future benefits.The Governmental Accounting Standards Board, which is the regulatory body responsible for establishingthe financial reporting requirement with which municipalities must comply, has changed the reportingstandards for post-employment health benefits through GASB Statement Number 45, Accounting andFinancial Reporting by Employers for Post Employment Benefits Other Than Pensions. This statementrequires governmental entities to begin reporting the Accrued Liability for retiree health care and otherpost employment benefits over a phase in period. The FY 2009 audit was the first audit affected byGASB 45. In addition, there are a variety <strong>of</strong> unfunded liabilities that are addressed and explained as part<strong>of</strong> the <strong>City</strong>’s fiscal year end audit.Pension FundingThe <strong>2011</strong> Approved <strong>Budget</strong> for the <strong>City</strong> includes all required contributions for employee pensionobligations.4
<strong>City</strong>wide ReorganizationIn FY <strong>2010</strong>, the <strong>City</strong> engaged the firm <strong>of</strong> Plante & Moran to perform a citywide staffing and efficiencyanalysis. Once the firm completed the analysis and made recommendations to the <strong>City</strong> ManagementTeam, the final study was presented to the <strong>City</strong> Council, and the Council was notified thatrecommendations on how to proceed would be presented in the coming weeks.During several <strong>City</strong> Council meetings, the <strong>City</strong> Manager and members <strong>of</strong> the implementation team madepresentations to the Council regarding recommendations for staffing and operational changes. Theimplementation team received input from department heads, union leaders, and staff regarding theefficiency study prior to making those recommendations. As a result <strong>of</strong> the first phase <strong>of</strong> implementation,the team was able to identify over $1 million in savings citywide, and those changes are reflected in thisbudget document.Recycling ProgramIn an effort to follow the guidelines <strong>of</strong> community sustainability and green initiatives, the <strong>City</strong> willoperate a recycling site at the Public Services Building for one day a month. Funds have also beenincluded in the <strong>2011</strong> <strong>Budget</strong> for its operational needs.Capital ImprovementsGeneral Fund capital improvement expenses have not been included in the FY <strong>2011</strong> budget. Due toeconomic conditions, not only within <strong>Saginaw</strong> but throughout the country, we have experienced asignificant decline in revenues and this trend is expected to continue in FY <strong>2011</strong>. The <strong>City</strong>’s goal is tocontinue to provide quality services to residents, and this cannot be accomplished this year if we havesignificant capital improvement projects. We have been able to balance this budget without a decrease in<strong>City</strong> services. This is a significant accomplishment as other local governments in Michigan have cutservice hours to citizens and have experienced significant job loss.The <strong>City</strong> will continue to work to maintain our service level. At the same time, we realize that somecapital improvement expenses are necessary. <strong>City</strong> administration continually strives to locate and utilizegrant funding for many <strong>of</strong> these projects, and will continue to do so going forward. Additionally, the <strong>City</strong>management team will continue to review all capital improvement requests and evaluate the urgency <strong>of</strong>those needs.Public Safety MillageDuring FY <strong>2011</strong>, the <strong>City</strong> will ask voters to approve the retention <strong>of</strong> the Public Safety Millage, andapprove an additional 1.5 mills. Approval <strong>of</strong> this millage and the additional funding will be vital to thecontinued viability <strong>of</strong> the <strong>City</strong>’s police and fire departments. The millage was originally passed in May <strong>of</strong>2006 at a rate <strong>of</strong> 6 mills, and revenue from the millage supports 31 police <strong>of</strong>ficers and 20 firefighters. Itis important to note that the personnel complement for public safety has not changed since the millagewas originally passed.For FY <strong>2011</strong>, the Public Safety Millage will generate approximately $3 million in revenue, while thePublic Safety Fund (205), which as established to account for personnel supported by the millage, willhave budgeted expenditures <strong>of</strong> approximately $3.8 million. The General Fund currently has to bear theburden <strong>of</strong> the gap between the millage revenue and the expenditures for the 51 public safety personnel.This gap will continue to grow if the <strong>City</strong> experiences the same decline in taxable value that it has the pasttwo years, along with continued rising health, salary, and pension costs.5
As I have stated throughout my tenure as <strong>City</strong> Manager, the management team, and Council mustcontinue to make the tough decisions now to place the <strong>City</strong> in a position where we do not have tocontinually react to economic changes, as many other Cities in Michigan are currently doing. Manyindividuals were involved in the restructuring that the <strong>City</strong> undertook during the past several months.That cooperation will have to continue throughout the coming years to move the <strong>City</strong> in the direction thatwe have envisioned. The goal <strong>of</strong> ensuring quality services where prudent, while pursuing an improvedfinancial condition for the <strong>City</strong>, will be a continuing priority. I am confident that this goal is manageableand achievable.Respectfully submittedDarnell Earley<strong>City</strong> Manager7
HOW TO USE THE BUDGET DOCUMENTThis page provides an explanation <strong>of</strong> the format and content <strong>of</strong> the Fiscal Year (FY) <strong>2010</strong>/<strong>2011</strong> Approved<strong>Budget</strong> document. To find the exact location <strong>of</strong> this information, please refer to the Table <strong>of</strong> Contents. Themajor portions <strong>of</strong> this document are described as follows:<strong>City</strong> Manager’s <strong>Budget</strong> MessageThe <strong>City</strong> Manager’s <strong>Budget</strong> Message highlights the major changes in <strong>City</strong> Services, policies, and requirementscontained in the <strong>2010</strong>/<strong>2011</strong> <strong>Budget</strong>.Policies and InitiativeThis section illustrates <strong>City</strong> Manager and Councilmanic goals and objectives, which provide direction andbudgetary decisions and allocations. Also, new and redirected policies are presented.Additional Introductory InformationThis introductory information consists <strong>of</strong> a pictorial presentation <strong>of</strong> the <strong>City</strong> Organizational Chart, ElectedOfficials, and Organizational Structure <strong>of</strong> the <strong>City</strong> <strong>of</strong> <strong>Saginaw</strong>.<strong>Budget</strong> OverviewContained within the <strong>Budget</strong> Overview is the <strong>Budget</strong> and Finance section. This section describes the financialand operating policies and procedures that guide the development <strong>of</strong> the <strong>City</strong>’s budget. Additionally, the<strong>Budget</strong> Summary section provides the reader a series <strong>of</strong> financial summaries with information on revenues,expenditures, and staffing levels for FY <strong>2010</strong>/<strong>2011</strong> and prior years.<strong>Budget</strong> DetailThese sections contain information on FY <strong>2010</strong>/<strong>2011</strong>, as well as historical revenue and expenditure informationfor the General, Special Revenue, Enterprise, Internal Service, and Fiduciary Funds operating budgets. Withineach is a brief description <strong>of</strong> the services, strategic goals and objectives, and relevant performance indicators.This detail <strong>of</strong> fund and corresponding department budgets is represented according to:• Description <strong>of</strong> individual programs• Summary <strong>of</strong> resources (projected revenue) and appropriations (proposed expenditures) – total fundbudget.• Line-item detail – provides detail <strong>of</strong> revenues and expenditures for FY 2007-2009 actual, FY <strong>2010</strong>Approved <strong>Budget</strong>, FY <strong>2010</strong> Adjusted <strong>Budget</strong>, <strong>2010</strong> Projected, and FY <strong>2011</strong> approved budget.• Revenue line items identify specific funding sources. Expenditure line items are categorized aspersonnel, operating, capital outlay, and miscellaneous. In accordance with the request <strong>of</strong> <strong>City</strong> Council,the following categories have been listed for “Other Services” on the Expenditure Detail pages:o Pr<strong>of</strong>essional Fees – covers all expenditures that are related to pr<strong>of</strong>essional services provided tothe <strong>City</strong>. This includes Pr<strong>of</strong>essional Services, Legal Services, Engineering Services, Employment8
Agency Fees, Operating Services, Labor Pr<strong>of</strong>essional Services, Insurance, WorkersCompensation Payments, and Advertising.o Maintenance Fees – covers all expenditures that are related to services performed or utilized.These fees include: Demolition, postage and freight, telephone/cell phone/pagers, printing,utilities, water/sewer, general repairs, motor pool charges, motor vehicle repairs, streetsresurfacing, equipment rental, rents and taxes, impounding fees, and other service fees.o Other Contracted Fees – covers all expenditures that are related to specific services,pr<strong>of</strong>essional organization, subscriptions, and employee enhancement. Examples <strong>of</strong> these costswould be: subscriptions, dues, recruitment fees, right-to-know expenses, claims and judgments,council meals, travel/meal/lodging, training and development, education reimbursements andother reimbursements.9
CITY OF SAGINAWELECTEDOFFICIALS<strong>City</strong> ManagerDarnell EarleyMayorGreg BranchMayor Pro-TemAmos O'NealCouncil MemberDennis BrowningCouncil MemberLarry CoulourisCouncil MemberDan FitzpatrickCouncil MemberAmanda KittermanCouncil MemberWilliam G. Scharffe, Ph.D.Council MemberPaul VirciglioCouncil MemberAndrew Wendt
<strong>City</strong> <strong>of</strong> <strong>Saginaw</strong>Organizational StructureThe <strong>City</strong> <strong>of</strong> <strong>Saginaw</strong> operates under the Council-Manager form <strong>of</strong> government. Nine Council members areelected on a non-partisan, at-large basis for four-year, overlapping terms. The Mayor is elected from the Councilby the Council at the first meeting after each election, for a two-year term. The <strong>City</strong> Council appoints the <strong>City</strong>Manager who in turn appoints all <strong>City</strong> employees and Department Heads. The <strong>City</strong> Manager, as the ChiefExecutive Officer, prepares and submits his/her budget to <strong>City</strong> Council for review and approval.Organizationally, the <strong>City</strong> Manager provides the institutional focus for planning, programming, and developingpolicy.The <strong>City</strong> Manager, as Chief Executive Officer, has the sole responsibility to select, direct, and oversee hisAdministration. As the head <strong>of</strong> the Executive/Administrative Branch <strong>of</strong> government, the <strong>City</strong> Manager isresponsible for conveying <strong>City</strong> Council instructions to department heads and division heads. With a top-downform <strong>of</strong> management, department heads and division heads are fully accountable for departmental operations.This includes overseeing supervisory line management to assure the <strong>City</strong>’s goals and priorities are met.The formal organizational structure <strong>of</strong> the <strong>City</strong> is comprised <strong>of</strong> General Government operations, Departments <strong>of</strong>Fiscal Services, Public Safety, Development, Public Services, and Technical Services. The largest organizationalcomponent within a department is the division. The structural design <strong>of</strong> the division is closely related to serviceoutput or function. Divisions provide separation <strong>of</strong> duties within each department. With responsibilitiesdelegated at such a definitive level, many divisions can be interpreted as local government programs, wherein the<strong>City</strong> places emphasis on the distribution <strong>of</strong> workloads to achieve a specific output. To evaluate this output, the<strong>Budget</strong> staff has incorporated policy objectives and performance measurements into the budget document toanalyze the effectiveness and efficiency <strong>of</strong> service delivery. Meeting organizational goals and objectives is theultimate outcome each department is attempting to achieve.To account for departmental and <strong>of</strong>fice fiscal transactions, the <strong>City</strong> utilizes the fund basis <strong>of</strong> accounting wherebyall governmental activities are accounted for through a series <strong>of</strong> distinct funds which include reporting entities tocontrol resources and demonstrates compliance with various legal and budget constraints affecting government.The General Fund accounts for all resources not otherwise devoted to specific activities and finances many <strong>of</strong> thebasic municipal functions. Other governmental funds include Special Revenue, Enterprise, Internal Service, andFiduciary Funds. The <strong>City</strong> also has several expendable Trust Funds. The budget is organized by fund and isfurther identified by revenue and expenditure details.Some departments combine the operations <strong>of</strong> more than one fund. The Department <strong>of</strong> Development combinesGeneral Fund operations with Community Development Block Grant (CDBG) Fund Operations as well as TaxIncrement Financing Authority (TIFA) and the Local Development Financing Authority (LDFA). The TechnicalServices Department combines the General Fund’s SGTV Division with the Internal Service Fund’s GeographicalInformation Systems and Information Services Funds. Additionally, the Department <strong>of</strong> Public Services combinesGeneral Fund Operations with Special Revenue Funds – Major and Local Streets, Rubbish Collection Fund,Andersen Enrichment Center, and Boat Launch, Enterprise Funds – Parking Operations, Sewer and WaterOperations and Maintenance Funds, and Internal Service Funds – Public Works Building, Radio Operation Fund,12
and the Motor Pool Operation Fund. All Enterprise Funds are owned and operated by the <strong>City</strong>, therefore, allrevenues go directly for those operations.The Offices <strong>of</strong> General Government and departments listed below are part <strong>of</strong> the General Fund with the exception<strong>of</strong> Special Revenue, Enterprise, Internal Service, and Fiduciary Funds. Further discussions regarding thedepartments will involve the roles <strong>of</strong> management and supervisory personnel.General Government encompasses five <strong>of</strong>fices, which include separate <strong>of</strong>fices for elected <strong>of</strong>ficials. The <strong>City</strong>Council Office is made up <strong>of</strong> nine at-large elected members headed by the Mayor. The Executive Assistant to the<strong>City</strong> Manager provides technical and administrative support to <strong>City</strong> Council. The Administrative Support Clerkassists the Executive Assistant to the <strong>City</strong> Manager with all related responsibilities.The Office <strong>of</strong> the <strong>City</strong> Manager is the administrative <strong>of</strong>fice for all administrative activities. The <strong>City</strong> Manager,who is appointed by <strong>City</strong> Council, is the highest-ranking <strong>of</strong>ficial. <strong>City</strong> Manager Office personnel include anAssistant to the <strong>City</strong> Manager/<strong>Budget</strong> Administrator, an Executive Assistant to the <strong>City</strong> Manager, and 50% <strong>of</strong> anAdministrative Support Clerk. Both administrative staff individuals conduct the day-to-day business for the<strong>of</strong>fice. The responsibilities <strong>of</strong> the <strong>City</strong> Manager are the supervision and coordination <strong>of</strong> the <strong>City</strong> administration inimplementing policies formulated by the <strong>City</strong> Council; preserving the health, safety, and general welfare <strong>of</strong>persons and property within the <strong>City</strong> <strong>of</strong> <strong>Saginaw</strong>; and enforcing the <strong>City</strong> Charter, <strong>City</strong> Ordinances, and applicableState and Federal Laws. Likewise, the primary responsibilities <strong>of</strong> this <strong>of</strong>fice are preparation <strong>of</strong> Council agendas;providing informational material and staff support to Council members; providing information to the generalpublic; submitting an annual recommended budget to the <strong>City</strong> Council; monitoring and facilitating the <strong>City</strong>’s Citi-Stat program; performing all administrative functions necessary for the operation <strong>of</strong> <strong>City</strong> government programsand services; and identifying and securing outside funding resources for <strong>City</strong> programs and projectsAn Employee Services Director heads the Employee Services Office. This individual manages the <strong>City</strong> humanresource operation, which includes maintenance <strong>of</strong> personnel records, recruitment for vacant positions, laboradministration and negotiation <strong>of</strong> collective bargaining contracts, equal employment opportunity, workerscompensation, health and safety, and administering the <strong>City</strong>’s benefit programs. There are five employees in this<strong>of</strong>fice – Director, Assistant Director <strong>of</strong> Employee Services, Benefits Coordinator, an Administrative Assistant,and an HR Support Staff. All individuals are considered non-union management.The <strong>City</strong> Clerk’s Office is headed by the <strong>City</strong> Clerk, who serves the <strong>City</strong> Council by recording and indexingminutes <strong>of</strong> Council meetings and handling correspondence needed as a result <strong>of</strong> <strong>of</strong>ficial Council action. The <strong>of</strong>ficeupdates codes and ordinances, maintains a legislative history <strong>of</strong> code changes, and indexes and files all legaldocuments pertaining to city business. The <strong>City</strong> Clerk serves as Clerk <strong>of</strong> the Civil Service Commission, operatesthe Charter mandated Bureau <strong>of</strong> Public Information and Complaints, and oversees the operation <strong>of</strong> the <strong>City</strong> Hallmail service, printing and <strong>of</strong>fice supplies sections. The <strong>of</strong>fice also administers city licensing functions andpublishes all legal notices, unless otherwise provided.The <strong>City</strong> Clerk’s Office also functions as the Election Office. The <strong>City</strong> Clerk, along with the Deputy <strong>City</strong> Clerkand other supporting staff, is also responsible for ballot preparation, issuance <strong>of</strong> absent voter ballots, delivery andset up <strong>of</strong> voting equipment, training <strong>of</strong> election board workers in proper election procedures, the processing <strong>of</strong>ballots in compliance with federal and state election laws and the maintenance <strong>of</strong> voter registration files.The <strong>City</strong> Attorney’s Office provides advice and counsel to the <strong>City</strong> Council, <strong>City</strong> Manager, department anddivision supervisors, and employees <strong>of</strong> the city on city-related business. In addition, the <strong>City</strong> Attorney’s Officeprovides assistance and counsel to the city’s boards and commissions, and it represents the <strong>City</strong> and cityemployees when they are sued for acts occurring in the course <strong>of</strong> their employment.13
The Department <strong>of</strong> Fiscal Services is comprised <strong>of</strong> 7 divisions: Administration, Office <strong>of</strong> the Controller,Purchasing, Treasury, Assessor’s Office, Income Tax, and Customer Accounting. The Assistant <strong>City</strong> Manager forAdministrative Services, who is responsible for financial planning, control and reporting for the <strong>City</strong> <strong>of</strong> <strong>Saginaw</strong>,heads the departments <strong>of</strong> Fiscal Services and Technical Services. Fiscal Services also provides administrativesupport in budgeting, financial planning, management, evaluation and forecasting necessary for administering<strong>City</strong> services and assisting all departments in their missions. The Assistant <strong>City</strong> Manager for AdministrativeServices is also responsible for conducting the day-to-day <strong>City</strong> business in the absence <strong>of</strong> the <strong>City</strong> Manager aswell as other duties as assigned by the <strong>City</strong> Manager.Starting in the <strong>2010</strong>/<strong>2011</strong> Approved <strong>Budget</strong>, the Assistant <strong>City</strong> Manager for Public Safety will head the Policeand Fire Departments. In the Police Department, the Chief, who is a management employee, reports directly tothe Assistant <strong>City</strong> Manager and oversees the Police Department. The total number <strong>of</strong> sworn <strong>of</strong>ficers in the PoliceDepartment is 105. The divisions within this department are: Administration, Police Patrol, Police Investigation,Criminal Investigation, Building and Maintenance, and Technical Support Divisions. The <strong>City</strong> <strong>of</strong> <strong>Saginaw</strong>utilizes the 12-hour shift for the Patrol Officers, which includes some <strong>of</strong> the Commanding Officers. In addition,in FY 2006, the <strong>City</strong> <strong>of</strong> <strong>Saginaw</strong> passed a public safety millage, which pays the salaries and benefits <strong>of</strong> 51 PoliceOfficers and Firefighters. The Police Department has 31 Patrol Officers paid through this mileage. The PublicSafety mileage is renewable in FY <strong>2011</strong>. The costs for these 51 individuals are reflected in the Public SafetyFund, which is a Special Revenue Fund.Similar to the Police Department, the Assistant <strong>City</strong> Manager for Public Safety, heads the Fire Department. TheFire Chief, reports directly to the Assistant <strong>City</strong> Manager, and three Battalion Chiefs, oversee the daily activities<strong>of</strong> this department. This department consists <strong>of</strong> five divisions: Administration, Fire Prevention, Fire Suppression,Fire Training, and Fire Apparatus Operations and Maintenance Divisions. The Fire Department hasapproximately 20 Firefighters who are paid from the Public Safety Mileage as with the Police Department. Thereare approximately 69 individuals in this department, wherein only the Chief is considered to be management.The Director <strong>of</strong> Development, who is accountable for all <strong>of</strong> the Community Development Block Grant (CDBG)programs and the Deputy Director <strong>of</strong> Development, supervise the Department <strong>of</strong> Development. The GeneralFund portion <strong>of</strong> this Department is composed <strong>of</strong> the Planning and Zoning division, which consists <strong>of</strong> an AssociatePlanner, 15% <strong>of</strong> the Director <strong>of</strong> Development, 50% <strong>of</strong> the Deputy Director <strong>of</strong> Development, and 10% <strong>of</strong> theSEDC Loan Support. Their main responsibility is to provide the comprehensive management structure for alldevelopment related activities. Further, these individuals oversee all planning and zoning activities <strong>of</strong> the <strong>City</strong>,including staff support to the Planning Commission and Zoning Board <strong>of</strong> Appeals. Staff also provides customerservice functions with regard to numerous zoning inquiries, site plan review, and other regulatory questions.The second division <strong>of</strong> the Department <strong>of</strong> Development is Inspections, which consists <strong>of</strong> a Licensed Inspector,Electrical Inspector, a Plumbing and Mechanical Inspector, one Code Enforcement Inspectors and an OfficeAssistant. The primary goal <strong>of</strong> this division is to protect the general health, safety, and welfare <strong>of</strong> the public byadministering and enforcing the <strong>City</strong>’s building, electrical, plumbing, mechanical, and other property codes. Thedivision is also responsible for managing the inspection staff assigned to the housing rehabilitation programdemolitions, and all ordinance enforcements, such as parking, weed, and environmental.A Director <strong>of</strong> Public Services heads the department <strong>of</strong> Public Services. This department makes up more than halfthe <strong>City</strong>’s workforce and spans multiple funds. The Department <strong>of</strong> Public Services consist <strong>of</strong> nine divisions withinthe General Fund – Cemeteries, Public Services - Administration, Engineering, Traffic Engineering, StreetLighting, Japanese Tea House, Recreation, Weed and Abatement, and Building Maintenance; five SpecialRevenue Funds: Major and Local Streets, Rubbish Collections, Andersen Enrichment Commission, and BoatLaunch; two Enterprise Funds: Sewer and Water Operations and Maintenance Services and Right <strong>of</strong> WayServices (only), and three Internal Service Funds: Public Works Building, Radio Operations, and Motor Pool14
Operations; and one Fiduciary Fund: Bliss Park Endowment. Many <strong>of</strong> the services provided in this departmentrequire a twenty-four hour, seven-day-per-week schedule. Crucial infrastructure services include traffic signalengineering, and general management <strong>of</strong> <strong>City</strong> streets in the event <strong>of</strong> an emergency.Effective July 1, city administration added the Director <strong>of</strong> Water and Wastewater Treatment. Both Water andWastewater Treatment Plants require a twenty-four hour, seven-day-per-week schedule. The crucial utilityinfrastructure services that are maintained around the clock include water and sewage facilities. Both the Director<strong>of</strong> Public Services and the Director <strong>of</strong> Water and Wastewater Treatment serve as an advisor to the <strong>City</strong> Managerregarding any serious conditions. This individual will also be responsible for the Water and Sewer Operation andMaintenance’s Process and Control divisions.A Director <strong>of</strong> Technical Services and a Deputy Director head the Technical Services Department. As previouslystated, the Director <strong>of</strong> Technical Services reports directly to the Assistant <strong>City</strong> Manager for AdministrativeServices. Technical Services provides Geographical Information System and Information Technology servicesfor all the <strong>City</strong> <strong>of</strong> <strong>Saginaw</strong>’s departments. Activities include telecommunications, cellular phones, computernetworking services, s<strong>of</strong>tware and hardware selection and installation, systems analysis and design, programming,problem resolution, end-user training, and on-line and batch processing. This department is also responsible forthe <strong>Saginaw</strong> Government Television (SGTV), which has been on the air since January 1988. The purpose <strong>of</strong> thestation is to provide residents with up-to-date information such as using a character generated list <strong>of</strong> <strong>City</strong>government services, activities, and events; live and taped telecasts <strong>of</strong> <strong>City</strong> Council Meetings and specialmeetings or news conferences; and public service announcements.The <strong>City</strong> is unique in providing a full array <strong>of</strong> services including utility operations. The <strong>City</strong> <strong>of</strong> <strong>Saginaw</strong> has usedan entrepreneurial approach to solving problems resulting in substantial savings to the <strong>City</strong> while meeting publicneeds. Through continual improvement in productivity, the Administration intends to expand services wherenecessary and minimize costs.15
CITY OF SAGINAW<strong>2010</strong>/<strong>2011</strong> APPROVED BUDGETPOLICIES AND STRATEGIC PLANNINGThe <strong>City</strong> Charter, the Uniform <strong>Budget</strong>ing and Accounting Act for State and Local Units <strong>of</strong> Government inMichigan, and the generally accepted accounting principles govern the <strong>City</strong> <strong>of</strong> <strong>Saginaw</strong> (<strong>City</strong>) budget policies.These laws provide for budget control, establish tax levy and assessment valuations limits, and provide forbonded debt limits. The <strong>City</strong>’s resources and appropriations policies are extensions <strong>of</strong> these laws, and followgenerally accepted accounting principles.LEGAL REQUIREMENTS:The <strong>City</strong> Charter (Section 43) states that by the last Monday <strong>of</strong> April, the <strong>City</strong> Manager shall submit to the <strong>City</strong>Council the proposed budget for the next fiscal year.Council shall by resolution, determine and adopt the budget and make the appropriations for the next fiscal yearand shall provide, by resolution, for a tax levy <strong>of</strong> the amount necessary to be raised by taxation at least thirty daysprior to the first day <strong>of</strong> the upcoming fiscal year. In accordance with Public Act 5 <strong>of</strong> 1982 as amended, a publichearing shall be held prior to levying <strong>of</strong> an additional millage rates (Truth and Taxation) and the adoption <strong>of</strong> thenext fiscal year budget by the council, as such time and place as the council shall direct. The city clerk shallpublish the notice <strong>of</strong> public hearing at least one week in advance.The amount <strong>of</strong> property taxes that may be levied by the city in any year shall not exceed three-quarters <strong>of</strong> onepercent <strong>of</strong> the assessed valuation as equalized <strong>of</strong> all taxable real and personal property <strong>of</strong> the city. If the assessedvalue <strong>of</strong> all the property in the city as determined on the first Monday in May, 1979, is increased in subsequentyears for any reason, the maximum millage rate provided herein shall be permanently reduced to yield the samegross dollar revenue as the fiscal year 1978-79 property tax revenue yield (Section 45 <strong>of</strong> <strong>City</strong> <strong>of</strong> <strong>Saginaw</strong>Charter).The <strong>City</strong> is also required by the State <strong>of</strong> Michigan to present a balanced budget. An appropriation resolutioncannot be adopted that would cause total expenditures, including accrued deficit, to exceed total revenues, toinclude any available surplus, Section 16 <strong>of</strong> Public Act 621 <strong>of</strong> 1978.FINANCIAL (BUDGET) POLICIES:The <strong>City</strong> <strong>of</strong> <strong>Saginaw</strong>’s financial policies have been established for the overall fiscal management <strong>of</strong> the <strong>City</strong>.These policies operate independently <strong>of</strong> changing circumstances and conditions. These policies provide theframework to assist the decision-making process for the Council and Administration.The following policies provide guidelines to evaluate current services as well as proposals for future projects andprograms:• The budget will determine how much money is available. It will then allocate these resources among thehighest priorities that have been established by <strong>City</strong> Council at the <strong>City</strong>’s Strategic Planning Sessions.• Expanding an existing service program or adding a new service or program will only be considered whena new revenue source has been identified or can be supported through the requesting departmentsidentification <strong>of</strong> an existing service that can be reduced or eliminated. Programs that are financed throughgrant money shall be budgeted in special revenue funds, and when grant revenues are reduced oreliminated, the service program shall be adjusted accordingly.• The budget is balanced and the <strong>City</strong> shall maintain a balanced budget in which estimated revenues andfund balance reserves are equal to or greater than estimated expenditures.16
• The <strong>City</strong> will maintain a budgetary control system to ensure adherence to the budget and will preparemonthly reports comparing actual revenues and expenditures to budgeted amounts.• The <strong>City</strong> will monitor departmental expenditures on a monthly basis to ensure conformity to budgets anddecide on actions to bring the budget into balance, if necessary.• The <strong>City</strong> will integrate performance measurement within the budget.• The <strong>City</strong> will avoid budgetary practices or procedures that balance current period expenditures at theexpense <strong>of</strong> future years’ revenues.• The budget will provide for adequate levels <strong>of</strong> funding for all retirement systems.• The <strong>City</strong> will develop and maintain accounting and budgetary control systems to adequately safeguard theassets held in public trust.• The <strong>City</strong> will finance essential <strong>City</strong> services, which have a citywide benefit from revenue sources, whichare generated from property taxes, special assessments, State Shared Revenues, and various fees.• For Enterprise Funds, user fee rate structures will be reassessed to accurately charge the cost <strong>of</strong> servicesprovided to the customers.Operating <strong>Budget</strong> Policies:The operating budget for the city is based on the principle <strong>of</strong> financing current expenditures with current revenuesor available and undesignated fund balance. Expenditures shall include adequate funding <strong>of</strong> the retirementsystems (Municipal Employee Retirement Systems and Police and Fire Pension Systems), and adequatemaintenance and replacement <strong>of</strong> capital assets and operating expenditures.<strong>Budget</strong>ed expenditures will reflect the <strong>City</strong>’s perceived administrative needs and recommended council strategiclong – term goals and objectives. The budget will be based on generally accepted accounting principles.Transfers <strong>of</strong> Appropriations:<strong>City</strong> Council Authority - After the budget has been adopted, no money shall be drawn from the treasury <strong>of</strong> thecity, nor shall be obligations for the expenditures <strong>of</strong> money incurred, except pursuant to a budget appropriation.The council may transfer any unencumbered appropriation balance or any portion there<strong>of</strong> from one department,fund, or agency to another.Transfers shall require <strong>City</strong> Council approval if the transfer will result in an increase or decrease in theappropriation as set forth in the annual budget resolution.All transfers from the General Fund Contingent Appropriation account shall require <strong>City</strong> Council approvalregardless <strong>of</strong> the amount.<strong>City</strong> Manager Authority – The <strong>City</strong> Manager is empowered to transfer appropriations within appropriationcenters. General Fund line item budget transfers from one account to another within the same appropriationcenter can be made without <strong>City</strong> Council approval. All budget transfers from one appropriation center to anotheror from the General Fund Contingent Appropriation account must be approved by <strong>City</strong> Council. In all otherfunds, line item budget transfers from one account to another within the same department and fund can be madewithout <strong>City</strong> Council approval.17
<strong>Budget</strong> Controls:At the beginning <strong>of</strong> each quarterly period during the fiscal year, and more <strong>of</strong>ten if required by council, the <strong>City</strong>Manager shall submit to the council data showing the relation between the estimated and actual revenue andexpenditure to date; and if it shall appear that the revenue is less than anticipated, the council or <strong>City</strong> Managermay reduce appropriations for any item or items, except amounts required for debt and interest charges, to such adegree as may be necessary to keep expenditures within the cash revenues. If revenues exceed the amountsestimated in the budget, the council may make supplemental appropriations. The <strong>City</strong> Manager may provide formonthly or quarterly allotments <strong>of</strong> appropriations to departments, funds, or agencies under his control.REVENUE POLICIES:• The <strong>City</strong> will attempt to maintain a diversified and stable revenue base to shelter itself against short-termand long-term fluctuations.• Annual revenues will be projected by an objective and thorough analytical process.• The <strong>City</strong> will establish user charges and shall set fees for services for enterprise funds at a level that fullysupports operational and capital outlay costs and activitiesACCOUNTING, AUDITING, AND FINANCIAL REPORTING POLICIES:• An independent audit will be performed annually.• The <strong>City</strong> will complete an annual audit report in accordance with Generally Accepted AccountingPrinciples (GAAP).CAPITAL IMPROVEMENT PLAN• The <strong>City</strong>’s Capital Improvement Plan shall be developed to reflect the strategic objectives <strong>of</strong> <strong>City</strong> Counciland <strong>City</strong> Administration.• The <strong>City</strong> shall on an annual basis update its multi-year capital improvement plan including proposed fundsources.• The <strong>City</strong> will coordinate decision-making for capital improvement budget with the operating budget tomake effective use <strong>of</strong> the <strong>City</strong>’s limited resources for operating and maintaining existing services andfacilities.STRATEGIC PLANNINGThe <strong>City</strong> <strong>of</strong> <strong>Saginaw</strong>’s <strong>City</strong> Council and the Management Team meet twice a year, January and July, to discussand prioritize the city’s goals and objectives for the year. The following five goals and objectives have beenestablished, and are reflected in the <strong>2011</strong> Approved <strong>Budget</strong>. Funding has been earmarked to meet these goals andobjectives.Crime and Public Safety IssuesIn fiscal year <strong>2011</strong>, the <strong>City</strong> <strong>of</strong> <strong>Saginaw</strong> (<strong>City</strong>) has projected to spend $26,802,640 to address crime andpublic safety issues.18
Goal: Council and Administration’s primary goal is to create a safe place to live, work, and play for allcitizens in the <strong>City</strong>.In an effort to further improve safety within the <strong>City</strong>, a 12-hour shift for the police department wasimplemented in fiscal year 2008. The implementation <strong>of</strong> the 12-hour shift was intended to reduce overtimeincurred. Twelve-hour shifts will continue to be utilized in fiscal year <strong>2011</strong>.As an alternative source <strong>of</strong> revenues in which to further combat and address crime and public safety, the <strong>City</strong>continues to actively pursue federal and state grants. During FY <strong>2010</strong>, the city was awarded the COPS HiringGrant, which added five new <strong>of</strong>ficers to the sworn complement. In addition, the <strong>City</strong> has received substantialmonies for technology through ShotSpotter, and the Department <strong>of</strong> Justice Grant.• Weed and Seed Grant first awarded in fiscal year 2009 (fiscal <strong>2011</strong> $42,000), is intended to “weed”out crime and provide guidance to <strong>Saginaw</strong> area youth. This grant will span three-years.• ShotSpotter Technology Grant awarded in FY 2009 in the amount <strong>of</strong> $266,439 is intended to utilizesound technology to identify gunshot fire within a specific location. This technology allows thePolice Department to respond quickly to the occurrences. The Police Administration is in theprocess <strong>of</strong> pursuing additional grant funding to expand this technology to more high crime locationswithin the <strong>City</strong>. For <strong>2011</strong>, the <strong>City</strong>’s Police Department will be awarded an additional $300,000 fortechnology.• Department <strong>of</strong> Justice Grant – Justice Assistance Grant (J.A.G.) (originally $546,196), is an interjurisdictionalgrant that was awarded in cooperation with <strong>Saginaw</strong> County and other surroundingcities. This grant is intended to support all components <strong>of</strong> the criminal justice system. J.A.G. fundedprojects may address crime through the provision <strong>of</strong> services directly to individuals and/orcommunities and by improving the effectiveness and efficiencies <strong>of</strong> criminal justice systems,process, and procedures. The <strong>City</strong> allocates $349,759, for the <strong>2011</strong> Proposed <strong>Budget</strong>.• COPS Hiring Recovery Program, ($1,126,000), requires that the <strong>City</strong> hire five additional police<strong>of</strong>ficers. This program allows the <strong>City</strong> to further enhance the <strong>City</strong>’s Community Policing Program.Beginning in February <strong>2010</strong>, these <strong>of</strong>ficers were added to the personnel complement. The<strong>2010</strong>/<strong>2011</strong> <strong>Budget</strong> allocates approximately $342,836 for this program.Neighborhood Revitalization and <strong>City</strong> BeautificationThe <strong>2010</strong>/<strong>2011</strong> Approved <strong>Budget</strong> allocates $12,054,458 to continue to address neighborhood revitalizationand city beautification.Goal: Neighborhood Revitalizations and <strong>City</strong> Beautification.There are multiple key objectives that the <strong>City</strong> has determined that should be achieved in order to strengthenneighborhood revitalization and city beautification:• Elimination <strong>of</strong> blight• Improve quality <strong>of</strong> life• Continue to build strong relationships between the <strong>City</strong> and Neighborhood Associations• Attract new businesses through promoting the <strong>City</strong> <strong>of</strong> <strong>Saginaw</strong> as an excellent place to live, work,and play• Build a stable, livable, clean and well-kept communityThe <strong>City</strong>’s Department <strong>of</strong> Development has actively pursued and been awarded grants to address the longtermgoal and objective <strong>of</strong> neighborhood revitalization and city beautification.19
During FY <strong>2010</strong> the <strong>City</strong> was awarded the Neighborhood Stabilization Program Grant, in the amount <strong>of</strong>$957,000 from the Michigan State Housing Development Authority. These monies will help the <strong>City</strong> toacquire and redevelop foreclosed properties as well as demolish blighted structures. These monies wereawarded to the <strong>City</strong> based on the number <strong>of</strong> foreclosed and abandoned properties that are within thecommunity.The Department <strong>of</strong> Development also secured the Neighborhood Stabilization Program II (NSPII), a threeyeargrant, which was developed through the American Recovery and Reinvestment Act <strong>of</strong> 2009, in theamount <strong>of</strong> $17.4 million. These monies will help the <strong>City</strong> target and reconnect neighborhoods, rapidly arrestdecline, assure compliance with the Neighborhood Stabilization Program, ensure long-term affordability,support projects that optimize economic activity, and leverages resources to removes destabilizing influences.The <strong>City</strong> will work in conjunction with the <strong>Saginaw</strong> County Land Bank to ensure that the monies will bespent within the appropriate time.In addition, the Department <strong>of</strong> Development is expected to spend approximately $64,500 in FY <strong>2011</strong> for theupdating <strong>of</strong> the <strong>City</strong> <strong>of</strong> <strong>Saginaw</strong>’s Master Plan. This plan has not been updated since 2003.Through the creation <strong>of</strong> the <strong>Saginaw</strong> Code Enforcement Neighborhood Improvement Cooperative (SCENIC),the <strong>City</strong> has been able to deal with blight in the community, improve the quality <strong>of</strong> life for its citizens, anddevelop positive relationships with neighborhood associations. The SCENIC team was formed andimplemented in June 2008. Over the last two years, SCENIC has been very instrumental and effective inaddressing situations that would have otherwise had a negative impact in the community. One <strong>of</strong> the mostnoteworthy accomplishments for the SCENIC team has been their ability to foster an environment that haslead to the establishment <strong>of</strong> several new neighborhood organizations and motivated many existingorganizations. This team provides a communication link between <strong>City</strong> Hall and residents.Recreational Offering and Youth ActivitiesIn fiscal year <strong>2011</strong>, the <strong>City</strong> is projected to spend $916,000 towards recreational <strong>of</strong>fering and youth activities.Goal: To make <strong>Saginaw</strong> a safe place to live, work, and play.Recreational <strong>of</strong>fering and youth activities are the third priority <strong>of</strong> the <strong>City</strong>. In an effort to address this priority,the <strong>City</strong> is currently working on the Frank N. Andersen - Celebration Park. Celebration Park, formerly knownas Andersen Water Park is one <strong>of</strong> the largest recreational projects currently under construction. So far, the<strong>City</strong> <strong>of</strong> <strong>Saginaw</strong> has received approximately $1,622,000 in donations for the parks construction. In fiscal year<strong>2011</strong>, the <strong>City</strong> will budget $886,000 for continued construction and completion.Celebration Park will be a community park that will be comfortable and easily accessible with shaded areas,walking paths, and leisure activities. It will contain a variety <strong>of</strong> activities and learning experiences, and takesadvantage <strong>of</strong> the natural surroundings. The park will provide a relaxed setting for social interaction and willfocus on improving the community and the families that live here. The new park will feature a water splashpark, skateboarding plaza, playground, and a scenic boardwalk along Lake Linton, bocce ball courts,volleyball courts, picnic pavilion, exercise paths, and open green space. Best <strong>of</strong> all, the park is free to thepublic.Another program that has demonstrated positive results for the youth in the <strong>City</strong> is the Summer RecreationalProgram through First Ward Community Center. In fiscal year <strong>2011</strong>, the <strong>City</strong> will designate $30,000 for theSummer Recreational Program. This program is for youth grades kindergarten through 12 th . This programprovides a variety <strong>of</strong> activities including organized basketball leagues, soccer, table tennis, billiards, boardgames, health and fitness activities, art and cultural classes, drug and violence prevention classes, Boy Scouts,Girl Scouts, summer reading program, and library and field trips.20
Maintain and Enhance <strong>City</strong> Revenue EffortsIn fiscal year <strong>2011</strong>, the <strong>City</strong> has projected to spend $67,000 to maintain and enhance <strong>City</strong> revenue efforts.Goal: Maintain and improve financial health <strong>of</strong> the <strong>City</strong>.Through the development and the implementation <strong>of</strong> the <strong>City</strong>’s budget, the <strong>City</strong> Council and the ManagementTeam have been able to address the issue <strong>of</strong> financial stability. The <strong>City</strong> Manager’s approved budgetdemonstrates a long-term sound financial plan that reflects “zero growth.” <strong>City</strong> administration recognizes theneed to re-evaluate the way that business can be completed within the <strong>City</strong> without affecting current servicedelivery levels to citizens. The <strong>City</strong> Manager’s approved budget recognizes the fact that there will be revenueshortfalls and that expenditures will continue to rise due to the normal cost <strong>of</strong> living. <strong>City</strong> administration,through the next few budget cycles, will have to evaluate the following: retirement benefits; funding for the<strong>City</strong>’s Other Post Employee Benefits (OPEB); updating fee structures, improving revenue collections, and theremoval <strong>of</strong> the archaic property tax cap.The first step towards maintaining and improving financial stability and health began in 2009 in theDepartment <strong>of</strong> Fiscal Services, Controller’s Office. The controller’s <strong>of</strong>fice was altered to reflect therestructuring <strong>of</strong> the General Ledger Accounting Maintenance function with the hiring <strong>of</strong> Plante & Moran, Inc.After one year, the <strong>City</strong> has already addressed multiple issues that it faced prior to 2009. One specific issuewas the enormous accounts receivable outstanding balance. In fiscal year <strong>2010</strong>, the <strong>City</strong> now has the abilityto re-bill and adjust accounts receivables for monies that were owed, but not yet paid. Through therestructuring <strong>of</strong> the controller’s <strong>of</strong>fice, the <strong>City</strong> is now able to react to financial problems in a timely manneras well as make decisions based on sound and up-to-date financial information.Additionally, the Department <strong>of</strong> Fiscal Services, in fiscal year <strong>2011</strong>, will continue to place strong emphasis ondelinquent personal property taxes. In the State <strong>of</strong> Michigan, the local municipalities are responsible for thecollection <strong>of</strong> delinquent personal property taxes; the County is responsible for ensuring compliance withdelinquent real property taxes. For the <strong>City</strong> <strong>of</strong> <strong>Saginaw</strong>, delinquent personal property, as with the accountsreceivables, has been an on-going concern. The Department <strong>of</strong> Fiscal Services will utilize current staff in aneffort to aggressively pursue and collect delinquent personal property taxes.Organizational DevelopmentIn fiscal year <strong>2011</strong>, the <strong>City</strong> has projected to spend $18,000 towards organizational development.Goal: Provide effective and efficient delivery <strong>of</strong> services to the citizens <strong>of</strong> the <strong>City</strong> <strong>of</strong> <strong>Saginaw</strong>.Over the past several years, the <strong>City</strong> has changed the manner in which it does business. However, theorganizational structure <strong>of</strong> city departments has not necessarily been adjusted to reflect those new or modifiedduties. One <strong>of</strong> the <strong>City</strong>’s goals is to determine the efficiency and effectiveness <strong>of</strong> operations and eliminateredundancy, which will allow for the best utilization <strong>of</strong> employees and resources.In <strong>2010</strong>, the city administration focused on achieving this very goal <strong>of</strong> providing effective and efficientdelivery <strong>of</strong> services to the citizens <strong>of</strong> <strong>Saginaw</strong> as well as ensuring that the city has the ability to provide theseservices. In November/December <strong>of</strong> 2009, city administration contracted with Plante & Moran Consulting toperform a citywide staffing and efficiency review. The results <strong>of</strong> that analysis were presented to the Councilduring the January strategic planning session. Subsequently, the management team conducted an in depthreview <strong>of</strong> all the recommendations and assessed their impact on <strong>City</strong> operations and service delivery, as wellas the potential savings the changes would provide. The <strong>2010</strong>/<strong>2011</strong> Approved <strong>Budget</strong> reflects some <strong>of</strong> therecommendations.21
BUDGET OVERVIEW
BUDGET AND FINANCESCOPE OF THE BUDGETThe <strong>City</strong> <strong>of</strong> <strong>Saginaw</strong> budget policies are governed by the <strong>City</strong> Charter, the Uniform <strong>Budget</strong>ing and Accounting Act forLocal Units <strong>of</strong> Government in Michigan, and generally accepted accounting principles. These laws provide for budgetcontrol, establish tax levy and assessment valuation limits, and provide for bonded debt limits. The <strong>City</strong>’s resources andappropriations policies are extensions <strong>of</strong> these laws, and follow generally accepted accounting and budgeting principles.The budget for the <strong>City</strong> <strong>of</strong> <strong>Saginaw</strong> is a multifaceted document that expresses spending policy for the fiscal year,illustrates a resource allocation plan for the Administration to implement, and provides a means <strong>of</strong> communicationbetween citizens and elected <strong>of</strong>ficials.The budget spells out a management strategy through specific objectives designed to provide the best services at the mostefficient cost. With regards to the delivery <strong>of</strong> services, these objectives must produce measurable results as keyindicators <strong>of</strong> the effectiveness and efficiency <strong>of</strong> government policies and programs. Programs must be evaluated everyyear to determine their legitimacy since limited resources must be allocated between existing programs and the need fornew ones.In summary, the budget is a policy document, a financial plan, an operations guide, and a communicative device. Thetrue art <strong>of</strong> budgeting reflects a combination <strong>of</strong> leadership, independent judgment, competent administration, andcooperation between various branches <strong>of</strong> <strong>City</strong> government.<strong>Budget</strong> ProcessThe Office <strong>of</strong> the <strong>City</strong> Manager compiles the budget for the <strong>City</strong>. The fiscal year for the <strong>City</strong> <strong>of</strong> <strong>Saginaw</strong> is July 1 toJune 30. The actual budget preparation process gets underway in early December. One important element <strong>of</strong> this processis a cooperative effort between the Office <strong>of</strong> the <strong>City</strong> Manager and other departments within <strong>City</strong> government.During the first week <strong>of</strong> December, the <strong>Budget</strong> Preparation Manual is distributed to all departments/<strong>of</strong>fices for use inestablishing expenditure requests. The <strong>City</strong> uses an incremental budget technique in arriving at the requested figures.Incremental budgeting emphasizes changes in the costs <strong>of</strong> providing <strong>City</strong> services based on competing priorities. Toevaluate these priorities, departments/<strong>of</strong>fices examine historical trends <strong>of</strong> line-item costs using a five-year cost analysis todetermine the needs <strong>of</strong> the department/<strong>of</strong>fice for the upcoming year. The department’s requests are data entered ontocomputerized budgetary spreadsheets that categorically incorporate requests into a singular format, distinguishingexpenditures in the following manner: Personnel, Operating, Debt Service, Miscellaneous, and Capital Outlay. Once allthe data is prepared, it is returned to the Office <strong>of</strong> the <strong>City</strong> Manager. The Assistant to the <strong>City</strong> Manager/<strong>Budget</strong>Administrator and budget staff review all requests for accuracy and completeness. During the month <strong>of</strong> January, theAssistant to the <strong>City</strong> Manager/<strong>Budget</strong> Administrator meets with all department heads to review and acquire additionalinformation for the data provided. The draft and recommendations are then forwarded to the <strong>City</strong> Manager for hisreview. In late February – early March budget hearings are held with each department as forums where departmentdirectors can substantiate their expenditure projections and justify their requests.Forms are prepared and submitted to all department directors for use in developing projections for anticipated revenuesfor the ensuing year. The Assistant to the <strong>City</strong> Manager/<strong>Budget</strong> Administrator prepares the revenue projections forpresentation to the <strong>City</strong> Manager, who will evaluate the budget gap between revenue projections and expenditurerequests. The <strong>City</strong> Manager then provides guidance as to the most viable means to balance the budget. Decisionsregarding revenues and expenditures, after the balancing <strong>of</strong> the budget, are then incorporated into the proposed budgetdocument.Pursuant to the <strong>City</strong> Charter Chapter VII, Section 43, the <strong>City</strong> Manager’s Recommended <strong>Budget</strong> is presented to <strong>City</strong>Council on or before the last Monday in April.Pursuant to the <strong>City</strong> <strong>of</strong> <strong>Saginaw</strong> <strong>City</strong> Charter Chapter VII, Section 44, the council shall hold a public hearing on thebudget before its final adoption.22
<strong>City</strong> Council then makes appropriations and adopts the budget by ordinance no later than thirty days prior to the end <strong>of</strong>the fiscal year.<strong>Budget</strong> CalendarDecember • Department head meeting for <strong>Budget</strong> Kick<strong>of</strong>f• Distribute budget instructions, calendar, and narratives• Prepare and distribute revenue and expenditure manuals• Snapshot <strong>of</strong> Personnel and Pension modules <strong>of</strong> the <strong>City</strong>’s Financial SystemJanuary • Personnel manuals distributed to Departments• <strong>Budget</strong> staff meets with DepartmentsFebruary • Prepare a preliminary summary statement <strong>of</strong> projected revenue vs. expenditurerequests• Preliminary summary <strong>of</strong> projected revenue and expenditure requests presented to<strong>City</strong> Manager for review• <strong>City</strong> Manager meets with DepartmentsMarch • <strong>City</strong> Manager meets with Departments (continues)• 1 st and 2 nd rounds <strong>of</strong> budget review with <strong>City</strong> Manager and <strong>Budget</strong> staffApril • <strong>City</strong> Manager’s Proposed <strong>Budget</strong> presented to <strong>City</strong> Council• Development and printing <strong>of</strong> the FY Proposed <strong>Budget</strong>May • Councilmanic budget hearing and adoptionRevenue ProjectionsUsing actual and projected data, various analyses are performed by the Assistant to the <strong>City</strong> Manager/<strong>Budget</strong>Administrator and staff to project revenues. Revenue estimates are based on four different projection methods whichincorporate growth rates over the previous ten years, current year receipts, collection rates where applicable, andimportant input from all departments. Each projection method is tested against actual prior year revenues to determinevalidity and reasonability. These tests are conducted at the revenue line item (detail) level, and only the projectionmethods deemed valid and reasonable are utilized. In addition, in accordance with the Uniform <strong>Budget</strong>ing andAccounting Act, all one-time revenue sources are given appropriate consideration.Revenue Projection MethodsMethod 1: 7 year Average Growth Rate x 2009 Actual Revenues at June 30, 2009The seven-year average growth rate from 2002 – 2009 multiplied by 2009 actual revenues is used as aprojection for the <strong>2010</strong> revenues. By utilizing the average growth rate for an additional year, the <strong>2011</strong>revenues are projected.Method 2:<strong>2010</strong> Actual Revenues at December 31, 2009 / 6 months x 12 monthsA monthly average <strong>of</strong> current year revenues is calculated based on six months <strong>of</strong> receipts, which are thenannualized to project current year revenues. Based on revenue trends and this method <strong>of</strong> projection for<strong>2010</strong> revenues, <strong>2011</strong> revenues are projected. (Please note as more information is provided the revenuesare further altered).Method 3: <strong>2010</strong> Actual Revenues at December 31, 2009 / (2009 Actual Revenues at December 31, 2008 / 2009Actual Revenues at June 30, 2009)A percent <strong>of</strong> <strong>2010</strong> revenues are determined from revenues receipts at December 31, 2009. The <strong>2010</strong>revenues at December 31, 2009, are divided by the percentage collected December 31, 2008, to project23
evenues for <strong>2010</strong>. By reviewing revenue trends in conjunction with this method <strong>of</strong> projections for <strong>2010</strong>revenues, the <strong>2011</strong> revenues are projected.Method 4:Percentage <strong>of</strong> 2009 Revenue budget collected at June 30, 2009 x <strong>2010</strong> <strong>Budget</strong><strong>2010</strong> revenues can be projected by multiplying the percentage <strong>of</strong> 2009 <strong>Budget</strong>, which was collected atJune 30, 2009, times the <strong>2010</strong> <strong>Budget</strong>. By reviewing the historical actual to budget ratios, assumptionscan be determined to assist in <strong>2011</strong> revenue projections.<strong>Budget</strong>s and <strong>Budget</strong>ary AccountingThe <strong>City</strong> Charter requires the <strong>City</strong> Council, by resolution, to determine and adopt the budget and make the appropriationsfor the next fiscal year and to provide, by resolution, for a tax levy <strong>of</strong> the amount necessary to be raised by taxation atleast 30 days prior to the first day <strong>of</strong> the upcoming fiscal year. <strong>Budget</strong>ary control is exercised at the department(appropriation center) level in the General Fund and at the fund level for all other budgeted funds. General Fund lineitem budget transfers from one account to another within the same appropriation center can be made without <strong>City</strong>Council approval. All budget transfers from one appropriation center to another or from the General Fund ContingentAppropriation account must be approved by <strong>City</strong> Council. In all other funds, line item budget transfers from one accountto another within the same department and fund can be made without <strong>City</strong> Council approval.All unencumbered appropriations lapse at the end <strong>of</strong> the fiscal year unless specific requests to reserve funds for capitalitems are made by the departments and approved by the Assistant <strong>City</strong> Manger for Administrative Services or theAssistant to the <strong>City</strong> Manager/<strong>Budget</strong> Administrator. The subsequent fiscal year’s budget is then amended when theseexpenditures are recorded. Encumbrances outstanding at June 30 do not lapse but are brought forward to the new fiscalyear, unless the fund ends in a deficit. In accordance with the Uniform <strong>Budget</strong>ing and Accounting Act, all encumbrances<strong>of</strong> the fund are cancelled and expenditures are assessed against the next year’s budget.The General, Community Development, Major Streets, Local Streets, Rubbish Collection, Police Grants, DrugForfeiture, Andersen Center Operation, Boat Launch Operation, and Special Revenue Funds are under formal budgetarycontrol as is required by Michigan Public Act 621. <strong>Budget</strong>s shown in the financial statements were prepared on themodified accrual basis. This is the same basis used to reflect actual results and consists only <strong>of</strong> those amounts containedin the formal budget approved by <strong>City</strong> Council. Special Revenue Funds are considered to be departments for budgetarypurposes. All Enterprise and Internal Service Funds are budgeted annually for internal control purposes only. <strong>Budget</strong>aryinformation for these funds is not required in the financial statements. However, the <strong>City</strong> Charter requires that all fundsexcept for Inventory and Trust and Agency Funds be approved by <strong>City</strong> Council.Cash and Cash EquivalentsCash and cash equivalents for all funds include amounts in demand deposits, petty cash, and certain investments whichare payable upon the demand <strong>of</strong> the <strong>City</strong> and have an original maturity <strong>of</strong> three months or less. Cash balances in most <strong>of</strong>the <strong>City</strong>’s operating funds are pooled and invested in various investments throughout the year. Each fund’s cash balanceis reported in a separate cash account and the <strong>City</strong> allocates interest earnings based on the average cash balance in eachfund during the year. For purposes <strong>of</strong> the Annual Financial Report, the <strong>City</strong> considers all highly liquid investments heldby trustees with maturity <strong>of</strong> three months or less when purchased to be cash equivalents. In addition, all cash andinvestments with the Assistant <strong>City</strong> Manager for Administrative Services are also considered to be cash equivalents sincethey are available on demand.EncumbrancesEncumbrances are commitments under purchase orders or contracts. Outstanding encumbrances at year-end are notrecorded as expenditures until the goods or services are received. Only those encumbrances that are recorded as payablesat June 30 are included as expenditures for budgetary presentations. Fund balance has been reserved for all outstandingencumbrances in the governmental fund types and will be recorded as expenditures in the subsequent fiscal year. Inaccordance with the Uniform <strong>Budget</strong>ing and Accounting Act, all encumbrances, <strong>of</strong> a fund that ends in a deficit, arecancelled and expenditures are assessed against the next year’s budget.24
Reservations and Designations <strong>of</strong> Fund EquitiesReservations <strong>of</strong> fund balance are established to identify (1) claims against resources <strong>of</strong> the entity that have notmaterialized as liabilities at the balance sheet date, or (2) the existence <strong>of</strong> assets that, because <strong>of</strong> their non-monetarynature or lack <strong>of</strong> liquidity, represent financial resources not available for current appropriation or expenditure, forexample: encumbrances, prepaid items, inventories, specific projects, and long-term advances to other funds. Suchreserves are not intended as valuation allowances, but merely demonstrate the current unavailability <strong>of</strong> the subject assetsto pay current expenditures. The <strong>City</strong> <strong>of</strong> <strong>Saginaw</strong> operates from a balanced budget at the onset <strong>of</strong> every fiscal year.Undesignated fund balance or prior year budgetary surplus can be appropriated to balance a fund’s budget if a sufficientbalance/surplus exists and the appropriation is fiscally prudent.Performance MeasurementIn 2007, the <strong>City</strong> began informally implementing Performance Based <strong>Budget</strong>ing with assistance <strong>of</strong> Michigan StateUniversity. Performance Based <strong>Budget</strong>ing utilizes specific program goals and objectives to produce desired outcomesand/or outputs. The budget document is the resource allocation plan in which the <strong>City</strong> identifies the financial inputnecessary to meet departmental goals and objectives. The <strong>City</strong> recognizes through this methodology that efficiencies andeffectiveness can be measured and that service delivery can be improved.25
BUDGET SUMMARYRESOURCE ALLOCATIONThe following Resource Allocation chart lists resources and appropriations for each fund and provides a grandtotal for all <strong>City</strong> resources. The accounts <strong>of</strong> the <strong>City</strong> are organized on the basis <strong>of</strong> fund(s), each <strong>of</strong> which isconsidered to be a separate accounting entity. These funds are the General, Special Revenue, Enterprise, InternalService, and Fiduciary Funds. Although each fund is accounted for independently, the proper cooperation andinteraction among all funds contribute to the overall effective and efficient management <strong>of</strong> <strong>City</strong> government.GENERAL FUNDThe General Fund is the top account for resources traditionally associated with government, which are notrequired legally or by sound financial management to be accounted for in another fund.SPECIAL REVENUE FUNDSSpecial Revenue Funds are defined as those funds used to account for proceeds <strong>of</strong> specific revenue sources thatare legally restricted to expenditures for specific purposes.Major, Local, and Municipal Street Funds:The Major and Local Streets Funds receive allocation <strong>of</strong> State collected gasoline taxes and license fees to beused for the maintenance, repair, and construction <strong>of</strong> streets and bridges within the <strong>City</strong>. The MunicipalStreet Fund functions as an inventory account for street maintenance materials. These materials arereallocated to the Major and Local Streets Funds upon completion <strong>of</strong> construction.Public Safety Fund:In May <strong>of</strong> 2006 the <strong>City</strong> levied a special property tax earmarked to support 51 Police Officers andFirefighters. This fund accounts for the tax levy proceeds.Rubbish Collection Fund:Under authority <strong>of</strong> State law, the <strong>City</strong> levies a special property tax earmarked to support the cost <strong>of</strong> operatinga weekly rubbish collection and disposal service. This fund accounts for the tax levy proceeds, householdrubbish fees, and composting fees. It also records the expenditures for rubbish collection, hauling anddisposal, recycling, composting and trash cleanup.Andersen Center Operation Fund:This fund accounts for the operation and maintenance expenditures and building rentals for the AndersenEnrichment Center. This fund also accounts for the private donations and individual contributions receivedby the <strong>Saginaw</strong> Community Enrichment Commission to provide financial support to cultural and creative artsorganizations and to sponsor various social and community events to improve the quality <strong>of</strong> life in the <strong>City</strong>.Boat Launch Operation Fund:This fund accounts for the revenues collected from the Wickes and Rust Avenue boat launches for parkingand admission fees. The fund also accounts for the operation and maintenance expenditures <strong>of</strong> thesefacilities.26
Community Policing Fund:This fund accounts for revenues and expenditures <strong>of</strong> Police Officers assigned to various <strong>City</strong> neighborhoods,the <strong>City</strong>’s Weed N Seed Program, as well as crime technology. These programs and technology provide theresidents with a greater sense <strong>of</strong> protection and gives them the responsibility for developing andimplementing problem-solving strategies for their neighborhoods.Police Training Fund:This fund accounts for allocations received from the State <strong>of</strong> Michigan pursuant to Act 302 <strong>of</strong> the Public Acts<strong>of</strong> 1982. Distributions are made twice annually based on the number <strong>of</strong> sworn Police Officers. These fundscan only be expended for direct costs <strong>of</strong> criminal justice training <strong>of</strong> Police Officers.Department <strong>of</strong> Justice Grant:This fund accounts for revenues and expenditures related to various projects to provide better services andfight crime in the community as approved by the United States’ Department <strong>of</strong> Justice. Funding allocationsare based on the community’s violent crime statistics.Youth Initiative Fund:This fund accounts for grant funds received from the United States’ Department <strong>of</strong> Justice. These funds willbe used to engage youth and facilities in programs that will enhance self-awareness and self-esteem, andreduce the use <strong>of</strong> substances through participation in substance abuse programs.Drug Forfeiture Fund:This fund accounts for all expenditures and funds received from the forfeiture <strong>of</strong> cash and property seizedduring drug raids.Auto Theft Prevention Fund:This fund accounts for the grant funding received from the State <strong>of</strong> Michigan pursuant to Act 10 <strong>of</strong> the PublicActs <strong>of</strong> 1986. These funds are used by <strong>Saginaw</strong> Police Department and <strong>Saginaw</strong> Township PoliceDepartment for the prevention and investigation <strong>of</strong> automobile thefts in <strong>Saginaw</strong> County.Community Development Block Grant Fund:The Community Development Block Grant Fund is used to account for the revenues and expenditures <strong>of</strong> theFederal Community Development Block Grant Entitlement Program. Other funds included underCommunity Development Block Grant funding are: Residential Loans, Rental Loans, Block Grant HomeProgram, Neighborhood Stabilization Program I and II, SEDC Revolving Loan, and Section 108 Loan.ENTERPRISE FUNDS:Enterprise Funds are used by a governmental entity to account for services provided to the general public on auser charge basis.Celebration Park Fund:Revenues and expenses related to the construction and operation <strong>of</strong> the Frank N. Andersen – Celebration Parkis recorded in this fund. Assets <strong>of</strong> the facility are also recorded.27
Parking Operations and Maintenance Fund:Revenues and expenses related to the operation <strong>of</strong> the parking system are recorded in the Parking Operationsand Maintenance Fund. Assets <strong>of</strong> the parking system are also recorded.Sewer Operations and Maintenance Fund:The sewer fund is used to account for the revenues and expenses associated with the provision <strong>of</strong> sewerservices to residential, commercial, and industrial establishments <strong>of</strong> the <strong>City</strong> as well as several municipalitiessurrounding the <strong>City</strong>.Water Operations and Maintenance Fund:The water fund is used to account for revenues and expenses associated with the provision <strong>of</strong> water service toresidential, commercial, and industrial establishments <strong>of</strong> the <strong>City</strong> as well as several municipalitiessurrounding the <strong>City</strong>.INTERNAL SERVICE FUNDSInternal Service Funds are used to account for goods and services provided to one department by another on a costreimbursement basis.Public Works Building Fund:This fund was established to account for all operating and capital expenses required to maintain the PublicWorks Service Center. Rent is charged to the departments occupying the building based on square footage.Technical Services – Geographical Information Systems Fund:This fund is used to account for the development and operation <strong>of</strong> the citywide geographical informationsystem. Money for the operation <strong>of</strong> this fund is supplied from contributions from other city funds.Technical Services – Information Service Fund:Computer and information services are provided to the <strong>City</strong> operating departments through this fund. Theoperation is financed by service charges levied against user departments and service contracts with othergovernmental agencies.Radio Operations Fund:This fund acquires, installs, and maintains two-way radio equipment for use by <strong>City</strong> operating departments.Rental fees are charged to using departments to recover the cost <strong>of</strong> maintaining and replacing equipment.Motor Pool Operations Fund:This fund is responsible for acquiring and maintaining vehicles and other motorized equipment for use ingeneral <strong>City</strong> operations. The costs <strong>of</strong> maintenance and replacement are recovered through rental ratescharged to <strong>City</strong> operations using the vehicles and equipment.Self-Insurance Fund:This fund was established by <strong>City</strong> Council to serve as a general insurance reserve for liabilities and claims notcovered by commercial carriers or to pay deductibles. This fund accounts for the payment <strong>of</strong> insurancepremiums; the distribution <strong>of</strong> insurance costs to other <strong>City</strong> funds, and records the insurance claims liability.28
Worker’s Compensation Fund:This fund accounts for all expenses, revenues, and claims relating to the <strong>City</strong>’s self-insured workers’compensation program. Premiums are charged to other <strong>City</strong> funds based on a percentage <strong>of</strong> budgetedsalaries.FIDUCIARY FUNDS:Fiduciary Funds are used to account for or administer property or assets that are owned by other entities.Public Employee Healthcare Fund/ Unfunded Liabilities Fund:This fund was established to start funding the unfunded health insurance premiums that are fully paid for all<strong>City</strong> retirees. The unfunded liability is estimated at over $215 million.Police and Fire Pension Fund:Assets accumulated for the payment <strong>of</strong> retirement benefits for <strong>City</strong> Police and Fire personnel are recorded inthis fund. Benefits for retired members are paid from this fund and active members contribute to the pensionsystem through payroll deductions. The <strong>City</strong> contributes to the fund by an annual appropriation from theGeneral Fund and Public Safety Grant Funds, which is determined and set by an annual actuarial valuation.Trust and Agency Funds:These funds are used to account for property taxes collected by the <strong>City</strong> for other units <strong>of</strong> government untilthe tax proceeds are remitted to them. Funds retained from contractors during construction projects andemployee and employer payroll withholdings and benefits are also recorded here. The Bliss Park ExpenditureEndowment Fund is recorded as the only budgeted trust and agency fund.29
RESOURCE ALLOCATION<strong>2010</strong>/<strong>2011</strong> APPROVED BUDGETRESOURCESAPPROPRIATIONGENERAL FUND $ 34,201,919 GENERAL FUND $ 34,201,919SPECIAL REVENUE FUNDS 26,676,312 SPECIAL REVENUE FUNDS 26,676,312ENTERPRISE FUNDS 58,067,581 ENTERPRISE FUNDS 58,067,581INTERNAL SERVICE FUNDS 4,793,373 INTERNAL SERVICE FUNDS 4,793,373FIDUCIARY FUNDS 16,668,371 FIDUCIARY FUNDS 16,668,371TOTAL RESOURCES $ 140,407,556 TOTAL APPROPRIATION $ 140,407,556Resource Allocation <strong>2010</strong>/<strong>2011</strong> Approved <strong>Budget</strong>Internal Service Funds3.41%Fiduciary Funds11.87%General Fund24.36%Enterprise Funds41.36%Special Revenue Funds19.00%
SUMMARY OF REVENUESGENERAL FUNDGeneral Fund revenue is expected to decrease by $1,283,217, or –3.75% from the 2009/<strong>2010</strong>Approved <strong>Budget</strong>. Property Tax revenues are expected to increase by $34,159, or .85% from theprevious year. This is primarily attributed to the increased amounts <strong>of</strong> monies actually receivedon penalties and interest as well as for the Birch Park payment in lieu <strong>of</strong> taxes. <strong>City</strong> Income Taxwill increase by $54,000, or .45% from FY <strong>2010</strong>. This increase is attributed to the aggressiveapproach that the <strong>City</strong> has taken in collecting past due incomes taxes. So far to date, the <strong>City</strong> hasexceeded in past due collections. State Shared revenues are expected to decrease by $1,639,429,or –18.64%. At the end <strong>of</strong> FY 2009, the <strong>City</strong> <strong>of</strong> <strong>Saginaw</strong> was notified that the state has madesignificant cuts to the amount <strong>of</strong> revenue sharing monies to the <strong>City</strong>. Further in November <strong>of</strong>2009, the State <strong>of</strong> Michigan passed its budget with an -11% decrease in revenue sharing. Thistrend continues for the FY <strong>2011</strong> budget. Additionally, in FY <strong>2010</strong>, the <strong>City</strong> made its lastpayment for the Inventory Tax Reimbursement. This is a liability to the city that is categorizedunder revenues. Grants are expected to increase by $288,569, or 15.63% from the previous year.This increase is attributed to the federal stimulus Energy Efficiency Community Block Grantmonies that the <strong>City</strong> was awarded in FY <strong>2010</strong>. Licenses, Permits, and Fees will increase by$102,700 in FY <strong>2011</strong>. In FY <strong>2011</strong>, the <strong>City</strong> increased its Housing, Building, Electrical,Mechanical, and Plumbing fees. This increase was attributed to the <strong>City</strong> receiving federalmonies for the revitalization and rehabilitation <strong>of</strong> housing within the <strong>City</strong>. Charge for Serviceswill increase by $140,675, or 14.42%. This increase is due to the following: <strong>City</strong> receivingreimbursement from the State Police for one <strong>of</strong>ficer who is working with BayNet, the increase inthe amount billed for Hazmat Clean Up Fees, and realizing the increase in Cemeteries fees.Fines and Forfeiture will increase by 18.37%. This increase is due to increases in OrdinanceFines and Civil Infractions. In FY <strong>2011</strong>, the Department <strong>of</strong> Development – Inspections has beenreorganized to include Ordinance Enforcement. This new responsibility by the InspectionsDivision will consolidate the ordinance function <strong>of</strong> parking, environmental services, weedabatement, and code enforcement. Through this consolidation, it is expected that revenues willincrease slightly from previous years. Interest revenues are expected to decrease by $100,000, or–22.93%. This decrease is due to the downward fluctuation in the market. Rents will increase inFY <strong>2011</strong> by $29,500, or 98.33%. This increase is due to an increase in the cell phone towerpayment. Other Revenues are expected to decrease by $397,670, or -29.95% from the <strong>2010</strong>budgeted levels. This is attributed to decreases in the Sale <strong>of</strong> Land/Buildings and the SpecialAssessments.SPECIAL REVENUE FUNDSMajor and Local StreetsThe Major and Local Streets revenues are expected to increase, in total, by a net <strong>of</strong> $462,279.This increase is primarily due to the increase <strong>of</strong> fund equity due to the cuts to the revenue sharingpayments for the Gas and Weight Tax.Public Safety FundThe Public Safety Fund is expected to increase by $85,752, or 2.21% over the <strong>2010</strong> budgetedlevels. This increase is due to an increase in the subsidy from the General Fund for thedownward assessment <strong>of</strong> real property within the <strong>City</strong> <strong>of</strong> <strong>Saginaw</strong>.31
Rubbish Collection FundRubbish Collection revenue is expected to decrease by $78,747, or –2.28%. This decrease is dueto a downward assessment <strong>of</strong> real property within the <strong>City</strong> <strong>of</strong> <strong>Saginaw</strong>.Baker Perkins LDFAThe Baker Perkins LDFA will be inactive in the <strong>2010</strong>/<strong>2011</strong> <strong>Budget</strong>.Community Policing FundCommunity Policing Fund revenue will increase $649,665, or 59.95%.attributable to the addition <strong>of</strong> the COPS Hiring and ShotSpotter Grants.This increase isJustice Assistance GrantThe Department <strong>of</strong> Justice - Justice Assistance Grant revenues will decrease by $196,437. In FY<strong>2010</strong> the <strong>City</strong> received funding from the Department <strong>of</strong> Justice for programs and equipment toprovide better services and fight crime in the community as approved by the United States -.Department <strong>of</strong> Justice. Funding allocations are based on the community’s violent crime statistics.In <strong>2010</strong>, city administration, complied a list <strong>of</strong> items the funds would be spent, by the end <strong>of</strong> thefiscal year, these funds were not expended in its entirety. FY <strong>2011</strong>, the remaining unexpendedmonies will be utilized.Youth Initiative Grant FundThe Youth Initiative Grant Fund revenues will decrease by $77,130, or -55.31%. This decreaseis due to the decrease in grant allocation.Community Development Block Grant (CDBG)CDBG revenues will decrease -13.85% from the <strong>2010</strong> budgeted levels. This decrease is due tothe decrease in the <strong>City</strong>’s federal entitlement allocation.Community Development Block Grant – Rental LoansThe CDBG – Rental Loans revenue will decrease -23.02% from the <strong>2010</strong> budget levels. Thisdecrease is due to the decrease in the <strong>City</strong>’s federal entitlement allocation.Neighborhood Stabilization Program Fund (NSP)The NSP Fund is new to the <strong>City</strong> for FY <strong>2011</strong>. This fund is a combination <strong>of</strong> NeighborhoodStabilization Program I and II. In FY <strong>2011</strong> the <strong>City</strong> expects to receive monies for both programsfor the acquisition and redevelopment <strong>of</strong> foreclosed properties as well as demolition <strong>of</strong> blightedstructures.Auto Theft Prevention FundThe Auto Theft Prevention Fund is expected to decrease by –33.09% from the <strong>2010</strong> budgetedlevels. This decrease is due to the reduction in the monies received by the state.ENTERPRISE FUNDCelebration Park FundCelebration Park will increase $106,000, or 11.96% from the <strong>2010</strong> budgeted levels. Thisincrease is due to additional donations given for the completion <strong>of</strong> the park.32
Parking Operations and Maintenance FundThe Parking Operations Fund will decrease by $138,238, or –43.51%. This decrease is attributedto the reduction in monies transferred in from the General Fund for the repayment <strong>of</strong> the debtservice payment.Sewer Operations and Maintenance FundIn FY <strong>2011</strong>, the Sewer Operations and Maintenance revenues will increase 6.89%. The increaseis due to the sewer rate increase that was implemented during <strong>2010</strong> as well as an increase in theSeptic Hauling fees rate.Water Operations and Maintenance FundIn FY <strong>2011</strong>, the Water Operations and Maintenance revenues will decrease by $13,598,159, or –32.20%. This decrease in revenues is attributed to the reduction in the amount <strong>of</strong> bond proceedsthat will be utilized during the year.INTERNAL SERVICE FUNDTechnical Services – Information Services FundThe Technical Services – Information Services Fund will decrease by $169,601, or –12.81%from <strong>2010</strong> budgeted levels. This decrease is due to the reduction in revenues from contributionsfrom other funds. This reduction is a result <strong>of</strong> two employees retiring during FY <strong>2010</strong>.Motor Pool Operations FundThe Motor Pool Operations Fund will decrease by $580,788, or –25.64%. This decrease is dueto the reduction <strong>of</strong> contributions from other funds.FIDUCIARY SERVICE FUNDSelf Insurance FundThe Self Insurance Fund will decrease by $280,900, or –19.11% from the <strong>2010</strong> budgeted levels.This decrease is due to the reduction in the amount <strong>of</strong> retained earnings allocated for FY <strong>2011</strong>.33
GENERAL FUNDSUMMARY OF REVENUES<strong>2010</strong>/<strong>2011</strong> APPROVED BUDGET2008/2009 2009/<strong>2010</strong> <strong>2010</strong>/<strong>2011</strong>ADJUSTED APPROVED APPROVED INCREASE/ %FUND BUDGET BUDGET BUDGET (DECREASE) CHANGEProperty Tax 3,536,118 3,992,594 4,026,753 34,159 0.85%<strong>City</strong> Income Tax 12,500,000 12,025,000 12,079,000 54,000 0.45%State Revenue Sharing 9,258,591 10,435,721 8,796,292 (1,639,429) -18.64%Grants 1,465,765 1,557,421 1,845,990 288,569 15.63%Licenses, Permits, and Fees 1,515,356 1,119,150 1,221,850 102,700 8.41%Charges for Service & Sales 1,348,322 834,939 975,614 140,675 14.42%Fines and Forfeiture 275,000 200,000 245,000 45,000 18.37%Interest 500,800 536,100 436,100 (100,000) -22.93%Rents 12,500 500 30,000 29,500 98.33%Reimbursements 3,000,832 3,058,260 3,217,539 159,279 4.95%Other Revenues 2,500,745 1,725,451 1,327,781 (397,670) -29.95%TOTAL GENERAL FUND 35,914,029 35,485,136 34,201,919 (1,283,217) -3.75%SPECIAL REVENUE FUNDSMAJOR STREETS 4,197,674 4,238,740 4,740,422 501,682 10.58%LOCAL STREETS 1,479,244 1,261,340 1,222,297 (39,043) -3.19%PUBLIC SAFETY FUND 3,942,152 3,790,449 3,876,201 85,752 2.21%RUBBISH COLLECTION FUND 3,784,399 3,536,381 3,457,634 (78,747) -2.28%ANDERSEN CENTER FUND 218,120 262,914 277,386 14,472 5.22%GM TOWER PAYMENT 108,500 108,500 108,500 0 0.00%BOAT LAUNCH FUND 38,350 25,550 25,550 0 0.00%COMMERCE CENTER DDA 28,636 28,558 27,865 (693) -2.49%DOWNTOWN DEVELOPMENT AUTH. 70,218 75,122 70,838 (4,284) -6.05%ECONO<strong>MI</strong>C DEVELOPMENT 345,000 0 0 0 0.00%BROWNFIELD AUTHORITY SRRF 36,135 37,392 28,579 (8,813) -30.84%BAKER PERKINS LDFA 37,152 18,603 0 (18,603) 0.00%SILS ISLAND DDA 19,100 2,836 2,748 (88) -3.20%SAGINAW TOOL & DIE LDFA 28,750 25,699 27,408 1,709 6.24%SEXTON LDFA 21,952 13,383 12,814 (569) -4.44%THOMSON LDFA 142,218 138,398 143,969 5,571 3.87%TREASURE ISLAND LDFA 6,424 9,207 9,337 130 1.39%COMMUNITY POLICING FUND 682,836 434,006 1,083,671 649,665 59.95%POLICING TRAINING FUND 21,000 21,000 21,000 0 0.00%J.A.G. FUND 0 546,196 349,759 (196,437) -56.16%DRUG FORFEITURE FUND 426,432 70,503 70,503 0 0.00%YOUTH INITIATIVE GRANT FUND 218,216 216,586 139,456 (77,130) -55.31%COMM. DEV. BLOCK GRANT FUND 2,494,302 2,366,465 2,078,562 (287,903) -13.85%CDBG RESIDENTIAL LOANS 942,289 513,212 513,212 0 0.00%CDBG RENTAL LOANS 44,800 37,412 30,412 (7,000) -23.02%BLOCK GRANT HOME PROGRAM FUND 849,580 980,768 1,400,000 419,232 29.95%NEIGHBORHOOD STABILIZATION 0 0 6,428,000 6,428,000 100.00%SECTION 108 LOAN 15,000 10,000 10,000 0 0.00%SEDC REVOLVING LOAN 1,442,617 400,000 400,000 0 0.00%AUTO THEFT PREVENTION FUND 164,796 159,954 120,189 (39,765) -33.09%TOTAL SPECIAL REVENUE FUNDS 21,805,892 19,329,174 26,676,312 7,347,138 27.54%34
SUMMARY OF REVENUES<strong>2010</strong>/<strong>2011</strong> APPROVED BUDGET2008/2009 2009/<strong>2010</strong> <strong>2010</strong>/<strong>2011</strong>ADJUSTED APPROVED APPROVED INCREASE/ %FUND BUDGET BUDGET BUDGET (DECREASE) CHANGEENTERPRISE FUNDSCELEBRATION PARK 100,000 780,000 886,000 106,000 11.96%PARKING SYSTEM 367,303 455,920 317,682 (138,238) -43.51%SEWER SURPLUS 2,795,912 0 0 0 0.00%WATER SURPLUS 3,119,741 0 0 0 0.00%WAVE POOL 192,500 2,500 2,500 0 0.00%SEWER OPERATIONS & MAINTENANCE 22,102,134 26,288,844 28,234,982 1,946,138 6.89%WATER OPERATIONS & MAINTENANCE 15,504,905 42,224,612 28,626,417 (13,598,195) -32.20%SEWER BOND CONSTRUCTION 11,219,214 0 0 0 0.00%WATER BOND CONSTRUCTION 28,199,709 0 0 0 0.00%TOTAL ENTERPRISE FUNDS 83,601,418 69,751,876 58,067,581 (11,684,295) -20.12%INTERNAL SERVICE FUNDSCENTRAL STORES 204,025 0 0 0 0.00%PUBLIC WORKS BUILDING FUND 465,508 465,508 463,278 (2,230) -0.48%TECHNICAL SERVICES - GIS 510,478 509,179 517,825 8,646 1.67%TECHNICAL SERVICES - IS 1,453,607 1,493,678 1,324,077 (169,601) -12.81%RADIO OPERATION FUND 1,206,549 226,181 223,310 (2,871) -1.29%MOTOR POOLS OPERATIONS 2,759,903 2,845,671 2,264,883 (580,788) -25.64%TOTAL INTERNAL SERVICE FUNDS 6,600,070 5,540,217 4,793,373 (746,844) -15.58%FIDUCIARY FUNDSUNFUNDED LIABILITIES 500,000 500,000 500,000 0 0.00%SELF-INSURANCE FUND 1,580,629 1,794,566 1,506,666 (287,900) -19.11%WORKERS' COMPENSATION FUND 1,240,000 1,291,955 1,291,955 0 0.00%FOREST LAWN CEMETERY 19,000 19,000 19,000 0 0.00%OAKWOOD CEMETERY 6,000 6,000 6,000 0 0.00%POLICE AND FIRE PENSION FUND 13,297,802 13,391,466 13,336,050 (55,416) -0.42%BLISS PARK EXPENDITURE ENDOW. 9,150 8,700 8,700 0 0.00%TOTAL FIDUCIARY FUNDS 16,652,581 17,011,687 16,668,371 (343,316) -2.06%TOTAL REVENUES 164,573,990 147,118,090 140,407,556 (6,710,534) -4.78%35
CITY OF SAGINAWSUMMARY OF REVENUESSummary <strong>of</strong> Revenues2008/2009 Adjusted,2009/<strong>2010</strong> Approved and <strong>2010</strong>/<strong>2011</strong> Approved <strong>Budget</strong>s90807060Millions504030<strong>2010</strong>-General Fund Special Revenue Funds Enterprise Funds Internal Service Funds Fiduciary Funds2008/2009 2009/<strong>2010</strong> <strong>2010</strong>/<strong>2011</strong>
BUDGET SUMMARYSUMMARY OF EXPENDITURESGENERAL FUNDGeneral Fund expenditures are expected to decrease $1,283,217, or –3.75%, from the <strong>2010</strong> <strong>Budget</strong>.General Government:General Government expenditures will increase $15,229, or .72%, in FY <strong>2011</strong>. This increase inexpenses is a direct result <strong>of</strong> the addition <strong>of</strong> the HR Support Staff and Election Assistantpositions in the Employee Services and <strong>City</strong> Clerk Offices, respectively.Department <strong>of</strong> Fiscal Services:The Department <strong>of</strong> Fiscal Services will increase by $113,619, or 4.37%. In FY <strong>2011</strong>, the <strong>City</strong>will add an Administrative (<strong>Budget</strong>) Analyst to the Administration Division. Additionally, theAdministration Division <strong>of</strong> this department includes the cost <strong>of</strong> a grant administrator for FY<strong>2011</strong>. This cost, in previous years, was allocated to the Department <strong>of</strong> Development.Department <strong>of</strong> Public Safety:The Department <strong>of</strong> Public Safety expenditures will decrease by a total <strong>of</strong> $1,483,510 from the<strong>2010</strong> budgeted levels. This decrease is a direct result <strong>of</strong> the <strong>City</strong> “pay as you go” approach toretirement payouts as well as a decrease in the rate that will be utilized for the retiree healthcarecosts. This decrease will be <strong>of</strong>fset by the addition <strong>of</strong> the Assistant <strong>City</strong> Manager for PublicSafety.Department <strong>of</strong> Development:The Department <strong>of</strong> Development will decrease by $963,616, or –80.69% from the <strong>2010</strong> budgetedlevels. In FY <strong>2010</strong> the Department <strong>of</strong> Development was a recipient <strong>of</strong> funding from federal andstate grant agency for demolitions and the <strong>City</strong> deconstruction program. These monies will notbe received in FY <strong>2011</strong>. In addition, a percentage <strong>of</strong> the Director, Assistant Director, and theLicensed Inspector will be redistributed to the Neighborhood Stabilization Program Fund. Also,the Code Enforcement Officer will be eliminated from the personnel complement.Department <strong>of</strong> Public Services:The Department <strong>of</strong> Public Services will increase by $185,703 or 5.54%. This increase isattributable to the allocation <strong>of</strong> funds for weed cutting. In FY <strong>2010</strong>, the <strong>City</strong> entered into anagreement with the <strong>Saginaw</strong> County Land Bank to assist with weed abatement efforts.Approximately, $40,000 will be designated for this process for FY <strong>2011</strong>. Also, note that there isan <strong>of</strong>fset revenue allocation. In addition, in FY <strong>2010</strong>, the <strong>City</strong> received federal stimulus moniesfor energy efficiency projects. Approximately, $316,000 <strong>of</strong> these monies will be spent in FY<strong>2011</strong>. In the Recreation Division, $10,000 is allocated for the utilities cost for the <strong>City</strong>recreational program. This money has been donated by Cities <strong>of</strong> Promise and Dow and isreflective in general fund revenues. Further, in the Building and Grounds Maintenance Division,.15 more <strong>of</strong> the Building Operations Supervisor and the Labor Foreman for Streets/BuildingOperations will be included.Other General Fund:Other General Fund is expected to increase by $849,358 from the <strong>2010</strong> approved budget. Thisincrease is attributable to the increase in the transfers to other funds.37
SPECIAL REVENUE FUNDSMajor and Local StreetsThe Major and Local Streets expenditures are expected to increase, in total, by a net <strong>of</strong> $462,639.This increase is primarily due to the reallocation <strong>of</strong> the General Fund’s Traffic EngineeringDivision to both Major and Local Streets. The General Fund typically budgets for theseexpenditures, however at the end <strong>of</strong> each year, and in accordance with Public Act 51, these costsare zero. Therefore, beginning in FY <strong>2011</strong> the budget will reflect the total costs <strong>of</strong> this service inboth Major and Local Streets.Rubbish Collection FundThe Rubbish Collection Fund will decrease by $78,747, or –2.28%. This decrease is attributedto the elimination <strong>of</strong> the Superintendent <strong>of</strong> Right-<strong>of</strong>-Way as well as the reallocation <strong>of</strong> theBuilding Operations Supervisor and the Labor Foreman for Streets/Building Operations to theGeneral Fund and the Public Works Building Fund.Baker Perkins LDFA FundIn FY <strong>2011</strong>, the Baker Perkins LDFA Fund will become inactive.Community Policing FundThe Community Policing Fund revenue will increase by $649,665, or 59.95%. This increase isattributable to the addition <strong>of</strong> the COPS Hiring Grant as well as additional monies allocated forthe ShotSpotter Division for the purchase <strong>of</strong> public safety technology.Justice Assistance Grant (JAG)The Department <strong>of</strong> Justice - Justice Assistance Grant expenditures will decrease by $196,437. InFY <strong>2010</strong> the <strong>City</strong> received funding from the Department <strong>of</strong> Justice for programs and equipmentto provide better services and fight crime in the community as approved by the United States’.Department <strong>of</strong> Justice. The remaining portion <strong>of</strong> these monies will be spent in FY <strong>2011</strong>.Youth Initiative Grant FundIn FY <strong>2011</strong>, the Youth Initiative Grant fund will decrease by $77,130, or –55.31%. Due to thereduction in the funds that will be received by the State <strong>of</strong> Michigan, one <strong>of</strong> the Police Officersthat were paid from these monies will be redistributed to the General Fund.Community Development Block Grant (CDBG)The Community Development Block Grant revenues will decrease -13.85%, from the <strong>2010</strong>budgeted levels. This decrease is due to the decrease in the <strong>City</strong>’s federal entitlement allocation.Neighborhood Stabilization Program Fund (NSP)The NSP Fund is new to the <strong>City</strong> for FY <strong>2011</strong>. This fund is a combination <strong>of</strong> NeighborhoodStabilization Program I and II. In FY <strong>2011</strong> the <strong>City</strong> expects to receive monies for both programsfor the acquisition and redevelopment <strong>of</strong> foreclosed properties as well as the demolition <strong>of</strong>blighted structures.Auto Theft Prevention FundIn FY <strong>2011</strong>, the Auto Theft Prevention Fund will decrease by –33.09%. Because <strong>of</strong> thereduction in the amount <strong>of</strong> funds received from the State <strong>of</strong> Michigan for auto theft prevention,the <strong>City</strong> must reduce the amount <strong>of</strong> monies actually spent. In this fund, the Pr<strong>of</strong>essional Services38
fees were reduced due to the reduction <strong>of</strong> services provided by <strong>Saginaw</strong> Township for clericalassistance.ENTERPRISE FUNDCelebration Park FundThe Celebration Park Fund will increase by $106,000, or 11.96%. The <strong>City</strong> is in the process <strong>of</strong>completing the park, and funds will be expended for that purpose. In addition, in FY <strong>2011</strong> the<strong>City</strong> will employ seasonal recreational workers that will be paid by donations.Parking Operations and Maintenance FundThe Parking Operations and Maintenance Fund will decrease by $138,238, or –43.51% from FY<strong>2010</strong>. In <strong>2011</strong>, a meter attendant will be eliminated from the complement. In addition, the citywill no longer pay for the debt service on the parking ramp.Sewer Operations and Maintenance FundThe Sewer Operations and Maintenance Fund will increase by 6.89%. This increase is due to themultiple construction projects that will be completed in <strong>2011</strong> as well as a slight increase in thecost allocation plan’s share.Water Operations and Maintenance FundThe Water Operations and Maintenance Fund will decrease by $13,598,195, or –47.50% fromthe <strong>2010</strong> budgeted levels. This decrease is due to a reduction in construction projects that will becompleted in FY <strong>2011</strong>.INTERNAL SERVICE FUNDTechnical Services – Information Services FundThe Technical Services – Information Services Fund will decrease by $169,601, or –12.81%from FY <strong>2010</strong>. This is a direct result <strong>of</strong> the retirement <strong>of</strong> the Director <strong>of</strong> Information Servicesand one Application Analyst in <strong>2010</strong>, and the subsequent elimination <strong>of</strong> those positions. Thisdecrease is <strong>of</strong>fset by the addition <strong>of</strong> 50% <strong>of</strong> the Technical Services Director.Motor Pool Operations FundThe Motor Pool Operations Fund will decrease by $580,788, or –25.64%, from FY <strong>2010</strong>. Thisreduction is attributable to the fact that no vehicle purchases or installment payments werebudgeted for in FY <strong>2011</strong>. This reduction is <strong>of</strong>fset by the addition <strong>of</strong> a Fleet Administrator to thepersonnel complement.FIDUCIARY SERVICE FUNDSelf-Insurance FundIn FY <strong>2011</strong>, the Self-Insurance Fund will decrease by $287,900, or –19.11%. This decrease is aresult <strong>of</strong> a reduction in the amount <strong>of</strong> money that will be transferred to other funds.39
GENERAL FUND2008/2009 2009/<strong>2010</strong> <strong>2010</strong>/<strong>2011</strong>ADJUSTED APPROVED APPROVED INCREASE/ %FUND BUDGET BUDGET BUDGET (DECREASE) CHANGEGeneral Government 2,096,356 2,095,089 2,110,318 15,229 0.72%Fiscal Services 2,667,062 2,487,010 2,600,629 113,619 4.37%Police 12,889,706 13,500,573 12,285,671 (1,214,902) -9.89%Fire 9,471,768 9,124,798 8,856,190 (268,608) -3.03%Development 1,846,872 2,157,888 1,194,272 (963,616) -80.69%Public Services 3,727,175 3,166,659 3,352,362 185,703 5.54%Other Expenditures 3,215,090 2,953,119 3,802,477 849,358 22.34%TOTAL GENERAL FUND 35,914,029 35,485,136 34,201,919 (1,283,217) -3.75%SPECIAL REVENUE FUNDSSUMMARY OF EXPENDITURES<strong>2010</strong>/<strong>2011</strong> APPROVED BUDGETMAJOR STREETS 4,197,674 4,238,740 4,740,422 501,682 10.58%LOCAL STREETS 1,479,244 1,261,340 1,222,297 (39,043) -3.19%PUBLIC SAFETY FUND 3,942,152 3,790,449 3,876,201 85,752 2.21%RUBBISH COLLECTION FUND 3,784,399 3,536,381 3,457,634 (78,747) -2.28%ANDERSEN CENTER FUND 218,120 262,914 277,386 14,472 5.22%GM TOWER PAYMENT 108,500 108,500 108,500 0.00 0.00%BOAT LAUNCH FUND 38,350 25,550 25,550 0.00 0.00%COMMERCE CENTER DDA 28,636 28,558 27,865 (693) -2.49%DOWNTOWN DEVELOPMENT AUTH. 70,218 75,122 70,838 (4,284) -6.05%ECONO<strong>MI</strong>C DEVELOPMENT 345,000 0 0 0 0.00%BROWNFIELD AUTHORITY SRRF 36,135 37,392 28,579 (8,813) -30.84%BAKER PERKINS LDFA 37,152 18,603 0 (18,603) -100.00%SILS ISLAND DDA 19,100 2,836 2,748 (88) -3.20%SAGINAW TOOL & DIE LDFA 28,750 25,699 27,408 1,709 6.24%SEXTON LDFA 21,952 13,383 12,814 (569) -4.44%THOMSON LDFA 142,218 138,398 143,969 5,571 3.87%TREASURE ISLAND LDFA 6,424 9,207 9,337 130 1.39%COMMUNITY POLICING FUND 682,836 434,006 1,083,671 649,665 59.95%POLICING TRAINING FUND 21,000 21,000 21,000 0.00 0.00%J.A.G. FUND 0 546,196 349,759 (196,437) -56.16%DRUG FORFEITURE FUND 421,577 70,503 70,503 0 0.00%YOUTH INITIATIVE GRANT FUND 218,216 216,586 139,456 (77,130) -55.31%COMM. DEV. BLOCK GRANT FUND 2,494,302 2,366,465 2,078,562 (287,903) -13.85%CDBG RESIDENTIAL LOANS 942,289 513,212 513,212 0 0.00%CDBG RENTAL LOANS 44,800 37,412 30,412 (7,000) -23.02%BLOCK GRANT HOME PROGRAM FUND 849,580 980,768 1,400,000 419,232 29.95%NEIGHBORHOOD STABILIZATION 0 0 6,428,000 6,428,000 100.00%SECTION 108 LOAN 15,000 10,000 10,000 0 0.00%SEDC REVOLVING LOAN 1,442,617 400,000 400,000 0 0.00%AUTO THEFT PREVENTION FUND 164,796 159,954 120,189 (39,765) -33.09%TOTAL SPECIAL REVENUE FUNDS 21,801,037 19,329,174 26,676,312 7,347,138 27.54%40
SUMMARY OF EXPENDITURES<strong>2010</strong>/<strong>2011</strong> APPROVED BUDGET2008/2009 2009/<strong>2010</strong> <strong>2010</strong>/<strong>2011</strong>ADJUSTED APPROVED APPROVED INCREASE/ %FUND BUDGET BUDGET BUDGET (DECREASE) CHANGEENTERPRISE FUNDSCELEBRATION PARK 100,000 780,000 886,000 106,000 11.96%PARKING SYSTEM 367,303 455,920 317,682 (138,238) -43.51%SEWER SURPLUS 2,795,912 0 0 0 0.00%WATER SURPLUS 3,119,741 0 0 0 0.00%WAVE POOL 192,500 2,500 2,500 0 0.00%SEWER OPERATIONS & MAINTENANCE 22,102,134 26,288,844 28,234,982 1,946,138 6.89%WATER OPERATIONS & MAINTENANCE 15,504,905 42,224,612 28,626,417 (13,598,195) -47.50%SEWER BOND CONSTRUCTION 11,219,214 0 0 0 0.00%WATER BOND CONSTRUCTION 28,199,709 0 0 0 0.00%TOTAL ENTERPRISE FUNDS 83,601,418 69,751,876 58,067,581 (11,684,295) -20.12%INTERNAL SERVICE FUNDSCENTRAL STORES 204,025 0 0 0 0.00%PUBLIC WORKS BUILDING FUND 465,869 465,508 463,278 (2,230) -0.48%TECHNICAL SERVICES-GIS 510,478 509,179 517,825 8,646 1.67%TECHNICAL SERVICES-IS 1,453,607 1,493,678 1,324,077 (169,601) -12.81%RADIO OPERATION FUND 1,206,549 226,181 223,310 (2,871) -1.29%MOTOR POOLS OPERATIONS 2,759,903 2,845,671 2,264,883 (580,788) -25.64%TOTAL INTERNAL SERVICE FUNDS 6,600,431 5,540,217 4,793,373 (746,844) -15.58%FIDUCIARY FUNDSUNFUNDED LIABILITIES 500,000 500,000 500,000 0 0.00%SELF-INSURANCE FUND 1,580,629 1,794,566 1,506,666 (287,900) -19.11%WORKERS' COMPENSATION FUND 1,240,000 1,291,955 1,291,955 0 0.00%FOREST LAWN CEMETERY 19,000 19,000 19,000 0 0.00%OAKWOOD CEMETERY 6,000 6,000 6,000 0 0.00%POLICE AND FIRE PENSION FUND 13,297,802 13,391,466 13,336,050 (55,416) -0.42%BLISS PARK EXPENDITURE ENDOW. 9,150 8,700 8,700 0 0.00%TOTAL FIDUCIARY FUNDS 16,652,581 17,011,687 16,668,371 (343,316) -2.06%TOTAL EXPENDITURES 164,569,496 147,118,090 140,407,556 (6,710,534) -4.78%41
SUMMARY OF EXPENDITURES<strong>2010</strong>/<strong>2011</strong> APPROVED BUDGETSummary <strong>of</strong> Expenditures2008/2009 Adjusted2009/<strong>2010</strong> Approved and <strong>2010</strong>/<strong>2011</strong> Approved <strong>Budget</strong>90807060Millions504030<strong>2010</strong>-General Fund Special Revenue Funds Enterprise Funds Internal Service Funds Fiduciary Funds2008/2009 2009/<strong>2010</strong> <strong>2010</strong>/<strong>2011</strong>
BUDGET SUMMARYEXPENDITURE BY CATEGORY ANAYLSISThe Expenditure by Category Analysis chart on the following page compares the 2009/<strong>2010</strong> Approved <strong>Budget</strong> tothe <strong>2010</strong>/<strong>2011</strong> Approved <strong>Budget</strong> by category for all fund types.Personnel Services is the largest expenditure type, representing 46.87% <strong>of</strong> the total <strong>2010</strong>/<strong>2011</strong> Approved <strong>Budget</strong>.In comparison to the FY <strong>2010</strong> Approved <strong>Budget</strong>, personnel services have decreased by -2.08%, or $1,399,271, forall fund types. This decrease is primarily a result <strong>of</strong> the eliminations <strong>of</strong> positions due to the <strong>City</strong> reinventingservice delivery systems and identifying organizational efficiencies. This reduction will be <strong>of</strong>fset by increases towages for all unions, active and retiree healthcare benefit costs.A factor that has substantially increased personnel services is retiree healthcare. During FY <strong>2010</strong>, the <strong>City</strong>projects that retiree healthcare costs will increase between 6% and 11% from FY <strong>2010</strong> (depending upon thecontract the employee retired under). The <strong>City</strong> <strong>of</strong> <strong>Saginaw</strong> is actively pursuing alternative ways <strong>of</strong> handling theescalating retiree healthcare. Another key factor that will affect the <strong>City</strong> in the future is the <strong>City</strong>’s Other PostEmployee Benefits (OPEB). In June 2009, the <strong>City</strong> completed its actuarial valuation for its retirees. The actuaryreported that the <strong>City</strong> is responsible for $215 million in unfunded liabilities, which must to be stated in its annualfinancial reports beginning in FY 2009. The <strong>City</strong> will continue to actively pursue ways to manage retireehealthcare costs as well as its unfunded liabilities.Operating Expenses, the second largest expenditure category, is 36.97%, <strong>of</strong> the total <strong>2010</strong>/<strong>2011</strong> <strong>Budget</strong>. Thiscategory has decreased approximately $5,971,304, or –10.32% from the previous fiscal year. This decrease inoperating expenses is primarily attributed to reductions in information service charges, fleet management chargesfor all funds, labor pr<strong>of</strong>essional and legal fees for Employee Services and the Attorney’s Office, and demolitioncosts within the Department <strong>of</strong> Development’s Inspection Division. These reductions will be <strong>of</strong>fset by increasesto insurance costs, indirect costs or cost allocation plan, construction project costs for Celebration Park, Water andSewer Operations and Maintenance Funds, and pr<strong>of</strong>essional service fees for the Neighborhood StabilizationProgram Fund.Miscellaneous expenditures represent 12.80% <strong>of</strong> the total citywide budget. This category consists <strong>of</strong> Transfers,Increase in Fund Equity, Debt Services, Grants, and Block Grant Services. For FY <strong>2011</strong>, this category willincrease by 26.58%, or $3,773,003, from the <strong>2010</strong> budgeted levels. This increase in these costs are primarilyattributed to increases in the principal and interest payments for Water and Sewer Operations and MaintenanceFunds as well as increase in the federal entitlement appropriation for Community Development Block GrantFunds.Capital Outlay, which accounts for 3.36% <strong>of</strong> the total citywide budget, will decrease $3,112,962, or –39.73%from FY <strong>2010</strong>. The decrease in Capital Outlay is a direct result <strong>of</strong> the reduction in the number <strong>of</strong> constructionprojects for Water and Sewer Operations and Maintenance Funds.43
EXPENDITURES BY CATEGORY ANALYSIS<strong>2010</strong>/<strong>2011</strong> APPROVED BUDGET2009/<strong>2010</strong>APPROVEDBUDGET<strong>2010</strong>/<strong>2011</strong>APPROVEDBUDGETCHANGEEXPENDITURE % OF % OFCATEGORY AMOUNT TOTAL AMOUNT TOTAL AMOUNT %* %**Personnel Services 67,213,347 45.69% 65,814,076 46.87% (1,399,271) -0.95% -2.08%Operating Expenses 57,875,379 39.34% 51,904,075 36.97% (5,971,304) -4.06% -10.32%Capital Outlay 7,835,900 5.33% 4,722,938 3.36% (3,112,962) -2.12% -39.73%Miscellaneous*** 14,193,464 9.65% 17,966,467 12.80% 3,773,003 2.56% 26.58%TOTAL FUNDS 147,118,090 100% 140,407,556 100% (6,710,534) -4.56% N/A* Change in each expenditure category as a percentage <strong>of</strong> the total 2009/<strong>2010</strong> Approved <strong>Budget</strong>.** Change in each expenditure category as a percentage <strong>of</strong> total 2009/<strong>2010</strong> expenditure category.*** Miscellaneous category includes Transfers, Increase in Fund Equity, Debt Service, Grants, and Block Grant Services.Expenditure by Category2009/<strong>2010</strong> Approved <strong>Budget</strong> and <strong>2010</strong>/<strong>2011</strong> Approved <strong>Budget</strong>807060Millions504030<strong>2010</strong>0Personnel Services Operating Expenses Capital Outlay Miscellaneous44
SUMMARY OF (FTE) POSITIONS<strong>2010</strong>/<strong>2011</strong> APPROVED BUDGETSummary <strong>of</strong> (FTE) Positions250# <strong>of</strong> budget (FTE) positions20015010050-GeneralGovernmentFiscal Services Police Fire Development PublicServices2009/<strong>2010</strong> <strong>2010</strong>/<strong>2011</strong>TechnicalServicesThe above summary compares positions in the <strong>2010</strong> Approved <strong>Budget</strong> with those in the <strong>2011</strong> Approved <strong>Budget</strong> by <strong>of</strong>fices,departments, and divisions. The total full-time budgeted positions in <strong>2010</strong> was 483.85 compared to 474.70 in the <strong>2011</strong>Approved <strong>Budget</strong>, a net decrease <strong>of</strong> 9.15 positions.The Department <strong>of</strong> General Government will increase by a total <strong>of</strong> .55 FTE. In the Employee Services Office a part-time HRSupport Staff positions will be added. In the <strong>City</strong> Clerk's Office an Election Assistant will be budgeted for FY <strong>2011</strong>. Thisposition is only budgeted during the years where there are multiple elections. These increases are <strong>of</strong>fset by the elimination <strong>of</strong>the Chief Assistant <strong>City</strong> Attorney.The Department <strong>of</strong> Fiscal Services will increase by a total <strong>of</strong> one FTE. In FY <strong>2011</strong>, the <strong>City</strong> is planning to hire anAdministrative (<strong>Budget</strong>) Analyst in the Administration Division <strong>of</strong> Fiscal Services. This individual will report directly to theAssistant to the <strong>City</strong> Manager/<strong>Budget</strong> Administrator and will assist in the <strong>City</strong> annual budget process. In the Income TaxDivision, the Office Assistant II will be reclassified to the Office Assistant III. In addition, the Assistant <strong>City</strong> Manager forFiscal Services and the Income Tax Manager will be retitled to the Assitant <strong>City</strong> Manager for Administrative Services andIncome Tax Administrator.The Department <strong>of</strong> Public Safety will decrease by a total <strong>of</strong> 3.40 FTE. In the Police Department the following positions will beeliminated: Staff Pr<strong>of</strong>essional in the Police Administration Division, Property and Building Maintenance Supervisor, ServicePerson Mechanic, two part-time Property & Supply Clerks in the Building and Property Management Division, and a part timeClerical I in the Investigative Services Division. These eliminations will be <strong>of</strong>fset by the addition <strong>of</strong> the Assistant <strong>City</strong> Managerfor Public Safety in the Office <strong>of</strong> the Chief and a Technical Services Supervisor in the Technical Services Division. TheAssistant <strong>City</strong> Manager for Public Safety will be shared between the Police and Fire Departments.The Department <strong>of</strong> Development will increase, in total, by two positions from the <strong>2010</strong> budgeted levels. During FY <strong>2010</strong>, the<strong>City</strong> hired the Assistant Director <strong>of</strong> Development. This individual is split between the General Fund, the CommunityDevelopment Block Grant Fund, and the Neighborhood Stablization Program Fund (NSP). Also in the NSP Fund theConstruction Coordinator will be added. This position will be strictly paid from grant funds for the next three years. To <strong>of</strong>fsetthese additions, a Code Enforcement Officer and the Office Assistant II will be eliminated. In addition, the Licensed Inspectorwill be shared between Inspections and the Neighborhood Stabilization Program Fund. The Accountant/ SEDCCoordinator has been retitled to the NSP Accountant/Compliance Officer. This position will now be 100% paid out <strong>of</strong> the NSP45
Fund. As an effort to create efficiency, the <strong>City</strong> will be combining ordinance and fine services under the oversight <strong>of</strong> theLicensed Inspector. Therefore, in FY <strong>2011</strong> the Parking Operations Fund and Environmental Improvement Division <strong>of</strong> theRubbish Collection Fund will fall under the direction <strong>of</strong> the Licensed Inspector. With the changing <strong>of</strong> the reporting structure,one Meter Attendant will be eliminated from the complement, the other Meter Attendant position will be retitled to a ParkingEnforcement Officer, and the Environmental Support Specialist will report directly to the Licensed Inspector.The Department <strong>of</strong> Public Services will decrease in total by 9 FTE. The Traffic Engineering individuals within the GeneralFund will be recognized in the Streets Fund in <strong>2011</strong>. In the Cemeteries Division, the Cemeteries Supervisor will be retitled tothe Cemeteries Foreman. The Superintendent <strong>of</strong> Right <strong>of</strong> Way will be eliminated from the personnel complement. Thisposition was shared between the Streets and the Rubbish Collection Funds. The <strong>City</strong> Engineer will be responsible for the Right<strong>of</strong> Way (ROW) Division. The Assistant Superintendent <strong>of</strong> ROW will be retitled to the ROW Administrator. In addition, theChief Foremans and Utiltities Foremans will be retitled to the Chief ROW Street Foreman, the Chief ROW Utilities Foreman,ROW Street Foreman, and ROW Utilities Foreman respectively. Since the <strong>City</strong> Engineer has been granted additionalresponsibilites, an Assistant <strong>City</strong> Engineer will be added to the complement. The Environmental Support Specialist and theMeter Attendants will report directly to the Department <strong>of</strong> Development.In the Water and Sewer Operations and Maintenance Fund two Administrative Pr<strong>of</strong>essional positions will be eliminated.Beginning in <strong>2010</strong>, the Geographical Information System will be a new department, known as Technical Services. Finally, inthe Motor Pool Operations Fund a Mechanic Equipment Repairperson II will be eliminated but <strong>of</strong>fset by the addition <strong>of</strong> theFleet Administrator.In FY <strong>2011</strong>, a new department will be created. It is called Water and Wastewater Treatment Plant. This department will beheaded by the Director <strong>of</strong> Water and Wastewater Treatment, who reports directly to the <strong>City</strong> Manager. In addition, thefollowing positions will be eliminated from the personnel complement: a Laboratory Technician, two Filtration MaintenancePerson I, and an Intern. Therefore, the total positional decrease will be 2.6 FTE.In <strong>2010</strong>, the <strong>City</strong> created the Technical Services Department. This department consists <strong>of</strong> the Geographichal InformationSystems Division <strong>of</strong> the Department <strong>of</strong> Public Services and the Information Services Department. Because <strong>of</strong> the retirement <strong>of</strong>two employees - Dircetor <strong>of</strong> Information Services and the Application Analyst, the city was able to combine its technologicalservices. The GIS Administrator was promoted to department head status and has oversight <strong>of</strong> this department. The GISAdministrator's title was changed to the Technical Services Director. This employee reports directly to the Assistant <strong>City</strong>Manager for Administrative Services. The Assistant Director <strong>of</strong> IS, Web Technology Developer, and the SGTV Director willbe retitled to Assistant Director <strong>of</strong> Technical Services, Information Technology Analyst, and SGTV Coordinator. The totalpositional complement for this department is 7.6.46
BUDGET SUMMARYUNDESIGNATED FUND BALANCE ANALYSISThe <strong>City</strong> <strong>of</strong> <strong>Saginaw</strong> operates from a balanced budget at the onset <strong>of</strong> every fiscal year. Undesignatedfund balance or prior year budgetary surplus can be appropriated to balance a fund’s budget if asufficient balance/surplus exists and the appropriation is fiscally prudent. In FY <strong>2011</strong>, the General Fundhas appropriated $750,000, <strong>of</strong> its undesignated fund balance. This is the same as what was appropriatedin FY <strong>2010</strong>.The Special Revenue Funds is projected to end FY <strong>2010</strong> in a budgetary surplus. The primary reason forthis savings is a direct result <strong>of</strong> FEMA monies received for Major and Local Street. In FY 2008 theStreet Funds realize a budgetary deficit due to a windstorm that produced substantial damage to manytrees and streets. The cleanup costs were in excess <strong>of</strong> $1 million. Subsequent to year-end FY 2008, the<strong>City</strong> applied to FEMA to get federal reimbursement for the cleanup costs. FEMA approved and issuedthe <strong>City</strong> reimbursement for this clean up. A secondary reason for the projected fund balance is due toincrease grant allocation for public safety. In FY <strong>2010</strong>, the city was awarded the COPS Hiring Grant aswell as Shotspotter Grant. These monies was be utilized in FY <strong>2011</strong> for five additionally CommunityPolice Officers as well as the implementation <strong>of</strong> crime technology.Enterprise Funds for year-ending FY <strong>2010</strong> is projected to have a surplus <strong>of</strong> $11,175,847. This positiveending balance is a direct result <strong>of</strong> the <strong>2010</strong> Water Revenue Bonds proceeds. In addition, this savingshad been <strong>of</strong>fset by continue decline in the Parking Operations and Maintenance Fund, the -$377,600deficit in the unrestricted retained earnings balance for the Parking Operations Maintenance Fund as <strong>of</strong>June 30, 2009 was and continues to be attributed to the following factors: decline in the parking ticketrevenues, broken collection system, retirement <strong>of</strong> employees, and dilapidation <strong>of</strong> old parking structures.The decline in these revenues continues to be addressed through intergovernmental communication andimproved technology that would streamline the ticket writing process. The <strong>City</strong> will continue toaggressively pursue past due tickets as well as scrutinize all expenditures.Internal Services Fund’s June 30, <strong>2011</strong> undesignated fund balance is projected at $7.3 million. This dueto an increase in Charges for Services for the Motor Pool Operations, Technical Services – InformationServices, Technical Services – Geographical Information System costs, Workers Compensation, andRadio Operations.Fiduciary Fund projects a $105,586,803 estimated undesignated fund balance for June 30, <strong>2011</strong>.Favorable market conditions have produced significant gains in the Police and Fire Pension and theUnfunded Liabilities Funds.47
UNDESIGNATED FUND BALANCE ANALYSIS<strong>2010</strong>/<strong>2011</strong> BUDGETSPECIALINTERNALGENERAL REVENUE ENTERPRISE SERVICE FIDUCIARYFUND FUNDS FUNDS FUNDS FUNDSUndesignated Fund Balance (Deficit)- June 30, 2009 748,489 2,079,350 25,831,240 8,187,830 96,073,530FY <strong>2010</strong> Projected Revenues 32,156,812 20,894,611 34,919,625 3,566,880 25,092,354FY <strong>2010</strong> Projected Expenditures (w/ Encumb) 32,142,447 22,558,055 49,575,018 4,364,953 15,579,081Est. Undesignated Fund Balance (Deficit) - June30, <strong>2010</strong> 762,854 415,906 11,175,847 7,389,758 105,586,803FY 11 Estimated Revenues:Property Taxes 4,026,753 4,715,722 0 0 0<strong>City</strong> Income Taxes 12,079,000 0 0 0 0State Revenue Sharing 8,796,292 4,488,038 0 0 0Grants 1,845,990 11,519,054 1,124,900 0 0Licenses, Permits, and Fees 1,221,850 21,500 600 0Charge for Services 975,614 1,399,750 35,375,422 4,022,468 7,594,222Fines and Forfeitures 245,000 49,570 264,000 0 0Interest 436,100 178,001 621,000 10,000 2,666,466Rents 30,000 0 0 0Reimbursements 3,217,539 509,000 0 0Other Revenues 1,327,781 3,880,677 20,681,659 760,905 6,407,683Total FY 10 Estimated Revenues 34,201,919 26,761,312 58,067,581 4,793,373 16,668,371Total Resources Available for Appropriation 34,964,773 27,177,218 69,243,428 12,183,131 122,255,174FY 11 Expenditure Appropriations:General Government 2,110,318 0 0 0 0Fiscal Services 2,600,629 0 0 0 0Police 12,285,671 4,084,267 0 0 13,336,050Fire 8,856,190 1,576,512 0 0 0Highways and Streets 0 5,962,719 0 0 0Garbage and Rubbish 0 3,457,634 0 0 0Public Works 0 25,550 56,863,899 462,226 33,700Development 1,194,272 10,860,186 0 0 0Public Services (GF) 3,352,362 0 0 0 0Other General Services 3,802,477 709,444 1,203,682 4,331,147 3,298,621Total FY 10 Expenditure Appropriations 34,201,919 26,676,312 58,067,581 4,793,373 16,668,371Estimated Undesignated Fund Balance - June30, <strong>2011</strong> 762,854 500,906 11,175,847 7,389,758 105,586,80348
GENERAL FUND REVENUES
RESOURCE ALLOCATION<strong>2010</strong>/<strong>2011</strong> APPROVED BUDGETRESOURCESAPPROPRIATIONSPROPERTY TAXES 4,026,753 GENERAL GOVERNMENT 2,110,318CITY INCOME TAXES 12,079,000 FISCAL SERVICES 2,600,629STATE REVENUE POLICE 12,285,671SHARING 8,796,292FIRE 8,856,190GRANTS 1,845,990DEVELOPMENT 1,194,272LICENSES, PER<strong>MI</strong>TS,& FEES 1,221,850 PUBLIC SERVICE (GF) 3,352,362CHARGE FOR SERVICES 975,614 OTHER GENERAL FUND 3,802,477FINES ANDFORFEITURES 245,000INTEREST 436,100RENTS 30,000REIMBURSEMENTS 3,217,539FUND BALANCE 750,000OTHER REVENUES 577,781TOTAL RESOURCES 34,201,919 TOTAL APPROPRIATIONS 34,201,91949
CITY OF SAGINAWSCHEDULE OF TAXABLE VALUE2001 2002 2003 2004 2005BY PROPERTY TYPEReal PropertyAgricultural 118,773 118,773 98,362 99,786 102,078Commercial 80,479,980 85,587,616 90,909,193 93,217,849 95,061,305Industrial 46,621,391 44,668,255 44,860,660 45,112,282 49,008,656Residential 388,116,469 403,269,702 413,964,808 428,229,633 442,314,586Total Real 515,336,613 533,644,346 549,833,023 566,659,550 586,486,625Personal PropertyCommercial 41,582,426 47,149,374 45,770,900 41,335,600 42,377,998Industrial 146,661,900 88,485,700 71,968,600 68,297,000 62,754,000Utility 18,241,000 18,720,800 14,844,100 14,669,100 14,982,400Total Personal 206,485,326 154,355,874 132,583,600 124,301,700 120,114,398Total Real & Personal 721,821,939 688,000,220 682,416,623 690,961,250 706,601,023BY TAXPAYER CLASSAgricultural 118,773 118,773 98,362 99,786 102,078Commercial 122,062,406 132,736,990 136,680,093 134,553,449 137,439,303Industrial 193,283,291 133,153,955 116,829,260 113,409,282 111,762,656Residential 388,116,469 403,269,702 413,964,808 428,229,633 442,314,586Utility 18,241,000 18,720,800 14,844,100 14,669,100 14,982,400Total 721,821,939 688,000,220 682,416,623 690,961,250 706,601,0232006 2007 2008 2009 <strong>2010</strong>BY PROPERTY TYPEReal PropertyAgricultural 105,157 77,958 95,631 114,440 109,851Commercial 95,064,902 96,361,425 96,304,235 94,999,826 93,930,967Industrial 48,980,153 48,939,004 47,738,218 47,161,286 32,053,496Residential 461,076,412 477,680,156 471,601,430 445,170,091 388,236,562Total Real 605,226,624 623,058,543 615,739,514 587,445,643 514,330,876Personal PropertyCommercial 41,796,637 45,810,753 43,787,288 40,897,871 36,550,100Industrial 65,211,400 55,373,600 45,371,600 39,775,400 39,087,100Utility 15,691,400 16,306,500 16,742,300 17,433,000 18,003,800Total Personal 122,699,437 117,490,853 105,901,188 98,106,271 93,641,000Total Real & Personal 727,926,061 740,549,396 721,640,702 685,551,914 607,971,876BY TAXPAYER CLASSAgricultural 105,157 77,958 95,631 114,440 109,851Commercial 136,861,539 142,172,178 140,091,523 135,897,697 130,481,067Industrial 114,191,553 104,312,604 93,109,818 86,936,686 71,140,596Residential 461,076,412 477,680,156 471,601,430 445,170,091 388,236,562Utility 15,691,400 16,306,500 16,742,300 17,433,000 18,003,800Total 727,926,061 740,549,396 721,640,702 685,551,914 607,971,876
GENERAL FUND REVENUETotal <strong>2010</strong>/<strong>2011</strong> Approved General Fund resources are budgeted at $34,201,919, which represents a decrease<strong>of</strong> $1,283,567, or -3.76%, from <strong>2010</strong> approved resources <strong>of</strong> $35,485,136.PROPERTY TAXES<strong>City</strong> property taxes are levied each July 1 on the taxable value <strong>of</strong> property located in the <strong>City</strong> as <strong>of</strong> thepreceding December 31, tax day and the lien date. In accordance with the provisions <strong>of</strong> Proposal A (seebelow), taxable value is the lower <strong>of</strong> the following three computations: 1) assessed/state equalized value; 2) theprior year’s taxable value multiplied by the increase in the consumer price index or five percent (5%),whichever is less; or 3) the multiplier value. Proposal A requires the <strong>City</strong> Assessor to annually establish theassessed values and the equalization <strong>of</strong> said assessed values by the State <strong>of</strong> Michigan at 50 percent <strong>of</strong> currentmarket value, prior to the application <strong>of</strong> formulas to determine the taxable value. Real property taxable valuefor the July 1, <strong>2010</strong> levy will be assessed at $514,330,876 and personal property taxable value will be assessedat $93,641,000.The <strong>City</strong> <strong>of</strong> <strong>Saginaw</strong>’s operating tax rate for FY <strong>2011</strong> is projected to be 6.2976 mills (limited to 7.50 mills)with an additional 2.9532 mills for rubbish collection. A special assessment <strong>of</strong> 6.0000 mills is also levied forpublic safety. The <strong>City</strong> does not levy for debt service.On March 15, 1994, voters in the State <strong>of</strong> Michigan approved Proposal A, a property tax reform proposal,which shifted the funding <strong>of</strong> education from property taxes to a combination <strong>of</strong> property taxes, higher sales taxand a real estate transfer tax. Property taxes were reduced to a maximum <strong>of</strong> six mills for homestead propertyand eighteen mills for non-homestead property; the State Sales Tax was increased from four cents to six cents;and a new real estate transfer tax <strong>of</strong> $7.50 per thousand dollars was added. In addition, Proposal A restrictedthe growth <strong>of</strong> assessments on individual properties to the increase in the consumer price index or five percent(5%); whichever is less, until ownership <strong>of</strong> the property is transferred. The citizens <strong>of</strong> <strong>Saginaw</strong> subsequentlyapproved an additional four mills for public libraries when Proposal A eliminated their millage from theschool’s millage and another three mills to operate a public transportation system.Taxes are due and payable on July 1 at the <strong>City</strong> Treasurer’s Office and become delinquent after 30 days. To allreal and personal taxes paid on or after August 1, there shall be added interest at the rate <strong>of</strong> ½ <strong>of</strong> 1 percent forevery month, or fraction there<strong>of</strong>, from August 1 until the date <strong>of</strong> payment. A penalty <strong>of</strong> ½ <strong>of</strong> 1 percent isadded after July 31. From March 1 and thereafter, real taxes are collected by the Treasurer <strong>of</strong> <strong>Saginaw</strong> County,who adds and keeps a collection fee <strong>of</strong> four percent (4%) on the unpaid balance, and in addition, adds interestat the rate <strong>of</strong> one percent (1%) per month from March 1 until the date <strong>of</strong> payment. Unpaid taxes, together withall charges thereon, become a continuing lien on the property assessed. The general tax law provides that realestate with delinquent taxes shall be sold at a state land sale.Tax LimitationBy general law, property taxes for <strong>City</strong> purposes are limited to two percent (2%) <strong>of</strong> the assessed valuation <strong>of</strong>all real and personal property in the municipality, provided that no such restriction shall prevent the levy <strong>of</strong>taxes required for the payment <strong>of</strong> general debt obligations.The charter <strong>of</strong> the <strong>City</strong> <strong>of</strong> <strong>Saginaw</strong> provided that <strong>City</strong> taxes shall be subject to the overall limitation (<strong>City</strong>,School and County) imposed by Section 21, Article X, <strong>of</strong> the Michigan State Constitution, which is 1-1/2percent <strong>of</strong> assessed value exclusive <strong>of</strong> debt incurred prior to December 8, 1932. Act No. 44, Public Acts <strong>of</strong>1948, effective August 20, 1948, amended all Michigan city charters nullifying charter limitations andauthorized that the levy for city purposes shall not exceed one percent (1%) <strong>of</strong> assessed valuation in any one51
year, unless and until a different tax rate limitation is provided by charter. State equalized valuations havebeen used in place <strong>of</strong> local assessed valuations.On November 6, 1979, pursuant to an initiatory referendum, the <strong>City</strong> Charter was amended by the electors <strong>of</strong>the <strong>City</strong> <strong>of</strong> <strong>Saginaw</strong> to reduce the maximum property tax that may be levied by the <strong>City</strong> in any year from 10mills to 7.50 mills. The amendment further provided that if in subsequent years the assessed value <strong>of</strong> allproperty within the <strong>City</strong> is increased for any reason, this maximum 7.50 mill rate would have to bepermanently reduced so as to yield the same gross dollar revenue as the fiscal year 1979 property tax revenueyield ($3,828,778). The amendment further provided for up to a 3 mill emergency levy if a specific emergencyis declared by the Mayor and concurred in by a 3/4 vote <strong>of</strong> the full Council.On November 5, 2002, May 3, 2005, and November 3, 2009, special elections were held to remove theproperty tax dollar limitation <strong>of</strong> $3,828,778 and the 7.50 mill limitation that was approved by the voters onNovember 6, 1979. The voters overwhelmingly defeated the proposal in these special elections.LOCAL INCOME TAXESThe <strong>City</strong> <strong>of</strong> <strong>Saginaw</strong> receives approximately 35.32% <strong>of</strong> its General Fund revenue from local income tax.Economic conditions continue to have a negative impact on this revenue source. For the <strong>2010</strong>/<strong>2011</strong> Approved<strong>Budget</strong>, the revenue from income taxes is expected to decrease $54,000, or –.45%. The decrease is primarilydue to the continued loss <strong>of</strong> business within the <strong>City</strong>.STATE SHARED REVENUESThe <strong>City</strong> <strong>of</strong> <strong>Saginaw</strong> receives approximately 25.72% <strong>of</strong> its General Fund revenue from state revenue sharing.The State <strong>of</strong> Michigan has experienced significant budget problems, which it attempted to partially remedy bycutting payments <strong>of</strong> shared sales tax revenues to local units <strong>of</strong> government. The <strong>City</strong>’s <strong>2010</strong>/<strong>2011</strong> Approved<strong>Budget</strong> reflects an overall decrease <strong>of</strong> 18.64%. The decrease in the State Shared Revenue is further reductionin state shared revenue payments from the <strong>2010</strong> approved budgeted levels.GRANTSFor FY <strong>2011</strong>, the <strong>City</strong> has budgeted $1,845,990 for federal grant funding related to police overtime, gasreimbursements for drug enforcement, riverfront, and federal stimulus monies for energy efficiency.LICENSES, PER<strong>MI</strong>TS, & FEESThe <strong>City</strong> anticipates $1,221,850, for licenses, permits, and fees for FY <strong>2011</strong>. This represents an increase <strong>of</strong>$102,700, over the projected <strong>2010</strong> revenue. This includes business licenses, building permits, and cabletelevision franchise fees.CHARGE FOR SERVICESThe total projected charges for services for FY <strong>2011</strong> is $975,614. Charges for services include cemeterycharges, Public Act 425, and Police and Fire Services. Future State <strong>of</strong> Michigan Public Act 425 Agreements orcorresponding service agreements are being negotiated with other communities as they increase business andresidential development. These agreements will provide a direct revenue flow to the General Fund.52
FINES AND FORFEITURESThe revenue in this category includes ordinance fines and transfer affidavit fees. The revenue in this categoryis anticipated to increase from the <strong>2010</strong> approved revenue by $45,000, or 18.37%.INTEREST REVENUEInterest revenue is projected to decrease by $100,000, or 22.93% from <strong>2010</strong> approved. This is primarily due tothe expected decrease in the interest rate values on the <strong>City</strong>’s pooled cash.REIMBURSEMENTSThe General Fund charges cost allocations to other funds as a part <strong>of</strong> its internal cost allocation plan. In 2001,2007, 2009, and <strong>2010</strong> the <strong>City</strong> hired Maximus to prepare a cost allocation plan. For FY <strong>2011</strong>, a total <strong>of</strong>$2,920,772 will be budgeted for the indirect cost allocation plan.OTHER REVENUESOther revenues will decrease $761,091, from <strong>2010</strong> budgeted levels. This includes miscellaneous revenuerelated to police department services, donations, the sale <strong>of</strong> assets, and transfers from other funds.ANALYTICAL REVIEW:The three major revenue sources for the <strong>City</strong> <strong>of</strong> <strong>Saginaw</strong> have been Property Taxes, Income Taxes, and StateShared revenues. Listed below is a graphical representation <strong>of</strong> the history <strong>of</strong> these revenue sources.General Fund's Three Major Revenue Sources181614(in millions)121086420Years2000 2001 2002 2003 2004 2005 2006 2007 2008 2009 <strong>2010</strong> <strong>2011</strong>Property Taxes Income Taxes State Shared RevenuesWhat is notable from the graph above is that over the past 10 years, property taxes are level and stagnant. The<strong>City</strong> <strong>of</strong> <strong>Saginaw</strong> has become more reliant on Income Tax and State Shared revenues, and both have beensignificantly decreased.53
REVENUE ANALYSIS SUMMARY<strong>2010</strong>/<strong>2011</strong> APPROVED BUDGET<strong>2010</strong> <strong>2010</strong> <strong>2011</strong>2007 2008 2009 Approved Adjusted <strong>2010</strong> ApprovedActual Actual Actual <strong>Budget</strong> <strong>Budget</strong> Projected <strong>Budget</strong>Property Taxes 4,997,694 3,947,494 3,807,995 3,992,594 3,992,594 3,625,986 4,026,753<strong>City</strong> Income Taxes 13,406,280 12,776,297 12,359,364 12,025,000 12,025,000 11,618,714 12,079,000State Revenue Sharing 9,837,511 10,190,127 10,321,778 10,435,721 8,872,059 8,831,350 8,796,292Grants 92,399 406,812 514,869 1,194,000 1,664,039 1,048,779 1,845,990Licenses, Permits, & Fees 786,611 924,840 1,104,670 1,119,150 1,119,150 1,182,672 1,221,850Charge for Services 656,280 763,822 925,659 834,939 925,384 1,039,513 975,614Fines and Forfeitures 261,630 184,337 243,135 200,000 200,000 252,460 245,000Interest 570,248 506,623 381,913 536,100 468,300 397,386 436,100Rents 500 104,073 31,218 500 32,360 32,360 30,000Reimbursements 2,409,528 2,810,120 2,679,919 3,058,260 3,092,376 3,149,869 3,217,539Fund Balance 0 0 0 750,000 1,148,565 0 750,000Other Revenues 788,057 253,699 1,430,574 1,338,872 975,451 555,321 577,781TOTAL RESOURCES 33,806,737 32,868,243 33,801,094 35,485,136 34,515,278 31,734,411 34,201,919GENERAL FUND REVENUE<strong>2011</strong> Approved <strong>Budget</strong>0.09%1.28%0.72%2.85%9.41%2.19%1.69%11.77%3.57%5.40%35.32%25.72%Property Taxes <strong>City</strong> Income Taxes State Revenue Sharing Grants Licenses, Permits, & Fees Charge for ServicesFines and Forfeitures Interest Rents Reimbursements Fund Balance Other Revenues54
REVENUE ANALYSIS DETAIL<strong>2010</strong>/<strong>2011</strong> APPROVED BUDGET<strong>2010</strong> <strong>2010</strong> <strong>2011</strong>2007 2008 2009 Approved Adjusted <strong>2010</strong> ApprovedActual Actual Actual <strong>Budget</strong> <strong>Budget</strong> Projected <strong>Budget</strong>TAXESReal Property 2,996,707 3,027,151 3,054,522 2,957,493 2,957,493 3,046,504 2,930,034Real Property - IFT 5,745 5,341 3,961 3,089 3,089 2,937 3,151Personal Property 501,122 437,543 406,318 493,916 493,916 370,682 533,453Personal Property - IFT 111,740 85,614 29,160 36,096 36,096 33,061 28,115Property Taxes - Chargeback 0 (83,174) (251,240) 0 0 (228,277) 0Penalties & Interest 148,916 72,000 178,953 130,000 130,000 73,379 135,000Tax Administration Fees 373,999 375,005 346,628 345,000 345,000 327,701 345,000PROPERTY TAX 4,138,229 3,919,480 3,768,302 3,965,594 3,965,594 3,625,986 3,974,753Housing Commission 14,005 11,283 0 15,000 15,000 0 15,000Birch Park 0 20,534 39,693 12,000 12,000 0 37,000Bancr<strong>of</strong>t Eddy 0 12,712 0 0 0 0 0P. I. L. O. T. TAXES 14,005 44,529 39,693 27,000 27,000 0 52,000<strong>City</strong> Income Taxes 13,406,280 12,776,297 11,406,487 11,125,000 11,125,000 10,653,836 11,125,000Delinq <strong>City</strong> Income Tax 0 0 954,642 900,000 900,000 969,624 954,000425 Agreement Refund 0 0 (1,765) 0 0 (4,745) 0INCOME TAXES 13,406,280 12,776,297 12,359,364 12,025,000 12,025,000 11,618,714 12,079,000TOTAL TAXES 17,558,514 16,740,306 16,167,359 16,017,594 16,017,594 15,244,701 16,105,753INTERGOVERNMENTALStatutory 6,102,944 5,945,785 5,955,258 6,244,906 4,948,318 4,948,319 4,970,054Constitutional 4,157,409 4,260,144 4,034,558 4,110,104 3,770,244 3,802,570 3,748,488Inventory Tax Reimb. (467,289) (467,289) 0 (467,289) 0 0 0Liquor Licenses 43,157 41,635 38,087 44,000 44,000 36,414 44,000State Grants 1,290 0 293,875 504,000 109,497 44,047 33,750STATE SHARED REV. 9,837,511 9,780,275 10,321,778 10,435,721 8,872,059 8,831,350 8,796,292FEMA 0 0 96,803 0 0 (292) 0Homeland Security Training 0 0 1,978 0 0 632 1,800Federal Grants 224,754 43,160 18,349 1,194,000 1,194,000 307,206 1,124,759EECBG 0 0 0 0 54,000 250,000 316,000Police Drug Overtime 110,439 111,377 134,968 123,421 123,421 158,103 133,431Miscellaneous 0 0 22,795 0 0 0 0Reimbursement/Medicare 273,632 1,800 239,976 240,000 292,618 333,130 270,000GRANTS 608,825 156,337 514,869 1,557,421 1,664,039 1,048,779 1,845,990TOTAL INTERGOV'TAL 10,446,336 9,936,612 10,836,647 11,993,142 10,536,098 9,880,130 10,642,282LICENSES, PER<strong>MI</strong>TS & FEESOccupational 24,369 23,364 27,900 25,000 25,000 32,784 30,200General Business License 75,650 70,000 84,568 75,000 75,000 76,145 79,500TOTAL LICENSES 100,019 93,364 112,468 100,000 100,000 108,929 109,70055
REVENUE ANALYSIS DETAIL<strong>2010</strong>/<strong>2011</strong> APPROVED BUDGET<strong>2010</strong> <strong>2010</strong> <strong>2011</strong>2007 2008 2009 Approved Adjusted <strong>2010</strong> ApprovedActual Actual Actual <strong>Budget</strong> <strong>Budget</strong> Projected <strong>Budget</strong>Housing Registration Fees 176,515 166,998 279,609 250,000 250,000 333,562 303,000Building Permits 165,333 108,209 97,555 125,000 125,000 114,037 150,000Electrical Permits 44,954 28,185 23,585 30,000 30,000 24,137 36,000Mechanical Permits 54,276 25,309 20,555 30,000 30,000 27,869 35,000Plumbing Permits 34,545 22,335 18,035 30,000 30,000 11,935 35,000Sign Permits 1,450 1,250 2,800 1,500 1,500 3,030 1,500Street Cut Permits 3,315 1,680 2,235 1,500 1,500 465 500Curb Cut Permits 405 255 435 300 300 300 300Fire Department Permits 0 75 211 700 700 75 700Barricade Permits 1,890 1,800 1,267 150 150 150 150TOTAL PER<strong>MI</strong>TS 482,682 356,096 446,287 469,150 469,150 515,560 562,150Telecommunications Fees 0 500 0 0 0 0 0Cable TV Franchise Fees 709,549 467,434 494,485 500,000 500,000 516,782 500,000Cable TV PEG Fees 0 0 51,430 50,000 50,000 41,401 50,000TOTAL FEES 709,549 467,934 545,915 550,000 550,000 558,183 550,000TOTAL LIC./PERM/FEES 1,292,250 917,394 1,104,670 1,119,150 1,119,150 1,182,672 1,221,850CHARGE FOR SERVICESTea House Fees 5,441 6,983 1,109 7,000 7,000 0 7,000RECREATION 5,441 6,983 1,109 7,000 7,000 0 7,000PILOT Application Fee 0 0 2,500 2,500 2,500 0 2,500Witness Fees 7,467 19,473 23,421 15,000 15,000 10,534 20,000Board <strong>of</strong> Appeal Case Fees (735) 0 0 0 0 50 0Zoning Code Fees 11,515 6,430 5,625 7,000 7,000 5,005 7,000Fire System Plan Review 50 50 200 200 200 700 200Franchise Application Fees 0 0 0 0 0 0 0Attorney Collections 0 2 0 0 0 6 0Traffic Engineering 0 1,000 0 0 0 0 0Public Act 425 111,089 118,000 244,089 242,689 283,689 283,689 244,000Election Services 0 23,780 (1) 0 0 0 0Special Events Services 35,577 25,000 41,740 30,000 30,000 35,424 30,000Special Events Ojibway 7,830 5,942 11,850 7,000 7,000 5,940 7,500Engineering Plans 2,476 1,535 4,256 1,500 1,500 3,893 750Abandoned Vehicles 13,800 0 0 0 0 0 0Sale <strong>of</strong> Junk 784 624 1,632 1,000 1,000 176 250Traffic Signs 0 50 25 50 50 4 50Materials and Services 16,267 14,230 14,031 25,000 25,000 15,555 14,000TOTAL GENERAL GOVT. 206,119 216,116 349,368 331,939 372,939 360,975 326,25056
REVENUE ANALYSIS DETAIL<strong>2010</strong>/<strong>2011</strong> APPROVED BUDGET<strong>2010</strong> <strong>2010</strong> <strong>2011</strong>2007 2008 2009 Approved Adjusted <strong>2010</strong> ApprovedActual Actual Actual <strong>Budget</strong> <strong>Budget</strong> Projected <strong>Budget</strong>Gun Registration Fees 1,505 1,815 1,845 1,800 1,800 1,825 1,800Vehicle Storage Fees 0 30 0 0 0 0 0Hazmat Clean Up Fees 4,531 2,291 1,092 2,800 2,800 16,447 27,000False Alarm Fees 1,050 1,680 6,425 5,000 5,000 2,675 8,500Police Department 43,586 36,163 47,710 24,400 64,400 80,136 88,064Fire Department 1,885 1,957 1,763 2,000 2,000 3,785 2,000Materials and Services 35,640 0 0 0 0 0 0TOTAL POLICE & FIRE 88,196 43,936 58,835 36,000 76,000 104,868 127,364Internment Services 303,318 247,909 252,221 240,000 249,445 300,011 275,000Markers and Bases 70,274 34,549 52,315 30,000 30,000 35,115 30,000Grave Spaces 146,268 127,689 133,827 120,000 120,000 159,574 133,000Materials and Services 74,558 87,651 77,984 70,000 70,000 78,969 77,000TOTAL CEMTERIES 594,418 497,798 516,347 460,000 469,445 573,669 515,000TOTAL CHARGE SVC. 894,174 764,833 925,659 834,939 925,384 1,039,513 975,614FINES & FORFEITURESOrdinance Fines 97,693 123,594 178,994 150,000 150,000 215,293 170,000Parking Violation Fines 68 893 546 0 0 245 0Civil Infractions 0 0 100 0 0 3,050 25,000Transfer Affidavit Fines 67,245 59,850 63,495 50,000 50,000 33,872 50,000TOTAL FINES & FORFEIT. 165,005 184,337 243,135 200,000 200,000 252,460 245,000INTERESTAndersen Loan 0 0 0 52,800 0 0 52,800Interest on Investments 219,118 179,374 80,656 160,000 160,000 31,182 110,000Interest on <strong>City</strong> Income Taxes 245,566 224,263 262,784 225,000 225,000 284,372 230,000Interest on Spec Asmts (6) 3,187 5,796 3,000 3,000 505 3,000Interest and Penalties 2,846 300 1,994 300 75,300 78,024 300Cemetery Int on Investments 117,029 98,984 30,683 95,000 5,000 3,303 40,000TOTAL INTEREST 584,553 506,108 381,913 536,100 468,300 397,386 436,100RENTS & PRIVILEGESCivitan Recreation Center 0 0 0 0 0 0 0Land and Building Rentals 500 104,073 31,218 500 32,360 32,360 30,000TOTAL RENTS & PRIV. 500 104,073 31,218 500 32,360 32,360 30,00057
REVENUE ANALYSIS DETAIL<strong>2010</strong>/<strong>2011</strong> APPROVED BUDGET<strong>2010</strong> <strong>2010</strong> <strong>2011</strong>2007 2008 2009 Approved Adjusted <strong>2010</strong> ApprovedActual Actual Actual <strong>Budget</strong> <strong>Budget</strong> Projected <strong>Budget</strong>OTHER REVENUESRecreation Programs-Grant 0 0 0 0 20,000 20,000 10,000<strong>City</strong>/Cty/School Liaison 10,000 10,000 100,000 10,000 10,000 10,000 10,000Riverfront Comm Donations 2,150 950 2,000 0 1,445 1,445 0Contributions 6,000 0 6,000 0 10,000 0 6,000CONTRIBUTIONS 18,150 10,950 108,000 10,000 41,445 31,445 26,000Sale <strong>of</strong> Land/Buildings 51,843 87,729 85,296 260,000 260,000 334 0Sale <strong>of</strong> Property Items 0 0 0 0 0 31 0SALES OF PROPERTY 51,843 87,729 85,296 260,000 260,000 365 0Special Assessments 45,108 83,207 357,576 350,000 350,000 50,811 100,000TOTAL SPECIAL ASSESS. 45,108 83,207 357,576 350,000 350,000 50,811 100,000Surplus Receipts 47,617 17,798 64,033 25,000 25,000 60,539 40,000Demolition Contracts 14,994 15,362 5,366 5,000 96,323 99,169 50,000Cash Over and Short (1,503) (13,310) 14,827 0 0 1,224 0Smoke Detectors 125 4,098 0 0 0 0 5,000Clerk's Dept Fees 0 0 0 0 0 300 900Police Donations 20,000 0 1,000 0 0 0 250Fire Donations 0 0 110 100 100 0 100Pawn Shop 0 4,543 16,024 24,000 24,000 17,262 24,000TOTAL SURPLUS RECEIPT 81,232 28,491 101,360 54,100 145,423 178,494 120,250Indirect Costs 2,351,376 2,737,821 2,483,939 2,876,471 2,876,471 2,929,843 2,920,772Weed and Seed Admin 0 0 0 16,688 16,688 0 16,688Insurance Proceeds 9,279 63,973 33,444 10,000 24,116 8,385 24,116Insurance Premiums 6,809 6,900 7,201 7,000 7,000 14,159 7,500Reimbursements 116,255 1,096 12,948 0 20,000 12,915 50,000<strong>Saginaw</strong> Housing Comm 0 0 142,387 148,101 148,101 144,532 158,463Pagers/Cell Phones 36 0 0 0 0 35 0Inspections 0 0 0 0 0 40,000 40,000TOTAL REIMBURSEMENTS 2,483,755 2,809,790 2,679,919 3,058,260 3,092,376 3,149,869 3,217,539Police Dept Services 10 480 20,172 8,163 8,163 1,018 1,000TOTAL PUB. SAFETY FEE 10 480 20,172 8,163 8,163 1,018 1,00058
REVENUE ANALYSIS DETAIL<strong>2010</strong>/<strong>2011</strong> APPROVED BUDGET<strong>2010</strong> <strong>2010</strong> <strong>2011</strong>2007 2008 2009 Approved Adjusted <strong>2010</strong> ApprovedActual Actual Actual <strong>Budget</strong> <strong>Budget</strong> Projected <strong>Budget</strong>Gain/Loss on Investment 0 0 0 0 0 0 0TOTAL G/L ON INVEST. 0 0 0 0 0 0 0TOTAL OTHER REVENUE 2,680,098 3,020,647 3,352,323 3,740,523 3,897,407 3,412,002 3,464,789Decrease in Fund Equity 0 500,000 0 750,000 1,148,565 0 750,000TOTAL FUND EQUITY 0 500,000 0 750,000 1,148,565 0 750,000Community Dev. Block Grant 0 13,963 0 0 0 0 0Transfer from Other Funds 0 20,763 0 0 0 0 0Insurance Fund 0 0 0 293,188 293,188 293,188 330,531Sick and Vacation Fund 0 0 0 0 0 0 0<strong>Budget</strong> Stabilization 0 0 0 0 0 0 0Radio Operation Fund 0 0 910,000 0 0 0 0TOTAL TRANSFERS 0 34,726 910,000 293,188 293,188 293,188 330,531TOTAL GENERAL FUND 33,621,430 32,709,036 33,952,924 35,485,136 34,638,046 31,734,411 34,201,91959
GENERAL FUND EXPENDITURES (101)<strong>2010</strong>/<strong>2011</strong> APPROVED BUDGET<strong>2010</strong> <strong>2010</strong> <strong>2010</strong>2007 2008 2009 Approved Adjusted <strong>2010</strong> ApprovedActual Actual Actual <strong>Budget</strong> <strong>Budget</strong> Projected <strong>Budget</strong>General Government 2,036,347 2,130,204 2,002,562 2,095,089 2,095,454 2,097,183 2,110,318Fiscal Services 2,153,864 2,604,139 2,443,015 2,487,010 2,460,825 2,371,353 2,600,629Police 11,332,238 11,566,200 12,437,639 13,500,573 12,941,753 12,105,889 12,285,671Fire 9,293,121 9,451,388 8,851,925 9,124,798 8,855,464 8,045,612 8,856,190Development 1,183,470 1,170,616 1,728,448 2,157,888 1,722,281 1,556,468 1,194,272Public Services (GF) 4,061,505 3,493,632 2,626,791 3,166,659 3,248,782 2,689,573 3,352,362Other General Fund 3,921,321 2,853,799 3,130,668 2,953,119 3,256,455 3,075,453 3,802,477TOTAL GENERAL FUND 33,981,866 33,269,978 33,221,048 35,485,136 34,581,014 31,941,531 34,201,919Personnel Services 22,775,269 24,322,324 25,615,341 28,664,616 27,579,366 25,698,214 26,688,494Operting Expenses 7,022,323 6,073,755 6,357,520 6,315,478 6,081,155 5,325,062 6,186,298Capital Outlay 262,950 20,100 76,578 0 44,834 39,572 8,000Miscellaneous 3,921,321 2,853,799 1,171,609 505,042 878,659 878,683 1,319,127TOTAL GENERAL FUND 33,981,863 33,269,978 33,221,048 35,485,136 34,584,014 31,941,531 34,201,919GENERAL FUND EXPENDITURES<strong>2011</strong> Approved <strong>Budget</strong>Other General Fund11.12%General Government6.17%Fiscal Services7.60%Public Services (GF)9.80%Development3.49%Fire25.89%Police35.92%60
GENERAL FUND APPROPRIATIONSGENERAL GOVERNMENTDEPARTMENT OF FISCAL SERVICESDEPARTMENT OF POLICEDEPARTMENT OF FIREDEPARTMENT OF DEVELOPMENTDEPARTMENT OF PUBLIC SERVICESOTHER GENERAL FUND
GENERAL GOVERNMENT
CITY OF SAGINAWOFFICE'S OF GENERAL GOVERNMENT<strong>City</strong>CouncilDarnell Earley<strong>City</strong> Manager<strong>City</strong> Manager'sOffice(including the<strong>Budget</strong> Office)<strong>City</strong>/County/SchoolLiaisonEmployeeServices<strong>City</strong> Clerk'sOfficeElections<strong>City</strong> Attorney'sOfficeNotes:SGTV is a function <strong>of</strong> the Technical Services Department and is listed on its organizational chart.
EXPENDITURE ANALYSIS SUMMARY<strong>2010</strong>/<strong>2011</strong> APPROVED BUDGET<strong>2010</strong> <strong>2010</strong> <strong>2011</strong>2007 2008 2009 Approved Adjusted <strong>2010</strong> ApprovedActual Actual Actual <strong>Budget</strong> <strong>Budget</strong> Projected <strong>Budget</strong>0101 CITY COUNCILPersonnel Services 17,343 17,985 16,434 19,529 19,529 15,381 19,452Operating Expenses 55,110 65,175 28,397 39,664 39,164 35,077 38,257Capital Outlay 0 0 0 0 0 0 0TOTALS 72,453 83,160 44,831 59,193 58,693 50,458 57,7090105 CITY/COUNTY/SCHOOLLIAISONPersonnel Services 0 0 0 0 0 0 0Operating Expenses 11,678 9,985 8,517 15,000 5,000 2,356 15,000Capital Outlay 0 0 1,000 0 0 0 0TOTALS 11,678 9,985 9,517 15,000 5,000 2,356 15,0001710 CITY MANAGERPersonnel Services 227,812 225,949 268,779 322,770 319,354 311,692 342,284Operating Expenses 69,834 82,469 73,173 44,818 43,859 32,480 58,991Capital Outlay 150 1,416 0 0 1,585 1,455 01711 SGTVTOTALS 297,796 309,834 341,952 367,588 364,798 345,627 401,275Personnel Services 29,022 29,652 34,216 40,427 40,427 36,490 43,160Operating Expenses 4,781 4,574 4,882 9,573 8,690 5,186 6,840Capital Outlay 0 0 0 0 750 675 0TOTALS 33,803 34,226 39,098 50,000 49,867 42,350 50,0001725 EMPLOYEE SERVICESPersonnel Services 460,645 432,599 418,336 353,217 348,652 397,697 351,152Operating Expenses 107,024 74,377 84,185 137,600 179,468 157,145 165,740Capital Outlay 270 0 0 0 0 0 0TOTALS 567,939 506,976 502,521 490,817 528,120 554,842 516,8921730 CITY CLERKPersonnel Services 290,738 263,181 270,424 295,430 291,658 291,945 262,630Operating Expenses 79,832 60,595 69,255 72,553 71,748 59,465 64,535Capital Outlay 632 0 493 0 1,520 1,520 0TOTALS 371,202 323,776 340,172 367,983 364,926 352,930 327,16563
EXPENDITURE ANALYSIS SUMMARY<strong>2010</strong>/<strong>2011</strong> APPROVED BUDGET<strong>2010</strong> <strong>2010</strong> <strong>2011</strong>2007 2008 2009 Approved Adjusted <strong>2010</strong> ApprovedActual Actual Actual <strong>Budget</strong> <strong>Budget</strong> Projected <strong>Budget</strong>1731 ELECTIONSPersonnel Services 107,333 82,277 89,147 67,022 66,184 68,000 131,013Operating Expenses 65,176 81,408 79,063 66,720 66,227 62,634 104,561Capital Outlay 0 1,006 10,331 0 17,151 17,151 0TOTALS 172,509 164,691 178,541 133,742 149,562 147,785 235,5741734 CITY ATTORNEYPersonnel Services 385,030 323,157 391,857 408,631 403,046 451,494 347,818Operating Expenses 122,566 140,812 153,021 202,135 171,442 149,342 158,885Capital Outlay 0 0 1,052 0 0 0 0TOTALS 507,596 463,969 545,930 610,766 574,488 600,836 506,703TOTAL GENERAL GOVERNMENTPersonnel Services 1,517,923 1,374,800 1,489,193 1,507,026 1,488,850 1,572,699 1,497,509Operating Expenses 517,371 519,395 500,493 588,063 585,598 503,684 612,809Capital Outlay 1,052 2,422 12,876 0 21,006 20,801 0TOTALEXPENDITURES2,036,347 1,896,617 2,002,562 2,095,089 2,095,454 2,097,183 2,110,31864
POSITION ANALYSIS<strong>2010</strong>/<strong>2011</strong> APPROVED BUDGET<strong>2010</strong> <strong>2010</strong> <strong>2011</strong>2007 2008 2009 Approved Adjusted <strong>2010</strong> ApprovedActual Actual Actual <strong>Budget</strong> <strong>Budget</strong> Projected <strong>Budget</strong>GENERAL GOVERNMENTOffice <strong>of</strong> <strong>City</strong> Council 9.00 9.00 9.00 9.00 9.00 9.00 9.00Office <strong>of</strong> the <strong>City</strong> Manager 2.00 2.00 2.90 2.90 2.90 2.90 2.90Cable TV 1.00 1.00 1.00 1.00 1.00 1.00 1.00Employee Services 4.40 4.40 2.95 2.95 2.95 2.95 3.95Office <strong>of</strong> the <strong>City</strong> Clerk 3.40 3.40 4.40 4.40 4.40 4.40 3.30Election 1.60 1.60 6.00 0.60 0.60 0.60 2.70Office <strong>of</strong> <strong>City</strong> Attorney 4.00 4.00 4.00 4.00 4.00 4.00 3.00TOTAL POSITIONS 25.40 25.40 30.25 24.85 24.85 24.85 25.85The <strong>2010</strong>/<strong>2011</strong> Approved <strong>Budget</strong>'s complement for General Government reflects a total increase <strong>of</strong> one position. During the <strong>2010</strong>budget process the Employee Services Office eliminated and council approved the elimination <strong>of</strong> the Labor Administrator. In place <strong>of</strong>this position, this <strong>of</strong>fice has utilized temporary employment services for additional clerical assistance. The <strong>2011</strong> Approved <strong>Budget</strong>relects the addition <strong>of</strong> the HR Support Staff position in the Employee Services Office. In addition, in the Election Division, anElection Assistant position will be reinstated. This is not a new position but is an authorized position that is utilized in multipleelection years. For fiscal year <strong>2011</strong>, the <strong>City</strong> will have at least two elections - August and November, with a possibility <strong>of</strong> anadditional election in May.To <strong>of</strong>fset the increase in complement structure and in accordance with the staffing and efficiency study, in the Office <strong>of</strong> the <strong>City</strong>Attorney, the Chief Assistant <strong>City</strong> Attorney position will be eliminated from the personnel complement. During fiscal year <strong>2010</strong>, the<strong>City</strong> under went a citywide staffing and efficiency study <strong>of</strong> all <strong>of</strong> its service delivery systems through Plante & Moran Consultants.This study recommended the elimination <strong>of</strong> the Chief Assistant <strong>City</strong> Attorney. The additional workload will be absorbed by theremaining staff.65
FUND: 101 – General FundDEPARTMENT: General GovernmentACTIVITY: 0101 – <strong>City</strong> CouncilSTRATEGIC NARRATIVEThe <strong>City</strong> Council is the legislative body <strong>of</strong> the <strong>City</strong>. The Council establishes policies, approvescontracts, enacts ordinances and approves rules and regulations, which supplement the ordinances. TheCouncil is comprised <strong>of</strong> nine members elected at large in non-partisan elections for four-yearoverlapping terms. The Mayor is selected from among the Council membership for a two-year term andserves as the presiding <strong>of</strong>ficer <strong>of</strong> the Council and as representative <strong>of</strong> the Council for ceremonialpurposes.The Council holds public hearings on various subjects, such as zoning changes, the city’s budget, andspecial assessment rolls; receives and acts upon petitions; and makes appointments to various boards andcommissions. Regular meetings are held twice a month on Monday evenings at 6:30 p.m. On occasion,Committee-<strong>of</strong>-the-Whole meetings are held on Mondays to discuss special subjects. All meetings areopen to the public, except as provided in the Open Meetings Act. A calendar <strong>of</strong> the regular Councilmeetings is adopted each year in December for the upcoming twelve months.FY <strong>2010</strong>/<strong>2011</strong> GOALS AND OBJECTIVES1. To adopt policies and programs that allows the <strong>City</strong> <strong>of</strong> <strong>Saginaw</strong> to realize the strategic vision thatwill improve the overall condition <strong>of</strong> the <strong>City</strong>.2. Move forward with the implementation <strong>of</strong> a five-year fiscal health plan.3. To aggressively lobby federal and state government legislative <strong>of</strong>ficials on issues that wouldimprove the overall urban conditions <strong>of</strong> the <strong>City</strong> <strong>of</strong> <strong>Saginaw</strong>.66
EXPENDITURE ANALYSIS DETAIL<strong>2010</strong>/<strong>2011</strong> APPROVED BUDGET101-0101 <strong>City</strong> CouncilAllocation PlanPosition Control<strong>2010</strong>/JOB <strong>2011</strong>PERSONNEL SERVICES CLASSIFICATION BUDGET ALLOCATIONSalaries 13,505 Council Members 9.00 13,505Overtime 0Fringe Benefits 5,947 Total Personnel 9.00 13,505TOTAL19,452Overtime 0OPERATING EXPENSESFICA 1,033Supplies 250 Healthcare Benefits - Active 4,914Internal Services 57 Healthcare Benefits - Retirees 0Other Services Pension 0Pr<strong>of</strong>essional Fees 1,500Maintenance Fees 1,950 Total Fringe Benefits 5,947Other Contracted Fees 34,500TOTAL38,257 TOTAL 9.00 19,452CAPITAL OUTLAY 0TOTAL0TOTAL APPROPRIATION 57,70967
FUND: 101 – General FundDEPARMENT: General GovernmentACTIVITY: 1710 – <strong>City</strong> ManagerSTRATEGIC NARRATIVEThe <strong>City</strong> Manager is responsible for the supervision and coordination <strong>of</strong> the <strong>City</strong> administration inimplementing policies formulated by the <strong>City</strong> Council; preserving the health, safety and general welfare<strong>of</strong> persons and property within the <strong>City</strong> <strong>of</strong> <strong>Saginaw</strong>; and enforcing the <strong>City</strong> Charter, <strong>City</strong> ordinances, andapplicable State and Federal laws.FY <strong>2010</strong>/<strong>2011</strong> GOALS AND OBJECTIVES1. More fully utilize information systems in the daily operations <strong>of</strong> communication andmanagement practices <strong>of</strong> all departments.2. Create a set <strong>of</strong> performance measurements through the Citi Stat performance measurementsystem for all service delivery areas in order to improve the efficiency and effectiveness <strong>of</strong>city operations.% Citi StatImplemented2009Actual10%Completed<strong>2010</strong>Projected40%Completed<strong>2011</strong>Target80%Completed68
EXPENDITURE ANALYSIS DETAIL<strong>2010</strong>/<strong>2011</strong> APPROVED BUDGET101-1710 <strong>City</strong> ManagerAllocation PlanPosition Control<strong>2010</strong>/JOB <strong>2011</strong>PERSONNEL SERVICES CLASSIFICATION BUDGET ALLOCATIONSalaries 204,720 <strong>City</strong> Manager 1.00 110,000Overtime 0 Assistant to <strong>City</strong> Manager/Fringe Benefits 137,564 <strong>Budget</strong> Administrator 0.40 28,061Executive Assistant 1.00 55,427TOTAL342,284 Admin Support Clerk (PT) 0.50 11,232OPERATING EXPENSESTotal Personnel 2.90 204,720Supplies 6,182 Overtime 0Internal Services 18,051Other ServicesPr<strong>of</strong>essional Fees 11,784 FICA 13,053Maintenance Fees 6,737 Healthcare Benefits - Active 37,841Other Contracted Fees 16,237 Healthcare Benefits - Retirees 0Pension 86,670TOTAL58,991Total Fringe Benefits 137,564CAPITAL OUTLAY 0TOTAL0TOTAL 2.90 342,284TOTAL APPROPRIATION 401,27569
FUND: 101 – General FundDEPARTMENT: General GovernmentACTIVITY: 1711 – Cable TVSTRATEGIC NARRATIVE<strong>Saginaw</strong> Government Television (SGTV) has been on the air since January 1988. The cable access stationairs public service programs, a 24-hour message board that features city programs and activities,Committee—<strong>of</strong>-the-Whole meetings, twice a month <strong>City</strong> Council meetings and other programming. SGTVis one <strong>of</strong> three PEG (Public, Educational and Government access) channels provided under the franchiseagreement between the <strong>City</strong> <strong>of</strong> <strong>Saginaw</strong> and Charter Communications, Inc.A part-time pr<strong>of</strong>essional TV coordinator staffs the station. The primary communication medium is aPowerPoint based message board. The station also airs live <strong>City</strong> Council meetings, news conferences, publicservice announcements and original programming. Staff also assists with audio/visual consulting;maintenance <strong>of</strong> audio/visual/TV equipment; meeting set-ups <strong>of</strong> audio/visual equipment as well asPowerPoint presentations; recording <strong>of</strong> audio for various meetings; and other general duties as needed.SGTV also airs live results <strong>of</strong> <strong>City</strong> <strong>of</strong> <strong>Saginaw</strong> ballot issues. In addition, staff is also responsible for theediting <strong>of</strong> the employee newsletter “The <strong>Saginaw</strong> Mark”.FY <strong>2010</strong>/<strong>2011</strong> GOALS AND OBJECTIVES1. Provide citizens with convenient and up-to-date information regarding <strong>City</strong> services, programs andevents.a. Expand the variety and hours <strong>of</strong> programming aired on SGTV.2009Actual<strong>2010</strong>Projected<strong>2011</strong>TargetHours <strong>of</strong> programming aired – 6 hours/week 7 hours/week 8 hours/weekper week averageNumber <strong>of</strong> monthly programsavailable for airing 9 10 122. Provide <strong>City</strong> Departments with technical support and audio/visual equipment.a. Increase the number <strong>of</strong> <strong>City</strong> Departments/Divisions utilizing SGTV services.2009Actual<strong>2010</strong>Projected<strong>2011</strong>TargetDepartments/Divisionsutilizing SGTV services 12 13 14b. Maintain or increase the number <strong>of</strong> events for which staff provides technical support and/oraudiovisual equipment/recording.2009Actual<strong>2010</strong>Projected<strong>2011</strong>TargetAnnual number<strong>of</strong> events supported 83 80 8570
EXPENDITURE ANALYSIS DETAIL<strong>2010</strong>/<strong>2011</strong> APPROVED BUDGET101-1711 SGTVAllocation PlanPosition Control<strong>2010</strong>/JOB <strong>2011</strong>PERSONNEL SERVICES CLASSIFICATION BUDGET ALLOCATIONSalaries 29,120 SGTV Program Coordinator 1.00 29,120Overtime 0Fringe Benefits 14,040 Total Personnel 1.00 29,120TOTAL43,160Overtime 0OPERATING EXPENSESFICA 841Supplies 2,000 Healthcare Benefits - Active 12,526Internal Services 3,302 Healthcare Benefits - Retirees 0Other Services Pension 673Pr<strong>of</strong>essional Fees 638Maintenance Fees 800 Total Fringe Benefits 14,040Other Contracted Fees 100TOTAL6,840 TOTAL 1.00 43,160CAPITAL OUTLAY 0TOTAL0TOTAL APPROPRIATION 50,00071
FUND: 101 – General FundDEPARTMENT: General GovernmentACTIVITY: 1725 – Employee ServicesSTRATEGIC NARRATIVESThe Office <strong>of</strong> Employee Services reports directly to the <strong>City</strong> Manager and is responsible for providingcentralized Human Resource services to all departments and divisions for the <strong>City</strong> <strong>of</strong> <strong>Saginaw</strong>. Majorfunctions include but are not limited to employee wages and benefits; employee relations and laborrelations; recruitment; training and development; employee health and safety. The Office <strong>of</strong> EmployeeServices operates within the confines <strong>of</strong> all <strong>City</strong> ordinance and administrative policies as well as Stateand Federal regulatory requirements.1. Improve Labor RelationsFY <strong>2010</strong>/<strong>2011</strong> GOALS AND OBJECTIVESa. To reduce the number <strong>of</strong> grievances filed from prior year.2009Actual<strong>2010</strong>Projected<strong>2011</strong>TargetTotal number <strong>of</strong>Grievances filed 68 75 702. Maintain Cost Containment with Employee Benefit Plansa. To reduce employee benefit cost through contract negotiations or funding mechanisms.Total benefit costsas a percentage <strong>of</strong>payroll2009Actual<strong>2010</strong>Projected<strong>2011</strong>Target66.38% 72.96% 77.81%Total benefit costsas a percentage <strong>of</strong>payroll lesspension2009Actual<strong>2010</strong>Projected<strong>2011</strong>Target18.40% 20.10% 22.37%72
EXPENDITURE ANALYSIS DETAIL<strong>2010</strong>/<strong>2011</strong> APPROVED BUDGET101-1725 Employee ServicesAllocation PlanPosition Control<strong>2010</strong>/JOB <strong>2011</strong>PERSONNEL SERVICES CLASSIFICATION BUDGET ALLOCATIONSalaries 215,224 Director <strong>of</strong> Employee Services 1.00 84,181Overtime 0 Asst. Dir. <strong>of</strong> Employee Services 0.55 33,850Fringe Benefits 135,928 Benefits Coordinator 1.00 53,560Administrative Assistant I 0.40 18,673TOTAL351,152 HR Support Staff (PT) 1.00 24,960OPERATING EXPENSESTotal Personnel 3.95 215,224Supplies 3,500 Overtime 0Internal Services 22,096Other ServicesPr<strong>of</strong>essional Fees 125,194 FICA 14,496Maintenance Fees 5,500 Healthcare Benefits - Active 33,845Other Contracted Fees 9,450 Healthcare Benefits - Retirees 0Pension 87,587TOTAL165,740Total Fringe Benefits 135,928CAPITAL OUTLAY 0TOTAL0TOTAL 3.95 351,152TOTAL APPROPRIATION 516,89273
FUND: 101 – General FundDEPARTMENT: General GovernmentACTIVITY: 1730 – <strong>City</strong> ClerkSTRATEGIC NARRATIVEThe Office <strong>of</strong> the <strong>City</strong> Clerk serves as the <strong>City</strong>’s Bureau <strong>of</strong> Information and Complaint. It documents andassigns all citizen complaints, and maintains contracts/agreements, reports, petitions and informationaldocumentation related to the <strong>City</strong>. The <strong>City</strong> Clerk/Deputy Clerk attends all meetings <strong>of</strong> Council and theCivil Service Commission and preserves all minutes and records <strong>of</strong> their proceedings; the Clerk preservescodes/ordinances; manages the <strong>City</strong>’s license requirements; coordinates the annual special single lotassessments and provides an internal centralized risk management service through coordination <strong>of</strong> insurancecoverage and handling <strong>of</strong> claims both on behalf <strong>of</strong> or against the <strong>City</strong>.FY <strong>2010</strong>/<strong>2011</strong> GOALS AND OBJECTIVES1. Improve the process <strong>of</strong> taking complaints/requests from citizens and distribution to the properdivision/individual, resulting in improved relations with citizens as well as faster resolution <strong>of</strong>complaints/requests.a. Keep staff up-to-date on the capabilities <strong>of</strong> the existing computer system(s) available for therecording and processing <strong>of</strong> complaints/requests, and trained in the use there<strong>of</strong>.b. Continually strive to make the complaint and request process as easy and user-friendly aspossible for the citizens <strong>of</strong> the <strong>City</strong>.2009Actual<strong>2010</strong>Projected<strong>2011</strong>TargetComplaints/Requests4,579 4,250 *4,100Received*Implementation <strong>of</strong> the Call Center should reduce the <strong>2011</strong> Target listed above.2. Improve the collection <strong>of</strong> fees owed in relation to all business licenses (both business and housingregistration licenses).a. To identify unlicensed and those licensed businesses which had changes in ownership..2009Actual<strong>2010</strong>Projected<strong>2011</strong>TargetNon-Owner Occupied 4,590 5,000 5,400General Business 904 1,050 1,100Occupational 477 500 525Encroachments 77 80 85b. To increase collection <strong>of</strong> unlicensed/past due businesses through ordinance changes andawareness campaigns.2009ActualNon-Owner Occupied 1%General Business 12%Occupational 7%Encroachments 11%74<strong>2010</strong>Projected<strong>2011</strong>Target
EXPENDITURE ANALYSIS DETAIL<strong>2010</strong>/<strong>2011</strong> APPROVED BUDGET101-1730 <strong>City</strong> ClerkAllocation PlanPosition Control<strong>2010</strong>/JOB <strong>2011</strong>PERSONNEL SERVICES CLASSIFICATION BUDGET ALLOCATIONSalaries 150,919 <strong>City</strong> Clerk 0.70 58,494Overtime 0 Deputy <strong>City</strong> Clerk 0.70 40,696Fringe Benefits 111,711 Office Assistant III 0.85 30,387Office Assistant II 0.30 10,110TOTAL262,630 Secretary (PT) 0.75 11,232OPERATING EXPENSESTotal Personnel 3.30 150,919Supplies 2,500 Overtime 0Internal Services 23,579Other ServicesPr<strong>of</strong>essional Fees 25,500 FICA 11,360Maintenance Fees 10,400 Healthcare Benefits - Active 29,841Other Contracted Fees 2,556 Healthcare Benefits - Retirees 0Pension 70,510TOTAL64,535Total Fringe Benefits 111,711CAPITAL OUTLAY 0TOTAL0TOTAL 3.30 262,630TOTAL APPROPRIATION 327,16575
FUND: 101 – General FundDEPARTMENT: General GovernmentACTIVITY: 1731 - ElectionsSTRATEGIC NARRATIVESAdministration <strong>of</strong> local, county, state, and federal elections requires assurance that there is compliancewith the applicable laws, rules, and regulations. Executing elections involves maintenance <strong>of</strong> voterregistration files, election statistics, ballot preparation, issuance <strong>of</strong> absent voter ballots, delivery/set-up<strong>of</strong> voting equipment and supplies, election board appointments and their proper training.FY <strong>2010</strong>/<strong>2011</strong> GOALS AND OBJECTIVES1. To provide the voters with a smooth and expedient process both through absentee voting and atthe polls.a. Stay up-to-date on election rules and regulations by attending annual seminars andconferences, as well as regular training sessions <strong>of</strong>fered by the State <strong>of</strong> Michigan to keepup-to-date with the changes in election law, voter registration and the voting process.b. Train poll workers to keep precise and accurate Election Day records.c. Keep voters informed and educated, both on polling location changes and the votingprocess.2. To maintain accurate voter files through improvements to the State <strong>of</strong> Michigan QVF (QualifiedVoter File) and the <strong>City</strong>’s Master Card Voter File.a. Perform regular updates to add, change and remove voters from both the State and <strong>City</strong>files.b. Actively pursue tools to allow identification <strong>of</strong> voters requiring changes to the voter filesdue to death, address changes due to moves within and out <strong>of</strong> the state, and inaccuratedata in current files.76
EXPENDITURE ANALYSIS DETAIL<strong>2010</strong>/<strong>2011</strong> APPROVED BUDGET101-1731 ElectionsAllocation PlanPosition Control<strong>2010</strong>/JOB <strong>2011</strong>PERSONNEL SERVICES CLASSIFICATION BUDGET ALLOCATIONSalaries 77,959 <strong>City</strong> Clerk 0.30 25,069Overtime 7,500 Deputy <strong>City</strong> Clerk 0.30 17,441Fringe Benefits 45,554 Office Assistant III 0.15 5,362Office Assistant II 0.70 23,591TOTAL131,013 Secretary (PT) 0.25 3,744Election Asst (Temp) 1.00 2,752OPERATING EXPENSES Total Personnel 2.70 77,959Supplies 10,200Internal Services 15,795 Overtime 7,500Other ServicesPr<strong>of</strong>essional Fees 66,582Maintenance Fees 10,320 FICA 5,817Other Contracted Fees 1,664 Healthcare Benefits - Active 17,982Healthcare Benefits - Retirees 0TOTAL104,561 Pension 21,755CAPITAL OUTLAY 0Total Fringe Benefits 45,554TOTAL0 TOTAL 2.70 131,013TOTAL APPROPRIATION 235,57477
FUND: 101 – General FundDEPARTMENT: General GovernmentACTIVITY: 1734 – <strong>City</strong> AttorneySTRATEGIC NARRATIVEThe <strong>City</strong> Attorney’s Office is responsible for handling all legal matters affecting the <strong>City</strong>. This entailsproviding legal counsel to the <strong>City</strong> Council and various <strong>City</strong> departments. The Attorney’s Office alsohandles all legal action taken by the <strong>City</strong> and defends actions filed by and against the <strong>City</strong>, includingprosecuting code violations and criminal misdemeanors. In addition, it plays a significant role indeveloping special projects undertaken by the <strong>City</strong>. Duties <strong>of</strong> the <strong>City</strong> Attorney’s Office include:drafting and/or reviewing contracts, ordinances, council communications, Freedom <strong>of</strong> Information Actresponses, employee disciplines, legal opinions, pleadings, risk management issues, Police and FirePension Board issues, Purchasing matters and special events applications. It also performs demolition <strong>of</strong>buildings (DBO) reviews.FY <strong>2010</strong>/<strong>2011</strong> GOALS AND OBJECTIVES1. To maximize revenue enhancement efforts related to income taxes, business licenses, rentalregistration, housing inspections, environmental and demolitions.2. To prepare and issue misdemeanor warrants based upon information provided by the Department<strong>of</strong> Fiscal Services in order to pursue prosecutions against individuals that have outstandingincome taxes.a. Prepare files/warrants for prosecution <strong>of</strong> income taxes.Files prepared forprosecution <strong>of</strong>income taxesWarrants preparedfor prosecution <strong>of</strong>income taxes2009Actual<strong>2010</strong>Projected<strong>2011</strong>Target969 760 7604,054 2,500 2,5003. To prepare legal documents for municipal civil infractions based upon information provided byInspections (Repair, Rental Registrations, etc.), Zoning, and Environmental ImprovementDivisions.a. Prepared notices, motions and orders for municipal civil infractions, which will assist inalleviating blight in the <strong>City</strong>. (Based upon a calendar year.)2009Actual<strong>2010</strong>Projected<strong>2011</strong>TargetHousing 24 24 25Business Licenses 692 500 500Zoning 0 5 5Environmental 2 10 1078
4. To provide legal services for the prosecution <strong>of</strong> misdemeanors based upon information providedby the Police Department.5. To prepare and issue misdemeanor warrants for the prosecution <strong>of</strong> misdemeanors <strong>of</strong> local <strong>City</strong>ordinances. (Based upon a calendar year.)a. Prepared warrants for prosecution to assist Public Safety in alleviating criminal activity inthe <strong>City</strong>. (Based upon a calendar year.)Warrants prepared toassist Public Safety inalleviating criminalactivity in the <strong>City</strong>2009Actual<strong>2010</strong>Projected<strong>2011</strong>Target251 260 2606. To provide legal services for demolition <strong>of</strong> buildings (DBO) in the <strong>City</strong>.7. To review all DBO records to ensure compliance with the law.a. Conducted initial/final reviews <strong>of</strong> DBO files to assist the Department <strong>of</strong> Development inalleviating blight in the <strong>City</strong>.DBO’s conducted toassist the Department <strong>of</strong>Development inalleviating blight in the<strong>City</strong>2009Actual<strong>2010</strong>Projected<strong>2011</strong>Target393 400 40079
EXPENDITURE ANALYSIS DETAIL<strong>2010</strong>/<strong>2011</strong> APPROVED BUDGET101-1734 <strong>City</strong> AttorneyAllocation PlanPosition Control<strong>2010</strong>/JOB <strong>2011</strong>PERSONNEL SERVICES CLASSIFICATION BUDGET ALLOCATIONSalaries 183,971 <strong>City</strong> Attorney 1.00 91,320Overtime 0 Legal Assistant II 1.00 47,583Fringe Benefits 163,847 Legal Assistant I 1.00 45,068TOTAL347,818 Total Personnel 3.00 183,971OPERATING EXPENSES Overtime 0Supplies 4,300Internal Services 22,140 FICA 13,136Other Services Healthcare Benefits - Active 42,710Pr<strong>of</strong>essional Fees 111,645 Healthcare Benefits - Retirees 0Maintenance Fees 3,100 Pension 108,001Other Contracted Fees 17,700Total Fringe Benefits 163,847TOTAL158,885CAPITAL OUTLAY 0TOTAL 3.00 347,818TOTAL0TOTAL APPROPRIATION 506,70380
DEPARTMENT OF FISCAL SERVICES
CITY OF SAGINAWDEPARTMENT OF FISCAL SERVICESTimothy MoralesAssistant<strong>City</strong> ManagerAdministrative Svc.Fiscal ServicesAdministrationPurchasingAssessingCustomerAccounting(Sewer/Water)<strong>City</strong>Controller'sOffice<strong>City</strong>TreasuryIncomeTaxNote:The Water Operation and Maintenance fund recognizes their ongoing large capital projects through the Water Surplus and Water Bond Contruction Divisions. The Debt Service Divisionis where all debt service is paid.
EXPENDITURE ANALYSIS SUMMARY<strong>2010</strong>/<strong>2011</strong> APPROVED BUDGET<strong>2010</strong> <strong>2010</strong> <strong>2011</strong>2007 2008 2009 Approved Adjusted <strong>2010</strong> ApprovedActual Actual Actual <strong>Budget</strong> <strong>Budget</strong> Projected <strong>Budget</strong>1740 AD<strong>MI</strong>NISTRATIONPersonnel Services 185,157 170,333 192,143 300,845 297,540 300,952 399,383Operating Expenses 82,662 130,657 72,123 83,912 72,742 62,659 119,087Capital Outlay 372 859 6,301 0 2,260 2,260 0TOTALS 268,191 301,849 270,567 384,757 372,542 365,871 518,4701741 CITY CONTROLLERPersonnel Services 362,770 457,956 157,116 0 0 625 0Operating Expenses 160,200 145,341 362,909 340,928 339,542 337,625 341,339Capital Outlay 188 0 511 0 0 0 01742 PURCHASINGTOTALS 523,157 603,297 520,536 340,928 339,542 338,250 341,339Personnel Services 124,179 167,180 157,599 169,834 168,017 156,480 160,457Operating Expenses 19,090 13,425 17,684 21,534 21,235 17,463 14,150Capital Outlay 370 585 0 0 0 0 01743 TREASURERTOTALS 143,639 181,190 175,283 191,368 189,252 173,942 174,607Personnel Services 298,230 303,513 301,741 286,766 282,436 298,231 303,506Operating Expenses 124,716 118,200 116,539 131,678 126,249 105,619 118,782Capital Outlay 188 33 1,490 0 3,669 3,519 01744 ASSESSORSTOTALS 423,134 421,746 419,770 418,444 412,354 407,370 422,288Personnel Services 295,684 406,414 462,288 465,786 461,243 459,672 481,514Operating Expenses 102,325 105,424 104,760 117,666 125,418 96,941 98,270Capital Outlay 820 0 0 0 705 605 01745 INCOME TAXTOTALS 398,830 511,838 567,048 583,452 587,366 557,219 579,784Personnel Services 237,582 358,884 440,741 459,497 448,584 440,433 465,753Operating Expenses 159,443 91,736 48,655 108,564 111,185 88,268 98,388Capital Outlay 188 1,460 415 0 0 0 0TOTALS 397,212 452,080 489,811 568,061 559,769 528,701 564,141TOTAL FISCAL SERVICESPersonnel Services 1,503,601 1,864,280 1,711,628 1,682,728 1,657,820 1,656,393 1,810,613Operating Expenses 648,436 604,783 722,670 804,282 796,371 708,575 790,016Capital Outlay 2,125 2,937 8,717 0 6,634 6,384 0TOTAL EXPENDITURES 2,154,162 2,472,000 2,443,015 2,487,010 2,460,825 2,371,353 2,600,62982
POSITION ANALYSIS<strong>2010</strong>/<strong>2011</strong> APPROVED BUDGET<strong>2010</strong> <strong>2010</strong> <strong>2011</strong>2007 2008 2009 Approved Adjusted <strong>2010</strong> ApprovedActual Actual Actual <strong>Budget</strong> <strong>Budget</strong> Projected <strong>Budget</strong>FISCAL SERVICESAdministration 2.00 2.00 3.60 3.60 3.60 3.60 4.60Office <strong>of</strong> the Controller 6.00 6.00 0.00 0.00 0.00 0.00 0.00Purchasing Office 2.00 2.00 2.00 2.00 2.00 2.00 2.00Treasury Office 5.50 5.50 3.25 3.25 3.25 3.25 3.25Office <strong>of</strong> the Assessor 6.00 6.00 6.00 6.00 6.00 6.00 6.00Income Tax Office 4.00 4.00 6.00 6.00 6.00 6.00 6.00Customer Accounting 5.00 5.00 5.45 5.45 5.45 5.45 5.45TOTAL POSITIONS 30.50 30.50 26.30 26.30 26.30 26.30 27.30In the <strong>2010</strong>/<strong>2011</strong> Approved <strong>Budget</strong>, the Department <strong>of</strong> Fiscal Services will increase by one position. In the Administration Division,an Administrative Analyst will be added to the complement. In addition, the Assistant <strong>City</strong> Manager for Fiscal Services will be retitledto the Assistant <strong>City</strong> Manager for Administrative Services. Likewise, in the the Income Tax Division the Office Assistant II positionwill be reclassified to Office Assistant III. Also, the Income Tax Manager will be retitled to Income Tax Administrator.83
FUND: 101 – General FundDEPARTMENT: Fiscal ServicesACTIVITY: 1740 – Fiscal Services AdministrationSTRATEGIC NARRATIVEFiscal Services Administration is responsible for financial planning, control, and reporting for the <strong>City</strong><strong>of</strong> <strong>Saginaw</strong>. The Department's role is to provide sound fiscal practices in budgeting and accounting forall <strong>City</strong> funds. Administration works toward establishing a financially strong fiscal policy that allowsreserves for future economic emergencies and provides solutions for unfunded liabilities.Coordinating the responsibilities <strong>of</strong> the following divisions is a primary function <strong>of</strong> Administration:Treasury, Income Tax, Customer Accounting (Water/Sewer Billing), Purchasing, Assessing, andController.Another component <strong>of</strong> Fiscal Services Administration is the <strong>Budget</strong> Office, which is responsible for thedevelopment, preparation, and distribution <strong>of</strong> the annual <strong>City</strong> Manager’s Approved <strong>Budget</strong> document inaccordance with the <strong>City</strong>’s Charter and the State <strong>of</strong> Michigan’s Uniformed <strong>Budget</strong>ing and AccountingAct. This <strong>of</strong>fice also monitors all budgeted appropriations and resources throughout the year to assurecompliance with the annual budget. In addition, this <strong>of</strong>fice is also responsible for performancemeasurement citywide through the use <strong>of</strong> Citi Stat.FY <strong>2010</strong>/<strong>2011</strong> OBJECTIVES1. Provide timely, accurate and complete financial data to the <strong>City</strong> Manager, <strong>City</strong> Council, and theCitizens <strong>of</strong> <strong>Saginaw</strong>.a. File Annual Audit Report and Single Audit Report for each Fiscal Year prior to CalendarYear End.Audit filed byCY end2009ActualCompletedprior to 12/31<strong>2010</strong>ProjectedComplete priorto 12/31<strong>2011</strong>TargetComplete priorto 12/31b. Earn the Government Finance Officers Association (GFOA) Distinguished <strong>Budget</strong>Presentation AwardEarn GFOAAward2009ActualEarned awardfor 2009-10<strong>Budget</strong>Document<strong>2010</strong>ProjectedEarn Award for<strong>2010</strong>-11 <strong>Budget</strong>Document<strong>2011</strong>TargetEarn Award for<strong>2011</strong>-12 <strong>Budget</strong>Documentc. Work to create opportunities to present the <strong>City</strong>’s financial position to residents <strong>of</strong> the<strong>City</strong> <strong>of</strong> <strong>Saginaw</strong>, agencies, and other stakeholders. The intent is to assist in building amore informed support <strong>of</strong> city initiatives.84
d. Address key issues related to the processing <strong>of</strong> data through the use <strong>of</strong> Citi Stat.% Citi StatImplemented2009Actual10%Completed<strong>2010</strong>Projected40%Completed<strong>2011</strong>Target80%Completed2. Continue ongoing analysis <strong>of</strong> the <strong>City</strong>’s fiscal health and develop a plan to meet costs, givenrevenue constraints.a. Further restructure the <strong>City</strong>’s grant management process to ensure that the potential toreceive grant funds is maximized.b. Analyze <strong>City</strong> tax and fee structure. .Review <strong>City</strong>Departmentfees2009ActualReviewed 10%<strong>of</strong> <strong>City</strong>Departments<strong>2010</strong>ProjectedReview 15% <strong>of</strong><strong>City</strong>Departments<strong>2011</strong>TargetReview 50% <strong>of</strong><strong>City</strong>Departmentsc. Provide for proactive generation <strong>of</strong> revenue and expenditure adjustments.Accuracy Rate<strong>of</strong> <strong>City</strong> RevenueEstimates(<strong>Budget</strong> toActual%)2009<strong>2010</strong><strong>2011</strong>Actual Projected Target60% 75% 80%Accuracy Rate<strong>of</strong> <strong>City</strong>ExpenditureEstimates(<strong>Budget</strong> toActual%)2009<strong>2010</strong><strong>2011</strong>Actual Projected Target67% 75% 80%85
EXPENDITURE ANALYSIS DETAIL<strong>2010</strong>/<strong>2011</strong> APPROVED BUDGET101-1740 Fiscal Services AdministrationAllocation PlanPostion Control<strong>2010</strong>/JOB <strong>2011</strong>PERSONNEL SERVICES CLASSIFICATION BUDGET ALLOCATIONSalaries 232,312 Assistant <strong>City</strong> ManagerOvertime 1,500 for Admin. Services 0.50 49,339Fringe Benefits 165,571 Assistant to <strong>City</strong> Manager/<strong>Budget</strong> Administrator 0.60 42,092TOTAL399,383 Administrative Analyst 1.00 45,138Payroll Specialist 1.00 45,068Acct Payable Coordinator 1.00 39,443OPERATING EXPENSES Admin. Sup. Clerk (PT) 0.50 11,232Supplies 3,650 Total Personnel 4.60 232,312Internal Services 22,130Other ServicesPr<strong>of</strong>essional Fees 81,758 Overtime 1,500Maintenance Fees 7,558Other Contracted Fees 3,991FICA 16,371TOTAL119,087 Healthcare Benefits - Active 65,900Healthcare Benefits - Retirees 0Pension 83,300CAPITAL OUTLAY 0Total Fringe Benefits 165,571TOTAL0TOTAL APPROPRIATION 518,470TOTAL 4.60 399,38386
FUND: 101 – General FundDEPARTMENT: Fiscal ServicesACTIVITY: 1741 – ControllerSTRATEGIC NARRATIVEThe Controller maintains the <strong>City</strong>’s accounting system in accordance with generally acceptedaccounting principals for local units <strong>of</strong> government and continually monitors and reviews all aspects <strong>of</strong>the <strong>City</strong>’s financial s<strong>of</strong>tware by training <strong>City</strong> employees to enter, compile and analyze financialinformation. The division is also responsible for auditing, reconciling cash receipts, and approving allclaims for payment. The Controller assists in the preparation <strong>of</strong> the Comprehensive Annual FinancialReport (CAFR) and provides financial history to assist outside divisions. The Controller also assists inthe physical inventory <strong>of</strong> fixed assets and updates the records in the financial operating system.FY <strong>2010</strong>/<strong>2011</strong> GOALS AND OBJECTIVES1. Provide complete and timely financial information to the <strong>City</strong>.a. Continue to become more efficient in completing the Comprehensive Annual FinancialReport. The report is expected to be <strong>of</strong> a standard worthy <strong>of</strong> receiving the certificate <strong>of</strong>excellence from the Government Finance Officers Association (GFOA). FY 2009 wasthe first time in several years that the <strong>City</strong> completed a (CAFR), and the <strong>City</strong> lastreceived the GFOA award in 2003.b. Perform monthly period closings by the 20 th <strong>of</strong> the following month and complete annualaudit preparation within three months <strong>of</strong> fiscal year end. This will provide for the timelyaccumulation <strong>of</strong> data to support planning and decision-making.c. Reconcile all bank accounts to the general ledger no later than the end <strong>of</strong> the followingmonth. This will ensure that all cash transactions are recorded to properly reflect the<strong>City</strong>’s cash position and ensure that funds are not misappropriated.2. Provide accounting, review, and management <strong>of</strong> all <strong>City</strong> receivables.a. Continue, and modify as necessary, the plan to review and clean up all account receivablebalances in all funds <strong>of</strong> the <strong>City</strong>.b. Develop a plan to ensure all customers are systematically sent statements on a monthlybasis. Additionally, the division will work with the <strong>City</strong> Attorney and other departmentsto develop procedures for ensuring timely collection <strong>of</strong> all balances.c. Continue staff training on accounts receivable and general ledger modules.d. Continue to work with the <strong>City</strong>’s Technical Services Department in developing a plan toperform accounts receivable data cleanup, collections, and write <strong>of</strong>fs within the financialsystem. Continued attention to address the accounts receivable system will result inadditional cash flow and revenue recognition.87
EXPENDITURE ANALYSIS DETAIL<strong>2010</strong>/<strong>2011</strong> APPROVED BUDGET101-1741 ControllerAllocation PlanPostion Control<strong>2010</strong>/JOB <strong>2011</strong>PERSONNEL SERVICES CLASSIFICATION BUDGET ALLOCATIONSalaries 0Overtime 0 Total Personnel 0.00 0Fringe Benefits 0TOTAL0 Overtime 0OPERATING EXPENSES FICA 0Healthcare Benefits - Active 0Supplies 1,000 Healthcare Benefits - Retirees 0Internal Services 43,889 Pension 0Other ServicesPr<strong>of</strong>essional Fees 295,200 Total Fringe Benefits 0Maintenance Fees 1,250Other Contracted Fees 0TOTAL 0.00 0TOTAL341,339CAPITAL OUTLAY 0TOTAL0TOTAL APPROPRIATION 341,33988
FUND: 101 – General FundDEPARTMENT: Fiscal ServicesACTIVITY: 1742 - PurchasingSTRATEGIC NARRATIVEThe Purchasing Division provides centralized purchasing <strong>of</strong> equipment, supplies, materials and servicesfor all <strong>City</strong> operations and the Community Development Block Grant programs. Purchasing solicits allsealed bids, quotes and proposals for <strong>City</strong> Departments and Divisions. The division also monitors andmaintains all vendors, contract compliance information, as well as contractor licenses and insurancerecords.FY <strong>2010</strong>/<strong>2011</strong> GOALS AND OBJECTIVES1. To modify and update the purchasing procedures to incorporate the changes incurred by the HTEs<strong>of</strong>tware, technology, and ordinance changes.a. Due to frequent upgrades to H.T.E. this is an on-going process.2. To update contract compliance records and vendor files.a. Starting in <strong>2010</strong>, notify all vendors requesting they update their information for the <strong>City</strong>’svendor database.2009Actual<strong>2010</strong>Projected<strong>2011</strong>TargetNumber <strong>of</strong>Vendor FilesUpdated3% 15% 30%3. To initiate a procurement card system that will adhere to all <strong>City</strong> purchasing policies andprocedures, thus facilitating the purchase <strong>of</strong> goods and services for all city departments andreducing the number <strong>of</strong> purchase order (P.O.) numbers issued.a. Use Blanket and Annual P.O.’s more extensively.2009<strong>2010</strong>Actual Projected<strong>2011</strong>TargetNumber <strong>of</strong>P.O.’s Issued 2,085* 1,900 1,800* Decrease <strong>of</strong> 12% from 20084. To develop policies and procedures that will maximize the efficiency <strong>of</strong> the purchasing process.89
a. Make better use <strong>of</strong> “Just in Time” delivery systems, utilization <strong>of</strong> the State <strong>of</strong> Michiganprocurement program, and on-line systems such as the Michigan IntergovernmentalTrade Network (<strong>MI</strong>TN) for issuing sealed bids.Number <strong>of</strong>State <strong>of</strong>MichiganContracts UsedNumber <strong>of</strong> bidslisted on <strong>MI</strong>TN(or similarsites)2009Actual<strong>2010</strong>Projected<strong>2011</strong>Target13 20 302009Actual<strong>2010</strong>Projected<strong>2011</strong>Target0* 30 40* NOTE: Council has now approved The <strong>MI</strong>TN Agreement and the Purchasing Office willbegin to use that system before the end <strong>of</strong> this fiscal year June <strong>2010</strong>. Currently, this <strong>of</strong>fice iswaiting for BidNet to review the <strong>City</strong>’s vendor database before a mass mailing is sent toadvise companies <strong>of</strong> this change.90
EXPENDITURE ANALYSIS DETAIL<strong>2010</strong>/<strong>2011</strong> APPROVED BUDGET101-1742 PurchasingAllocation PlanPostion Control<strong>2010</strong>/JOB <strong>2011</strong>PERSONNEL SERVICES CLASSIFICATION BUDGET ALLOCATIONSalaries 92,829 Purchasing Officer 1.00 54,304Overtime 0 Purchasing Assistant 1.00 38,525Fringe Benefits 67,628Total Personnel 2.00 92,829TOTAL160,457OPERATING EXPENSESOvertime 0Supplies 800 FICA 7,293Internal Services 9,446 Healthcare Benefits - Active 20,650Other Services Healthcare Benefits - Retirees 0Pr<strong>of</strong>essional Fees 1,604 Pension 39,685Maintenance Fees 1,500Other Contracted Fees 800 Total Fringe Benefits 67,628TOTAL14,150TOTAL 2.00 160,457CAPITAL OUTLAY 0TOTAL0TOTAL APPROPRIATION 174,60791
FUND: 101 –General FundDEPARTMENT: Fiscal ServicesActivity 1743 - TreasurySTRATEGIC NARRATIVEThe Treasurer’s Division administers the collection <strong>of</strong> funds for the <strong>City</strong> <strong>of</strong> <strong>Saginaw</strong>, including thefollowing: property tax (real and personal) billing and collection for 26,000 customers semi-annually;water invoice collection for 20,090 customers monthly; collection <strong>of</strong> fees for 4,500 business licenses,rental registrations, occupational licenses, and boiler operator licenses annually; and collection <strong>of</strong> feesfor electrical, plumbing, and building permits. Additionally, Treasury is responsible for the processing<strong>of</strong> income tax payments and the collection <strong>of</strong> non-sufficient fund checks.1. Improve the efficiency <strong>of</strong> Treasury staff.FY <strong>2010</strong>/<strong>2011</strong> GOALS AND OBJECTIVESa. Increase the accuracy <strong>of</strong> data enteredDecrease thenumber <strong>of</strong>requiredcorrections2009Actual<strong>2010</strong>Projected<strong>2011</strong>Target80% 85% 90%2. Improve set up time required for July and December tax bills and automate data transfer.a. Fully implement BS&A tax s<strong>of</strong>tware in the Treasurer’s DivisionImplementationand use <strong>of</strong>BS&AS<strong>of</strong>tware2009Actual<strong>2010</strong>Projected<strong>2011</strong>Target1 month 3 weeks 2 weeksb. Improve the accuracy <strong>of</strong> information transferred from the Assessor to Treasury; theimplementation <strong>of</strong> BS&A will allow for 100% <strong>of</strong> the data to be electronically transferredand will eliminate manual data entry <strong>of</strong> this information.92
c. Decrease the time for processing and setting up <strong>of</strong> the tax billing.2009Actual<strong>2010</strong>Projected<strong>2011</strong>TargetTax billing setup period 3 weeks 2weeks 2weeksd. Decrease the time for settlement <strong>of</strong> taxes with local taxing entities.2009Actual<strong>2010</strong>Projected<strong>2011</strong>TargetWeeks to Settle N/A 3 weeks 2 weeks3. Improve processing and tracking <strong>of</strong> delinquent personal and real property taxes.a. Fully train all employees in the use <strong>of</strong> s<strong>of</strong>tware to promote ease <strong>of</strong> payment entry andsearches for delinquent taxes.Number <strong>of</strong>EmployeesTrained onNew S<strong>of</strong>tware2009Actual<strong>2010</strong>Projected<strong>2011</strong>Target5 5 5b. Provide accurate statements to citizens with delinquent property taxes; the new s<strong>of</strong>twarewill allow for statements to be sent to property tax payers so that they will know all taxesoutstanding without having to check with the <strong>of</strong>fice.93
EXPENDITURE ANALYSIS DETAIL<strong>2010</strong>/<strong>2011</strong> APPROVED BUDGET101-1743 TreasuryAllocation PlanPostion Control<strong>2010</strong>/JOB <strong>2011</strong>PERSONNEL SERVICES CLASSIFICATION BUDGET ALLOCATIONSalaries 170,047 Assistant <strong>City</strong> ManagerOvertime 0 for Admin. Services 0.50 49,339Fringe Benefits 133,459 Deputy Treasurer 1.00 60,509Office Assistant III 1.00 37,012TOTAL303,506 Customer Serv. Coord. 0.25 7,680Customer Serv. Rep. IV 0.50 15,507OPERATING EXPENSES Total Personnel 3.25 170,047Supplies 10,694Internal Services 54,058 Overtime 0Other ServicesPr<strong>of</strong>essional Fees 1,274Maintenance Fees 34,806 FICA 12,312Other Contracted Fees 17,950 Healthcare Benefits - Active 46,122Healthcare Benefits - Retirees 0TOTAL118,782 Pension 75,025CAPITAL OUTLAY 0Total Fringe Benefits 133,459TOTAL0 TOTAL 3.25 303,506TOTAL APPROPRIATION 422,28894
FUND: 101 – General FundDEPARTMENT: Fiscal ServicesACITIVITY: 1744 - AssessorSTRATEGIC NARRATIVEThe Assessing Division is responsible for identifying and valuing all taxable real and personal propertywithin the <strong>City</strong> <strong>of</strong> <strong>Saginaw</strong>. This Division annually produces the ad valorem real and personal propertyassessment rolls, the specific assessment roll (IFT, NEZ, OPRA, Land Bank, and Act 328), and theproperty tax rolls in accordance with Michigan's General Property Tax Laws and the <strong>City</strong> <strong>of</strong> <strong>Saginaw</strong>Charter.FY <strong>2010</strong>/<strong>2011</strong> GOALS AND OBJECTIVES1. To maintain uniform and equitable real and personal property assessments on all tangibleproperty in compliance with statute.a. Appraise property at 50% <strong>of</strong> market value.Number <strong>of</strong> realpropertiesphysicallyinspected2009Actual<strong>2010</strong>Projected<strong>2011</strong>Target5,000 5,000 5,000Processpersonalpropertystatements byMarch 12009Actual<strong>2010</strong>Projected<strong>2011</strong>Target100% 100% 100%b. To maintain accurate property records.Process ownerand addresschanges2009Actual<strong>2010</strong>Projected<strong>2011</strong>Target100% 100% 100%95
Reviewbuildingpermits2009Actual<strong>2010</strong>Projected<strong>2011</strong>Target100% 100% 100%c. Complete residential reappraisal.Develop anup-to-dateland mapsPercent <strong>of</strong>residential datathat is verifiedMail notice <strong>of</strong>assessments toresidentialpropertyowners byMarch 12009Actual<strong>2010</strong>Projected<strong>2011</strong>Target100% 100% 100%2009Actual<strong>2010</strong>Projected<strong>2011</strong>Target50% 50% 100%2009Actual<strong>2010</strong>Projected<strong>2011</strong>Target0% 50% 50%96
EXPENDITURE ANALYSIS DETAIL<strong>2010</strong>/<strong>2011</strong> APPROVED BUDGET101-1744 AssessorAllocation PlanPostion Control<strong>2010</strong>/JOB <strong>2011</strong>PERSONNEL SERVICES CLASSIFICATION BUDGET ALLOCATIONSalaries 276,253 <strong>City</strong> Assessor 1.00 74,044Overtime 500 Property Appraiser III 2.00 100,113Fringe Benefits 204,761 Property Appraiser II 1.00 46,682Office Assistant III 1.00 36,278TOTAL481,514 Clerical II (PT) 1.00 19,136OPERATING EXPENSESTotal Personnel 6.00 276,253Supplies 3,550 Overtime 500Internal Services 50,499Other ServicesPr<strong>of</strong>essional Fees 5,154 FICA 19,985Maintenance Fees 24,617 Healthcare Benefits - Active 72,467Other Contracted Fees 14,450 Healthcare Benefits - Retirees 0Pension 112,309TOTAL98,270Total Fringe Benefits 204,761CAPITAL OUTLAY 0TOTAL0TOTAL 6.00 481,514TOTAL APPROPRIATION 579,78497
FUND: 101 – General FundDEPARTMENT: Fiscal ServicesACTIVITY: 1745 – Income TaxSTRATEGIC NARRATIVEThe Income Tax Division administers and processes the collection <strong>of</strong> all income tax revenue for the <strong>City</strong><strong>of</strong> <strong>Saginaw</strong> according to <strong>Saginaw</strong>'s Uniform Income Tax Ordinance, enacted September 28, 1964. TheIncome Tax Division processes approximately 43,000 payments, 38,000 individual tax returns, 2,000employer withholding reconciliation accounts with approximately 48,000 w-2’s, and 4,000 corporateand partnership tax returns annually.FY <strong>2010</strong>/<strong>2011</strong> GOALS AND OBJECTIVES1. To increase revenue by expanding collection avenues, follow-up measures and legalproceedings.a. To implement new employer compliance procedures using business license and the State<strong>of</strong> Michigan tape for information.2009Actual<strong>2010</strong>Projected<strong>2011</strong>TargetNumber <strong>of</strong>Warrant Files 873 945 970b. To monitor all payment plans more closely for timely payments to increase collectionrevenue.Number <strong>of</strong>Payment Plansreviewed2009Actual<strong>2010</strong>Projected<strong>2011</strong>Target75 150 200c. To write-<strong>of</strong>f all uncollectable debt prior to 1999, to better reflect an accurate picture <strong>of</strong>accounts receivable.Number <strong>of</strong> yearsWritten <strong>of</strong>f2009Actual6“1980 – 1986”<strong>2010</strong>Projected6“1987-1992”<strong>2011</strong>Target7“1993-1999”2. To expand and enhance on-line services <strong>of</strong>fered to employers, payroll companies, andindividuals to reduce time spent entering daily data.98
a. To implement/require payroll companies to submit payments electronically.2009Actual<strong>2010</strong>Projected<strong>2011</strong>TargetNumber <strong>of</strong> electronicpayments 1,540 1,800 2,100b. To increase the number <strong>of</strong> tax returns submitted electronically via E-File.2009Actual<strong>2010</strong>Projected<strong>2011</strong>TargetNumber <strong>of</strong> TaxReturns E-Filed 800 1,200* 2,000*c. To increase the number <strong>of</strong> employers’ submitting Sw-3 and w-2’s filed electronically.Number <strong>of</strong> EmployerReconciliation’sFiled Electronically2009Actual<strong>2010</strong>Projected<strong>2011</strong>Target144 200 250*Provided s<strong>of</strong>tware issues with Drake, CCH and Insource can be settled with the <strong>City</strong> <strong>of</strong> <strong>Saginaw</strong>.99
EXPENDITURE ANALYSIS DETAIL<strong>2010</strong>/<strong>2011</strong> APPROVED BUDGET101-1745 Income TaxAllocation PlanPostion Control<strong>2010</strong>/JOB <strong>2011</strong>PERSONNEL SERVICES CLASISIFICATION BUDGET ALLOCATIONSalaries 251,886 Income Tax Administrator 1.00 56,199Overtime 0 Income Tax Specialist 1.00 48,442Fringe Benefits 213,867 Income Tax Auditor 3.00 112,672Office Assistant III 1.00 34,574TOTAL465,753Total Personnel 6.00 251,886OPERATING EXPENSESOvertime 0Supplies 5,800Internal Services 44,608Other Services FICA 18,778Pr<strong>of</strong>essional Fees 7,900 Healthcare Benefits - Active 84,602Maintenance Fees 37,180 Healthcare Benefits - Retirees 0Other Contracted Fees 2,900 Pension 110,487TOTAL98,388 Total Fringe Benefits 213,867CAPITAL OUTLAY 0 TOTAL 6.00 465,753TOTAL0TOTAL APPROPRIATION 564,141100
DEPARTMENT OF PUBLIC SAFETYPOLICE DEPARTMENTANDFIRE DEPARTMENT
CITY OF SAGINAWDEPARTMENT OF PUBLIC SAFETYPOLICE DEPARTMENTAsst. <strong>City</strong> Mangerfor Public SafetyChief G. CliffAdministrationPolicePatrolPoliceAdministrationPoliceInvestigationBuilding &PropertyManagementTechnicalServices
POLICE DEPARTMENTEXPENDITURE ANALYSIS SUMMARY<strong>2010</strong>/<strong>2011</strong> APPROVED BUDGET<strong>2010</strong> <strong>2010</strong> <strong>2011</strong>2007 2008 2009 Approved Adjusted <strong>2010</strong> ApprovedActual Actual Actual <strong>Budget</strong> <strong>Budget</strong> Projected <strong>Budget</strong>3010 POLICE CHIEF - AD<strong>MI</strong>NISTRATIONPersonnel Services 412,560 407,772 417,267 358,108 348,775 333,868 453,569Operating Expenses 22,434 23,287 29,625 29,940 37,496 33,525 24,108Capital Outlay 0 0 0 0 0 0 0TOTALS 434,994 431,059 446,892 388,048 386,271 367,393 477,6773011 POLICE PATROLPersonnel Services 6,883,343 7,248,925 7,988,836 9,217,051 8,760,979 8,219,374 8,144,443Operating Expenses 297,710 241,520 115,070 120,955 117,496 119,755 110,706Capital Outlay 0 0 0 0 0 0 0TOTALS 7,181,053 7,490,445 8,103,906 9,338,006 8,878,475 8,339,128 8,255,1493012 POLICE AD<strong>MI</strong>NISTRATIONPersonnel Services 178,009 181,730 195,525 307,382 296,882 196,879 195,300Operating Expenses 235,219 155,136 329,290 73,225 97,484 88,533 179,216Capital Outlay 0 0 0 0 1,500 1,298 0TOTALS 413,228 336,866 524,815 380,607 395,866 286,709 374,5163013 POLICE INVESTIGATIONPersonnel Services 1,537,813 1,520,459 1,491,776 1,657,678 1,534,743 1,518,102 1,564,925Operating Expenses 152,915 148,258 146,506 146,310 152,432 117,800 130,450Capital Outlay 0 0 0 0 0 0 0TOTALS 1,690,728 1,668,717 1,638,282 1,803,988 1,687,175 1,635,902 1,695,3753014 POLICE BUILDING MAINTENANCEPersonnel Services 298,676 346,184 421,475 458,126 444,802 382,784 245,340Operating Expenses 848,018 1,024,251 757,384 604,452 668,357 611,793 635,237Capital Outlay 2,308 2,840 4,174 0 0 0 0TOTALS 1,149,001 1,373,275 1,183,033 1,062,578 1,113,159 994,577 880,5773015 POLICE TECHNICAL SERVICESPersonnel Services 345,507 369,839 418,028 376,148 358,376 389,141 511,648Operating Expenses 117,726 93,090 122,683 151,198 122,431 93,039 90,729Capital Outlay 0 0 0 0 0 0 0TOTALS 463,234 462,929 540,711 527,346 480,807 482,180 602,377102
POLICE DEPARTMENTEXPENDITURE ANALYSIS SUMMARY<strong>2010</strong>/<strong>2011</strong> APPROVED BUDGET<strong>2010</strong> <strong>2010</strong> <strong>2011</strong>2007 2008 2009 Approved Adjusted <strong>2010</strong> ApprovedActual Actual Actual <strong>Budget</strong> <strong>Budget</strong> Projected <strong>Budget</strong>TOTAL POLICEPersonnel Services 9,655,908 10,074,909 10,932,907 12,374,493 11,744,557 11,040,147 11,115,225Operating Expenses 1,674,022 1,685,542 1,500,558 1,126,080 1,195,696 1,064,444 1,170,446Capital Outlay 2,308 2,840 4,174 0 1,500 1,298 0TOTALEXPENDITURES11,332,238 11,763,291 12,437,639 13,500,573 12,941,753 12,105,889 12,285,671103
POSITION ANALYSIS<strong>2010</strong>/<strong>2011</strong> APPROVED BUDGET<strong>2010</strong> <strong>2010</strong> <strong>2011</strong>2007 2008 2009 Approved Adjusted <strong>2010</strong> ApprovedActual Actual Actual <strong>Budget</strong> <strong>Budget</strong> Projected <strong>Budget</strong>DEPARTMENT OF POLICEPolice Chief's Office 5.00 5.00 4.00 4.00 4.00 4.00 4.50Police Patrol 81.00 81.00 70.00 70.00 70.00 70.00 69.00Police Administration 2.00 2.00 3.00 3.00 3.00 3.00 1.00Police Investigation 15.00 15.00 13.00 13.00 13.00 13.00 12.00Building Maintenance 7.00 7.00 7.00 7.00 7.00 7.00 3.00Technical Services 7.00 7.00 7.00 7.00 7.00 7.00 8.00TOTAL GF POSITIONS 117.00 117.00 104.00 104.00 104.00 104.00 97.50Police Patrol 26.00 26.00 23.00 23.00 23.00 23.00 22.00Police Investigation 5.00 5.00 8.00 8.00 8.00 8.00 9.00TOTAL PS FUND POSITION 31.00 31.00 31.00 31.00 31.00 31.00 31.00Community Policing 3.00 3.00 4.00 4.00 4.00 4.00 9.00Drug Forfeiture 1.00 1.00 0.00 0.00 0.00 0.00 0.00Youth Initiative 2.00 2.00 2.00 2.00 2.00 2.00 1.00Auto Theft Prevention 1.00 1.00 1.00 1.00 1.00 1.00 1.00TOTAL GRANT POSITIONS 7.00 7.00 7.00 7.00 7.00 7.00 11.00TOTAL POSITIONS 155.00 155.00 142.00 142.00 142.00 142.00 139.50The <strong>2010</strong>/<strong>2011</strong> General Fund's Police Department will decrease in total by 6.5 positions from the <strong>2010</strong> approved budgeted levels.In the Police Chief's Office .50 <strong>of</strong> the Assistant <strong>City</strong> Manager for Public Safety, a newly created position, will be added to thepersonnel complement. This position will report directly to the <strong>City</strong> Manager on all matters pertaining to public safety. Both thePolice Chief and the Fire Chief will report directly to this individual. The cost <strong>of</strong> this position will be shared with the FireDepartment. In Patrol Division, the complement will decrease by one Police Officer position. This individual has been on longtermdisability. The Police Administration Division will be decrease by one position - the Staff Pr<strong>of</strong>essional. In accordance withthe staffing and efficiency study that was completed in FY <strong>2010</strong>, efficiency can be realized through the elimination <strong>of</strong> thisposition. Likewise, the Police Lieutenant will be redistributed to the Police Patrol Division. The Police Investigation Division willdecrease by one part time Clerical I position. This position became vacant due to a retirement. <strong>City</strong> administration does notplan on filling this position. The duties <strong>of</strong> this position will be absorbed by other in similar positions. In <strong>2011</strong>, the BuilidngMaintenance Division Property/Building will decrease by four positions - Maintenance Supervisor, Service Person, and twopart-time Property & Supply Clerks. These eliminations have been prompted by long-term disability, resignation, and theconsolidation <strong>of</strong> duties among the work staff. The Technical Services Supervisor, budgeted in the Technical Services Divisionwill oversee this division. In <strong>2011</strong> the Technical Services division will increase by one position, the Technical ServicesSupervisor. This employee will be responsible for the Technical Services Division as well as Building Maintenance.Note: The position pages for the Public Safety Fund and the Grant Funds, within the respective sections, details positional104
FUND: 101 – General FundDEPARTMENT: PoliceACTIVITY: 3010 – Police AdministrationSTRATEGIC NARRATIVEPolice Administration will perpetually evaluate and implement continuous improvements in itscommunications, customer service, and operations to ensure that the best police service is rendered tothis city. The department will endeavor to work together with neighborhood groups in solving issuesspecific to their respective areas. Our mission is to continue the progress that has been made inpartnering with the community to reduce the fear and incidence <strong>of</strong> crime, to enhance the quality <strong>of</strong> life,and to render the highest standards <strong>of</strong> pr<strong>of</strong>essional law enforcement.FY <strong>2010</strong>/<strong>2011</strong> GOALS AND OBJECTIVES1. To continue to meet monthly with neighborhood groups and organizations in order to facilitateproblem solving and enhance community relations.a. Increase number <strong>of</strong> neighborhood groups by 5% to train and certify.b. Increase participation <strong>of</strong> citizenry in neighborhood association meetings and volunteeractivities by 5%.2009Actual% <strong>of</strong> NeighborhoodAssociationParticipating*<strong>City</strong> has a total <strong>of</strong> 18 <strong>of</strong>ficial neighborhood groups.<strong>2010</strong>Projected<strong>2011</strong>Targetc. Increase number <strong>of</strong> mobile volunteer patrols during Arson Watch by 10%.105
EXPENDITURE ANALYSIS DETAIL<strong>2010</strong>/<strong>2011</strong> APPROVED BUDGET101-3010 Police Chief - AdministrationAllocation PlanPosition Control<strong>2010</strong>/JOB <strong>2011</strong>PERSONNEL SERVICES CLASSIFICATION BUDGET ALLOCATIONSalaries 249,201 Assistant <strong>City</strong> ManagerOvertime 275 for Public Safety 0.50 46,734Fringe Benefits 204,093 Chief <strong>of</strong> Police 1.00 91,320Admin. Pr<strong>of</strong>essional 1.00 42,170TOTAL453,569 Staff Pr<strong>of</strong>essional 1.00 47,345Clerical II (PT) 1.00 21,632OPERATING EXPENSES Total Personnel 4.50 249,201Supplies 0Internal Services 23,408 Overtime 275Other ServicesPr<strong>of</strong>essional Fees 0Maintenance Fees 700 FICA 18,126Other Contracted Fees 0 Healthcare Benefits - Active 44,384Healthcare Benefits - Retirees 0TOTAL24,108 Pension - Civilian 86,635Pension - Sworn 54,948CAPITAL OUTLAY 0 Total Fringe Benefits 204,093TOTAL0TOTAL 4.50 453,569TOTAL APPROPRIATION 477,677106
FUND: 101 – General FundDEPARTMENT: PoliceACTIVITY: 3011 – Police PatrolSTRATEGIC NARRATIVEThe Patrol Division’s primary mission is to provide public safety by answering calls for service,preventing and suppressing criminal activity, apprehending criminals, preserving peace and order, andprotecting life and property. The Safe Streets Unit works closely with Patrol personnel to reducecriminal activity through proactive crime prevention efforts designed to rid our neighborhoods <strong>of</strong>activities that adversely affect the quality <strong>of</strong> life. Crime mapping provides police <strong>of</strong>ficers and citizenswith crime analysis information vital to the <strong>City</strong>’s crime fighting effort.FY <strong>2010</strong>/<strong>2011</strong> GOALS AND OBJECTIVES1. To facilitate a safe environment in which to live and work.a. Reduce number <strong>of</strong> traffic accidents by 5% <strong>of</strong> previous year.b. Reduce number <strong>of</strong> gun arrests by 10% <strong>of</strong> previous year.c. Reduce number <strong>of</strong> street level drug arrests by 10% <strong>of</strong> previous year.d. Reduce shooting incidents by 5% from previous year.2. Training in the areas <strong>of</strong> customer service and community relations will provide <strong>of</strong>ficers withskills needed to enhance the confidence, trust, and respect <strong>of</strong> the police department.a. Maintain current levels <strong>of</strong> 302-funded in-service training (dependent upon increase ordecrease <strong>of</strong> State’s 302 funding.)107
EXPENDITURE ANALYSIS DETAIL<strong>2010</strong>/<strong>2011</strong> APPROVED BUDGET101-3011 Police PatrolAllocation PlanPosition Control<strong>2010</strong>/JOB <strong>2011</strong>PERSONNEL SERVICES CLASSIFICATION BUDGET ALLOCATIONSalaries 2,620,289 Police Lieutenant 4.00 278,893Overtime 94,500 Police Sergeant 6.00 253,451Fringe Benefits 5,429,654 Police Officer 40.00 2,001,577Clerical I (PT) 1.00 18,330TOTAL8,144,443 School Crossing Guard 18.00 68,038OPERATING EXPENSESTotal Personnel 69.00 2,620,289Supplies 0 Overtime 94,500Internal Services 110,706Other ServicesPr<strong>of</strong>essional Fees 0 FICA 78,175Maintenance Fees 0 Healthcare Benefits - Active 771,988Other Contracted Fees 0 Healthcare Benefits - Retirees 2,112,356Pension - Civilian 688TOTAL110,706 Pension - Sworn 2,466,447CAPITAL OUTLAY 0Total Fringe Benefits 5,429,654TOTAL0 TOTAL 69.00 8,144,443TOTAL APPROPRIATION 8,255,149108
FUND: 101 – General FundDEPARTMENT: PoliceACTIVITY: 3012 – Police Administrative ServicesSTRATEGIC NARRATIVEThe Administrative Services Division oversees and monitors personnel management, training programs,recruiting, grant projects, research and development and fiscal management efforts. AdministrativeServices focuses on <strong>of</strong>ficer skill development, promoting positive community relations, maintaining ahigh level <strong>of</strong> department standards through the Inspectional Services Section and fostering laborrelations that benefit employees, thus enabling the Department to carry out its mission.FY <strong>2010</strong>/<strong>2011</strong> GOALS AND OBJECTIVES1. To take maximum advantage <strong>of</strong> available grant opportunities.a. Increase in grant monies for department operationsb. Maintain accurate and efficient grant reporting <strong>of</strong> administration.2. Maintain current levels <strong>of</strong> required specialized training and certification <strong>of</strong> all <strong>of</strong>ficers anddetectives.a. Depending on staffing in each specialty, take maximum advantage <strong>of</strong> available trainingopportunities109
EXPENDITURE ANALYSIS DETAIL<strong>2010</strong>/<strong>2011</strong> APPROVED BUDGET101-3012 Police AdministrationAllocation PlanPosition Control<strong>2010</strong>/JOB <strong>2011</strong>PERSONNEL SERVICES CLASSIFICATION BUDGET ALLOCATIONSalaries 62,633 Police Sergeant 1.00 62,633Overtime 1,000Fringe Benefits 131,667 Total Personnel 1.00 62,633TOTAL195,300Overtime 1,000OPERATING EXPENSESFICA 631Supplies 5,500 Healthcare Benefits - Active 16,763Internal Services 12,577 Healthcare Benefits - Retirees 0Other Services Pension - Civilian 65,923Pr<strong>of</strong>essional Fees 135,889 Pension - Sworn 48,350Maintenance Fees 0Other Contracted Fees 25,250 Total Fringe Benefits 131,667TOTAL179,216TOTAL 1.00 195,300CAPITAL OUTLAY 0TOTAL0TOTAL APPROPRIATION 374,516110
FUND: 101 – General FundDEPARTMENT: PoliceACTIVITY: 3013 – Police InvestigationSTRATEGIC NARRATIVEThe responsibility <strong>of</strong> the Investigation Services Division is to follow up on criminal complaintsinvolving adult and juvenile <strong>of</strong>fenders. This includes interviewing and obtaining evidence necessary toprosecute <strong>of</strong>fenders. The detective bureau also staffs four vice positions to follow up on drug-relatedarrests and two vice detectives for narcotic investigations and street enforcement. The PoliceDepartment will continue to coordinate with the United for Kids Center for the investigation <strong>of</strong> sexualassaults against children and continue partnering with the Underground Rail Road, the Infant MortalityCoalition and the Family Independence Agency.FY <strong>2010</strong>/<strong>2011</strong> GOALS AND OBJECTIVES1. Maintain current levels <strong>of</strong> collaborative efforts with other law enforcement agencies.2. Direct the unit resources necessary to obtain a 70% or better closure rate on part one criminalcomplaints.% Closure rateon Part I Crimes2009<strong>2010</strong>Actual Projected81% 61%year to date<strong>2011</strong>Target81%3. Match or improve on the National Violent Crime Index trend based on FBI yearly reports.<strong>Saginaw</strong>’sNationalViolent CrimeRate comparedto FBI2009Actual<strong>2010</strong>Projected<strong>2011</strong>Target1,146 N/A N/A111
EXPENDITURE ANALYSIS DETAIL<strong>2010</strong>/<strong>2011</strong> APPROVED BUDGET101-3013 Police InvestigationAllocation PlanPosition Control<strong>2010</strong>/JOB <strong>2011</strong>PERSONNEL SERVICES CLASSIFICATION BUDGET ALLOCATIONSalaries 564,161 Police Sergeant 1.00 62,633Overtime 68,250 Police Officer 9.00 450,771Fringe Benefits 932,514 Office Assistant II 1.00 33,701Clerical I 1.00 17,056TOTAL1,564,925Total Personnel 12.00 564,161OPERATING EXPENSESOvertime 68,250Supplies 0Internal Services 45,085Other Services FICA 10,801Pr<strong>of</strong>essional Fees 84,965 Healthcare Benefits - Active 167,721Maintenance Fees 0 Healthcare Benefits - Retirees 0Other Contracted Fees 400 Pension - Civilian 93,160Pension - Sworn 660,832TOTAL130,450Total Fringe Benefits 932,514CAPITAL OUTLAY 0 TOTAL 12.00 1,564,925TOTAL0TOTAL APPROPRIATION 1,695,375112
FUND: 101 – General FundDEPARTMENT: PoliceACTIVITY: 3014 – Police Building ManagementSTRATEGIC NARRATIVEThe Police Building and Property Management Section provides support in partnership with policeoperations in the areas <strong>of</strong> building maintenance, vehicle maintenance, and property room management.Specific activities include the building and grounds maintenance <strong>of</strong> the Law Enforcement Center;purchase and maintenance <strong>of</strong> police fleet vehicles; control and storage <strong>of</strong> all evidence and property; anddisposition <strong>of</strong> property and vehicles from cases that have been closed.FY <strong>2010</strong>/<strong>2011</strong> GOALS AND OBJECTIVES1. Continue efforts to maintain the work environment according to <strong>MI</strong>OSHA Standards.a. Zero <strong>MI</strong>OSHA complaints.b. Obtain ANSI traffic safety vests for all patrol personneli. Develop policy for use <strong>of</strong> vests.2. Implement a standardized program <strong>of</strong> preventative maintenance so as to minimize vehiclemaintenance costs and increase maximized safety for all police vehicles.a. Maintain current maintenance schedules for all vehicles.b. Maintain current lack <strong>of</strong> major repairs due to poor on-going preventive care.3. Maintain or improve current evidence property procedures so as to assure compliance with legalrequirements.a. Maintain certification <strong>of</strong> Property Room personnel through International Association forProperty and Evidence, Inc (I.A.P.E.).b. Maintain evidence-handling procedures according to standards established by theI.A.P.E.4. Implement evidence/property barcoding procedure to improve the efficiency <strong>of</strong> evidencehandling.113
EXPENDITURE ANALYSIS DETAIL<strong>2010</strong>/<strong>2011</strong> APPROVED BUDGET101-3014 Building MaintenanceAllocation PlanPosition Control<strong>2010</strong>/JOB <strong>2011</strong>PERSONNEL SERVICES CLASSIFICATION BUDGET ALLOCATIONSalaries 103,965 Firearms & Prop.Overtime 1,500 Mgmt Specialist 1.00 45,435Fringe Benefits 139,875 Prop/Evidence Specialist 1.00 39,810Custodial Worker (PT) 1.00 18,720TOTAL245,340Total Personnel 3.00 103,965OPERATING EXPENSESOvertime 1,500Supplies 241,502Internal Services 109,285 FICA 7,495Other Services Healthcare Benefits - Active 40,907Pr<strong>of</strong>essional Fees 24,900 Healthcare Benefits - Retirees 0Maintenance Fees 259,550 Pension - Civilian 91,473Other Contracted Fees 0Total Fringe Benefits 139,875TOTAL635,237TOTAL 3.00 245,340CAPITAL OUTLAY 0TOTAL0TOTAL APPROPRIATION 880,577114
FUND: 101 – General FundDEPARTMENT: PoliceACTIVITY: 3015 – Technical ServicesSTRATEGIC NARRATIVEThe Police Technical Services Division includes the Records, Crime Analysis, Gun Registration andTechnical Support Sections <strong>of</strong> the Police Department. The Records Section provides all record keepingservices for the Police Department. Activities include processing, storing, and ensuring a complete andcomprehensive police records system, preparation <strong>of</strong> weekly and monthly statistical programs; andproviding access to the National Law Enforcement Information Network (L.E.I.N.). The Crime AnalysisSection provides up-to-date crime activity reports to the Police Department. Activities include statisticaldata, crime pattern information, crime mapping, and informational support for the Same Cop/SameNeighborhood program.FY <strong>2010</strong>/<strong>2011</strong> GOALS AND OBJECTIVES1. Increase utility <strong>of</strong> mobile data terminals within patrol vehicles for records management andcrime analysis processing.a. Complete transition from use <strong>of</strong> hotspot downloading to use <strong>of</strong> air card.115
EXPENDITURE ANALYSIS DETAIL<strong>2010</strong>/<strong>2011</strong> APPROVED BUDGET101-3015 Technical ServicesAllocation PlanPosition Control<strong>2010</strong>/JOB <strong>2011</strong>PERSONNEL SERVICES CLASSIFICATION BUDGET ALLOCATIONSalaries 258,834 Police Sergeant 1.00 61,544Overtime 1,000 Techn. Service Supervisor 1.00 44,151Fringe Benefits 251,814 Tac/Lein Operator 1.00 33,971Office Assistant II 2.00 66,752TOTAL511,648 Clerical II (PT) 1.00 21,632Clerical I (PT) 2.00 30,784OPERATING EXPENSES Total Personnel 8.00 258,834Supplies 0Internal Services 36,729 Overtime 1,000Other ServicesPr<strong>of</strong>essional Fees 2,500Maintenance Fees 51,500 FICA 14,034Other Contracted Fees 0 Healthcare Benefits - Active 115,003Healthcare Benefits - Retirees 0TOTAL90,729 Pension - Civilian 97,829Pension - Sworn 24,948CAPITAL OUTLAY 0 Total Fringe Benefits 251,814TOTAL0 TOTAL 8.00 511,648TOTAL APPROPRIATION 602,377116
This page is intentionally left blank
CITY OF SAGINAWDEPARTMENT OF PUBLIC SAFETYFIRE DEPARTMENTAsst. <strong>City</strong> Mangerfor Public SafetyChief E. D. HollandAdministrationFireFireFireFire ApparatusSuppressionTrainingPrevention& Maintenance
FIRE DEPARTMENTEXPENDITURE ANALYSIS SUMMARY<strong>2010</strong>/<strong>2011</strong> APPROVED BUDGET<strong>2010</strong> <strong>2010</strong> <strong>2011</strong>2007 2008 2009 Approved Adjusted <strong>2010</strong> ApprovedActual Actual Actual <strong>Budget</strong> <strong>Budget</strong> Projected <strong>Budget</strong>3750 FIRE AD<strong>MI</strong>NISTRATIONPersonnel Services 292,904 201,046 217,535 220,015 215,349 213,955 307,783Operating Expenses 194,811 90,869 183,435 32,677 30,303 27,382 96,838Capital Outlay 1,070 0 1,630 0 757 546 0TOTALS 488,785 291,915 402,600 252,692 246,409 241,882 404,6213751 FIRE SUPPRESSIONPersonnel Services 7,199,899 7,142,799 7,282,990 7,932,764 7,670,243 7,007,775 7,372,847Operating Expenses 732,640 331,603 336,455 424,732 424,919 350,755 372,638Capital Outlay 219,919 22,311 38,758 0 4,682 2,546 8,000TOTALS 8,152,458 7,496,713 7,658,203 8,357,496 8,099,844 7,361,076 7,753,4853752 FIRE TRAININGPersonnel Services 127,208 141,154 144,989 132,996 128,322 127,899 130,489Operating Expenses 12,922 36,983 36,503 56,163 56,034 41,649 48,982Capital Outlay 0 0 0 0 0 0 0TOTALS 140,130 178,137 181,492 189,159 184,356 169,548 179,4713753 FIRE PREVENTIONPersonnel Services 163,729 111,567 161,237 160,478 151,128 162,128 163,294Operating Expenses 7,972 14,240 10,651 40,260 39,748 24,481 31,272Capital Outlay 0 0 0 0 985 984 0TOTALS 171,701 125,807 171,888 200,738 191,861 187,594 194,5663754 FIRE APPARATUSOPERATIONS AND MAINTENANCEPersonnel Services 0 0 0 0 0 0 0Operating Expenses 340,047 280,298 437,742 124,713 132,994 85,512 324,047Capital Outlay 0 0 0 0 0 0 0TOTALS 340,047 280,298 437,742 124,713 132,994 85,512 324,047TOTAL FIREPersonnel Services 7,783,740 7,596,566 7,806,751 8,446,253 8,165,042 7,511,756 7,974,413Operating Expenses 1,288,392 753,993 1,004,786 678,545 683,998 529,779 873,777Capital Outlay 220,989 22,311 40,388 0 6,424 4,076 8,000TOTALEXPENDITURES9,293,121 8,372,870 8,851,925 9,124,798 8,855,464 8,045,612 8,856,190118
POSITION ANALYSIS<strong>2010</strong>/<strong>2011</strong> APPROVED BUDGET<strong>2010</strong> <strong>2010</strong> <strong>2011</strong>2007 2008 2009 Approved Adjusted <strong>2010</strong> ApprovedActual Actual Actual <strong>Budget</strong> <strong>Budget</strong> Projected <strong>Budget</strong>DEPARTMENT OF FIREFire Administration 3.80 2.80 2.80 2.00 2.00 2.00 2.50Fire Suppression 41.00 41.00 44.00 44.00 44.00 44.00 44.00Fire Training 1.00 1.00 1.00 1.00 1.00 1.00 1.00Fire Prevention 1.00 1.00 1.00 1.80 1.80 1.80 2.00Fire Apparatus 0.00 0.00 0.00 0.00 0.00 0.00 0.00TOTAL GF POSITIONS 46.80 45.80 48.80 48.80 48.80 48.80 49.50Fire Suppression 19.00 19.00 19.00 19.00 19.00 19.00 19.00Fire Prevention 1.00 1.00 1.00 1.00 1.00 1.00 1.00TOTAL PS Fund POSITIONS 20.00 20.00 20.00 20.00 20.00 20.00 20.00TOTAL GF POSITIONS 66.80 65.80 68.80 68.80 68.80 68.80 69.50The Approved <strong>2011</strong> <strong>Budget</strong>'s personnel complement will increase, in total, by .50 <strong>of</strong> a position. In the Fire AdmininistrationDivision, the .50 <strong>of</strong> the Assistant <strong>City</strong> Manager for Public Safety, which is a newly created position, will be added to both police andfire administration divisions. As a part <strong>of</strong> accurately recording the personnel complement the 51 (205) Public Safety Fund funded<strong>of</strong>ficers will be reflected in the Public Safety Fund. Because <strong>of</strong> the Public Safety Millage, the <strong>City</strong> is required to have the total Policeand Fire personnel complement within the Public Safety Fund remain at the same levels as when the millage was adopted, thereforethe <strong>2011</strong> <strong>Budget</strong> in that fund has remained the same as in 2007.Note: The position pages for the Public Safety Fund details positional changes.119
FUND: 101 – General FundDEPARTMENT: FireACTIVITY: 3750 – Fire AdministrationSTRATEGIC NARRATIVEThe Administrative Division <strong>of</strong> the Fire Department provides administrative oversight for all divisionsand manages fire suppression, training, maintenance, prevention and fire safety education activities.Coordination <strong>of</strong> these activities with other <strong>City</strong> departments and agencies is intended to provide thehighest level <strong>of</strong> services based on community need.In FY <strong>2010</strong>/<strong>2011</strong>, the Administrative Division will continue cost recovery efforts and improvement <strong>of</strong>competency levels in addition to broadening code enforcement and public information programs. Thedivision will research and expand programs relating to cost recovery and department efficiency whilecontinuing to work closely with community neighborhood groups.FY <strong>2010</strong>/<strong>2011</strong> GOALS AND OBJECTIVES1. To enhance public safety by transforming the delivery <strong>of</strong> services.a. To continue expanding technology use to enhance information management systems andexpansion <strong>of</strong> mobile technologies. Continue combining program access for fieldoperations and data retrieval.2009Actual<strong>2010</strong>Projected<strong>2011</strong>TargetIncrease technology useby unit(s) available 2 13 172. To develop trust in government and create fiscal health.a. To improve department safety and efficiency by implementing newly updated policiesand procedures. Implement newly established controls on purchase <strong>of</strong> goods andservices.Rules/Policy/Proceduresalter/changed/improvedcombined with in-housetraining classes forimplementation2009Actual<strong>2010</strong>Projected<strong>2011</strong>Target18 34 54b. To expand cost recovery efforts through ordinance and code development and servicelevel analysis. Implement enhanced cost recovery methods for HazMat, fire codeenforcement, and inspection programs.120
2009<strong>2010</strong> <strong>2011</strong>Actual Projected TargetRevenue/Recurring $3,390/17 $7,400/38 $11,000/703. To develop and revitalize neighborhoods.a. To increase public awareness <strong>of</strong> fire and life safety issues through increased communityinvolvement and emergency planning. Through cooperative effort with other agenciesand departments improve community safety and <strong>of</strong>fer educational programsdemonstrating fire service involvement throughout the community.2009Actual<strong>2010</strong>Projected<strong>2011</strong>TargetEmergencyPlanning Updates 144 207 300121
EXPENDITURE ANALYSIS DETAIL<strong>2010</strong>/<strong>2011</strong> APPROVED BUDGET101-3750 Fire AdministrationAllocation PlanPosition Control<strong>2010</strong>/JOB <strong>2011</strong>PERSONNEL SERVICES CLASSIFICATION BUDGET ALLOCATIONSalaries 185,398 Asst. <strong>City</strong> Manger forOvertime 0 Public Safety 0.50 46,734Fringe Benefits 122,385 Chief <strong>of</strong> Fire 1.00 91,320Staff Pr<strong>of</strong>essional 1.00 47,345TOTAL307,783Total Personnel 2.50 185,398OPERATING EXPENSESOvertime 0Supplies 6,998Internal Services 14,137Other Services FICA 11,994Pr<strong>of</strong>essional Fees 69,349 Healthcare Benefits - Active 24,573Maintenance Fees 500 Healthcare Benefits - Retirees 0Other Contracted Fees 5,854 Pension - Civilian 51,442Pension - Sworn 34,376TOTAL96,838Total Fringe Benefits 122,385CAPITAL OUTLAY 0 TOTAL 2.50 307,783TOTAL0TOTAL APPROPRIATION 404,621122
FUND: 101 – General FundDEPARTMENT: FireACTIVITY: 3751 – Fire SuppressionSTRATEGIC NARRATIVEThe Fire Suppression Division’s primary responsibility is to create and maintain a safe livingenvironment in which citizens and employees can safely work and live. This division will continue toprovide immediate response, on-scene management, and mitigation during emergency situations thatpose a direct threat to life and property. The division will provide fire suppression and mitigates rescue,extrication, confined space, high angle and water rescue incidents. This division will commandemergency operations at both natural and man-made disasters and hazardous materials incidents. Thedivision will continue an active roll in promoting fire and life safety programs through participation incommunity education, pre-incident surveys, educational presentations, and expanded involvement as anactive partner in neighborhood organizations.FY <strong>2010</strong>/<strong>2011</strong> GOALS AND OBJECTIVES1. To maintain an emergency response time below the national average with a continued efforttoward improvement.a. To continue maintaining an average response time below the national average anddemonstrate response effectiveness through monthly reporting.2009Actual<strong>2010</strong>Projected<strong>2011</strong>TargetResponse Time(Minutes) 4:03 4:00 4:002. To enhance public relations and community awareness through pre-incident surveys andinvolvement with neighborhood organizations.a. To conduct pre-incident surveys to plan tactics and strategies for effective incidentmitigation.2009Actual<strong>2010</strong>Projected<strong>2011</strong>TargetPre-incident surveys 79 90 1082009Actual<strong>2010</strong>Projected<strong>2011</strong>TargetTeaching/CommunityInvolvement (Hours) 203 200 200123
EXPENDITURE ANALYSIS DETAIL<strong>2010</strong>/<strong>2011</strong> APPROVED BUDGET101-3751 Fire SuppressionAllocation PlanPosition Control<strong>2010</strong>/JOB <strong>2011</strong>PERSONNEL SERVICES CLASSIFICATION BUDGET ALLOCATIONSalaries 2,597,365 Fire Battalion Chief 1.00 77,196Overtime 200,000 Fire Captain 6.00 420,923Fringe Benefits 4,575,482 Fire Lieutenant 12.00 770,765Fire Engineer 11.00 627,192TOTAL7,372,847 Firefighter 14.00 701,289OPERATING EXPENSESTotal Personnel 44.00 2,597,365Supplies 89,050 Overtime 200,000Internal Services 132,076Other ServicesPr<strong>of</strong>essional Fees 24,460 FICA 39,695Maintenance Fees 123,902 Healthcare Benefits - Active 899,385Other Contracted Fees 3,150 Healthcare Benefits - Retirees 1,966,896Pension - Sworn 1,669,506TOTAL372,638Total Fringe Benefits 4,575,482CAPITAL OUTLAY 8,000 TOTAL 44.00 7,372,847TOTAL8,000TOTAL APPROPRIATION 7,753,485124
FUND: 101 – General FundDEPARTMENT: FireACTIVITY: 3752 – Fire TrainingSTRATEGIC NARRATIVEThe Fire Training Division conducts, coordinates, and manages training, safety, department wideplanning, health and emergency management homeland security programs. Department trainingprograms are designed to enhance pr<strong>of</strong>essional development through multi-faceted courses, exerciseswhich meet statutory and community requirements, and involvement in development <strong>of</strong> programs thatrecognize threats to community safety and established way <strong>of</strong> life. Training and education is recognizedas an essential key in keeping the community and environment safe from disasters. The focus <strong>of</strong> theSafety and Health Program is the reduction <strong>of</strong> injuries and potential health hazards identification.Emergency Management coordinates disaster response, mitigation, and recovery efforts and this divisionis the focal point for departmental homeland security efforts and programs.FY <strong>2010</strong>/<strong>2011</strong> GOALS AND OBJECTIVES1. To enhance public safety through service delivery transformation.a. Provide training in blood borne pathogens, fire suppression methods and techniques,confined space, water/ice and high angle rescue, handling hazardous materials, incidentmitigation, and rapid intervention.2009<strong>2010</strong><strong>2011</strong>Actual ProjectedTargetClassroom Training 14,519 15,000 15,0002009<strong>2010</strong><strong>2011</strong>Actual ProjectedTargetField Training 1,400 2,400 2,4002009Actual<strong>2010</strong>Projected<strong>2011</strong>TargetFire OfficerDevelopment 80% 50% 100%National IncidentManagementSystem(300 and 400 levelcoursework)2009Actual<strong>2010</strong>Projected<strong>2011</strong>Target95% 100% 100%125
2009Actual<strong>2010</strong>Projected<strong>2011</strong>TargetRegionalCombined Training 1,810 1,900 2,000b. Provide a safe work environment through promotion <strong>of</strong> physical conditioning, and qualitypersonal protective equipment.2009<strong>2010</strong><strong>2011</strong>Actual ProjectedTargetPhysical Fitness 8,944 9,000 9,000126
EXPENDITURE ANALYSIS DETAIL<strong>2010</strong>/<strong>2011</strong> APPROVED BUDGET101-3752 Fire TrainingAllocation PlanPosition Control<strong>2010</strong>/JOB <strong>2011</strong>PERSONNEL SERVICES CLASSIFICATION BUDGET ALLOCATIONSalaries 77,134 Training Officer 1.00 77,134Overtime 10,000Fringe Benefits 43,355 Total Personnel 1.00 77,134TOTAL130,489Overtime 10,000OPERATING EXPENSESFICA 1,275Supplies 32,122 Healthcare Benefits - Active 17,132Internal Services 4,131 Healthcare Benefits - Retirees 0Other Services Pension - Sworn 24,948Pr<strong>of</strong>essional Fees 200Maintenance Fees 0 Total Fringe Benefits 43,355Other Contracted Fees 12,529TOTAL 1.00 130,489TOTAL48,982CAPITAL OUTLAY 0TOTAL0TOTAL APPROPRIATION 179,471127
FUND: 101 – General FundDEPARTMENT: FireACTIVITY: 3753 – Fire PreventionSTRATEGIC NARRATIVEThe Fire Prevention and Safety Division outlines strategies to determine fire prevention needs andidentifies the programs and services necessary for fire and life safety in the community. Programsinclude providing fire and life safety education workshops, elimination <strong>of</strong> fire hazards and fire codeenforcement programs.Construction plan review is provided and ensures proper fire and life safety code protection for newconstruction and existing building renovations. Fire prevention and safety personnel conductinspections to ensure compliance with applicable fire and life safety codes and is an active partner inneighborhood and civic organizations.FY <strong>2010</strong>/<strong>2011</strong> GOALS AND OBJECTIVES1. To educate the community on fire and life safety.a. To continue an aggressive fire and life safety educational program throughout the communitywith emphasis on public schools, institutions, and high occupancy facilities.2009Actual<strong>2010</strong>Projected<strong>2011</strong>TargetFire SafetyPrograms 84 90 100b. To maintain fire and life safety code compliance through inspections <strong>of</strong> business andinstitutional facilities.2009<strong>2010</strong><strong>2011</strong>Actual ProjectedTargetInspections 510 720 7802009Actual<strong>2010</strong>Projected<strong>2011</strong>TargetFire CodeViolations 814 750 7002009Actual<strong>2010</strong>Projected<strong>2011</strong>TargetCorrected FireCode Violations 770 705 658128
EXPENDITURE ANALYSIS DETAIL<strong>2010</strong>/<strong>2011</strong> APPROVED BUDGET101-3753 Fire PreventionAllocation PlanPosition Control<strong>2010</strong>/JOB <strong>2011</strong>PERSONNEL SERVICES CLASSIFICATION BUDGET ALLOCATIONSalaries 77,075 Deputy Fire Marshall 1.00 57,939Overtime 13,000 Clerical II (PT) 1.00 19,136Fringe Benefits 73,219Total Personnel 2.00 77,075TOTAL163,294OPERATING EXPENSESOvertime 13,000Supplies 7,300 FICA 1,769Internal Services 16,886 Healthcare Benefits - Active 20,834Other Services Healthcare Benefits - Retirees 0Pr<strong>of</strong>essional Fees 550 Pension - Civilian 718Maintenance Fees 0 Pension - Sworn 49,898Other Contracted Fees 6,536Total Fringe Benefits 73,219TOTAL31,272TOTAL 2.00 163,294CAPITAL OUTLAY 0TOTAL0TOTAL APPROPRIATION 194,566129
FUND: 101 – General FundDEPARTMENT: FireACTIVITY: 3754 – Fire MaintenanceSTRATEGIC NARRATIVEThe Fire Maintenance function <strong>of</strong> the Fire Department provides for the maintenance and repair <strong>of</strong> 19pieces <strong>of</strong> motorized and 3 non-motorized apparatus. Working in concert with private sector businesspartners, this division provides funding for operations, preventative maintenance, and repairs to allvehicles in the Fire Department fleet.Breakdown <strong>of</strong> Fire Department fleet - six staff vehicles, three fire aerial apparatus, and six fire pumpingapparatus. The department operates some highly specialized equipment, including a hazardous materialsunit, a Zodiac water and ice rescue boat, and a fire investigation unit designed to carry equipment andserve as a mobile <strong>of</strong>fice and interview room.FY <strong>2010</strong>/<strong>2011</strong> GOALS AND OBJECTIVES1. To maintain all apparatus for operational safety and efficiency and incompliance withrecommended industry standards.a. Operational safety and efficiency maintenance.2009Actual<strong>2010</strong>Projected<strong>2011</strong>TargetPreventativeMaintenance $170,000 $168,330 $204,1042009Actual<strong>2010</strong>Projected<strong>2011</strong>TargetAnnual PumpTesting $2,720 $2,720 $3,0002009Actual<strong>2010</strong>Projected<strong>2011</strong>TargetAnnual AerialTesting $2,065 $2,272 $2,499130
EXPENDITURE ANALYSIS DETAIL<strong>2010</strong>/<strong>2011</strong> APPROVED BUDGET101-3754 Fire Apparatus Operations and MaintenanceAllocation PlanPosition Control<strong>2010</strong>/JOB <strong>2011</strong>PERSONNEL SERVICES CLASSIFICATION BUDGET ALLOCATIONSalaries 0Overtime 0 Total Personnel 0.00 0Fringe Benefits 0TOTAL0 Overtime 0OPERATING EXPENSES FICA 0Healthcare Benefits - Active 0Supplies 53,560 Healthcare Benefits - Retirees 0Internal Services 0 Pension - Sworn 0Other ServicesPr<strong>of</strong>essional Fees 70,847 Total Fringe Benefits 0Maintenance Fees 199,640Other Contracted Fees 0 TOTAL 0.00 0TOTAL324,047CAPITAL OUTLAY 0TOTAL0TOTAL APPROPRIATION 324,047131
DEPARTMENT OF DEVELOPMENT
CITY OF SAGINAWDEPARTMENT OF DEVELOPMENTOdail ThornsDirector <strong>of</strong>DevelopmentAssistant Director<strong>of</strong> DevelopmentPlanning &ZoningInspectionsCommunityDevelopmentBlock GrantParkingOperations &MaintenanceEnvironmentalImprovements
EXPENDITURE ANALYSIS SUMMARY<strong>2010</strong>/<strong>2011</strong> APPROVED BUDGET<strong>2010</strong> <strong>2010</strong> <strong>2011</strong>2007 2008 2009 Approved Adjusted <strong>2010</strong> ApprovedActual Actual Actual <strong>Budget</strong> <strong>Budget</strong> Projected <strong>Budget</strong>3863 PLANNING & ZONINGPersonnel Services 253,125 239,121 227,985 228,221 207,859 202,553 193,678Operating Expenses 195,753 148,652 137,696 99,528 203,055 169,203 96,977Capital Outlay 1,476 250 0 0 2,150 0 0TOTALS 450,354 388,023 365,681 327,749 413,064 371,756 290,6553865 INSPECTIONSPersonnel Services 596,199 602,520 643,849 607,474 567,642 535,816 496,524Operating Expenses 281,797 769,411 718,918 1,222,665 741,575 648,896 407,093Capital Outlay 0 0 0 0 0 0 0TOTALS 877,996 1,371,931 1,362,767 1,830,139 1,309,217 1,184,712 903,617TOTAL DEVELOPMENTPersonnel Services 849,324 841,641 871,834 835,695 775,501 738,369 690,202Operating Expenses 477,550 918,063 856,614 1,322,193 944,630 818,099 504,070Capital Outlay 1,476 250 0 0 2,150 0 0TOTALEXPENDITURES 1,328,350 1,759,954 1,728,448 2,157,888 1,722,281 1,556,468 1,194,272133
POSITION ANALYSIS<strong>2010</strong>/<strong>2011</strong> APPROVED BUDGET<strong>2010</strong> <strong>2010</strong> <strong>2011</strong>2007 2008 2009 Approved Adjusted <strong>2010</strong> ApprovedActual Actual Actual <strong>Budget</strong> <strong>Budget</strong> Projected <strong>Budget</strong>DevelopmentZoning and Planning 2.25 2.25 2.25 2.35 2.35 2.35 1.75Inspections 7.75 7.75 7.75 7.00 7.00 6.00 5.50TOTAL POSITIONS 10.00 10.00 10.00 9.35 9.35 8.35 7.25The General Fund's Department <strong>of</strong> Development will decrease by 1.10 positions from the <strong>2010</strong> adjusted budget levels.The Zoningand Planning Division will decrease by .60 from the <strong>2010</strong> budgeted levels. This decrease is attributable to the .10 redistribution <strong>of</strong>the Director <strong>of</strong> Development and .50 <strong>of</strong> the Deputy Director <strong>of</strong> Development positions to the Neighborhood Stabilization Fund (279).In addition, in February <strong>of</strong> <strong>2010</strong> the <strong>City</strong> hired the Deputy Director <strong>of</strong> Development. Through this addition, the Zoning and PlanningCoordinator's position was eliminated and the duties <strong>of</strong> this position are shared between the Deputy Director and the AssociatePlanner. Within the Inspections Division, .50 <strong>of</strong> the Licensed Inspector will be redistributed to the Neighborhood Stabilization Fund.Likewise, the Assistant Building Inspector and the Code Enforcement Officer will be eliminated from the complement. To <strong>of</strong>fset thedecrease in positions is the addition <strong>of</strong> one Code Enforcement Officer from the Water Operations and Maintenance Fund to theGeneral Fund.134
FUND: 101 – General FundDEPARTMENT: Department <strong>of</strong> DevelopmentACTIVITY: 3863 – Planning and ZoningSTRATEGIC NARRATIVEThe Planning and Zoning Division provides the comprehensive management structure for alldevelopment related activities. Further, it oversees all planning and zoning activities <strong>of</strong> the city,including staff support to the Planning Commission and Zoning Board <strong>of</strong> Appeals. Staff also providescustomer service functions with regard to numerous zoning inquiries, site plan review, and otherregulatory questions. The development component <strong>of</strong> this division is responsible for the oversight <strong>of</strong> theBrownfield Redevelopment Authority, Downtown Development Authority (DDA), Local DevelopmentFinance Authority (LDFA), Riverfront Development Commission, and Tax Increment FinanceAuthority (TIFA). Efforts also include the ombudsman services for developers and investors, securinggrant funding and incentives for development projects. Broader efforts include development <strong>of</strong> citydevelopment policies and coordination <strong>of</strong> all departments for development projects. The Planning andZoning division is also responsible for management and implementation <strong>of</strong> the NeighborhoodRevitalization initiative as adopted by the <strong>City</strong> Council.1. <strong>City</strong> Revenue StructureFY <strong>2010</strong>/<strong>2011</strong> GOALS AND OBJECTIVESa. Disposal <strong>of</strong> non-strategic <strong>City</strong> owned propertiesNew non-strategicproperties sold in2009-<strong>2010</strong>Target: 1002009Actual3<strong>2010</strong>Projected100% <strong>of</strong>Land Bank<strong>2011</strong>Target100% <strong>of</strong>Land Bank2. Neighborhood Revitalizationa. Implement Deconstruction ProgramNumber <strong>of</strong> homesdeconstructed infiscal year <strong>2010</strong>2009Actual<strong>2010</strong>Projected<strong>2011</strong>TargetN/A 12 20135
EXPENDITURE ANALYSIS DETAIL<strong>2010</strong>/<strong>2011</strong> APPROVED BUDGET101-3863 Zoning and PlanningAllocation PlanPosition Control<strong>2010</strong>/JOB <strong>2011</strong>PERSONNEL SERVICES CLASSIFICATION BUDGET ALLOCATIONSalariers 108,169 Director <strong>of</strong> Development 0.15 13,698Overtime 0 Asst. Dir. <strong>of</strong> Development 0.50 39,589Fringe Benefits 85,509 Associate Planner 1.00 50,729SEDC Loan Support 0.10 4,153TOTAL193,678Total Personnel 1.75 108,169OPERATING EXPENSESOvertime 0Supplies 2,800Internal Services 6,677Other Services FICA 8,400Pr<strong>of</strong>essional Fees 72,234 Healthcare Benefits - Active 19,633Maintenance Fees 3,766 Healthcare Benefits - Retirees 0Other Contracted Fees 11,500 Pension 57,476TOTAL96,977 Total Fringe Benefits 85,509CAPITAL OUTLAY 0 TOTAL 1.75 193,678TOTAL0TOTAL APPROPRIATION 290,655136
FUND: 101 – General FundDEPARTMENT: Department <strong>of</strong> DevelopmentACTIVITY: 3865 – InspectionsSTRATEGIC NARRATIVEThe function <strong>of</strong> the Inspections Division is to protect the general health, safety and welfare <strong>of</strong> the publicby administering and enforcing the <strong>City</strong>’s building, electrical, plumbing, mechanical, and other propertycodes. The division also manages the housing rehabilitation program and citywide demolitions.FY <strong>2010</strong>/<strong>2011</strong> GOALS AND OBJECTIVES1. Neighborhood Revitalization & <strong>City</strong> Beautificationa. To improve the safety <strong>of</strong> the <strong>City</strong>’s buildings through efficient and timely inspectionsPercent <strong>of</strong> total validcomplaintsresponded toIncrease <strong>of</strong> CivilInfraction ticketsissued2009Actual<strong>2010</strong>Projected<strong>2011</strong>Target57% 80% 100%603 650 700b. To improve the beautification <strong>of</strong> the <strong>City</strong> through the elimination <strong>of</strong> blight and thenecessary demolition <strong>of</strong> certain propertiesNumber <strong>of</strong>propertiesdemolished2009Actual<strong>2010</strong>Projected<strong>2011</strong>Target175 600 2752. <strong>City</strong> Revenue Structurea. To increase revenue through code enforcementRevenueTarget2009Actual<strong>2010</strong>Projected<strong>2011</strong>TargetN/A 0 $25,000137
EXPENDITURE ANALYSIS DETAIL<strong>2010</strong>/<strong>2011</strong> APPROVED BUDGET101-3865 InspectionsAllocation PlanPosition Control<strong>2010</strong>/JOB <strong>2011</strong>PERSONNEL SERVICES CLASSIFICATION BUDGET ALLOCATIONSalariers 253,890 Licensed Inspector 0.50 34,669Overtime 0 Code EnforcementFringe Benefits 242,634 Specialist 1.00 46,170Plumbing/MechanicalTOTAL496,524 Inspector 1.00 47,402Electrical Inspector 1.00 47,047Code Enforce. Inspectors 1.00 41,700OPERATING EXPENSES Office Assistant III 1.00 36,902Supplies 12,000 Total Personnel 5.50 253,890Internal Services 34,644Other ServicesPr<strong>of</strong>essional Fees 36,978 Overtime 0Maintenance Fees 320,271Other Contracted Fees 3,200FICA 19,206TOTAL407,093 Healthcare Benefits - Active 74,331Healthcare Benefits - Retirees 0Pension 149,097CAPITAL OUTLAY 0Total Fringe Benefits 242,634TOTAL0TOTAL 5.50 496,524TOTAL APPROPRIATION 903,617138
DEPARTMENT OF PUBLIC SERVICES(GENERAL FUND)
CITY OF SAGINAWDEPARTMENT OF PUBLIC SERVICES (GENERAL FUND)Thomas DarnellDirector <strong>of</strong>Public ServicesCemeteriesStreetLightingJapaneseTeahouseAbatement <strong>of</strong>NuisancesEngineeringTrafficEngineeringRecreationBuilding &GroundsMaintenance
EXPENDITURE ANALYSIS SUMMARY<strong>2010</strong>/<strong>2011</strong> APPROVED BUDGET<strong>2010</strong> <strong>2010</strong> <strong>2011</strong>2007 2008 2009 Approved Adjusted <strong>2010</strong> ApprovedActual Actual Actual <strong>Budget</strong> <strong>Budget</strong> Projected <strong>Budget</strong>1747 CEMETERIES OPERATIONSPersonnel Services 405,324 393,884 431,184 446,844 402,419 363,065 425,671Operating Expenses 201,128 268,753 245,913 197,471 193,880 184,833 183,752Capital Outlay 2,058 24,520 450 0 3,870 3,772 01790 EECBGTOTALS 608,510 687,157 677,547 644,315 600,169 551,669 609,423Personnel Services 0 0 0 0 0 0 0Operating Expenses 0 0 0 0 31,396 54,035 316,000Capital Outlay 0 0 0 0 0 0 0TOTALS 0 0 0 0 31,396 54,035 316,0004610 AD<strong>MI</strong>NISTRATIONPersonnel Services 88,132 78,627 41,569 4,156 4,086 4,105 4,356Operating Expenses 31,905 23,530 45,956 9,952 23,068 12,928 16,477Capital Outlay 0 0 0 0 0 0 0TOTALS 120,037 102,157 87,525 14,108 27,154 17,033 20,8334611 ENGINEERINGPersonnel Services 270,859 298,174 293,932 242,030 238,432 86,595 248,834Operating Expenses 141,506 155,970 157,939 129,464 142,566 262,826 134,196Capital Outlay 11,626 1,116 1,473 0 0 0 0TOTALS 423,991 455,260 453,344 371,494 380,998 349,421 383,0304620 STREET LIGHTINGPersonnel Services 57,419 74,240 71,006 43,694 42,996 86,595 41,678Operating Expenses 609,766 612,989 482,318 639,994 641,742 575,605 611,359Capital Outlay 0 0 8,340 0 0 0 0TOTALS 667,185 687,229 561,664 683,688 684,738 662,200 653,0374621 TRAFFIC ENGINEERINGPersonnel Services 26 0 0 242,740 238,604 923 0Operating Expenses (142) (2,310) 0 178,712 176,451 (989) 138,372Capital Outlay 0 0 0 0 0 0 0TOTALS (116) (2,310) 0 421,452 415,055 (66) 138,372140
EXPENDITURE ANALYSIS SUMMARY<strong>2010</strong>/<strong>2011</strong> APPROVED BUDGET<strong>2010</strong> <strong>2010</strong> <strong>2011</strong>2007 2008 2009 Approved Adjusted <strong>2010</strong> ApprovedActual Actual Actual <strong>Budget</strong> <strong>Budget</strong> Projected <strong>Budget</strong>6010 SUMMER FOODPersonnel Services 0 0 0 0 0 0 0Operating Expenses 497 0 0 0 0 0 0Capital Outlay 0 0 0 0 0 0 0TOTALS 497 0 0 0 0 0 07534 JAPANESE CULTURAL CENTERPersonnel Services 9,501 8,363 61 0 0 0 0Operating Expenses 14,951 36,717 50,430 45,118 45,118 46,503 46,223Capital Outlay 0 0 0 0 0 0 0TOTALS 24,452 45,080 50,491 45,118 45,118 46,503 46,2237550 RECREATION AD<strong>MI</strong>NISTRATIONPersonnel Services 19,878 14,709 0 0 0 0 0Operating Expenses 11,164 19,278 32,121 25,000 50,000 50,000 35,000Capital Outlay 0 0 0 0 0 0 0TOTALS 31,042 33,987 32,121 25,000 50,000 50,000 35,0007571 ABATEMENT NUISANCESPersonnel Services 36,109 25,465 6,883 54,487 54,487 9,507 49,301Operating Expenses 73,092 74,418 30,081 69,909 130,307 128,041 118,134Capital Outlay 1,828 297 0 0 0 0 0TOTALS 111,029 100,180 36,964 124,396 184,794 137,548 167,4357575 BUILDING AND GROUNDMAINTENANCEPersonnel Services 468,238 472,572 494,838 403,674 385,776 431,290 485,285Operating Expenses 512,253 697,712 663,321 433,414 471,730 440,734 497,724Capital Outlay 14,070 4,463 160 0 3,250 3,241 0TOTALS 994,561 1,174,747 1,158,319 837,088 860,756 875,265 983,009TOTAL PUBLIC SERVICESPersonnel Services 1,355,486 972,150 908,289 1,437,625 1,366,800 982,080 1,255,125Operating Expenses 1,596,120 1,887,057 1,708,079 1,729,034 1,874,862 1,700,481 2,097,237Capital Outlay 29,582 30,396 10,423 0 7,120 7,013 0TOTAL EXPENDITURES 2,981,188 2,889,603 2,626,791 3,166,659 3,248,782 2,689,573 3,352,362141
POSITION ANALYSIS<strong>2010</strong>/<strong>2011</strong> APPROVED BUDGET<strong>2010</strong> <strong>2010</strong> <strong>2011</strong>2007 2008 2009 Approved Adjusted <strong>2010</strong> ApprovedActual Actual Actual <strong>Budget</strong> <strong>Budget</strong> Projected <strong>Budget</strong>PUBLIC SERVICE (GENERAL FUND)Cemeteries 4.50 5.00 5.00 5.00 5.00 5.00 5.00Public Service - Administration 0.80 0.80 0.05 0.05 0.05 0.05 0.05Engineering 3.95 3.40 2.75 2.75 2.75 2.75 2.75Street Lighting 0.50 0.50 0.50 0.50 0.50 0.50 0.50Traffic Engineering 3.45 3.45 2.90 2.90 2.90 2.90 0.00Japanese Cultural Center 1.00 1.00 0.00 0.00 0.00 0.00 0.00Recreation 19.00 13.00 0.00 0.00 0.00 0.00 0.00Abatement <strong>of</strong> Nuisances 0.00 0.20 2.00 2.00 2.00 2.00 2.00Building and Grounds Maint. 13.00 10.60 9.40 9.40 9.40 9.40 9.70TOTAL POSITIONS 46.20 37.95 22.60 22.60 22.60 22.60 20.00The <strong>2010</strong>/<strong>2011</strong> Approved <strong>Budget</strong> will decrease by a total <strong>of</strong> 2.60 positions. This decrease is due to the redistribution <strong>of</strong> the TrafficEngineering division's employees from the General Fund to Major and Local Street Funds. In addition, in the Cemeteries Division, theCemeteries Supervisor will be reclassified to the Cemeteries Foreman. This position will report directly to the Building OperationsSupervisor. In the Building and Grounds Maintenance the allocation for both the Building Operations Supervisor and the LaborForeman for Streets/Building Operations will increase by .15 each.142
FUND: 101 – General FundDEPARTMENT: Public ServicesACTIVITY: 1747 – CemeteriesSTRATEGIC NARRATIVEThe Cemeteries Division is responsible for providing burial and maintenance services for <strong>Saginaw</strong>’sthree municipally owned cemeteries: Forest Lawn, Oakwood, and Brady Hill. In addition, accurate andcomplete records <strong>of</strong> those burials are kept. The <strong>City</strong> has approximately 260 acres <strong>of</strong> grounds to maintainand 450 to 500 graves to be filled, graded, and seeded annually.FY <strong>2010</strong>/<strong>2011</strong> GOALS AND OBJECTIVES1. To improve the communications and accessibility <strong>of</strong> information/records for all city cemeteriesthrough the Internet.a. Make all records available on the Internet through the <strong>City</strong>’s relationship with the<strong>Saginaw</strong> Public Library who is currently entering old records. New burial records will beinput as they happen.2009Actual<strong>2010</strong>Projected<strong>2011</strong>TargetPercent <strong>of</strong>Records Online 100% 100% 100%2. To maintain grounds and lawn care services at all three cemeteries.a. Increase the grass cutting cycle.2009Actual<strong>2010</strong>Projected<strong>2011</strong>TargetDays neededto cut all grass 10 days 12 days 12 daysNote: The grass cutting cycle has been increased to 12 days to decrease temporary agency fees.143
EXPENDITURE ANALYSIS DETAIL<strong>2010</strong>/<strong>2011</strong> APPROVED BUDGET101-1747 Cemeteries OperationsAllocation PlanPosition Control<strong>2010</strong>/JOB <strong>2011</strong>PERSONNEL SERVICES CLASSIFICATION BUDGET ALLOCATIONSalaries 215,268 Cemeteries Foreman 1.00 45,738Overtime 13,000 Admin. Pr<strong>of</strong>essional 1.00 42,170Fringe Benefits 197,403 Maintenance Person III 1.00 43,103Maintenance Person II 2.00 84,257TOTAL425,671Total Personnel 5.00 215,268OPERATING EXPENSESOvertime 13,000Supplies 42,950Internal Services 11,182Other Services FICA 17,654Pr<strong>of</strong>essional Fees 82,652 Healthcare Benefits - Active 71,578Maintenance Fees 46,968 Healthcare Benefits - Retirees 0Other Contracted Fees 0 Pension 108,171TOTAL183,752 Total Fringe Benefits 197,403CAPITAL OUTLAY 0 TOTAL 5.00 425,671TOTAL0TOTAL APPROPRIATION 609,423144
EXPENDITURE ANALYSIS DETAIL<strong>2010</strong>/<strong>2011</strong> APPROVED BUDGET101-4610 Public Services AdministrationAllocation PlanPosition Control<strong>2010</strong>/JOB <strong>2011</strong>PERSONNEL SERVICES CLASSIFICATION BUDGET ALLOCATIONSalaries 2,399 Staff Pr<strong>of</strong>essional 0.05 2,399Overtime 0Fringe Benefits 1,957 Total Personnel 0.05 2,399TOTAL4,356Overtime 0OPERATING EXPENSESFICA 184Supplies 600 Healthcare Benefits - Active 706Internal Services 5,349 Healthcare Benefits - Retirees 0Other Services Pension 1,067Pr<strong>of</strong>essional Fees 9,467Maintenance Fees 1,061 Total Fringe Benefits 1,957Other Contracted Fees 0TOTAL16,477 TOTAL 0.05 4,356CAPITAL OUTLAY 0TOTAL0TOTAL APPROPRIATION 20,833145
FUNDS: 101-General Fund, 202-Major Streets, 203-Local StreetsDEPARTMENT: Public ServicesACTIVITIES: 4611-Engineering, 4612-Engineering Administration, 4613-Street Resurfacing,4614-Street Construction, 4616-Bridge ProjectsSTRATEGIC NARRATIVEThe mission <strong>of</strong> the Engineering Division <strong>of</strong> the Public Services Department is to provide engineeringservices that result in quality public works projects and programs for the community in order to protectthe environment and provide citizens with safe and efficient transportation. This division providesmulti-disciplinary engineering and full contract administration duties to the <strong>City</strong> as it relates to bridgeconstruction and maintenance; roadway reconstruction, resurfacing and streetscaping; and utilityupgrades for water and sewer mains and services. The Engineering Division provides pedestrians andthe motoring public with a safe and efficient transportation system and ensure all public service capitalimprovement projects are designed and constructed in accordance with <strong>City</strong>, Michigan Department <strong>of</strong>Transportation (MDOT) and American Association <strong>of</strong> State Highway and Transportation Officials(AASHTO) specifications, on time and within budget. The division also strives to provide a high level<strong>of</strong> customer service to the citizens <strong>of</strong> <strong>Saginaw</strong> as it relates to permits required and timeliness inobtaining. The Engineering Division also serves as an engineering consultant to other <strong>City</strong> departments,and provides review and approval <strong>of</strong> site plan development as it relates to grading, street, sewer, watermain, storm drain, streetlight and landscape plans.FY <strong>2010</strong>/<strong>2011</strong> GOALS AND OBJECTIVES1. Maintain a system to evaluate, monitor, plan and coordinate the reconstruction and resurfacing<strong>of</strong> over 300 miles <strong>of</strong> urban roadway to ensure continuity <strong>of</strong> service, safety, and the transportationneeds <strong>of</strong> pedestrians and the motoring public. These costs include any and all funding associatedwith the project, including Federal Surface Transportation Program (STP), Federal Earmarks,Federal Safety Hazard Elimination (STH), Federal Enhancement (TE), American Recovery andReinvestment Act (ARUL), State Jobs today, <strong>City</strong> Water and Sewer, Act 51, CommunityDevelopment Block Grant (CDBG and CDBG-R) funds, etc.a. Number <strong>of</strong> dollars allocated towards projects for roads requiring reconstruction orresurfacing.Dollars spent requiringreconstruction orresurfacing (millions)2009Actual<strong>2010</strong>Projected<strong>2011</strong>Target$3 million $8 million $8 millionb. Percent <strong>of</strong> major streets with a Pavement Surface Evaluation and Rating (PASER) <strong>of</strong> 4 orless.98.5 Major Streetmiles totalPercent <strong>of</strong> majorstreets with a PASER<strong>of</strong> 4 or less2009Actual<strong>2010</strong>Projected<strong>2011</strong>Target52% 50% 45%146
c. Less than 1% or 1 mile <strong>of</strong> major streets with a PASER <strong>of</strong> 4 or less that have beenreconstructed or resurfaced within a timely manner.Number <strong>of</strong> majorstreets with a PASER<strong>of</strong> 4 or less that havebeen reconstructed orresurfaced2009Actual1 mile (twolane miles)<strong>2010</strong>Projected1 mile (fivelane miles)<strong>2011</strong>Target3.8 miles(sixteen lanemiles)2. Maintain and improve, as needed existing vehicular and pedestrian bridges to ensure structuresmeet minimum guidelines and recommendations by MDOT for safety and performance.a. Bridges (including vehicular and pedestrian bridges) are to be inspected on a bi-annualbasis. There are seven vehicular and five pedestrian bridges that require bi-annual bridgeinspections.Percent <strong>of</strong> bridgesinspected (pedestrianand vehicular)2009Actual<strong>2010</strong>Projected<strong>2011</strong>Target100% 100% 100%b. Bridges with a rating below 70.Percent <strong>of</strong> bridgeswith a rating 70(vehicular)2009Actual<strong>2010</strong>Projected<strong>2011</strong>Target85% 85% 100%147
3. Provide a high level <strong>of</strong> customer service expected by citizens, contractors or business owners.a. Permits issued in a timely manner.2009Actual<strong>2010</strong>Projected<strong>2011</strong>TargetLength <strong>of</strong> time forissuance <strong>of</strong> permits < 1 week 2 weeks 2 weeksb. Average time for processing citizens’ requests.2009Actual<strong>2010</strong>Projected<strong>2011</strong>TargetProcessing timefor requests < 2 days 3 days 3 days148
EXPENDITURE ANALYSIS DETAIL<strong>2010</strong>/<strong>2011</strong> APPROVED BUDGET101-4611 EngineeringAllocation PlanPosition Control<strong>2010</strong>/JOB <strong>2011</strong>PERSONNEL SERVICES CLASSIFICATION BUDGET ALLOCATIONSalaries 129,596 Engin.Office Supervisor 0.25 15,166Overtime 7,000 Engineering Tech. I 1.00 47,002Fringe Benefits 112,238 Engineering Assistant 0.50 23,042Survey Technician I 0.50 23,708TOTAL248,834 Survey Assistant III 0.50 20,677OPERATING EXPENSESTotal Personnel 2.75 129,596Supplies 13,200 Overtime 7,000Internal Services 96,017Other ServicesPr<strong>of</strong>essional Fees 9,300 FICA 10,355Maintenance Fees 12,829 Healthcare Benefits - Active 40,679Other Contracted Fees 2,850 Healthcare Benefits - Retirees 0Pension 61,204TOTAL134,196Total Fringe Benefits 112,238CAPITAL OUTLAY 0TOTAL0TOTAL 2.75 248,834TOTAL APPROPRIATION 383,030149
FUNDS: 101-General Fund, 202-Major Streets, 203-Local Streets, 660-Radio OperationsDEPARTMENT: Public ServicesACTIVITIES: 4620-Street Lighting, 4621-Traffic Engineering, 4690-State Trunkline, 4422-RadioOperationSTRATEGIC NARRATIVEThe mission <strong>of</strong> the Traffic Engineering and Traffic Maintenance Division <strong>of</strong> the Public Services Department is topromote the safe and efficient movement <strong>of</strong> vehicles, pedestrians, and goods through long-range planning,development review, infrastructure design and maintenance, capital improvement programs, and traffic controlsystems. This division provides multi-disciplinary engineering and full contract administration duties to the city asit relates to traffic signal design and maintenance. Services include planning and design <strong>of</strong> traffic signs andsignals, traffic studies, transportation modeling and planning, development reviews, and response to citizen’srequests. Continued installation and replacement <strong>of</strong> over 7,000 Streetlights, upgrading and continuing to meetFederal requirements for sign retro reflectivity for over 30,000 signs, and annual maintenance <strong>of</strong> over 105 trafficsignals. Traffic Maintenance also oversees the <strong>City</strong> <strong>of</strong> <strong>Saginaw</strong>’s Emergency Siren system and the Public Serviceand Public Safety radio system, with over 400 mobile and handheld radios. Staff works in conjunction withregional agencies and assists with grant application efforts, capital improvement projects, and in preparation <strong>of</strong>various ordinances and resolutions. Traffic Maintenance provides all barricading for all <strong>City</strong> divisions required towork within the right-<strong>of</strong>-way or streets for the Michigan Department <strong>of</strong> Transportation (MDOT) and <strong>City</strong> MajorStreets; Traffic Engineering also provides all barricading for special events and parades. Traffic maintenancemaintains all pavement markings at the 105 signalized intersections and other major street intersections as needed.This division continues to provide barricading to outside contractors and utility companies as requested, and astiming may allow. Traffic Maintenance has invoiced for over $60,000 worth <strong>of</strong> barricading services to outsidevendors in fiscal year 2009.FY <strong>2010</strong>/<strong>2011</strong> GOALS AND OBJECTIVES1. Continue to monitor existing traffic patterns and volumes and upgrade and maintain existing traffic signals tocontrol flow and relieve congestion. Provide safe and efficient movement and progression for motoringpublic thru the <strong>City</strong>’s signal system. Continue to provide daily and annual maintenance and replacement <strong>of</strong><strong>City</strong> <strong>of</strong> <strong>Saginaw</strong>’s streetlight, emergency siren, public service and public safety radio, street signs and trafficsignal systems.a. Average time from initial request to the start <strong>of</strong> a traffic and safety study. (Seasonal Limitationsexist)2009Actual<strong>2010</strong>Projected<strong>2011</strong>TargetTime from initial tostart <strong>of</strong> traffic study 3 weeks 3 – 4 weeks 3 – 4 weeksb. Develop and maintain an intelligent transportation system (ITS) to include optimizing traffic signalsystem timing through use <strong>of</strong> s<strong>of</strong>tware programs such as Simtraffic and Corsim.Number <strong>of</strong> signalsadded to the <strong>City</strong>’sMARC master system2009Actual<strong>2010</strong>Projected<strong>2011</strong>Target5 6 3150
c. Percent <strong>of</strong> studies for traffic regulation changes completed within eight weeks <strong>of</strong> initial request. Onaverage the <strong>City</strong> receives over fifty traffic study requests annually. Requests requiring traffic countsor speed studies are affected at which time <strong>of</strong> year the request comes in. Traffic road counts andspeed studies required cannot be obtained in the winter and need to be completed in the spring thrufall. Regulation changes also need to go to the Transportation Committee and ultimately <strong>City</strong> councilfor approval. This process happens every 6 to 9 months.Traffic regulationchanges completedwithin eight weeks <strong>of</strong>request2009Actual<strong>2010</strong>Projected<strong>2011</strong>Target80% 90% 90%d. Apply for Federal and State Grants to be used towards signal improvement/upgrade projects. <strong>City</strong>recently received approval for over $876,000 <strong>of</strong> Federal Surface Transportation Program (STP) –Safety Hazard Elimination (STH) funds for traffic signal and road upgrades at three locations withinthe <strong>City</strong>.e. Light bulbs to be replaced at every signal per year2009Actual<strong>2010</strong>Projected<strong>2011</strong>TargetLight bulbs replaced 100% 100% 100%f. Sight obstruction complaints responded to within one week <strong>of</strong> request.Response to sightobstruction complaintswithin one week <strong>of</strong>request2009Actual<strong>2010</strong>Projected<strong>2011</strong>Target100% 100% 100%2. Design, install, and maintain traffic signals and pavement markings to ensure proper visibility and increasesafety to vehicles and pedestrians.a. Requests for sign repairs for intersection controls, and regulatory signs that could have hazardousconsequences responded to on same day <strong>of</strong> notification.2009Actual<strong>2010</strong>Projected<strong>2011</strong>TargetSame day notificationfor sign repairs 100% 100% 100%151
. Requests for sign repairs for non-intersection controls or guide signs that should not have hazardousconsequences responded to within one day <strong>of</strong> notification.Response for signrepairs within 3 days<strong>of</strong> notification2009Actual<strong>2010</strong>Projected<strong>2011</strong>Target100% 100% 100%3. Replace over 2,000 street light bulbs annually. One thousand are planned maintenance, the remaining are dueto complaints or bulbs not planned to be replaced.a. Request for street light repairs responded to within three days <strong>of</strong> notification.Response for streetlight repairs within 3days <strong>of</strong> notification2009Actualb. Annual replacement installed per maintenance schedule.<strong>2010</strong>Projected<strong>2011</strong>Target100% 100% 100%2009Actual<strong>2010</strong>Projected<strong>2011</strong>TargetInstallationsannually replaced 100% 100% 100%4. Radio operations section is responsible for administering the city’s public service and public safety two-wayradio communications system. Proper installation and maintenance <strong>of</strong> approximately 400 fixed and mobileradio devices ensures a reliable communication system.a. Requests for repairs or replacements <strong>of</strong> radios responded to within two days <strong>of</strong> notification.2009Actual<strong>2010</strong>Projected<strong>2011</strong>TargetRepairs orreplacements <strong>of</strong> radios 100% 100% 100%5. To provide high level <strong>of</strong> customer service expected by citizens in addressing traffic requests, including butnot limited to intersection control, parking regulations, speed studies, barricading, etc.a. Average time for addressing citizens’ requests.2009Actual<strong>2010</strong>Projected<strong>2011</strong>TargetTime for processingrequests less than 3 days 1 week 1 week6. Upgrade remaining <strong>City</strong> <strong>of</strong> <strong>Saginaw</strong>’s 43 signalized intersections to Light Emitting Diode (LED) signals.Sixty-two <strong>of</strong> the existing 105 signals have been upgraded to date. This is an attempt to reduce maintenancecosts and electrical usage costs. LED’s are estimated to last up to 7 years, as the current incandescent bulbshave to be replaced every year. LED’s studies have shown that this technology should use around 1/3 to ½the energy <strong>of</strong> existing incandescent systems.152
a. Continue to apply for grant funding or energy funds to pay for updated signals to LED efficient.b. Have all traffic and pedestrian signals and illuminated case signs upgraded to LED by 2015a.Number <strong>of</strong>signals upgraded(total)2009Actual<strong>2010</strong>Projected<strong>2011</strong>Target62 70 77153
EXPENDITURE ANALYSIS DETAIL<strong>2010</strong>/<strong>2011</strong> APPROVED BUDGET101-4620 Street LightingAllocation PlanPosition Control<strong>2010</strong>/JOB <strong>2011</strong>PERSONNEL SERVICES CLASSIFICATION BUDGET ALLOCATIONSalaries 24,790 Traffic Electrician I 0.50 24,790Overtime 1,500Fringe Benefits 15,388 Total Personnel 0.50 24,790TOTAL41,678Overtime 1,500OPERATING EXPENSESFICA 2,107Supplies 31,750 Healthcare Benefits - Active 2,783Internal Services 2,809 Healthcare Benefits - Retirees 0Other Services Pension 10,498Pr<strong>of</strong>essional Fees 6,500Maintenance Fees 570,000 Total Fringe Benefits 15,388Other Contracted Fees 300TOTAL611,359 TOTAL 0.50 41,678CAPITAL OUTLAY 0TOTAL0TOTAL APPROPRIATION 653,037154
EXPENDITURE ANALYSIS DETAIL<strong>2010</strong>/<strong>2011</strong> APPROVED BUDGET101-4621 Traffic EngineeringAllocation PlanPosition Control<strong>2010</strong>/JOB <strong>2011</strong>PERSONNEL SERVICES CLASSIFICATION BUDGET ALLOCATIONSalaries 0Overtime 0 Total Personnel 0.00 0Fringe Benefits 0TOTAL0 Overtime 0OPERATING EXPENSES FICA 0Healthcare Benefits - Active 0Supplies 0 Healthcare Benefits - Retirees 0Internal Services 3,828 Pension 0Other ServicesPr<strong>of</strong>essional Fees 4,544 Total Fringe Benefits 0Maintenance Fees 130,000Other Contracted Fees 0TOTAL 0.00 0.00TOTAL138,372CAPITAL OUTLAY 0TOTAL0TOTAL APPROPRIATION 138,372155
FUND: 101 – General FundDEPARTMENT: Public ServicesACTIVITY: 7534 – Japanese Cultural CenterSTRATEGIC NARRATIVEThe Japanese Cultural Center, comprised <strong>of</strong> the Tea House and Garden, was established as a symbol <strong>of</strong>friendship and cultural exchange with <strong>Saginaw</strong>’s Sister <strong>City</strong> Tokushima, Japan. These facilities are theresult <strong>of</strong> a unique partnership. The citizens <strong>of</strong> both Tokushima and <strong>Saginaw</strong>, led by the <strong>Saginaw</strong> chapter<strong>of</strong> People to People, shared in the cost <strong>of</strong> constructing the Tea House, built on land jointly owned byboth cities.The Tea House is <strong>of</strong> authentic design and crafted in keeping with traditional Japanese architecture. TeaHouses provide a ceremonial setting for the Tea Ceremony (Cha-no-yu), promoting the concept <strong>of</strong>global and international harmony, respect, purity and tranquility, expressing “Peace through a bowl <strong>of</strong>tea.”The Tea House Board has achieved status as a nonpr<strong>of</strong>it organization, allowing it to conduct fundraisingoperations in addition to their normal work <strong>of</strong> overseeing the Tea House operations. In the future, anordinance change that would combine the Tea House Board with the board <strong>of</strong> the nonpr<strong>of</strong>it agency isanticipated. Operational efficiency and cost containment will also be a priority; along with an effort toreduce staff costs by enlisting additional qualified volunteers.156
EXPENDITURE ANALYSIS DETAIL<strong>2010</strong>/<strong>2011</strong> APPROVED BUDGET101-7534 Japanese Tea HouseAllocation PlanPosition Control<strong>2010</strong>/JOB <strong>2011</strong>PERSONNEL SERVICES CLASSIFICATION BUDGET ALLOCATIONSalaries 0Overtime 0 Total Personnel 0.00 0Fringe Benefits 0TOTAL0 Overtime 0OPERATING EXPENSESFICAHealthcare Benefits - Active 0Supplies 0 Healthcare Benefits - Retirees 0Internal Services 0 Pension 0Other ServicesPr<strong>of</strong>essional Fees 46,223 Total Fringe Benefits 0Maintenance Fees 0Other Contracted Fees 0TOTAL 0.00 0TOTAL46,223CAPITAL OUTLAY 0TOTAL0TOTAL APPROPRIATION 46,223157
EXPENDITURE ANALYSIS DETAIL<strong>2010</strong>/<strong>2011</strong> APPROVED BUDGET101-7550 RecreationAllocation PlanPosition Control<strong>2010</strong>/JOB <strong>2011</strong>PERSONNEL SERVICES CLASSIFICATION BUDGET ALLOCATIONSalaries 0Overtime 0 Total Personnel 0.00 0Fringe Benefits 0TOTAL0 Overtime 0OPERATING EXPENSES FICA 0Healthcare Benefits - Active 0Supplies 0 Healthcare Benefits - Retirees 0Internal Services 0 PensionOther ServicesPr<strong>of</strong>essional Fees 35,000 Total Fringe Benefits 0Maintenance Fees 0Other Contracted Fees 0TOTAL 0.00 0TOTAL35,000CAPITAL OUTLAY 0TOTAL0TOTAL APPROPRIATION 35,000158
FUND: 101 – General FundDEPARTMENT: Public ServicesACTIVITY: 7571 – Abatement <strong>of</strong> NuisancesSTRATEGIC_NARRATIVEThe Abatement <strong>of</strong> Nuisances program helps to insure public health and safety through the enforcement <strong>of</strong><strong>City</strong> Ordinances and Regulations related to noxious weeds. This enforcement includes inspections, thecutting <strong>of</strong> weeds and billing <strong>of</strong> costs to appropriate property owners when compliance is not forthcoming.FY <strong>2010</strong>/<strong>2011</strong> GOALS AND OBJECTIVES1. Continue to contribute to the health, safety, and welfare <strong>of</strong> community residents and neighborhoods<strong>of</strong> <strong>Saginaw</strong> through the enforcement <strong>of</strong> ordinances relative to the <strong>Saginaw</strong> General Code, Chapter 95,Section 95.02, Noxious Weeds and Section 95.03, Abatement <strong>of</strong> Nuisances.159
EXPENDITURE ANALYSIS DETAIL<strong>2010</strong>/<strong>2011</strong> APPROVED BUDGET101-7571 Abatement and NuisanceAllocation PlanPosition Control<strong>2010</strong>/JOB <strong>2011</strong>PERSONNEL SERVICES CLASSIFICATION BUDGET ALLOCATIONSalaries 22,032 Groundskeepers 2.00 22,032Overtime 500Fringe Benefits 26,769 Total Personnel 2.00 22,032TOTAL49,301Overtime 500OPERATING EXPENSES FICA 1,647Healthcare Benefits - Active 24,021Supplies 2,450 Healthcare Benefits - Retirees 0Internal Services 3,740 Pension 1,101Other ServicesPr<strong>of</strong>essional Fees 91,020 Total Fringe Benefits 26,769Maintenance Fees 20,924Other Contracted Fees 0TOTAL 2.00 49,301TOTAL118,134CAPITAL OUTLAY 0TOTAL0TOTAL APPROPRIATION 167,435160
FUND: 101 – General FundDEPARTMENT: Public ServicesACTIVITY: 7575 – Building and Grounds MaintenanceSTRATEGIC_NARRATIVEThe Building and Ground Maintenance division provides for the operation, maintenance and improvements<strong>of</strong> structures, parking areas, roads and public buildings found in the parks system including <strong>City</strong> Hall, theJapanese Tea House, Andersen Enrichment Center, Green Point Nature Center, Ojibway Island, OjibwayIsland floating dock facility and Westside Riverfront Park Broadside floating dock facility. Additionally, thisdivision supports the activities <strong>of</strong> Special Events, Parks, and Land Management.FY <strong>2010</strong>/<strong>2011</strong> GOALS AND OBJECTIVES1. Continue to maintain <strong>City</strong> properties (including 300 plus acres <strong>of</strong> park land).2. Continue to maintain buildings, playground equipment and facilities along the Riverfront, includingfloating docks and park pavilions.161
EXPENDITURE ANALYSIS DETAIL<strong>2010</strong>/<strong>2011</strong> APPROVED BUDGET101-7575 Building and Ground MaintenanceAllocation PlanPosition Control<strong>2010</strong>/JOB <strong>2011</strong>PERSONNEL SERVICES CLASSIFICATION BUDGET ALLOCATIONSalaries 234,211 Building Operations Supervisor 0.50 34,866Overtime 9,000 Labor Foreman Streets/Fringe Benefits 242,074 Building Operations 0.50 23,891Maintenance Person II 2.00 84,991TOTAL485,285 Mtce Groundskeeper 1.00 19,968Custodial Worker 1.00 18,720Groundskeeper/Mechanic (S) 1.00 11,016OPERATING EXPENSES Groundskeeper (S) 3.70 40,759Supplies 67,750 Total Personnel 9.70 234,211Internal Services 112,789Other ServicesPr<strong>of</strong>essional Fees 111,847 Overtime 9,000Maintenance Fees 205,238Other Contracted Fees 100FICA 18,797TOTAL497,724 Healthcare Benefits - Active 124,132Healthcare Benefits - Retirees 0Pension 99,145CAPITAL OUTLAY 0Total Fringe Benefits 242,074TOTAL0TOTAL APPROPRIATION 983,009TOTAL 9.70 485,285162
OTHER GENERAL FUND
OTHER GENERAL FUND EXPENSESEXPENDITURE ANALYSIS SUMMARY<strong>2010</strong>/<strong>2011</strong> APPROVED BUDGET<strong>2010</strong> <strong>2010</strong> <strong>2011</strong>2007 2008 2009 Approved Adjusted <strong>2010</strong> ApprovedActual Actual Actual <strong>Budget</strong> <strong>Budget</strong> Projected <strong>Budget</strong>OTHER GENERAL EXPENSES8510 HEALTH INSURANCERetirement Healthcare 1,532,756 1,660,057 1,683,782 2,107,695 2,052,669 1,954,791 2,199,105TOTALS 1,532,756 1,660,057 1,683,782 2,107,695 2,052,669 1,954,791 2,199,1058520 UNEMPLOYMENT COMPENSATIONUnemployment Compensation 0 28,417 68,570 125,000 125,000 40,775 73,000TOTALS 0 28,417 68,570 125,000 125,000 40,775 73,0008525 SAGINAW HOUSING COM<strong>MI</strong>SSIONHousing Commission 0 0 142,387 148,101 203,127 201,204 158,463TOTALS 0 0 142,387 148,101 203,127 201,204 158,4638540 CONTRIBUTION TO OTHER ORGANIZATIONSContributions 1,000 1,000 1,000 1,000 1,000 1,000 1,000TOTALS 1,000 1,000 1,000 1,000 1,000 1,000 1,0008547 GIS CHARGESGIS Charges 34,236 36,256 63,320 66,281 66,281 66,276 51,782TOTALS 34,236 36,256 63,320 66,281 66,281 66,276 51,7828555 DEBT SERVICESDebt Service (Principal) 153,709 153,710 0 0 0 0 0Debt Service (Interest) 4,708 4,708 0 0 0 0 0TOTALS 158,418 158,418 0 0 0 0 09960 TRANSFERS OUTTransfers Out 2,723,953 4,608,069 1,171,609 505,042 811,378 811,408 1,319,127TOTALS 2,723,953 4,608,069 1,171,609 505,042 811,378 811,408 1,319,127TOTAL OTHER GENERAL EXPENSESOther General Expenses 4,450,363 6,492,217 3,130,668 2,953,119 3,259,455 3,075,453 3,802,477TOTALEXPENDITURES4,450,363 6,492,217 3,130,668 2,953,119 3,259,455 3,075,453 3,802,477163
STREETS (SRF)MAJOR STREETSANDLOCAL STREETS
MAJOR STREETS FUND (202)RESOURCE ALLOCATION<strong>2010</strong>/<strong>2011</strong> APPROVED BUDGETRESOURCESAPPROPRIATIONSSTATE REVENUE 3,541,941 ENGINEERING AD<strong>MI</strong>N. 306,321STATE REIMBURSEMENTS 509,000 STREET PROJECTS 591,147FEDERAL GRANT 0 BRIDGE PROJECTS 195,000SERVICES - SALES 21,000 TRAFFIC ENGINEERING 863,795INTEREST AND RENTS 0 STREET AD<strong>MI</strong>NISTRATION 825,424OTHER REVENUES 668,481 ROUTINE MAINTENANCE 1,244,462TRANSFERS IN 0 BRIDGE MAINTENANCE 140,435WINTER MAINTENANCE 244,369STATE TRUNKLINE 88,339STATE ROUTINE MAINT. 106,231STATE WINTER MAINT. 109,449TRANSFERS OUT 25,450TOTAL RESOURCES 4,740,422 TOTAL APPROPRIATIONS 4,740,422164
REVENUE ANALYSIS SUMMARY<strong>2010</strong>/<strong>2011</strong> APPROVED BUDGET<strong>2010</strong> <strong>2010</strong> <strong>2011</strong>2007 2008 2009 Approved Adjusted <strong>2010</strong> ApprovedActual Actual Actual <strong>Budget</strong> <strong>Budget</strong> Projected <strong>Budget</strong>State Revenue 3,700,642 3,641,977 3,512,455 3,650,000 3,650,000 2,884,490 3,541,941State Reimbursements 443,761 588,471 563,587 495,000 495,000 528,640 509,000Federal Grants 64,815 0 724,138 0 0 0 0Services - Sales 15,256 30,054 42,750 20,000 20,000 32,435 21,000Interest and Rents 4,128 22,132 1,226 0 0 104 0Other Revenues 22,939 16,653 80,199 73,740 122,593 632,997 668,481Transfers from Other Funds 0 100,384 2,808 0 0 0 0TOTAL RESOURCES 4,251,541 4,399,671 4,927,163 4,238,740 4,287,593 4,078,666 4,740,422REVENUE ANALYSIS DETAILGas & Weight Tax 3,699,099 3,641,906 3,512,455 3,650,000 3,650,000 2,884,490 3,541,941State Grants 1,543 71 0 0 0 0Total State Revenue Sharing 3,700,642 3,641,977 3,512,455 3,650,000 3,650,000 2,884,490 3,541,941Trunkline Maintenance 226,388 367,773 341,600 280,000 280,000 0 294,000MDOT Projects 0 0 0 0 0 0 0Right <strong>of</strong> Way Revenue 217,373 220,698 221,987 215,000 215,000 528,640 215,000Total State Reimbursements 443,761 588,471 563,587 495,000 495,000 528,640 509,000Construction Projects 64,815 0 724,138 0 0 0 0Total Federal Grants 64,815 0 724,138 0 0 0 0Telecommunications Fee 0 0 0 0 0 0 0Sale <strong>of</strong> Junk 1,876 10,190 2,115 0 0 8,643 1,000Materials and Services 13,380 19,864 40,635 20,000 20,000 23,792 20,000Total Services - Sales 15,256 30,054 42,750 20,000 20,000 32,435 21,000Interest on Investments 4,128 22,132 1,226 0 0 104 0Total Interest and Rents 4,128 22,132 1,226 0 0 104 0<strong>Saginaw</strong> County 6,718 0 0 0 0 0 0Surplus Receipts 4,571 8 0 0 0 0 0Reimbursements 11,650 16,645 80,199 0 0 48,020 86,000Use <strong>of</strong> Fund Equity 0 0 0 73,740 122,593 584,977 582,481Total Other Revenues 22,939 16,653 80,199 73,740 122,593 632,997 668,481Transfer In 0 100,384 2,808 0 0 0 0Transfers from Other Funds 0 100,384 2,808 0 0 0 0TOTAL RESOURCES 4,251,541 4,399,671 4,927,163 4,238,740 4,287,593 4,078,666 4,740,422165
EXPENDITURE ANALYSIS SUMMARY<strong>2010</strong>/<strong>2011</strong> APPROVED BUDGET<strong>2010</strong> <strong>2010</strong> <strong>2011</strong>2007 2008 2009 Approved Adjusted <strong>2010</strong> ApprovedActual Actual Actual <strong>Budget</strong> <strong>Budget</strong> Projected <strong>Budget</strong>4612 ENGINEERING AD<strong>MI</strong>NISTRATIONPersonnel Services 160,037 159,211 135,389 218,238 218,238 199,759 283,643Operating Expenses 13,119 43,801 43,445 43,966 43,966 46,362 22,678Capital Outlay 5,939 1,443 0 0 0 0 0TOTALS 179,095 204,455 178,834 262,204 262,204 246,120 306,3214614 STREETS PROJECTPersonnel Services 0 334 8,573 21,530 21,530 17,473 16,147Operating Expenses 111,660 101,548 269,142 470,000 470,727 396,364 575,000Capital Outlay 0 0 0 0 0 0 0TOTALS 111,660 101,882 277,715 491,530 492,257 413,837 591,1474616 BRIDGE PROJECTSPersonnel Services 0 0 0 0 0 0 0Operating Expenses 6,762 50,715 54,469 120,000 152,216 83,627 195,000Capital Outlay 0 0 0 0 0 0 0TOTALS 6,762 50,715 54,469 120,000 152,216 83,627 195,0004621 TRAFFIC ENGINEERINGPersonnel Services 475,294 509,370 495,044 363,770 363,770 500,123 584,368Operating Expenses 468,623 350,283 527,489 268,116 268,116 355,267 279,427Capital Outlay 36,174 0 27,977 0 0 0 0TOTALS 980,091 859,653 1,050,510 631,886 631,886 855,390 863,7954650 STREET AD<strong>MI</strong>NISTRATIONPersonnel Services 50,292 484,584 380,736 436,158 436,158 483,297 552,835Operating Expenses 117,957 196,677 223,745 259,195 273,045 257,860 272,589Capital Outlay 0 0 0 0 0 0 0TOTALS 168,249 681,261 604,481 695,353 709,203 741,158 825,4244651 ROUTINE MAINTENANCEPersonnel Services 767,789 530,035 358,747 371,245 371,245 252,481 597,557Operating Expenses 784,859 1,124,827 646,942 647,148 647,638 522,389 641,757Debt Service 0 12,355 0 12,336 6,219 0 5,086Capital Outlay 100,877 0 0 0 0 0 0Miscellaneous 0 0 0 0 1,117 0 62TOTALS 1,653,525 1,667,217 1,005,689 1,030,729 1,026,219 774,869 1,244,462166
EXPENDITURE ANALYSIS SUMMARY<strong>2010</strong>/<strong>2011</strong> APPROVED BUDGET<strong>2010</strong> <strong>2010</strong> <strong>2011</strong>2007 2008 2009 Approved Adjusted <strong>2010</strong> ApprovedActual Actual Actual <strong>Budget</strong> <strong>Budget</strong> Projected <strong>Budget</strong>4654 BRIDGE MAINTENANCEPersonnel Services 14,651 16,384 5,793 40,640 40,640 21,842 40,457Operating Expenses 138,386 82,012 153,964 107,948 110,458 106,639 99,978Capital Outlay 0 0 0 0 0 0 0TOTALS 153,037 98,396 159,757 148,588 151,098 128,481 140,4354655 WINTER MAINTENANCEPersonnel Services 332,396 164,809 109,067 88,935 88,935 104,209 92,935Operating Expenses 149,960 138,893 124,646 200,616 200,616 191,922 151,434Capital Outlay 0 0 0 0 0 0 0TOTALS 482,356 303,702 233,713 289,551 289,551 296,130 244,3694690 STATE TRUNKLINEPersonnel Services 61,189 62,460 53,235 76,366 76,366 46,400 38,842Operating Expenses 33,477 28,521 21,774 53,082 53,082 23,777 49,497Capital Outlay 0 0 0 0 0 0 0TOTALS 94,666 90,981 75,009 129,448 129,448 70,177 88,3394691 STATE ROUTINE MAINTENANCEPersonnel Services 16,316 11,929 75,232 51,204 51,204 116,926 96,231Operating Expenses 19,492 116,863 37,282 10,000 10,000 146 10,000Capital Outlay 0 0 0 0 0 0 0TOTALS 35,808 128,792 112,514 61,204 61,204 117,072 106,2314692 STATE WINTER MAINTENANCEPersonnel Services 51,514 80,970 74,567 85,414 85,414 65,087 98,079Operating Expenses 1,331 0 0 11,370 11,370 5,253 11,370Capital Outlay 0 0 0 0 0 0 0TOTALS 52,845 80,970 74,567 96,784 96,784 70,340 109,449167
EXPENDITURE ANALYSIS SUMMARY<strong>2010</strong>/<strong>2011</strong> APPROVED BUDGET<strong>2010</strong> <strong>2010</strong> <strong>2011</strong>2007 2008 2009 Approved Adjusted <strong>2010</strong> ApprovedActual Actual Actual <strong>Budget</strong> <strong>Budget</strong> Projected <strong>Budget</strong>9660 TRANSFERS OUTPersonnel Services 0 0 0 0 0 0 0Operating Expenses 0 0 0 0 0 0 0Capital Outlay 0 0 0 0 0 0 0Miscellaneous 946,156 664,700 513,914 281,463 281,463 281,463 25,450TOTALS 946,156 664,700 513,914 281,463 281,463 281,463 25,450TOTAL MAJOR STREETSPersonnel Services 1,929,478 2,020,086 1,696,383 1,753,500 1,753,500 1,807,597 2,401,094Operating Expenses 1,845,626 2,234,140 2,102,898 2,191,441 2,241,234 1,989,605 2,308,730Debt Service 0 12,355 0 12,336 6,219 0 5,086Capital Outlay 142,990 1,443 27,977 0 0 0 0Miscellaneous 946,156 664,700 513,914 281,463 281,463 281,463 25,512TOTALEXPENDITURES 4,864,251 4,932,725 4,341,173 4,238,741 4,282,417 4,078,666 4,740,422168
POSITION ANALYSIS<strong>2010</strong>/<strong>2011</strong> APPROVED BUDGET<strong>2010</strong> <strong>2010</strong> <strong>2011</strong>2007 2008 2009 Approved Adjusted <strong>2010</strong> ApprovedActual Actual Actual <strong>Budget</strong> <strong>Budget</strong> Projected <strong>Budget</strong>SPECIAL REVENUE FUND - MAJOR STREETSEngineering Administration 2.70 2.40 2.25 2.25 2.25 2.25 2.75Traffic Engineering 3.30 3.30 3.85 3.85 3.85 3.85 6.75Street Administration 2.20 1.53 0.58 0.58 0.58 0.58 0.25Routine Maintenance 13.50 11.50 5.50 5.50 5.50 5.50 7.50Bridge Maintenance 0.50 0.50 0.50 0.50 0.50 0.50 0.50Winter Maintenance 2.00 1.75 0.75 0.75 0.75 0.75 0.75State Trunkline 0.35 0.35 0.85 0.85 0.85 0.85 0.35State Routine Maintenance 0.00 0.00 0.50 0.50 0.50 0.50 1.00State Winter Maintenance 1.00 1.00 1.00 1.00 1.00 1.00 1.00TOTAL POSITIONS 25.55 22.33 15.78 15.78 15.78 15.78 20.85Overall the Major Streets Fund will increase by approximately 5.07 positions from the <strong>2010</strong> approved budget levels. Thisincrease is due to the following: in the Engineering Administration .50 <strong>of</strong> the Assistant <strong>City</strong> Engineer position will be added,in the Traffic Engineering Division .50 <strong>of</strong> a Traffic Electrician I, 1.65 <strong>of</strong> an Traffic Maintenance Technican I, and .60 <strong>of</strong> aTraffic Maintenance Technician II positions will be added from the General Fund, in the Routine Maintenance Division 3Crossover Operator positions will be allocated, and in the State Routine Maintenance Division .50 <strong>of</strong> an Crossover Operatorwill be added. These additions will be <strong>of</strong>fset by the elimination <strong>of</strong> the following: in the Street Administration .33 <strong>of</strong> theSuperintendent <strong>of</strong> Right <strong>of</strong> Way will be eliminated, as well as .50 <strong>of</strong> an Administrative Pr<strong>of</strong>essional in the State TrunklineDivision. Also, please note that the Chief Foreman and the Labor Foreman II Streets positions in the Routine MaintenanceDivision will be retitled to the Chief ROW Streets Foreman and ROW Streets Foreman, respectively.169
EXPENDITURE ANALYSIS DETAIL<strong>2010</strong>/<strong>2011</strong> APPROVED BUDGET202-4612 EngineeringAllocation PlanPosition Control<strong>2010</strong>/JOB <strong>2011</strong>PERSONNEL SERVICES CLASSIFICATION BUDGET ALLOCATIONSalaries 161,654 <strong>City</strong> Engineer 0.50 45,336Overtime 6,000 Asst. <strong>City</strong> Engineer 0.50 32,689Fringe Benefits 115,989 Engin. Ofc Supervisor 0.25 15,166Engineering Tech. I 0.75 35,343TOTAL283,643 Surveying Technician 0.25 11,854Admin. Pr<strong>of</strong>essional 0.50 21,265OPERATING EXPENSES Total Personnel 2.75 161,654Supplies 0Internal Services 18,728 Overtime 6,000Other ServicesPr<strong>of</strong>essional Fees 0Maintenance Fees 0 FICA 11,546Other Contracted Fees 3,950 Healthcare Benefits - Active 41,765Healthcare Benefits - Retirees 0TOTAL22,678 Pension 62,678CAPITAL OUTLAY 0Total Fringe Benefits 115,989TOTAL0 TOTAL 2.75 283,643TOTAL APPROPRIATION 306,321170
EXPENDITURE ANALYSIS DETAIL<strong>2010</strong>/<strong>2011</strong> APPROVED BUDGET202-4614 Street ProjectAllocation PlanPosition Control<strong>2010</strong>/JOB <strong>2011</strong>PERSONNEL SERVICES CLASSIFICATION BUDGET ALLOCATIONSalaries 0Overtime 15,000 Total Personnel 0.00 0Fringe Benefits 1,147TOTAL16,147 Overtime 15,000OPERATING EXPENSES FICA 1,147Healthcare Benefits - Active 0Supplies 0 Healthcare Benefits - Retirees 0Internal Services 0 Pension 0Other ServicesPr<strong>of</strong>essional Fees 100,000 Total Fringe Benefits 1,147Maintenance Fees 460,000Other Contracted Fees 15,000TOTAL 0.00 16,147TOTAL575,000CAPITAL OUTLAY 0TOTAL0TOTAL APPROPRIATION 591,147171
EXPENDITURE ANALYSIS DETAIL<strong>2010</strong>/<strong>2011</strong> APPROVED BUDGET202-4616 Bridge ProjectAllocation PlanPosition Control<strong>2010</strong>/JOB <strong>2011</strong>PERSONNEL SERVICES CLASSIFICATION BUDGET ALLOCATIONSalaries 0Overtime 0 Total Personnel 0.00 0Fringe Benefits 0TOTAL0 Overtime 0OPERATING EXPENSES FICA 0Healthcare Benefits - Active 0Supplies 0 Healthcare Benefits - Retirees 0Internal Services 0 Pension 0Other ServicesPr<strong>of</strong>essional Fees 80,000 Total Fringe Benefits 0Maintenance Fees 115,000Other Contracted Fees 0TOTAL 0.00 0TOTAL195,000CAPITAL OUTLAY 0TOTAL0TOTAL APPROPRIATION 195,000172
EXPENDITURE ANALYSIS DETAIL<strong>2010</strong>/<strong>2011</strong> APPROVED BUDGET202-4621 Traffic EngineeringAllocation PlanPosition Control<strong>2010</strong>/JOB <strong>2011</strong>PERSONNEL SERVICES CLASSIFICATION BUDGET ALLOCATIONSalaries 310,080 Traffic Foreman 1.00 56,199Overtime 12,000 Traffic Electrician II 1.00 47,333Fringe Benefits 262,288 Traffic Electrician I 1.50 74,598Transport. Eng. Assistant 1.00 47,049TOTAL584,368 Traffic Mtce. Technician II 0.60 25,083Traffic Mtce. Technician I 1.65 59,818OPERATING EXPENSES Total Personnel 6.75 310,080Supplies 144,195Internal Services 75,918 Overtime 12,000Other ServicesPr<strong>of</strong>essional Fees 37,035 FICA 24,927Maintenance Fees 19,779 Healthcare Benefits - Active 97,578Other Contracted Fees 2,500 Healthcare Benefits - Retirees 2,500Pension 137,283TOTAL279,427Total Fringe Benefits 262,288CAPITAL OUTLAY 0TOTAL0TOTAL 6.75 584,368TOTAL APPROPRIATION 863,795173
FUND: 202 – Major Streets FundDEPARTMENT: Public ServicesACTIVITY: 4650 – Major Streets - AdministrationSTRATEGIC NARRATIVEAdministration division provides the daily direction, planning, coordination, and supervision for winterand routine maintenance and repair work on major streets and bridges in accordance with MichiganState Law (Act 51, Public Acts <strong>of</strong> 1951). In addition, this division is responsible for maintaining theaccounting, billing and other records necessary for compliance with the law.FY <strong>2010</strong>/<strong>2011</strong> GOALS AND OBJECTIVES1. To maintain safe and clean <strong>City</strong> streets by administering the filling <strong>of</strong> potholes, sweeping, cracksealing, minor patching, winter maintenance, and forestry operations.a. To maintain and improve major streets and bridgesComplete StateHighway ReportIn-House2009ActualReport is doneby Engineering<strong>2010</strong>ProjectedBring report backinto the Right-<strong>of</strong>-Way Streets Division<strong>2011</strong>TargetReport done inRight-<strong>of</strong>-Way2. To increase the durability <strong>of</strong> street surfaces and retard the deterioration <strong>of</strong> pavement on citystreets.174
EXPENDITURE ANALYSIS DETAIL<strong>2010</strong>/<strong>2011</strong> APPROVED BUDGET202-4650 Street AdministrationAllocation PlanPosition Control<strong>2010</strong>/JOB <strong>2011</strong>PERSONNEL SERVICES CLASSIFICATION BUDGET ALLOCATIONSalaries 13,430 Director <strong>of</strong> Public Services 0.05 5,070Overtime 500 Admin. Pr<strong>of</strong>essional 0.20 8,361Fringe Benefits 538,905Total Personnel 0.25 13,430TOTAL552,835OPERATING EXPENSESOvertime 500FICA 2,440Supplies 1,200 Healthcare Benefits - Active 3,686Internal Services 236,128 Healthcare Benefits - Retirees 516,731Other Services Pension 16,048Pr<strong>of</strong>essional Fees 30,807Maintenance Fees 3,904 Total Fringe Benefits 538,905Other Contracted Fees 550TOTAL272,589 TOTAL 0.25 552,835CAPITAL OUTLAY 0TOTAL0TOTAL APPROPRIATION 825,424175
FUND: 202 – Major Streets FundDEPARTMENT: Public ServicesACTIVITY: 4651 – Routine MaintenanceSTRATEGIC NARRATIVEThis division provides street repairs and other routine maintenance services for the <strong>City</strong>’s 23.9 miles <strong>of</strong>State trunk line and 95.5 miles <strong>of</strong> major streets. The Routine Maintenance division improves thedurability <strong>of</strong> road surfaces, retards their deterioration, and adds to a clean and safe communityenvironment.FY <strong>2010</strong>/<strong>2011</strong> GOALS AND OBJECTIVES1. To maintain basic street repair and maintenance for the <strong>City</strong>’s major streets with limitedresources.a. Reduce pothole complaints2009Actual<strong>2010</strong>Projected<strong>2011</strong>TargetLane Milespatched N/A .5 mile 1 mile2. To improve the urban forest and certify tree trimmers as line clearance arborists so as to be ableto work within 2.5 feet <strong>of</strong> electrical conductorsa. Send tree trimmers to trainingCertified lineclearingArborist2009Actual<strong>2010</strong>Projected<strong>2011</strong>Target4 3 43. To explore methods <strong>of</strong> improving the urban forest, where funding allows, to include trimmingand replacement <strong>of</strong> trees.176
EXPENDITURE ANALYSIS DETAIL<strong>2010</strong>/<strong>2011</strong> APPROVED BUDGET202-4651 Routine MaintenanceAllocation PlanPosition Control<strong>2010</strong>/JOB <strong>2011</strong>PERSONNEL SERVICES CLASSIFICATION BUDGET ALLOCATIONSalaries 304,906 Chief ROW Street Foreman 0.50 32,276Overtime 20,000 ROW Street Foreman 0.50 25,841Fringe Benefits 272,651 Heavy Equipment Operator 1.00 42,447Tree Trimmer 1.50 63,651TOTAL597,557 Crossover Operator 3.00 127,487Groundskeeper (Sl) 0.50 5,508Laborer (T) 0.50 7,696OPERATING EXPENSESTotal Personnel 7.50 304,906Supplies 234,000 Overtime 20,000Internal Services 67,855Other ServicesPr<strong>of</strong>essional Fees 13,950 FICA 25,772Maintenance Fees 325,402 Healthcare Benefits - Active 157,388Other Contracted Fees 550 Healthcare Benefits - Retirees 0Pension 89,491TOTAL641,757Total Fringe Benefits 272,651CAPITAL OUTLAY 0TOTAL0TOTAL 7.50 597,557DEBT SERVICE 5,148TOTAL5,148TOTAL APPROPRIATION 1,244,462177
FUND: 202 – Major Streets FundDEPARTMENT: Public ServicesACTIVITY: 4654 – Bridge MaintenanceSTRATEGIC NARRATIVEThe Bridge Maintenance division provides for normal maintenance and repairs on the Frank Andersen,G. Stewart Francke, Johnson Avenue, Genesee Avenue, and Douglas G. Schenck bridges. This divisionensures vehicular and boat traffic safety and extends the life <strong>of</strong> the <strong>City</strong>’s bridges.FY <strong>2010</strong>/<strong>2011</strong> GOALS AND OBJECTIVES1. To perform maintenance that will prolong the life <strong>of</strong> the five bridges throughout the community.a. To complete the under bridge washing <strong>of</strong> all five spans and to clean all expansion joints2009Actual<strong>2010</strong>Projected<strong>2011</strong>TargetMan HoursWorked N/A 200 200178
EXPENDITURE ANALYSIS DETAIL<strong>2010</strong>/<strong>2011</strong> APPROVED BUDGET202-4654 Bridge MaintenanceAllocation PlanPosition Control<strong>2010</strong>/JOB <strong>2011</strong>PERSONNEL SERVICES CLASSIFICATION BUDGET ALLOCATIONSalaries 20,875 Tree Trimmer 0.50 20,875Overtime 475Fringe Benefits 19,107 Total Personnel 0.50 20,875TOTAL40,457Overtime 475OPERATING EXPENSESFICA 1,566Supplies 2,500 Healthcare Benefits - Active 8,701Internal Services 25,431 Healthcare Benefits - Retirees 0Other Services Pension 8,840Pr<strong>of</strong>essional Fees 72,047Maintenance Fees 0 Total Fringe Benefits 19,107Other Contracted Fees 0TOTAL99,978 TOTAL 0.50 40,457CAPITAL OUTLAY 0TOTAL0TOTAL APPROPRIATION 140,435179
FUND: 202 – Major Streets FundDEPARTMENT: Public ServicesACTIVITY: 4655 – Winter MaintenanceSTRATEGIC NARRATIVEThe Winter Maintenance division provides for all snow removal activities on <strong>City</strong> streets. Theresponsibilities <strong>of</strong> this division include plowing, sanding, salting, hauling snow, erecting snow fences,and removing snow by hand at intersections and bridge walks as necessary.FY <strong>2010</strong>/<strong>2011</strong> GOALS AND OBJECTIVES1. To maintain prompt snow removal and ice control on the <strong>City</strong>’s major streets.a. Keep major streets plowedCost per capita tokeep majorstreets plowed(estimated 55,000population)2009Actual<strong>2010</strong>Projected<strong>2011</strong>Target$4.24/Mile $5.21/Mile $5.00/Mile180
EXPENDITURE ANALYSIS DETAIL<strong>2010</strong>/<strong>2011</strong> APPROVED BUDGET202-4655 Winter MaintenanceAllocation PlanPosition Control<strong>2010</strong>/JOB <strong>2011</strong>PERSONNEL SERVICES CLASSIFICATION BUDGET ALLOCATIONSalaries 31,857 Heavy Equipment Operator 0.75 31,857Overtime 20,000Fringe Benefits 41,078 Total Personnel 0.75 31,857TOTAL92,935Overtime 20,000OPERATING EXPENSESFICA 3,965Supplies 126,000 Healthcare Benefits - Active 16,772Internal Services 25,434 Healthcare Benefits - Retirees 0Other Services Pension 20,341Pr<strong>of</strong>essional Fees 0Maintenance Fees 0 Total Fringe Benefits 41,078Other Contracted Fees 0TOTAL151,434 TOTAL 0.75 92,935CAPITAL OUTLAY 0TOTAL0TOTAL APPROPRIATION 244,369181
EXPENDITURE ANALYSIS DETAIL<strong>2010</strong>/<strong>2011</strong> APPROVED BUDGET202-4690 State TrunklineAllocation PlanPosition Control<strong>2010</strong>/JOB <strong>2011</strong>PERSONNEL SERVICES CLASSIFICATION BUDGET ALLOCATIONSalaries 13,124 Traffic Mtce. Technician I 0.35 13,124Overtime 3,000Fringe Benefits 22,718 Total Personnel 0.35 13,124TOTAL38,842Overtime 3,000OPERATING EXPENSESFICA 1,234Supplies 32,000 Healthcare Benefits - Active 5,087Internal Services 17,497 Healthcare Benefits - Retirees 0Other Services Pension 16,397Pr<strong>of</strong>essional Fees 0Maintenance Fees 0 Total Fringe Benefits 22,718Other Contracted Fees 0TOTAL49,497 TOTAL 0.35 38,842CAPITAL OUTLAY 0TOTAL0TOTAL APPROPRIATION 88,339182
FUND: 202 – Major Streets FundDEPARTMENT: Public ServicesACTIVITY: 4691 – State Routine MaintenanceSTRATEGIC NARRATIVEThis division provides street repairs and other routine maintenance services for the <strong>City</strong>’s 23.9 miles <strong>of</strong>State trunk line. The Routine Maintenance division improves the durability <strong>of</strong> road surfaces, retardstheir deterioration, and adds to a clean and safe community environment.FY <strong>2010</strong>/<strong>2011</strong> GOALS AND OBJECTIVES1. To maintain basic street repair and maintenance for the State trunk lines.a. To sweep all trunk lines three times a year2009Actual<strong>2010</strong>Projected<strong>2011</strong>TargetTons <strong>of</strong> DebrisRemoved 1053 2000 20002. To replace trees along the State trunk lines throughout the <strong>City</strong>a. To plant 24 new trees on State trunk lines2009Actual<strong>2010</strong>Projected<strong>2011</strong>TargetNumber <strong>of</strong>Trees Planted N/A 24 24183
EXPENDITURE ANALYSIS DETAIL<strong>2010</strong>/<strong>2011</strong> APPROVED BUDGET202-4691 State Routine MaintenanceAllocation PlanPosition Control<strong>2010</strong>/JOB <strong>2011</strong>PERSONNEL SERVICES CLASSIFICATION BUDGET ALLOCATIONSalaries 42,312 Crossover Operator 1.00 42,312Overtime 1,500Fringe Benefits 52,419 Total Personnel 1.00 42,312TOTAL96,231Overtime 1,500OPERATING EXPENSESFICA 3,352Supplies 0 Healthcare Benefits - Active 19,262Internal Services 10,000 Healthcare Benefits - Retirees 0Other Services Pension 29,805Pr<strong>of</strong>essional Fees 0Maintenance Fees 0 Total Fringe Benefits 52,419Other Contracted Fees 0TOTAL10,000 TOTAL 1.00 96,231CAPITAL OUTLAY 0TOTAL0TOTAL APPROPRIATION 106,231184
FUND: 202 – Major Streets FundDEPARTMENT: Public ServicesACTIVITY: 4692 – State Winter MaintenanceSTRATEGIC NARRATIVEThe Winter Maintenance division provides for all snow removal activities on <strong>City</strong> state trunk lines. Theresponsibilities <strong>of</strong> this division include plowing, sanding, salting, hauling snow, erecting snow fences,and removing snow by hand on bridge walks as necessary.FY <strong>2010</strong>/<strong>2011</strong> GOALS AND OBJECTIVES1. To maintain prompt snow removal and ice control on the <strong>City</strong>’s trunk lines.a. To keep all state trunk lines open in accordance with the Emergency County SnowplowroutesDollars Spentfor SnowRemoval onState Highway2009Actual<strong>2010</strong>Projected<strong>2011</strong>Target$74,567.00 $96,784.00 $104,362.00185
EXPENDITURE ANALYSIS DETAIL<strong>2010</strong>/<strong>2011</strong> APPROVED BUDGET202-4692 State Winter MaintenanceAllocation PlanPosition Control<strong>2010</strong>/JOB <strong>2011</strong>PERSONNEL SERVICES CLASSIFICATION BUDGET ALLOCATIONSalaries 42,495 Tree Trimmer 1.00 42,495Overtime 13,000Fringe Benefits 42,584 Total Personnel 1.00 42,495TOTAL98,079Overtime 13,000OPERATING EXPENSESFICA 4,245Supplies 6,250 Healthcare Benefits - Active 17,466Internal Services 0 Healthcare Benefits - Retirees 0Other Services Pension 20,873Pr<strong>of</strong>essional Fees 5,120Maintenance Fees 0 Total Fringe Benefits 42,584Other Contracted Fees 0TOTAL11,370 TOTAL 1.00 98,079CAPITAL OUTLAY 0TOTAL0TOTAL APPROPRIATION 109,449186
LOCAL STREETS FUND (203)RESOURCE ALLOCATION<strong>2010</strong>/<strong>2011</strong> APPROVED BUDGETRESOURCESAPPROPRIATIONSSTATE REVENUE 946,097 TRAFFIC ENGINEERING 139,036SERVICES - SALES 0 STREET AD<strong>MI</strong>NISTRATION 509,876INTEREST AND RENTS 2,000 ROUTINE MAINTENANCE 365,897OTHER REVENUES 274,200 WINTER MAINTENANCE 190,686TRANSFERS IN 0 TRANSFERS OUT 16,802TOTAL RESOURCES 1,222,297 TOTAL APPROPRIATIONS 1,222,297187
REVENUE ANALYSIS SUMMARY<strong>2010</strong>/<strong>2011</strong> APPROVED BUDGET<strong>2010</strong> <strong>2010</strong> <strong>2011</strong>2007 2008 2009 Approved Adjusted <strong>2010</strong> ApprovedActual Actual Actual <strong>Budget</strong> <strong>Budget</strong> Projected <strong>Budget</strong>State Revenue Sharing 1,035,654 1,018,786 981,408 1,000,000 1,000,000 806,275 946,097Service - Sales 0 0 0 0 0 0 0Interest and Rents 73 822 (304) 2,000 2,000 327 2,000Other Revenues 7,102 3,019 3,502 3,000 3,000 0 274,200Transfers from Other Funds 924,775 643,319 490,244 256,340 268,190 256,340 0TOTAL RESOURCES 1,967,604 1,665,946 1,474,850 1,261,340 1,273,190 1,062,942 1,222,297REVENUE ANALYSIS DETAILGas and Weight Tax 1,035,654 1,018,786 981,408 1,000,000 1,000,000 806,275 946,097Total State Rev. Sharing 1,035,654 1,018,786 981,408 1,000,000 1,000,000 806,275 946,097Materials and Services 0 0 0 0 0 0 0Total Service - Sales 0 0 0 0 0 0 0Interest on Investments 0 (363) (1,198) 1,000 1,000 327 1,000Interest on Spec. Asmts 73 1,185 894 1,000 1,000 0 1,000Interest and Rents 73 822 (304) 2,000 2,000 327 2,000Special Assessments 2,854 3,019 3,502 3,000 3,000 0 3,000Surplus Receipts 2 0 0 0 0 0 0Reimbursement 4,246 0 0 0 0 0 0Use <strong>of</strong> Fund Equity 0 0 0 0 0 0 271,200Total Other Revenues 7,102 3,019 3,502 3,000 3,000 0 274,200Transfer from Other Funds 0 0 1,453 0 11,850 0 0Major Street Fund 924,775 643,319 488,791 256,340 256,340 256,340 0Total Transfers 924,775 643,319 490,244 256,340 268,190 256,340 0TOTAL RESOURCES 1,967,604 1,665,946 1,474,850 1,261,340 1,273,190 1,062,942 1,222,297188
EXPENDITURE ANALYSIS SUMMARY<strong>2010</strong>/<strong>2011</strong> APPROVED BUDGET<strong>2010</strong> <strong>2010</strong> <strong>2011</strong>2007 2008 2009 Approved Adjusted <strong>2010</strong> ApprovedActual Actual Actual <strong>Budget</strong> <strong>Budget</strong> Projected <strong>Budget</strong>4621 TRAFFIC ENGINEERINGPersonnel Services 32,830 35,649 24,372 34,701 34,701 58,039 35,918Operating Expenses 202,888 198,995 84,828 68,399 68,399 73,678 103,118Capital Outlay 2,788 0 0 0 0 0 0TOTALS 238,506 234,644 109,200 103,100 103,100 131,717 139,0364650 STREET AD<strong>MI</strong>NISTRATIONPersonnel Services 59,683 368,663 284,034 462,740 462,740 323,543 348,844Operating Expenses 9,961 160,736 140,584 145,513 157,363 143,735 161,032Capital Outlay 0 0 0 0 0 0 0TOTALS 69,644 529,399 424,618 608,253 620,103 467,278 509,8764651 ROUTINE MAINTENANCEPersonnel Services 560,382 407,158 303,360 254,121 254,121 195,646 253,278Operating Expenses 671,600 311,223 236,614 115,917 115,917 86,343 112,619Capital Outlay 0 0 0 0 0 0 0TOTALS 1,231,982 718,381 539,974 370,038 370,038 281,989 365,8974655 WINTER MAINTENANCEPersonnel Services 267,747 104,534 68,831 70,144 70,144 51,610 79,406Operating Expenses 109,272 87,896 46,657 93,219 93,219 62,870 111,280Capital Outlay 0 0 0 0 0 0 0TOTALS 377,019 192,430 115,488 163,363 163,363 114,480 190,6869660 TRANSFERS TO OTHER FUNDSPersonnel Services 0 0 0 0 0 0 0Operating Expenses 0 0 0 0 0 0 0Capital Outlay 0 0 0 0 0 0 0Miscellaneous 14,116 14,116 16,586 16,586 16,586 16,586 16,802TOTALS 14,116 14,116 16,586 16,586 16,586 16,586 16,802TOTAL LOCAL STREETSPersonnel Services 920,642 916,004 680,597 821,706 821,706 628,837 717,446Operating Expenses 993,721 758,850 508,683 423,048 434,898 366,627 488,049Capital Outlay 2,788 0 0 0 0 0 0Miscellaneous 14,116 14,116 16,586 16,586 16,586 16,586 16,802TOTALEXPENDITURES 1,931,267 1,688,970 1,205,866 1,261,340 1,273,190 1,012,051 1,222,297189
POSITION ANALYSIS<strong>2010</strong>/<strong>2011</strong> APPROVED BUDGET<strong>2010</strong> <strong>2010</strong> <strong>2011</strong>2007 2008 2009 Approved Adjusted <strong>2010</strong> ApprovedActual Actual Actual <strong>Budget</strong> <strong>Budget</strong> Projected <strong>Budget</strong>SPECIAL REVENUE FUND - LOCAL STREETSTraffic Engineering 0.40 0.40 0.40 0.40 0.40 0.40 0.40Streets Administration 0.60 0.93 1.03 1.03 1.03 1.03 0.20Routine Maintenance 6.00 4.75 2.75 2.75 2.75 2.75 4.30Winter Maintenance 1.00 0.75 0.75 0.75 0.75 0.75 0.75TOTAL POSITIONS 8.00 6.83 4.93 4.93 4.93 4.93 5.65Overall, Local Streets personnel complement is projected to increase by .72 in FY <strong>2011</strong>. In the Administration Division, .33 <strong>of</strong> theSuperintended <strong>of</strong> Right-<strong>of</strong>-Way (ROW) will be eliminated from the complement. In addition, the Administrative Pr<strong>of</strong>essionalposition's allocation will decrease by .30. To <strong>of</strong>fset this decrease, in the Routine Maintenance Division, 1.80 Groundskeepers havebeen added to the complement as well as .50 <strong>of</strong> a temporary Laborer position. Likewise, the Labor Foreman for Streets will beretitled to ROW Streets Foreman.190
EXPENDITURE ANALYSIS DETAIL<strong>2010</strong>/<strong>2011</strong> APPROVED BUDGET203-4621 Traffic EngineeringAllocation PlanPosition Control<strong>2010</strong>/JOB <strong>2011</strong>PERSONNEL SERVICES CLASSIFICATION BUDGET ALLOCATIONSalaries 16,722 Traffic Maintenance Tech. 0.40 16,722Overtime 3,000Fringe Benefits 16,196 Total Personnel 0.40 16,722TOTAL35,918Overtime 3,000OPERATING EXPENSESFICA 1,509Supplies 47,330 Healthcare Benefits - Active 5,843Internal Services 18,241 Healthcare Benefits - Retirees 0Other Services Pension 8,844Pr<strong>of</strong>essional Fees 16,868Maintenance Fees 18,929.00 Total Fringe Benefits 16,196Other Contracted Fees 1,750TOTAL103,118 TOTAL 0.40 35,918CAPITAL OUTLAY 0TOTAL0TOTAL APPROPRIATION 139,036191
FUND: 203 – Local Streets FundDEPARTMENT: Public ServicesACTIVITY: 4650 – Local Streets AdministrationSTRATEGIC NARRATIVEAdministration division provides the daily direction, planning, coordination, and supervision for winterand routine maintenance and repair work on local streets in accordance with Michigan State Law (Act51, Public Acts <strong>of</strong> 1951). In addition, this division is responsible for maintaining the accounting, billingand other records necessary for compliance with the law.FY <strong>2010</strong>/<strong>2011</strong> GOALS AND OBJECTIVES1. To maintain safe and clean <strong>City</strong> streets by administering the filling <strong>of</strong> potholes, sweeping, cracksealing, minor patching, winter maintenance, and forestry operations.a. Sweep all streets and state highways2009Actual<strong>2010</strong>Projected<strong>2011</strong>TargetNumber <strong>of</strong>Sweepings 6 6 82. To increase the durability <strong>of</strong> street surfaces and retard the deterioration <strong>of</strong> pavement on citystreets.a. To crack seal street surfaces to prolong their life2009Actual<strong>2010</strong>Projected<strong>2011</strong>TargetNumber<strong>of</strong> Miles 12 miles 10 miles 10 miles192
EXPENDITURE ANALYSIS DETAIL<strong>2010</strong>/<strong>2011</strong> APPROVED BUDGET203-4650 Street AdministrationAllocation PlanPosition Control<strong>2010</strong>/JOB <strong>2011</strong>PERSONNEL SERVICES CLASSIFICATION BUDGET ALLOCATIONSalaries 8,361 Administrative Pr<strong>of</strong>essional 0.20 8,361Overtime 200Fringe Benefits 340,283 Total Personnel 0.20 8,361TOTAL348,844Overtime 200OPERATING EXPENSESFICA 616Supplies 100 Healthcare Benefits - Active 2,818Internal Services 148,483 Healthcare Benefits - Retirees 316,200Other Services Pension 20,649Pr<strong>of</strong>essional Fees 10,981Maintenance Fees 1,468 Total Fringe Benefits 340,283Other Contracted Fees 0TOTAL161,032 TOTAL 0.20 348,844CAPITAL OUTLAY 0TOTAL0TOTAL APPROPRIATION 509,876193
FUND: 203 – Local Streets FundDEPARTMENT: Public ServicesACTIVITY: 4651 – Routine MaintenanceSTRATEGIC NARRATIVEThis division provides street repairs and other routine maintenance services for the <strong>City</strong>’s 182.2 miles <strong>of</strong>local streets. The Routine Maintenance division improves the durability <strong>of</strong> road surfaces, retards theirdeterioration, and adds to a clean and safe community environment.FY <strong>2010</strong>/<strong>2011</strong> GOALS AND OBJECTIVES1. Maintain basic street repair and maintenance for the <strong>City</strong>’s local streets.2. To explore methods <strong>of</strong> improving the urban forest, where funding allows, to include trimmingand replacement <strong>of</strong> trees.a. To deliver services with available fundsAsphalt usedfor patching(in tons)2009Actual<strong>2010</strong>Projected<strong>2011</strong>Target200 Tons 300 Tons 300 Tons194
EXPENDITURE ANALYSIS DETAIL<strong>2010</strong>/<strong>2011</strong> APPROVED BUDGET203-4651 Routine MaintenanceAllocation PlanPosition Control<strong>2010</strong>/JOB <strong>2011</strong>PERSONNEL SERVICES CLASSIFICATION BUDGET ALLOCATIONSalaries 116,969 ROW Streets Foreman 0.50 25,841Overtime 11,000 Heavy Equipment Operator 1.00 42,447Fringe Benefits 125,309 Tree Trimmer 0.50 21,156Groundskeeper (S) 1.80 19,829Laborer (Temp) 0.50 7,696TOTAL253,278Total Personnel 4.30 116,969OPERATING EXPENSESOvertime 11,000Supplies 40,739Internal Services 19,090Other Services FICA 9,191Pr<strong>of</strong>essional Fees 1,000 Healthcare Benefits - Active 58,700Maintenance Fees 51,790 Healthcare Benefits - Retirees 0Other Contracted Fees 0 Pension 57,418TOTAL112,619 Total Fringe Benefits 125,309CAPITAL OUTLAY 0 TOTAL 4.30 253,278TOTAL0TOTAL APPROPRIATION 365,897195
FUND: 203 – Local Streets FundDEPARTMENT: Public ServicesACTIVITY: 4655 – Winter MaintenanceSTRATEGIC NARRATIVEThe Winter Maintenance Program provides for all snow removal activities on <strong>City</strong> streets. Theresponsibilities <strong>of</strong> this division include plowing, sanding, salting, hauling snow, erecting snow fences,and removing snow by hand on bridge walks as necessary.FY <strong>2010</strong>/<strong>2011</strong> GOALS AND OBJECTIVES1. To maintain prompt snow removal and ice control on the <strong>City</strong>’s local streets.a. To plow approximately 200 miles <strong>of</strong> local streets (400 lane miles)Cost per capita toplow local streets(estimated 55,000population)2009Actual<strong>2010</strong>Projected<strong>2011</strong>Target$2.23 $2.97 $3.39196
EXPENDITURE ANALYSIS DETAIL<strong>2010</strong>/<strong>2011</strong> APPROVED BUDGET203-4655 Winter MaintenanceAllocation PlanPosition Control<strong>2010</strong>/JOB <strong>2011</strong>PERSONNEL SERVICES CLASSIFICATION BUDGET ALLOCATIONSalaries 31,857 Heavy Equipment Operator 0.75 31,857Overtime 12,000Fringe Benefits 35,549 Total Personnel 0.75 31,857TOTAL79,406Overtime 12,000OPERATING EXPENSESFICA 3,353Supplies 103,310 Healthcare Benefits - Active 16,772Internal Services 7,770 Healthcare Benefits - Retirees 0Other Services Pension 15,424Pr<strong>of</strong>essional Fees 0Maintenance Fees 0 Total Fringe Benefits 35,549Other Contracted Fees 200TOTAL111,280 TOTAL 0.75 79,406CAPITAL OUTLAY 0TOTAL0TOTAL APPROPRIATION 190,686197
RUBBISH COLLECTION (SRF)
RUBBISH COLLECTIONS (226)RESOURCE ALLOCATION<strong>2010</strong>/<strong>2011</strong> APPROVED BUDGETRESOURCESAPPROPRIATIONSPROPERTY TAXES 1,629,737 AD<strong>MI</strong>NISTRATION 430,564SERVICES - SALES 500 RUBBISH COLLECTIONS 1,559,213CHARGE FOR SERVICES 1,374,750 ENVIRONMENTAL IMPROVE. 283,434INTEREST AND RENTS 18,500 SANITARY LANDFILL 557,912OTHER REVENUES 434,147 BRUSH COLLECTIONS 109,400RECYCLING 20,500COMPOSTING 485,893TRANSFERS OUT 10,718TOTAL RESOURCES 3,457,634 TOTAL APPROPRIATIONS 3,457,634198
REVENUE ANALYSIS SUMMARY<strong>2010</strong>/<strong>2011</strong> APPROVED BUDGET<strong>2010</strong> <strong>2010</strong> <strong>2011</strong>2007 2008 2009 Approved Adjusted <strong>2010</strong> ApprovedActual Actual Actual <strong>Budget</strong> <strong>Budget</strong> Projected <strong>Budget</strong>Property Taxes 2,031,063 1,994,891 1,786,539 1,845,768 1,845,768 1,668,111 1,629,737Services - Sales 0 6,559 1,938 500 500 0 500Charge for Services 1,656,432 2,346,179 1,477,306 1,492,000 1,492,000 1,330,390 1,374,750Interest and Rents 21,869 18,978 27,705 18,500 18,500 11,598 18,500Other Revenues (49,725) 35,080 485,160 179,613 179,613 7,837 434,147TOTAL RESOURCES 3,659,639 4,401,687 3,778,648 3,536,381 3,536,381 3,017,936 3,457,634REVENUE ANALYSIS DETAILReal Property 1,676,026 1,729,057 1,700,186 1,563,872 1,563,872 1,611,301 1,366,317Real Property - IFT 3,051 3,051 2,205 1,633 1,633 1,553 1,477Personal Property 281,374 249,925 226,162 261,174 261,174 196,009 248,759Personal Property - IFT 62,738 48,904 21,797 19,089 19,089 17,482 13,184Property Taxes - Chargeback 0 (36,048) (163,865) 0 0 (158,234) 0Penalties and Interest 11 2 54 0 0 0 0PILOT - Housing Com 7,863 0 0 0 0 0 0Total Property Taxes 2,031,063 1,994,891 1,786,539 1,845,768 1,845,768 1,668,111 1,629,737Sale <strong>of</strong> Junk 0 6,559 1,938 500 500 0 500Total Service - Sales 0 6,559 1,938 500 500 0 500Household Rubbish Fees 1,372,822 901,304 1,172,397 1,190,000 1,190,000 1,082,100 1,072,750Trash Removal 49,423 247,357 61,873 62,000 62,000 0 62,000Compost Stie Dump Fees 234,187 1,197,518 243,036 240,000 240,000 248,290 240,000Total Charge for Srvc 1,656,432 2,346,179 1,477,306 1,492,000 1,492,000 1,330,390 1,374,750Interest on Investments 1,388 1,959 6,084 1,000 1,000 1,249 1,000Interest on Spec Asmts 1,516 1,167 2,120 2,000 2,000 738 2,000Penalties on Rubbish Fees 18,965 15,852 19,501 15,500 15,500 9,610 15,500Total Interest and Rents 21,869 18,978 27,705 18,500 18,500 11,598 18,500Special Assessments (52,011) 35,040 485,160 75,000 75,000 7,837 75,000Surplus Receipts 40 40 0 0 0 0 0Reimbursement 2,246 0 0 0 0 0 0Use <strong>of</strong> Fund Equity 0 0 0 104,613 104,613 0 359,147Total Other Revenues (49,725) 35,080 485,160 179,613 179,613 7,837 434,147TOTAL RESOURCES 3,659,639 4,401,687 3,778,648 3,536,381 3,536,381 3,017,936 3,457,634199
EXPENDITURE ANALYSIS SUMMARY<strong>2010</strong>/<strong>2011</strong> APPROVED BUDGET<strong>2010</strong> <strong>2010</strong> <strong>2011</strong>2007 2008 2009 Approved Adjusted <strong>2010</strong> ApprovedActual Actual Actual <strong>Budget</strong> <strong>Budget</strong> Projected <strong>Budget</strong>4581 RUBBISH COLLECTIONS - AD<strong>MI</strong>NISTRATIONPersonnel Services 140,422 148,620 162,670 191,856 191,856 181,227 132,207Operating Expenses 717,598 219,776 325,399 347,496 347,496 327,401 298,357Capital Outlay 0 0 0 0 0 0 0TOTALS 858,020 368,396 488,069 539,352 539,352 508,628 430,5644582 RUBBISH COLLECTIONSPersonnel Services 109,354 91,897 80,444 84,502 84,502 61,675 79,090Operating Expenses 1,598,055 1,919,606 1,641,962 1,385,210 1,385,210 1,319,958 1,480,123Capital Outlay 0 0 0 0 0 0 0Miscellaneous 16,793 16,794 0 0 0 0 0TOTALS 1,724,202 2,028,297 1,722,406 1,469,712 1,469,712 1,381,633 1,559,2134583 ENVIRONMENTAL IMPROVEMENTPersonnel Services 28,937 68,806 59,214 178,198 178,198 171,086 137,237Operating Expenses 109,419 174,997 157,800 173,626 173,326 139,530 146,197Capital Outlay 141 0 270 0 300 247 0TOTALS 138,497 243,803 217,284 351,824 351,824 310,863 283,4344584 SANITARY LANDFILLPersonnel Services 0 0 0 0 0 0 0Operating Expenses 460,591 448,629 480,240 561,342 561,342 153,967 557,912Capital Outlay 0 0 0 0 0 0 0TOTALS 460,591 448,629 480,240 561,342 561,342 153,967 557,9124585 BRUSH COLLECTIONSPersonnel Services 0 0 0 0 0 0 0Operating Expenses 6,447 76,614 90,484 109,400 109,400 86,272 109,400Capital Outlay 0 0 0 0 0 0 0Miscellaneous 0 13,710 0 0 0 0TOTALS 6,447 90,324 90,484 109,400 109,400 86,272 109,4004586 RECYCLINGPersonnel Services 0 0 0 0 0 0 0Operating Expenses 67,831 74,191 0 20,500 20,500 1,258 20,500Capital Outlay 0 0 0 0 0 0 0TOTALS 67,831 74,191 0 20,500 20,500 1,258 20,500200
EXPENDITURE ANALYSIS SUMMARY<strong>2010</strong>/<strong>2011</strong> APPROVED BUDGET<strong>2010</strong> <strong>2010</strong> <strong>2011</strong>2007 2008 2009 Approved Adjusted <strong>2010</strong> ApprovedActual Actual Actual <strong>Budget</strong> <strong>Budget</strong> Projected <strong>Budget</strong>4587 COMPOSTINGPersonnel Services 245,777 197,082 226,374 201,641 201,641 297,952 246,589Operating Expenses 50,061 59,162 66,755 272,030 376,280 260,452 239,304Capital Outlay 26,000 0 0 0 0 0 0TOTALS 321,838 256,244 293,129 473,671 577,921 558,404 485,8939660 TRANSFERS TO OTHER FUNDSPersonnel Services 0 0 0 0 0 0 0Operating Expenses 0 0 0 0 0 0 0Capital Outlay 0 0 0 0 0 0 0Miscellaneous 9,004 9,004 10,580 10,580 10,580 10,580 10,718TOTALS 9,004 9,004 10,580 10,580 10,580 10,580 10,718TOTAL RUBBISH COLLECTIONSPersonnel Services 524,490 506,405 528,702 656,197 656,197 711,941 595,123Operating Expenses 3,010,002 2,972,975 2,762,640 2,869,604 2,973,554 2,288,838 2,851,793Capital Outlay 26,141 0 270 0 300 247 0Miscellaneous 25,797 39,508 10,580 10,580 10,580 10,580 10,718TOTALEXPENDITURES 3,586,429 3,518,888 3,302,192 3,536,381 3,640,631 3,011,606 3,457,634201
POSITION ANALYSIS<strong>2010</strong>/<strong>2011</strong> APPROVED BUDGET<strong>2010</strong> <strong>2010</strong> <strong>2011</strong>2007 2008 2009 Approved Adjusted <strong>2010</strong> ApprovedActual Actual Actual <strong>Budget</strong> <strong>Budget</strong> Projected <strong>Budget</strong>SPECIAL REVENUE FUND - RUBBISH COLLECTIONRubbish Administration 1.50 0.89 1.69 1.69 1.69 1.69 0.35Rubbish Collection 1.00 1.00 0.50 0.50 0.50 0.50 0.50Environmental Improvement 0.00 1.00 1.10 1.10 1.10 1.10 1.00Composting 2.00 2.00 2.00 2.00 2.00 2.00 2.00TOTAL POSITIONS 4.50 4.89 5.29 5.29 5.29 5.29 3.85The <strong>2010</strong>/<strong>2011</strong> Approved <strong>Budget</strong> will decrease by a total <strong>of</strong> 1.44 positions from the <strong>2010</strong> approved budgeted levels. During<strong>2010</strong> the <strong>City</strong> <strong>of</strong> <strong>Saginaw</strong> contracted with Plante & Moran Consultants to perform a Staffing and Efficiency Study. As aresult <strong>of</strong> this study, in the Administration Division, the Superintendant <strong>of</strong> Right-<strong>of</strong>-Way (ROW) will be eliminated. Thiselimination represents .34 in the Rubbish Collection Fund. The <strong>City</strong> Engineer will be charged with the responsiblities <strong>of</strong> theRight-<strong>of</strong>-Way Division. In addition, in the Administration Division, the Environmental Support Specialist will beredistributed to the Environmental Improvement Division. In the Rubbish Collection Division, the Chief Foreman will beretitled as the Chief ROW Streets Foreman. In the Environmental Improvement Division, both the Labor Foreman forStreets/Environment and the Building Operations Supervisor will be redistributed to the General and the Public WorksBuidling Funds.Another change that will occur in FY <strong>2011</strong>, is the reorganization <strong>of</strong> the Environmental Improvement division from theDepartment <strong>of</strong> Public Services to the Department <strong>of</strong> Development. The Inspections division will manage theEnvironmental Improvement operations through the <strong>City</strong>'s SCENIC program. In addition, the Environmental SupportSpecialist will report directly to the Licensed Inspector.202
FUND: 226 – Rubbish Collection FundDEPARTMENT: Public ServicesACTIVITY: 4581 – Rubbish Collection AdministrationSTRATEGIC NARRATIVERubbish Collection Administration provides daily direction, planning, coordination, and supervision <strong>of</strong>solid waste collection and disposal. In addition, this division is responsible for maintaining theaccounting, billing, and other records for the various Rubbish Collection Fund activities.FY <strong>2010</strong>/<strong>2011</strong> GOALS AND OBJECTIVES1. To maintain weekly rubbish and yard waste pick-up and disposal.a. Re-establish a convenience station for residentsNumber <strong>of</strong>residents usingthe conveniencestation2009Actual<strong>2010</strong>Projected<strong>2011</strong>Target350 500 5002. Look at alternate methods <strong>of</strong> providing service given the level <strong>of</strong> funding available.a. Provide a limited recycling program with centralized drop <strong>of</strong>f locationsNumber <strong>of</strong>residents usingthe service2009Actual<strong>2010</strong>Projected<strong>2011</strong>Target100 200 500203
EXPENDITURE ANALYSIS DETAIL<strong>2010</strong>/<strong>2011</strong> APPROVED BUDGET226 - 4581 Rubbish Collection AdministrationAllocation PlanPosition Control<strong>2010</strong>/JOB <strong>2011</strong>PERSONNEL SERVICES CLASSIFICATION BUDGET ALLOCATIONSalaries 23,569 Director <strong>of</strong> Public Services 0.15 15,208Overtime 500 Administrative Pr<strong>of</strong>essional 0.20 8,361Fringe Benefits 108,138Total Personnel 0.35 23,569TOTAL132,207OPERATING EXPENSESOvertime 500Supplies 2,850 FICA 1,842Internal Services 147,916 Healthcare Benefits - Active 5,425Other Services Healthcare Benefits - Retirees 70,632Pr<strong>of</strong>essional Fees 130,419 Pension 30,239Maintenance Fees 17,172Other Contracted Fees 0 Total Fringe Benefits 108,138TOTAL298,357TOTAL 0.35 132,207CAPITAL OUTLAY 0TOTAL0TOTAL APPROPRIATION 430,564204
FUND: 226 – Rubbish Collection FundDEPARTMENT: Public ServicesACTIVITY: 4582 – Rubbish CollectionSTRATEGIC NARRATIVEThe Rubbish Collection division promotes healthy neighborhood environments through weeklyresidential rubbish collection throughout the <strong>City</strong>. On July 1, 2004, the <strong>City</strong> contracted with the Mid-Michigan Waste Authority to collect and process the <strong>City</strong>’s residential rubbish.FY <strong>2010</strong>/<strong>2011</strong> GOALS AND OBJECTIVES1. To service all city residents with weekly collections.a. To provide an accurate household count for pickup2009Actual<strong>2010</strong>Projected<strong>2011</strong>TargetNumber <strong>of</strong>Households 23,313 22,014 21,4452. To inform city residents <strong>of</strong> rubbish rules and regulations thereby reducing environmentalcomplaints.a. Use website to reach out to residents2009Actual<strong>2010</strong>Projected<strong>2011</strong>TargetNumber <strong>of</strong>complaintsfrom residentsusing websiteN/A(Residentsaccessed websitefor pickup info)10 10205
EXPENDITURE ANALYSIS DETAIL<strong>2010</strong>/<strong>2011</strong> APPROVED BUDGET226 - 4582 Rubbish CollectionAllocation PlanPosition Control<strong>2010</strong>/JOB <strong>2011</strong>PERSONNEL SERVICES CLASSIFICATION BUDGET ALLOCATIONSalaries 32,276 Chief ROW Foreman 0.50 32,276Overtime 12,000Fringe Benefits 34,814 Total Personnel 0.50 32,276TOTAL79,090Overtime 12,000OPERATING EXPENSESFICA 3,327Supplies 600 Healthcare Benefits - Active 12,455Internal Services 7,960 Healthcare Benefits - Retirees 0Other Services Pension 19,032Pr<strong>of</strong>essional Fees 1,428,030Maintenance Fees 43,533 Total Fringe Benefits 34,814Other Contracted Fees 0TOTAL1,480,123 TOTAL 0.50 79,090CAPITAL OUTLAY 0TOTAL0<strong>MI</strong>SCELLANEOUS 0TOTAL0TOTAL APPROPRIATION 1,559,213206
FUND: 226 – Rubbish Collection FundDEPARTMENT: Public ServicesACTIVITY: 4583 – Environmental ImprovementSTRATEGIC NARRATIVEThe function <strong>of</strong> the Environmental Improvement division is to investigate and seek resolution tocomplaints regarding trash and debris in interior yards, junk or inoperable vehicles, and other nuisancecomplaints.FY <strong>2010</strong>/<strong>2011</strong> GOALS AND OBJECTIVES1. To investigate and seek resolution to complaints filed under the <strong>City</strong> <strong>of</strong> <strong>Saginaw</strong>’s General Coderegarding trash, debris, and inoperable vehicles.a. Reduce the number <strong>of</strong> complaints by educating the residentsNumber <strong>of</strong>ComplaintsLogged2009Actual<strong>2010</strong>Projected<strong>2011</strong>Target3,004 3,000 2,500207
EXPENDITURE ANALYSIS DETAIL<strong>2010</strong>/<strong>2011</strong> APPROVED BUDGET226 - 4583 Environmental ImprovementAllocation PlanPosition Control<strong>2010</strong>/JOB <strong>2011</strong>PERSONNEL SERVICES CLASSIFICATION BUDGET ALLOCATIONSalaries 31,376 Environ. Support Specialist 1.00 31,376Overtime 6,000Fringe Benefits 99,861 Total Personnel 1.00 31,376TOTAL137,237Overtime 6,000OPERATING EXPENSESFICA 3,047Supplies 28,700 Healthcare Benefits - Active 16,458Internal Services 10,747 Healthcare Benefits - Retirees 42,392Other Services Pension 37,964Pr<strong>of</strong>essional Fees 100,000Maintenance Fees 6,500 Total Fringe Benefits 99,861Other Contracted Fees 250TOTAL146,197 TOTAL 1.00 137,237CAPITAL OUTLAY 0TOTAL0TOTAL APPROPRIATION 283,434208
FUND: 226 – Rubbish Collection FundDEPARTMENT: Public ServicesACTIVITY: 4584 – Sanitary LandfillSTRATEGIC NARRATIVEThe Sanitary Landfill division provides for seasonal citywide curbside collection <strong>of</strong> non-commerciallycut brush. Brush is collected the first through the fifteenth on the West side and on the sixteenth throughthe 31 st , on the East Side. The <strong>City</strong> will provide the human resources and equipment to operate the brushcollection service.FY <strong>2010</strong>/<strong>2011</strong> GOALS AND OBJECTIVES1. To provide and maintain a seasonal brush collection service to all residents.a. To track the number <strong>of</strong> loads delivered to the compost site2009Actual<strong>2010</strong>Projected<strong>2011</strong>TargetNumber<strong>of</strong> Loads 100 150 150209
FUND: 226 – Rubbish Collection FundDEPARTMENT: Public ServicesACTIVITY: 4587 – CompostingSTRATEGIC NARRATIVEThe Composting division provides for the collection and composting <strong>of</strong> yard waste collected from <strong>City</strong>residents, in compliance with the State <strong>of</strong> Michigan’s requirement to divert all yard waste from landfills.The <strong>City</strong> has a contract with the Mid-Michigan Waste Authority to process yard waste for the authority.The composting site will produce over 20,000 cubic yards <strong>of</strong> compost annually.FY <strong>2010</strong>/<strong>2011</strong> GOALS AND OBJECTIVES1. To comply with State requirement <strong>of</strong> diverting all yard waste from landfills.a. To educate and encourage <strong>City</strong> residents to participate in the composting program2009Actual<strong>2010</strong>Projected<strong>2011</strong>TargetCompostProduced 31,293 30,000 30,0002. Track loads <strong>of</strong> compost delivereda. Number <strong>of</strong> loads delivered by one ton trucks2009Actual<strong>2010</strong>Projected<strong>2011</strong>TargetNumber<strong>of</strong> Loads 50 50 603. To provide composting service, under contract to the Mid-Michigan Waste Authority, to themetropolitan area.a. Yard Waste delivered to compost site2009Actual<strong>2010</strong>Projected<strong>2011</strong>TargetYards <strong>of</strong>Compost 50,000 50,000 50,000210
EXPENDITURE ANALYSIS DETAIL<strong>2010</strong>/<strong>2011</strong> APPROVED BUDGET226 - 4587 CompostingAllocation PlanPosition Control<strong>2010</strong>/JOB <strong>2011</strong>PERSONNEL SERVICES CLASSIFICATION BUDGET ALLOCATIONSalaries 85,359 Compost Site Operator 2.00 85,359Overtime 50,000Fringe Benefits 111,230 Total Personnel 2.00 85,359TOTAL246,589Overtime 50,000OPERATING EXPENSESFICA 10,843Supplies 40,300 Healthcare Benefits - Active 45,923Internal Services 0 Healthcare Benefits - Retirees 6,374Other Services Pension 48,090Pr<strong>of</strong>essional Fees 60,000Maintenance Fees 139,004 Total Fringe Benefits 111,230Other Contracted Fees 0TOTAL239,304 TOTAL 2.00 246,589CAPITAL OUTLAY 0TOTAL0TOTAL APPROPRIATION 485,893211
PUBLIC SAFETY GRANTS (SRF)
PUBLIC SAFETY FUND (205)RESOURCE ALLOCATION<strong>2010</strong>/<strong>2011</strong> APPROVED BUDGETRESOURCESAPPROPRIATIONSPROPERTY TAXES 3,085,985 POLICE PATROL 1,609,952OTHER REVENUES 5,280 POLICE INVESTIGATION 689,737TRANSFERS IN 784,936 FIRE SUPPRESSION 1,463,065FIRE PREVENTION 113,447TOTAL RESOURCES 3,876,201 TOTAL APPROPRIATIONS 3,876,201212
EXPENDITURE ANALYSIS SUMMARY<strong>2010</strong>/<strong>2011</strong> APPROVED BUDGET<strong>2010</strong> <strong>2010</strong> <strong>2011</strong>2007 2008 2009 Approved Adjusted <strong>2010</strong> ApprovedActual Actual Actual <strong>Budget</strong> <strong>Budget</strong> Projected <strong>Budget</strong>REVENUE ANALYSIS SUMMARYProperty Taxes 3,623,078 3,745,636 3,638,312 3,745,636 3,524,674 3,424,297 3,085,985Other Revenues 0 0 0 0 0 0 5,280Transfers from Other Funds 0 249,284 234,902 249,284 265,775 627,545 784,936TOTAL RESOURCE 3,623,078 3,994,920 3,873,214 3,994,920 3,790,449 4,051,842 3,876,2013011 POLICE PATROLEXPENDITURE ANALYSIS SUMMARYPersonnel Services 2,126,149 1,943,727 1,716,119 1,623,678 1,623,678 1,717,958 1,609,952Operating Expenses 0 0 0 0 0 0 0Capital Outlay 0 0 0 0 0 0 0TOTALS 2,126,149 1,943,727 1,716,119 1,623,678 1,623,678 1,717,958 1,609,9523013 POLICE INVESTIGATIONPersonnel Services 418,653 445,437 641,220 554,803 554,803 773,264 689,737Operating Expenses 0 0 0 0 0 0 0Capital Outlay 0 0 0 0 0 0 0TOTALS 418,653 445,437 641,220 554,803 554,803 773,264 689,7373751 FIRE SUPPRESSIONPersonnel Services 1,530,806 1,561,688 1,405,443 1,504,357 1,504,357 1,441,988 1,463,065Operating Expenses 0 0 0 0 0 0 0Capital Outlay 0 0 0 0 0 0 0TOTALS 1,530,806 1,561,688 1,405,443 1,504,357 1,504,357 1,441,988 1,463,0653753 FIRE PREVENTIONPersonnel Services 89,142 100,327 110,430 107,611 107,611 118,633 113,447Operating Expenses 0 0 0 0 0 0 0Capital Outlay 0 0 0 0 0 0 0TOTALS 89,142 100,327 110,430 107,611 107,611 118,633 113,447213
EXPENDITURE ANALYSIS SUMMARY<strong>2010</strong>/<strong>2011</strong> APPROVED BUDGET<strong>2010</strong> <strong>2010</strong> <strong>2011</strong>2007 2008 2009 Approved Adjusted <strong>2010</strong> ApprovedActual Actual Actual <strong>Budget</strong> <strong>Budget</strong> Projected <strong>Budget</strong>TOTAL PUBLIC SAFETY FUNDPersonnel Services 4,164,750 4,051,179 3,873,212 3,790,449 3,790,449 4,051,842 3,876,201Operating Expenses 0 0 0 0 0 0 0Capital Outlay 0 0 0 0 0 0 0Miscellaneous 0 0 0 0 0 0 0TOTALEXPENDITURES 4,164,750 4,051,179 3,873,212 3,790,449 3,790,449 4,051,842 3,876,201214
POSITION ANALYSIS<strong>2010</strong>/<strong>2011</strong> APPROVED BUDGET<strong>2010</strong> <strong>2010</strong> <strong>2011</strong>2007 2008 2009 Approved Adjusted <strong>2010</strong> ApprovedActual Actual Actual <strong>Budget</strong> <strong>Budget</strong> Projected <strong>Budget</strong>POLICE AND FIREPolice Patrol 26.00 26.00 23.00 23.00 23.00 23.00 22.00Police Investigation 5.00 5.00 8.00 8.00 8.00 8.00 9.00Fire Suppression 19.00 19.00 19.00 19.00 19.00 19.00 19.00Fire Prevention 1.00 1.00 1.00 1.00 1.00 1.00 1.00TOTAL POSITIONS 51.00 51.00 51.00 51.00 51.00 51.00 51.00In accordance with passage <strong>of</strong> the Public Safety Millage, the FY <strong>2011</strong> Approved <strong>Budget</strong> reflects the same personnel complement<strong>of</strong> 31 Police Officers and 20 Firefighters. The <strong>2010</strong>, 2009, and 2008 Approved <strong>Budget</strong> remains at the same level as the 2007budget, wherein the millage was levied. Due to the passage <strong>of</strong> the Public Safety Millage in May <strong>of</strong> 2006, the <strong>City</strong> is required tohave the total 51 Police and Fire personnel complement within the Public Safety Fund at the same levels as when the millage wasadopted.215
EXPENDITURE ANALYSIS DETAIL<strong>2010</strong>/<strong>2011</strong> APPROVED BUDGET205-3011 Police PatrolAllocation PlanPosition Control<strong>2010</strong>/JOB <strong>2011</strong>PERSONNEL SERVICES CLASSIFICATION BUDGET ALLOCATIONSalaries 1,182,236 Police Lieutenant 1.00 69,419Overtime 61,400 Police Sergeant 3.00 186,861Fringe Benefits 366,316 Police Officer 18.00 925,955TOTAL1,609,952 Total Personnel 22.00 1,182,236OPERATING EXPENSES Overtime 61,400Supplies 0Internal Services 0 FICA 18,248Other Services Healthcare Benefits - Active 348,068Pr<strong>of</strong>essional Fees 0 Healthcare Benefits - Retirees 0Maintenance Fees 0 Pension - Sworn 0Other Contracted Fees 0Total Fringe Benefits 366,316TOTAL0CAPITAL OUTLAY 0TOTAL 22.00 1,609,952TOTAL0TOTAL APPROPRIATION 1,609,952216
EXPENDITURE ANALYSIS DETAIL<strong>2010</strong>/<strong>2011</strong> APPROVED BUDGET205-3013 Police InvestigationAllocation PlanPosition Control<strong>2010</strong>/JOB <strong>2011</strong>PERSONNEL SERVICES CLASSIFICATION BUDGET ALLOCATIONSalaries 486,773 Police Sergeant 2.00 123,825Overtime 52,400 Police Officer 7.00 362,948Fringe Benefits 150,564Total Personnel 9.00 486,773TOTAL689,737OPERATING EXPENSESOvertime 52,400Supplies 0 FICA 7,007Internal Services 0 Healthcare Benefits - Active 143,557Other Services Healthcare Benefits - Retirees 0Pr<strong>of</strong>essional Fees 0 Pension - Sworn 0Maintenance Fees 0Other Contracted Fees 0 Total Fringe Benefits 150,564TOTAL0 TOTAL 9.00 689,737CAPITAL OUTLAY 0TOTAL0TOTAL APPROPRIATION 689,737217
EXPENDITURE ANALYSIS DETAIL<strong>2010</strong>/<strong>2011</strong> APPROVED BUDGET205-3751 Fire SuppressionAllocation PlanPosition Control<strong>2010</strong>/JOB <strong>2011</strong>PERSONNEL SERVICES CLASSIFICATION BUDGET ALLOCATIONSalaries 1,043,344 Fire Battalion Chief 2.00 154,462Overtime 80,000 Fire Captain 1.00 70,306Fringe Benefits 339,721 Fire Engineers 8.00 558,822Firefighter 8.00 259,754TOTAL1,463,065Total Personnel 19.00 1,043,344OPERATING EXPENSESOvertime 80,000Supplies 0Internal Services 0Other Services FICA 14,592Pr<strong>of</strong>essional Fees 0 Healthcare Benefits - Active 325,129Maintenance Fees 0 Healthcare Benefits - Retirees 0Other Contracted Fees 0 Pension - Sworn 0TOTAL0 Total Fringe Benefits 339,721CAPITAL OUTLAY 0TOTAL 19.00 1,463,065TOTAL0TOTAL APPROPRIATION 1,463,065218
EXPENDITURE ANALYSIS DETAIL<strong>2010</strong>/<strong>2011</strong> APPROVED BUDGET205-3753 Fire PreventionAllocation PlanPosition Control<strong>2010</strong>/JOB <strong>2011</strong>PERSONNEL SERVICES CLASSIFICATION BUDGET ALLOCATIONSalaries 77,044 Fire Marshall 1.00 77,044Overtime 15,000Fringe Benefits 21,403 Total Personnel 1.00 77,044TOTAL113,447Overtime 15,000OPERATING EXPENSESFICA 1,623Supplies 0 Healthcare Benefits - Active 19,780Internal Services 0 Healthcare Benefits - Retirees 0Other Services Pension - Sworn 0Pr<strong>of</strong>essional Fees 0Maintenance Fees 0 Total Fringe Benefits 21,403Other Contracted Fees 0TOTAL 1.00 113,447TOTAL0CAPITAL OUTLAY 0TOTAL0TOTAL APPROPRIATION 113,447219
This page is intentionally left blank
PUBLIC SAFETY GRANTSRESOURCE ALLOCATION<strong>2010</strong>/<strong>2011</strong> APPROVED BUDGETRESOURCESAPPROPRIATIONSCOMMUNITY POLICING 1,083,671 COMMUNITY POLICING 1,083,671POLICE TRAINING FUND 21,000 POLICE TRAINING FUND 21,000DEPT OF JUSTICE GRANT 349,759 DEPT OF JUSTICE GRANT 349,759DRUG FORFEITURE FUND 70,503 DRUG FORFEITURE FUND 70,503YOUTH INITIATIVE FUND 139,456 YOUTH INITIATIVE FUND 139,456AUTO THEFT PREVENTION 120,189 AUTO THEFT PREVENTION 120,189TOTAL RESOURCES 1,784,578 TOTAL APPROPRIATIONS 1,784,578220
POSITION ANALYSIS<strong>2010</strong>/<strong>2011</strong> APPROVED BUDGET<strong>2010</strong> <strong>2010</strong> <strong>2011</strong>2007 2008 2009 Approved Adjusted <strong>2010</strong> ApprovedActual Actual Actual <strong>Budget</strong> <strong>Budget</strong> Projected <strong>Budget</strong>SPECIAL REVENUE FUND - PUBLIC SAFETY GRANTSCommunity Policing 3.00 3.00 4.00 4.00 4.00 4.00 9.00Drug Forfeiture 1.00 1.00 0.00 0.00 0.00 0.00 0.00Youth Initiative 2.00 2.00 2.00 2.00 2.00 2.00 1.00Auto Theft Prevention 1.00 1.00 1.00 1.00 1.00 1.00 1.00TOTAL POSITIONS 7.00 7.00 7.00 7.00 7.00 7.00 11.00The <strong>2010</strong>/<strong>2011</strong> Approved <strong>Budget</strong> for the Public Safety Grant will increase, in total <strong>of</strong> 4 positions. In <strong>2010</strong>, the <strong>City</strong> was a receipient <strong>of</strong> a federalfunded grant - the COPs Hiring Grant. This grant added five police <strong>of</strong>ficers to the 100 sworn police complement. In <strong>2011</strong>, the <strong>City</strong> reflects thisaddition <strong>of</strong> these new <strong>of</strong>ficers. However, this increase is <strong>of</strong>fset by the elimination <strong>of</strong> one police <strong>of</strong>ficer in the Youth Initiative Fund. This police<strong>of</strong>ficer was funded by grant monies that has been decreasing over the last few years. In <strong>2011</strong>, this fund can no longer support two full-time<strong>of</strong>ficers.221
COMMUNITY POLICING (260)<strong>2010</strong>/<strong>2011</strong> APPROVED BUDGET<strong>2010</strong> <strong>2010</strong> <strong>2011</strong>2007 2008 2009 Approved Adjusted <strong>2010</strong> ApprovedActual Actual Actual <strong>Budget</strong> <strong>Budget</strong> Projected <strong>Budget</strong>REVENUE ANALYSIS SUMMARYGrants 0 0 310,956 85,000 403,500 276,872 684,836Interest and Rents 22 27 16 0 0 (2) 0Other Revenues 1,395 0 0 0 483 183,988 0Transfers from Other Funds 304,745 283,329 386,756 349,006 349,006 349,006 398,835TOTAL RESOURCES 306,162 283,356 697,728 434,006 752,989 809,864 1,083,6713320 COMMUNITY POLICINGPersonnel Services 289,499 271,458 376,486 384,106 384,126 398,607 386,278Operating Expenses 10,227 11,198 10,270 9,900 9,880 10,265 12,557Capital Outlay 6,438 700 0 0 0 0 0TOTALS 306,165 283,356 386,756 394,006 394,006 408,872 398,8353321 WEED AND SEED GRANTPersonnel Services 0 0 0 0 0 0 0Operating Expenses 0 0 29,163 40,000 117,409 96,296 42,000Capital Outlay 0 0 15,352 0 29,574 29,466 0TOTALS 0 0 44,515 40,000 146,983 125,762 42,0003327 SHOTSPOTTERPersonnel Services 0 0 2,290 0 0 0 0Operating Expenses 0 0 0 0 0 0 0Capital Outlay 0 0 264,150 0 212,000 162,000 300,000TOTALS 0 0 266,440 0 212,000 162,000 300,0003328 COPS HIRING GRANTPersonnel Services 0 0 0 0 25,234 113,231 342,836Operating Expenses 0 0 0 0 0 0 0Capital Outlay 0 0 0 0 0 0 0TOTALS 0 0 0 0 25,234 113,231 342,8368559 INCREASE IN FUND EQUITYEXPENDITURE ANALYSIS SUMMARYPersonnel Services 0 0 0 0 0 0 0Operating Expenses 0 0 0 0 0 0 0Capital Outlay 0 0 0 0 0 0 0Miscellaneous 0 3,002 0 0 0 0 0TOTALS 0 3,002 0 0 0 0 0222
COMMUNITY POLICING (260)<strong>2010</strong>/<strong>2011</strong> APPROVED BUDGET<strong>2010</strong> <strong>2010</strong> <strong>2011</strong>2007 2008 2009 Approved Adjusted <strong>2010</strong> ApprovedActual Actual Actual <strong>Budget</strong> <strong>Budget</strong> Projected <strong>Budget</strong>TOTAL COMMUNITY POLICINGPersonnel Services 289,499 271,458 378,776 384,106 409,360 511,838 729,114Operating Expenses 10,227 11,198 39,433 49,900 127,289 106,561 54,557Capital Outlay 6,438 700 279,502 0 241,574 191,466 300,000Miscellaneous 0 3,002 0 0 0 0 0TOTAL EXPENDITURES 306,165 286,358 697,711 434,006 778,223 809,864 1,083,671223
FUND: 260 – Community Policing Program FundDEPARTMENT: PoliceACTIVITY: 3320 – Community PolicingSTRATEGIC NARRATIVEThe Community Policing Unit consists <strong>of</strong> nine <strong>of</strong>ficers. These <strong>of</strong>ficers are assigned to specificdesignated neighborhood areas under the Community Development Block Grant program andDepartment <strong>of</strong> Justice COPS Hiring Grant. These <strong>of</strong>ficers will work closely with the businesses,schools, churches, and residents in these areas to jointly address issues within these areas.FY <strong>2010</strong>/<strong>2011</strong> GOALS AND OBJECTIVES1. Initiate a tracking and reporting mechanism to better report community policing related servicesperformed by our CPO’s for reporting to citizens and the CDBG oversight.2. To increase citizen participation within the CPO districts.a. Maintain or increase attendance at neighborhood watch meetings.b. Maintain or increase participation in neighborhood initiatives within the district i.e. blockparties, cleanups, etc.c. Maintain or increase number <strong>of</strong> citizen volunteers taking part in citywide initiatives.224
EXPENDITURE ANALYSIS DETAIL<strong>2010</strong>/<strong>2011</strong> APPROVED BUDGET260-3320 Community PolicingAllocation PlanPosition Control<strong>2010</strong>/JOB <strong>2011</strong>PERSONNEL SERVICES CLASSIFICATION BUDGET ALLOCATIONSalaries 207,816 Police Officer 4.00 207,816Overtime 11,300Fringe Benefits 167,162 Total Personnel 4.00 207,816TOTAL386,278Overtime 11,300OPERATING EXPENSESFICA 3,540Supplies 0 Healthcare Benefits - Active 64,293Internal Services 10,649 Healthcare Benefits - Retirees 0Other Services Pension - Sworn 99,329Pr<strong>of</strong>essional Fees 0Maintenance Fees 1,908 Total Fringe Benefits 167,162Other Contracted Fees 0TOTAL12,557 TOTAL 4.00 386,278CAPITAL OUTLAY 0TOTAL0TOTAL APPROPRIATION 398,835225
EXPENDITURE ANALYSIS DETAIL<strong>2010</strong>/<strong>2011</strong> APPROVED BUDGET260-3321 Weed and Seed GrantAllocation PlanPosition Control<strong>2010</strong>/JOB <strong>2011</strong>PERSONNEL SERVICES CLASSIFICATION BUDGET ALLOCATIONSalaries 0Overtime 0 Total Personnel 0.00 0Fringe Benefits 0TOTAL0 Overtime 0OPERATING EXPENSES FICA 0Healthcare Benefits - Active 0Supplies 0 Healthcare Benefits - Retirees 0Internal Services 0 Pension - Sworn 0Other ServicesPr<strong>of</strong>essional Fees 42,000 Total Fringe Benefits 0Maintenance Fees 0Other Contracted Fees 0TOTAL 0.00 0TOTAL42,000CAPITAL OUTLAY 0TOTAL0TOTAL APPROPRIATION 42,000226
EXPENDITURE ANALYSIS DETAIL<strong>2010</strong>/<strong>2011</strong> APPROVED BUDGET260-3327 ShotspotterAllocation PlanPosition Control<strong>2010</strong>/JOB <strong>2011</strong>PERSONNEL SERVICES CLASSIFICATION BUDGET ALLOCATIONSalaries 0Overtime 0 Total Personnel 0.00 0Fringe Benefits 0TOTAL0 Overtime 0OPERATING EXPENSES FICA 0Healthcare Benefits - Active 0Supplies 0 Healthcare Benefits - Retirees 0Internal Services 0 Pension - Sworn 0Other ServicesPr<strong>of</strong>essional Fees 0 Total Fringe Benefits 0Maintenance Fees 0Other Contracted Fees 0TOTAL 0.00 0TOTAL0CAPITAL OUTLAY 300,000TOTAL300,000TOTAL APPROPRIATION 300,000227
EXPENDITURE ANALYSIS DETAIL<strong>2010</strong>/<strong>2011</strong> APPROVED BUDGET260-3328 COPS Hiring GrantAllocation PlanPosition Control<strong>2010</strong>/JOB <strong>2011</strong>PERSONNEL SERVICES CLASSIFICATION BUDGET ALLOCATIONSalaries 244,639 Police Officers 5.00 244,639Overtime 0Fringe Benefits 96,197 Total Personnel 5.00 244,639TOTAL340,836Overtime 0OPERATING EXPENSESFICA 3,571Supplies 0 Healthcare Benefits - Active 80,997Internal Services 0 Healthcare Benefits - Retirees 0Other Services Pension - Sworn 11,629Pr<strong>of</strong>essional Fees 0Maintenance Fees 0 Total Fringe Benefits 96,197Other Contracted Fees 0TOTAL0 TOTAL 5.00 340,836CAPITAL OUTLAY 0TOTAL0TOTAL APPROPRIATION 340,836228
POLICE TRAINING (261)<strong>2010</strong>/<strong>2011</strong> APPROVED BUDGET<strong>2010</strong> <strong>2010</strong> <strong>2011</strong>2007 2008 2009 Approved Adjusted <strong>2010</strong> ApprovedActual Actual Actual <strong>Budget</strong> <strong>Budget</strong> Projected <strong>Budget</strong>REVENUE ANALYSIS SUMMARYState Grants 20,607 21,309 17,991 21,000 25,000 19,417 21,000Interest and Rents 0 37 142 0 0 31 0Other Revenues 40 0 0 0 0 6,935 0TOTAL RESOURCES 20,647 21,346 18,133 21,000 25,000 26,383 21,0003323 POLICE TRAININGEXPENDITURE ANALYSIS SUMMARYPersonnel Services 0 0 0 0 0 0 0Operating Expenses 20,647 21,346 18,132 21,000 25,000 26,383 21,000Capital Outlay 0 0 0 0 0 0 0TOTALS 20,647 21,346 18,132 21,000 25,000 26,383 21,000TOTAL POLICE TRAININGPersonnel Services 0 0 0 0 0 0 0Operating Expenses 20,647 21,346 18,132 21,000 25,000 26,383 21,000Capital Outlay 0 0 0 0 0 0 0TOTALEXPENDITURES 20,647 21,346 18,132 21,000 25,000 26,383 21,000229
FUND: 261 – Police Criminal Justice Training FundDEPARTMENT: PoliceACTIVITY: 3323 – Criminal Justice TrainingSTRATEGIC NARRATIVEThe monies appropriated in this fund are generated from Michigan Act 302 <strong>of</strong> the Public Acts <strong>of</strong> 1982.These funds are derived from fines attached to all civil infractions statewide.During FY 2009/<strong>2010</strong> this allocation assisted the department in financing several key training programs,and the purchase <strong>of</strong> ammunition for the Police Department range. During FY 2009/<strong>2010</strong> the Trainingdivision will concentrate on continuing annual in-service training programs for all <strong>of</strong>ficers, identify andtrain <strong>of</strong>ficers as instructors in a variety <strong>of</strong> areas.FY <strong>2010</strong>/<strong>2011</strong> GOALS AND OBJECTIVES1. To increase the number <strong>of</strong> certified field training <strong>of</strong>ficers by 25% to facilitate training <strong>of</strong> newhires.2. To arrange for at least one high level executive to attend an advanced management trainingcourse i.e. FBI academy, Police Staff and Command, Law Enforcement Leadership Institute(LELI) so as to provide for a stronger based and proper management for the department.3. To identify new areas <strong>of</strong> training in which the workforce may be deficient and to address thosedeficiencies.230
EXPENDITURE ANALYSIS DETAIL<strong>2010</strong>/<strong>2011</strong> APPROVED BUDGET261-3323 Police TrainingAllocation PlanPosition Control<strong>2010</strong>/JOB <strong>2011</strong>PERSONNEL SERVICES CLASSIFICATION BUDGET ALLOCATIONSalaries 0Overtime 0 Total Personnel 0.00 0Fringe Benefits 0TOTAL0 Overtime 0OPERATING EXPENSES FICA 0Healthcare Benefits - Active 0Supplies 2,000 Healthcare Benefits - Retirees 0Internal Services 0 Pension - Sworn 0Other ServicesPr<strong>of</strong>essional Fees 0 Total Fringe Benefits 0Maintenance Fees 0Other Contracted Fees 19,000TOTAL 0.00 0TOTAL21,000CAPITAL OUTLAY 0TOTAL0TOTAL APPROPRIATION 21,000231
DEPARTMENT OF JUSTICE GRANT (263)<strong>2010</strong>/<strong>2011</strong> APPROVED BUDGET<strong>2010</strong> <strong>2010</strong> <strong>2011</strong>2007 2008 2009 Approved Adjusted <strong>2010</strong> ApprovedActual Actual Actual <strong>Budget</strong> <strong>Budget</strong> Projected <strong>Budget</strong>REVENUE ANALYSIS SUMMARYState Grants 0 0 0 546,196 546,196 219,716 349,759Interest and Rents 0 0 0 0 0 (109) 0Transfers 0 0 0 0 0 0 0TOTAL RESOURCES 0 0 0 546,196 546,196 219,607 349,759EXPENDITURE ANALYSIS SUMMARY3321 D.O.J. GRANTPersonnel Services 0 0 0 8,643 8,643 0 0Operating Expenses 0 0 0 64,253 64,253 57,228 64,253Capital Outlay 0 0 0 473,300 473,300 162,379 285,506TOTALS 0 0 0 546,196 546,196 219,607 349,759TOTAL D.O.J. GRANTPersonnel Services 0 0 0 8,643 8,643 0 0Operating Expenses 0 0 0 64,253 64,253 57,228 64,253Capital Outlay 0 0 0 473,300 473,300 162,379 285,506TOTALEXPENDITURES 0 0 0 546,196 546,196 219,607 349,759232
EXPENDITURE ANALYSIS DETAIL<strong>2010</strong>/<strong>2011</strong> APPROVED BUDGET263-3321 Department <strong>of</strong> Justice GrantAllocation PlanPosition Control<strong>2010</strong>/JOB <strong>2011</strong>PERSONNEL SERVICES CLASSIFICATION BUDGET ALLOCATIONSalaries 0Overtime 0 Total Personnel 0.00 0Fringe Benefits 0TOTAL0 Overtime 0OPERATING EXPENSES FICA 0Healthcare Benefits - Active 0Supplies 33,453 Healthcare Benefits - Retirees 0Internal Services 0 Pension - Sworn 0Other ServicesPr<strong>of</strong>essional Fees 0 Total Fringe Benefits 0Maintenance Fees 0Other Contracted Fees 30,800TOTAL 0.00 0TOTAL64,253CAPITAL OUTLAY 285,506TOTAL285,506TOTAL APPROPRIATION 349,759233
DRUG FORFEITURE FUND (264)<strong>2010</strong>/<strong>2011</strong> APPROVED BUDGET<strong>2010</strong> <strong>2010</strong> <strong>2011</strong>2007 2008 2009 Approved Adjusted <strong>2010</strong> ApprovedActual Actual Actual <strong>Budget</strong> <strong>Budget</strong> Projected <strong>Budget</strong>REVENUE ANALYSIS SUMMARYFederal Grants 3,372 4,989 10,687 0 9,670 9,669 10,687Fines and Forfeitures 41,610 22,674 365,485 49,570 49,570 38,527 51,816Interest and Rents 16,813 14,521 7,407 5,000 5,000 2,741 5,000Other Revenues 1,450 0 1,270 15,933 90,285 67,563 3,000Transfers from Other Funds 12,398 0 0 0 0 0 0TOTAL RESOURCES 75,643 42,184 384,849 70,503 154,525 118,501 70,503EXPENDITURE ANALYSIS SUMMARY3040 DRUG FORFEITUREPersonnel Services 100,840 0 0 0 0 0 0Operating Expenses 53,371 37,920 63,026 70,503 154,525 118,501 70,503Capital Outlay 0 0 950 0 0 0 0TOTALS 154,210 37,920 63,976 70,503 154,525 118,501 70,503TOTAL DRUG FORFEITUREPersonnel Services 100,840 0 0 0 0 0 0Operating Expenses 53,371 37,920 63,026 70,503 154,525 118,501 70,503Capital Outlay 0 0 950 0 0 0 0Miscellaneous 0 0 0 0 0 0 0TOTAL EXPENDITURES 154,211 37,920 63,976 70,503 154,525 118,501 70,503234
FUND: 264 – Drug Forfeiture FundDEPARTMENT: PoliceACTIVITY: 3040 – Drug ForfeitureSTRATEGIC NARRATIVEThe Drug Forfeiture Fund accounts for all expenditures and revenues from forfeiture <strong>of</strong> cash andproperty seized by law enforcement personnel during drug related investigations. Funds are used forpolice overtime costs on drug-related cases, informant funds, and support <strong>of</strong> the department’s canineprogram.FY <strong>2010</strong>/<strong>2011</strong> GOALS AND OBJECTIVES1. To provide funds from drug-related forfeitures to be used by the Police Department to continueinvestigation <strong>of</strong> drug-related activities.a. Maintain and/or increase current level <strong>of</strong> drug interdiction efforts.2. To work with the Department <strong>of</strong> Fiscal Services to establish a complete accounting and trackingsystem for both State and Federal Forfeiture funds.a. To obtain full accounting and useable access to available forfeiture funds.3. To increase research needed, and develop a use for available forfeiture funds that bestadvantages the department.a. In car digital video systemsb. Acquisition <strong>of</strong> surveillance equipment.c. Drug resistance education program for at risk youths.235
EXPENDITURE ANALYSIS DETAIL<strong>2010</strong>/<strong>2011</strong> APPROVED BUDGET264-3040 Drug Forfeiture FundAllocation PlanPosition Control<strong>2010</strong>/JOB <strong>2011</strong>PERSONNEL SERVICES CLASSIFICATION BUDGET ALLOCATIONSalaries 0Overtime 0 Total Personnel 0.00 0Fringe Benefits 0TOTAL0 Overtime 0OPERATING EXPENSES FICA 0Healthcare Benefits - Active 0Supplies 19,933 Healthcare Benefits - Retirees 0Internal Services 0 Pension - Sworn 0Other ServicesPr<strong>of</strong>essional Fees 35,500 Total Fringe Benefits 0Maintenance Fees 15,070Other Contracted Fees 0TOTAL 0.00 0TOTAL70,503CAPITAL OUTLAY 0TOTAL0TOTAL APPROPRIATION 70,503236
YOUTH INITIATIVE FUND (265)<strong>2010</strong>/<strong>2011</strong> APPROVED BUDGET<strong>2010</strong> <strong>2010</strong> <strong>2011</strong>2007 2008 2009 Approved Adjusted <strong>2010</strong> ApprovedActual Actual Actual <strong>Budget</strong> <strong>Budget</strong> Projected <strong>Budget</strong>REVENUE ANALYSIS SUMMARYFederal Grants 0 0 0 0 0 (28,032) 0Other Revenues 188,900 212,650 222,050 216,586 235,576 224,403 103,000Transfers from Other Funds 20,428 10,017 5,566 0 0 0 36,456TOTAL RESOURCES 209,328 222,667 227,616 216,586 235,576 196,371 139,4563325 YOUTH INITIATIVEEXPENDITURE ANALYSIS SUMMARYPersonnel Services 183,506 198,663 210,892 183,845 202,835 182,932 128,399Operating Expenses 26,547 28,103 16,723 32,741 32,741 13,438 11,057Capital Outlay 0 0 0 0 0 0 0TOTALS 210,053 226,766 227,615 216,586 235,576 196,371 139,4568559 INCREASE IN FUND EQUITYPersonnel Services 0 0 0 0 0 0 0Operating Expenses 0 0 0 0 0 0 0Capital Outlay 0 0 0 0 0 0 0Miscellaneous 0 136,938 0 0 0 0 0TOTALS 0 136,938 0 0 0 0 0TOTAL YOUTH INITIATIVE FUNDPersonnel Services 183,506 198,663 210,892 183,845 202,835 182,932 128,399Operating Expenses 26,547 28,103 16,723 32,741 32,741 13,438 11,057Capital Outlay 0 0 0 0 0 0 0Miscellaneous 0 136,938 0 0 0 0 0TOTAL EXPENDITURES 210,053 363,704 227,615 216,586 235,576 196,371 139,456237
FUND: 265 – Youth Initiative Grant FundDEPARTMENT: PoliceACTIVITY: 3325 – Youth InitiativeSTRATEGIC NARRATIVEThe Youth Initiative Grant Fund is to manage the prevention/treatment <strong>of</strong> adolescent/family substanceabuse program that will enhance self-awareness, self-concept/esteem and reduce substance usage. Theprogram success will be achieved through the implementation <strong>of</strong> a referral system allowing youths toenter the program through screening from the <strong>Saginaw</strong> County Family Court and a variety <strong>of</strong>community services. The grant is provided through the Michigan Department <strong>of</strong> Community Health.FY <strong>2010</strong>/<strong>2011</strong> GOALS AND OBJECTIVES1. To track, record and increase by 5% the number <strong>of</strong> follow-up home and school visits with at riskjuveniles registered in the <strong>Saginaw</strong> Police Appreciate Children Every Day Prevention Program.Number <strong>of</strong> Youthcounseledthrough program2009Actual<strong>2010</strong>Projected<strong>2011</strong>Target2,000 2,500 3,0002. To conduct a minimum <strong>of</strong> six individual FYI level III programs with the partnership <strong>of</strong> DOTCaring Center and Pr<strong>of</strong>essional Psychological Psychiatric Services.a. Complete 25% more pre and post surveys,b. Increase the number <strong>of</strong> information on drug, and gang prevention curriculumc. Increase the number <strong>of</strong> youth to mentor that attend the program.3. To introduce an anti-illegal message through the Project Safe Neighborhood program or a<strong>Saginaw</strong> Police Department devised curriculum.a. Increase the number <strong>of</strong> times this message (anti-gun/gang) will be issued formallyb. Increase the number <strong>of</strong> people to educate on the Project Safe Neighborhood program238
EXPENDITURE ANALYSIS DETAIL<strong>2010</strong>/<strong>2011</strong> APPROVED BUDGET265-3325 Youth InitiativeAllocation PlanPosition Control<strong>2010</strong>/JOB <strong>2011</strong>PERSONNEL SERVICES CLASSIFICATION BUDGET ALLOCATIONSalaries 51,817 Police Officer 1.00 51,817Overtime 10,000Fringe Benefits 66,582 Total Personnel 1.00 51,817TOTAL128,399Overtime 10,000OPERATING EXPENSESFICA 897Supplies 0 Healthcare Benefits - Active 16,033Internal Services 5,057 Healthcare Benefits - Retirees 0Other Services Pension - Sworn 49,652Pr<strong>of</strong>essional Fees 6,000Maintenance Fees 0 Total Fringe Benefits 66,582Other Contracted Fees 0TOTAL11,057 TOTAL 1.00 128,399CAPITAL OUTLAY 0TOTAL0TOTAL APPROPRIATION 139,456239
AUTO THEFT PREVENTION (289)<strong>2010</strong>/<strong>2011</strong> APPROVED BUDGET<strong>2010</strong> <strong>2010</strong> <strong>2011</strong>2007 2008 2009 Approved Adjusted <strong>2010</strong> ApprovedActual Actual Actual <strong>Budget</strong> <strong>Budget</strong> Projected <strong>Budget</strong>REVENUE ANALYSIS SUMMARYState Grants 70,604 65,701 54,750 72,175 72,175 47,021 55,458Other Revenues 3,322 2,437 1,041 0 0 2,245 1,000Transfers from Other Funds 48,645 55,403 74,577 87,779 87,779 87,779 63,731TOTAL RESOURCES 122,571 123,541 130,368 159,954 159,954 137,044 120,1893322 AUTO THEFT PREVENTIONEXPENDITURE ANALYSIS SUMMARYPersonnel Services 104,194 85,082 101,336 98,984 98,984 101,996 97,491Operating Expenses 17,422 14,790 17,602 60,970 60,970 17,654 22,698Capital Outlay 1,696 2,905 0 0 0 0 0TOTALS 123,312 102,777 118,938 159,954 159,954 119,650 120,1899660 TRANSFER OUTPersonnel Services 0 0 0 0 0 0 0Operating Expenses 0 0 0 0 0 0 0Capital Outlay 0 0 0 0 0 0 0Miscellaneous 0 20,763 0 0 0 0 0TOTALS 0 20,763 0 0 0 0 0TOTAL AUTO THEFT PREVENTION FUNDPersonnel Services 104,194 85,082 101,336 98,984 98,984 101,996 97,491Operating Expenses 17,422 14,790 17,602 60,970 60,970 17,654 22,698Capital Outlay 1,696 2,905 0 0 0 0 0Miscellaneous 0 20,763 0 0 0 0 0TOTAL EXPENDITURES 123,312 123,540 118,938 159,954 159,954 119,650 120,189240
FUND: 289 – Automobile Theft Prevention FundDEPARTMENT: PoliceACTIVITY: 3322 – Auto Theft PreventionSTRATEGIC NARRATIVEThis is a multi-jurisdictional cooperative program sponsored, and partially supported (60%), by the State<strong>of</strong> Michigan’s Automobile Theft Prevention Authority (ATPA). The <strong>Saginaw</strong> County Auto Theft Team(SCATT) is comprised <strong>of</strong> investigators from three agencies and one clerical support person that processand investigate 90% <strong>of</strong> all auto theft related criminal complaints in <strong>Saginaw</strong> County. Some <strong>of</strong> the morecommon SCATT investigations include car jacking, larceny, embezzlement, fraud, chop shops and falsepolice reports.FY <strong>2010</strong>/<strong>2011</strong> GOALS AND OBJECTIVES1. To increase by 5% arrests on motor vehicle theft related crimes.Number <strong>of</strong>Arrest due toMotor VehicleTheft2009Actual7-1-09 to 7-1-1085 cars<strong>2010</strong>ProjectedNot Availableyet<strong>2011</strong>TargetNot Availableyet2. To develop and implement a system <strong>of</strong> using crime analysis information and information sharingwith uniform patrol to track UDAA patterns and suspects to recover more in stolen vehicles/partsequipment value than the ATPA’s total approved project budget.a. Increase active investigation/participation with strap metal yards and auto junk dealers inthe area in an effort to recover stolen vehicles and car parts.3. To achieve an overall conviction rate <strong>of</strong> 70%.241
EXPENDITURE ANALYSIS DETAIL<strong>2010</strong>/<strong>2011</strong> APPROVED BUDGET289-3322 Auto Theft PreventionAllocation PlanPosition Control<strong>2010</strong>/JOB <strong>2011</strong>PERSONNEL SERVICES CLASSIFICATION BUDGET ALLOCATIONSalaries 52,266 Police Officer 1.00 52,266Overtime 3,000Fringe Benefits 42,225 Total Personnel 1.00 52,266TOTAL97,491Overtime 3,000OPERATING EXPENSESFICA 818Supplies 1,750 Healthcare Benefits - Active 16,582Internal Services 4,648 Healthcare Benefits - Retirees 0Other Services Pension - Sworn 24,825Pr<strong>of</strong>essional Fees 10,900Maintenance Fees 5,200 Total Fringe Benefits 42,225Other Contracted Fees 200TOTAL22,698 TOTAL 1.00 97,491CAPITAL OUTLAY 0TOTAL0TOTAL APPROPRIATION 120,189242
TIFA/LDFA/DDA (SRF)
ANDERSEN ENRICHMENT CENTER (236)RESOURCE ALLOCATION<strong>2010</strong>/<strong>2011</strong> APPROVED BUDGETRESOURCESAPPROPRIATIONSFEDERAL GRANTS 36,939 ANDERSEN ENRICH. CTR. 136,786INTEREST 49,589 ENRICHMENT COM<strong>MI</strong>SSION 140,600OTHER REVENUES 179,184TRANSFERS IN 11,674TOTAL RESOURCES 277,386 TOTAL APPROPRIATIONS 277,386243
ANDERSEN ENRICHMENT CENTER (236)<strong>2010</strong>/<strong>2011</strong> APPROVED BUDGET<strong>2010</strong> <strong>2010</strong> <strong>2011</strong>2007 2008 2009 Approved Adjusted <strong>2010</strong> ApprovedActual Actual Actual <strong>Budget</strong> <strong>Budget</strong> Projected <strong>Budget</strong>REVENUE ANALYSIS SUMMARYFederal Grants 26,250 23,825 30,050 185,745 187,245 24,535 36,939Interest and Rents 62,389 57,193 48,937 51,757 51,757 50,001 49,589Other Revenues 85,092 163,652 168,162 15,000 15,000 140,630 179,184Transfers from Other Funds 0 11,290 16,202 10,412 10,412 10,412 11,674TOTAL RESOURCES 173,731 255,960 263,351 262,914 264,414 225,578 277,3867540 ANDERSEN ENRICHMENT CENTEREXPENDITURE ANALYSIS SUMMARYPersonnel Services 52,547 93,838 87,877 96,361 96,361 84,230 95,278Operating Expenses 41,496 38,826 43,072 41,497 42,757 39,272 41,508Capital Outlay 1,188 0 0 0 240 240 0TOTALS 95,231 132,664 130,949 137,858 139,358 123,742 136,7867541 ENRICHMENT COM<strong>MI</strong>SSIONPersonnel Services 0 0 0 0 0 0 0Operating Expenses 83,264 124,865 118,980 125,056 125,056 91,062 140,600Capital Outlay 0 0 0 0 0 0 0TOTALS 83,264 124,865 118,980 125,056 125,056 91,062 140,600TOTAL ANDERSEN ENRICHMENT CENTERPersonnel Services 52,547 93,838 87,877 96,361 96,361 84,230 95,278Operating Expenses 124,760 163,691 162,052 166,553 167,813 130,334 182,108Capital Outlay 1,188 0 0 0 240 240 0TOTAL EXPENDITURES 178,495 257,529 249,929 262,914 264,414 214,804 277,386244
POSITION ANALYSIS<strong>2010</strong>/<strong>2011</strong> APPROVED BUDGET<strong>2010</strong> <strong>2010</strong> <strong>2011</strong>2007 2008 2009 Approved Adjusted <strong>2010</strong> ApprovedActual Actual Actual <strong>Budget</strong> <strong>Budget</strong> Projected <strong>Budget</strong>ANDERSEN ENRICHMENT CENTERAndersen Enrichment Center 3.00 5.00 5.00 5.00 5.00 5.00 5.00TOTAL POSITIONS 3.00 5.00 5.00 5.00 5.00 5.00 5.00The <strong>2010</strong>/<strong>2011</strong> Approved <strong>Budget</strong> will remain the same as previous years. In 2008, a Communication/Building Director and aMarketing Director were added to the Andersen Enrichment Center complement.245
EXPENDITURE ANALYSIS DETAIL<strong>2010</strong>/<strong>2011</strong> APPROVED BUDGETThis fund provides for the operation and maintenance <strong>of</strong> the 5,600 square foot Andersen EnrichmentCenter. Facilities include 3,361 square feet <strong>of</strong> rental/activity space and 528 square feet <strong>of</strong> <strong>of</strong>fice space for<strong>Saginaw</strong> Community Enrichment Commission personnel, <strong>City</strong> staff, and both interior and exteriorrestrooms.The Center was developed in 1993 with the assistance <strong>of</strong> the Enrichment Commission and is managed by apart-time manager and director. The manager and director are responsible for fund-raising, marketing,scheduling activities, collecting fees, managing finances, and supervising staff, as well as the day-to-dayoperations <strong>of</strong> the Center. The Enrichment Commission maintains an <strong>of</strong>fice and part-time staff in the Centerand provides cultural programs and services to the community at the Center.The objective <strong>of</strong> this division is to provide the services necessary to promote and operate the Center foractivities, events, and programs that enrich the quality <strong>of</strong> cultural life in <strong>Saginaw</strong>. Through FY <strong>2010</strong>/<strong>2011</strong>,the staff will continue to refine marketing and management strategies to maximize the use <strong>of</strong> these facilitiesin keeping with the mission.236-7540 Andersen Enrichment CenterAllocation PlanPosition Control<strong>2010</strong>/JOB <strong>2011</strong>PERSONNEL SERVICES CLASSIFICATION BUDGET ALLOCATIONSalaries 77,060 Director <strong>of</strong> Sag. Art Comm. 1.00 19,200Overtime 0 Director <strong>of</strong> Marketing 1.00 20,800Fringe Benefits 18,218 Andersen Ctr. Site Super. 1.00 16,640Andersen Center Director 1.00 15,600TOTAL95,278 Clerical Typist 1.00 4,820OPERATING EXPENSESTotal Personnel 5.00 77,060Supplies 5,530 Overtime 0Internal Services 0Other ServicesPr<strong>of</strong>essional Fees 15,583 FICA 4,863Maintenance Fees 20,395 Healthcare Benefits - Active 12,731Other Contracted Fees 0 Healthcare Benefits - Retirees 0Pension 624TOTAL41,508Total Fringe Benefits 18,218CAPITAL OUTLAY 0TOTAL0TOTAL APPROPRIATION 136,786TOTAL 5.00 95,278246
EXPENDITURE ANALYSIS DETAIL<strong>2010</strong>/<strong>2011</strong> APPROVED BUDGETThis division on the Andersen Enrichment Center Operation Fund provides for the operation and services <strong>of</strong>the <strong>Saginaw</strong> Community Enrichment Commission, whose purpose is to enhance the livability <strong>of</strong> <strong>Saginaw</strong>residents by initiating and preserving the arts and culture <strong>of</strong> our community. To that end, the Commissionprovides the following services, projects and programs: All Area Arts Awards, Art Hotline, Artifacts monthlyarts and entertainment newsletter, Artists Series Art Exhibits, Black History Month Art Exhibition andAwards Ceremony, Hispanic Heritage Month Art Exhibition and Awards Ceremony, an annual visiting artistresidency which send artists and musicians into <strong>Saginaw</strong> schools for two weeks each year, Hollyday Fair, GiftGallery, and an annual art fair.A part-time Director handles all fund-raising, marketing, and scheduling <strong>of</strong> activities. He/she also managesfinances and supervises the staff <strong>of</strong> the Andersen Enrichment Center. The Commission raises over $50,000each year to cover its expenses. Income is obtained from corporations such as Dow Corning, Citizens Bank,and Target, and from grants from the Michigan Council for Arts and Cultural Affairs, from admissions toevents and from membership dues.236-7541 Enrichment CommissionAllocation PlanPosition Control<strong>2010</strong>/JOB <strong>2011</strong>PERSONNEL SERVICES CLASSIFICATION BUDGET ALLOCATIONSalaries 0Overtime 0 Total Personnel 0.00 0Fringe Benefits 0TOTAL0 Overtime 0OPERATING EXPENSES FICA 0Healthcare Benefits - Active 0Supplies 0 Healthcare Benefits - Retirees 0Internal Services 0 Pension 0Other ServicesPr<strong>of</strong>essional Fees 140,600 Total Fringe Benefits 0Maintenance Fees 0Other Contracted Fees 0TOTAL 0.00 0TOTAL140,600CAPITAL OUTLAY 0TOTAL0TOTAL APPROPRIATION 140,600247
GM TOWER PROJECTS (238)RESOURCE ALLOCATION<strong>2010</strong>/<strong>2011</strong> APPROVED BUDGETRESOURCESAPPROPRIATIONSINTEREST 7,000 GM TOWER PROJECTS 108,500OTHER REVENUES 101,500TOTAL RESOURCES 108,500 TOTAL APPROPRIATIONS 108,500248
GM TOWER PROJECTS (238)<strong>2010</strong>/<strong>2011</strong> APPROVED BUDGET<strong>2010</strong> <strong>2010</strong> <strong>2011</strong>2007 2008 2009 Approved Adjusted <strong>2010</strong> ApprovedActual Actual Actual <strong>Budget</strong> <strong>Budget</strong> Projected <strong>Budget</strong>REVENUE ANALYSIS SUMMARYInterest and Rents 24,608 19,096 6,950 7,000 7,000 473 7,000Other Revenue 0 0 0 101,500 101,500 92,860 101,500TOTAL RESOURCES 24,608 19,096 6,950 108,500 108,500 93,333 108,5006595 GM TOWER PROJECTSPersonnel Services 0 0 0 0 0 0 0Operating Expenses 0 51,250 105,500 108,500 108,500 93,333 108,500Capital Outlay 0 0 0 0 0 0 0TOTALS 0 51,250 105,500 108,500 108,500 93,333 108,500TOTAL GM TOWER PROJECTSEXPENDITURE ANALYSIS SUMMARYPersonnel Services 0 0 0 0 0 0 0Operating Expenses 0 51,250 105,500 108,500 108,500 93,333 108,500Capital Outlay 0 0 0 0 0 0 0TOTALEXPENDITURES 0 51,250 105,500 108,500 108,500 93,333 108,500249
BOAT LAUNCH OPERATIONS (239)RESOURCE ALLOCATION<strong>2010</strong>/<strong>2011</strong> APPROVED BUDGETRESOURCESAPPROPRIATIONSCHARGE FOR SERVICES 25,000 BOAT LAUNCH OPERATION 25,550OTHER REVENUES 550TOTAL RESOURCES 25,550 TOTAL APPROPRIATIONS 25,550250
FUND: 239 – Boat Launch Operations and Maintenance FundDEPARTMENT: Public ServicesACTIVITY: 7546 – Boat Launch OperationSTRATEGIC_NARRATIVEThe Boat Launch Operation Fund provides for the operation, maintenance and improvement <strong>of</strong> facilitieslocated at the Rust Avenue Boat Launch.FY <strong>2010</strong>/<strong>2011</strong> GOALS AND OBJECTIVES1. To continue providing boaters with safe convenient access to the <strong>Saginaw</strong> river system andpromote the waterways as a recreational resource for the citizens <strong>Saginaw</strong> and surroundingcommunities.2. Improvement <strong>of</strong> handicap accessibility to the <strong>City</strong>’s docks3. Improvement <strong>of</strong> the drainage system in the <strong>City</strong>-owned parking lot.251
BOAT LAUNCH OPERATIONS (239)<strong>2010</strong>/<strong>2011</strong> APPROVED BUDGET<strong>2010</strong> <strong>2010</strong> <strong>2011</strong>2007 2008 2009 Approved Adjusted <strong>2010</strong> ApprovedActual Actual Actual <strong>Budget</strong> <strong>Budget</strong> Projected <strong>Budget</strong>REVENUE ANALYSIS SUMMARYCharge for Services 24,327 27,000 27,901 25,000 25,000 24,958 25,000Interest and Rents 0 20 89 0 0 29 0Other Revenue 0 0 0 550 550 0 550TOTAL RESOURCES 24,327 27,020 27,990 25,550 25,550 24,986 25,5507546 BOAT LAUNCH OPERATIONEXPENDITURE ANALYSIS SUMMARYPersonnel Services 250 0 0 0 0 0 0Operating Expenses 25,891 20,123 17,065 25,550 25,550 18,755 25,550Capital Outlay 0 5,000 0 0 0 0 0TOTALS 26,141 25,123 17,065 25,550 25,550 18,755 25,550TOTAL BOAT LAUNCH OPERATIONPersonnel Services 250 0 0 0 0 0 0Operating Expenses 25,891 20,123 17,065 25,550 25,550 18,755 25,550Capital Outlay 0 5,000 0 0 0 0 0TOTALEXPENDITURES 26,141 25,123 17,065 25,550 25,550 18,755 25,550252
TIFA AND LDFARESOURCE ALLOCATION<strong>2010</strong>/<strong>2011</strong> APPROVED BUDGETRESOURCESAPPROPRIATIONSCOMMERCE CENTER 27,865 COMMERCE CENTER 27,865DOWNTOWN DEVELOP AUTH. 70,838 DOWNTOWN DEVELOP AUTH. 70,838BROWNFIELD AUTHORITY 28,579 BROWNFIELD AUTHORITY 28,579SILS ISLAND DDA 2,748 SILS ISLAND DDA 2,748SAGINAW TOOL & DIE LDFA 27,408 SAGINAW TOOL & DIE LDFA 27,408SEXTON LDFA 12,814 SEXTON LDFA 12,814THOMSON LDFA 143,969 THOMSON LDFA 143,969TREASURE ISLAND LDFA 9,337 TREASURE ISLAND LDFA 9,337TOTAL RESOURCES 323,558 TOTAL APPROPRIATIONS 323,558Note:Effective in the <strong>2010</strong>/<strong>2011</strong> Approved <strong>Budget</strong>, Baker Perkins LDFA is no longer a capturing district.253
COMMERCE CENTER DDA (242)<strong>2010</strong>/<strong>2011</strong> APPROVED BUDGET<strong>2010</strong> <strong>2010</strong> <strong>2011</strong>2007 2008 2009 Approved Adjusted <strong>2010</strong> ApprovedActual Actual Actual <strong>Budget</strong> <strong>Budget</strong> Projected <strong>Budget</strong>REVENUE ANALYSIS SUMMARYProperty Taxes 29,137 29,181 31,314 28,558 28,558 28,671 27,865Other Revenue 0 0 0 0 0 263 0TOTAL RESOURCES 29,137 29,181 31,314 28,558 28,558 28,934 27,8651775 COMPONENT UNITEXPENDITURE ANALYSIS SUMMARYPersonnel Services 0 0 0 0 0 0 0Operating Expenses 0 0 0 0 0 0 0Capital Outlay 0 0 0 0 0 0 0Miscellaneous 6,077 28,281 28,385 28,558 28,558 28,934 27,865TOTALS 6,077 28,281 28,385 28,558 28,558 28,934 27,865TOTAL COMMERCE CENTER DDAPersonnel Services 0 0 0 0 0 0 0Operating Expenses 0 0 0 0 0 0 0Capital Outlay 0 0 0 0 0 0 0Miscellaneous 6,077 28,281 28,385 28,558 28,558 28,934 27,865TOTALEXPENDITURES 6,077 28,281 28,385 28,558 28,558 28,934 27,865254
DOWNTOWN DEVELOPMENT AUTHORITY (243)<strong>2010</strong>/<strong>2011</strong> APPROVED BUDGET<strong>2010</strong> <strong>2010</strong> <strong>2011</strong>2007 2008 2009 Approved Adjusted <strong>2010</strong> ApprovedActual Actual Actual <strong>Budget</strong> <strong>Budget</strong> Projected <strong>Budget</strong>REVENUE ANALYSIS SUMMARYPropety Taxes 7,552 11,630 13,482 10,122 10,122 13,162 5,838Interest and Rents 2,457 1,815 0 0 0 0 0Sale <strong>of</strong> Real Property 1,500 0 0 0 0 1,500 0Other Revenues 0 0 5,489 65,000 65,000 0 65,000Transfers from Other Funds 0 0 0 0 0 0 0TOTAL RESOURCES 11,510 13,445 18,971 75,122 75,122 14,662 70,8381775 COMPONENT UNITEXPENDITURE ANALYSIS SUMMARYPersonnel Services 0 11 0 0 0 0 0Operating Expenses 8,429 1,390 2,638 75,122 75,122 7,860 70,838Capital Outlay 26,817 0 0 0 0 0 0Miscellaneous 33,182 28,800 0 0 0 0 0TOTALS 68,428 30,201 2,638 75,122 75,122 7,860 70,8388559 INCREASE IN FUND EQUITYPersonnel Services 0 0 0 0 0 0 0Operating Expenses 0 0 0 0 0 0 0Capital Outlay 0 0 0 0 0 0 0Miscellaneous 0 68,209 0 0 0 0 0TOTALS 0 68,209 0 0 0 0 0TOTAL DOWNTOWN DEVELOPMENT AUTHORITYPersonnel Services 0 11 0 0 0 0 0Operating Expenses 8,429 1,390 2,638 75,122 75,122 7,860 70,838Capital Outlay 26,817 0 0 0 0 0 0Miscellaneous 33,182 97,009 0 0 0 0 0TOTAL EXPENDITURES 68,428 98,410 2,638 75,122 75,122 7,860 70,838255
BROWNFIELD AUTHORITY SRRF (245)<strong>2010</strong>/<strong>2011</strong> APPROVED BUDGET<strong>2010</strong> <strong>2010</strong> <strong>2011</strong>2007 2008 2009 Approved Adjusted <strong>2010</strong> ApprovedActual Actual Actual <strong>Budget</strong> <strong>Budget</strong> Projected <strong>Budget</strong>REVENUE ANALYSIS SUMMARYProperty Taxes 21,814 25,672 34,122 37,392 37,392 38,285 28,579Federal Grants 676 0 0 0 0 0 0TOTAL RESOURCES 22,490 25,672 34,122 37,392 37,392 38,285 28,5791775 COMPONENT UNITEXPENDITURE ANALYSIS SUMMARYOperating Expenses 0 0 0 0 0 0 0Capital Outlay 0 0 0 0 0 0 0Miscellaneous 9,014 34,410 6,136 37,392 37,392 20,595 28,579TOTALS 9,014 34,410 6,136 37,392 37,392 20,595 28,579TOTAL BROWNFIELD AUTHORITY SRRFOperating Expenses 0 0 0 0 0 0 0Capital Outlay 0 0 0 0 0 0 0Miscellaneous 9,014 34,410 6,136 37,392 37,392 20,595 28,579TOTAL EXPENDITURES 9,014 34,410 6,136 37,392 37,392 20,595 28,579256
BAKER PERKINS LDFA (250)<strong>2010</strong>/<strong>2011</strong> APPROVED BUDGET<strong>2010</strong> <strong>2010</strong> <strong>2011</strong>2007 2008 2009 Approved Adjusted <strong>2010</strong> ApprovedActual Actual Actual <strong>Budget</strong> <strong>Budget</strong> Projected <strong>Budget</strong>REVENUE ANALYSIS SUMMARYProperty Taxes 34,733 23,565 16,513 18,603 18,603 13,552 0Interest and Rents 0 0 0 0 0 0 0Other Revenues 0 0 0 0 87,292 74,054 0TOTAL RESOURCES 34,733 23,565 16,513 18,603 105,895 87,606 01775 COMPONENT UNITEXPENDITURE ANALYSIS SUMMARYPersonnel Services 0 0 0 0 0 0 0Operating Expenses 1,138 702 9,862 0 315 315 0Capital Outlay 0 0 0 0 0 0 0Miscellaneous 0 43,669 0 18,603 105,580 87,291 0TOTALS 1,138 44,371 9,862 18,603 105,895 87,606 0TOTAL BAKER PERKINS LDFAPersonnel Services 0 0 0 0 0 0 0Operating Expenses 1,138 702 9,862 0 315 315 0Capital Outlay 0 0 0 0 0 0 0Miscellaneous 0 43,669 0 18,603 105,580 87,291 0TOTALEXPENDITURES 1,138 44,371 9,862 18,603 105,895 87,606 0257
SILS ISLAND DDA (251)<strong>2010</strong>/<strong>2011</strong> APPROVED BUDGET<strong>2010</strong> <strong>2010</strong> <strong>2011</strong>2007 2008 2009 Approved Adjusted <strong>2010</strong> ApprovedActual Actual Actual <strong>Budget</strong> <strong>Budget</strong> Projected <strong>Budget</strong>REVENUE ANALYSIS SUMMARYProperty Taxes 2,470 2,929 4,060 2,836 2,836 2,494 2,748Interest and Rents 0 0 0 0 0 0 0Other Revenues 0 0 0 0 0 0 0TOTAL RESOURCES 2,470 2,929 4,060 2,836 2,836 2,494 2,7481775 COMPONENT UNITEXPENDITURE ANALYSIS SUMMARYPersonnel Services 0 0 0 0 0 0 0Operating Expenses 0 0 0 0 0 0 0Capital Outlay 0 0 0 0 0 0 0Miscellaneous 0 0 21,323 2,836 2,836 2,494 2,748TOTALS 0 0 21,323 2,836 2,836 2,494 2,748TOTAL SILS ISLAND DDAPersonnel Services 0 0 0 0 0 0 0Operating Expenses 0 0 0 0 0 0 0Capital Outlay 0 0 0 0 0 0 0Miscellaneous 0 0 21,323 2,836 2,836 2,494 2,748TOTALEXPENDITURES 0 0 21,323 2,836 2,836 2,494 2,748258
SAGINAW TOOL & DIE LDFA (255)<strong>2010</strong>/<strong>2011</strong> APPROVED BUDGET<strong>2010</strong> <strong>2010</strong> <strong>2011</strong>2007 2008 2009 Approved Adjusted <strong>2010</strong> ApprovedActual Actual Actual <strong>Budget</strong> <strong>Budget</strong> Projected <strong>Budget</strong>REVENUE ANALYSIS SUMMARYProperty Taxes 30,708 28,553 28,184 25,699 25,699 25,145 27,408Other Revenues 0 0 0 0 0 0 0TOTAL RESOURCES 30,708 28,553 28,184 25,699 25,699 25,145 27,4081775 COMPONENT UNITEXPENDITURE ANALYSIS SUMMARYPersonnel Services 0 0 0 0 0 0 0Operating Expenses 0 0 0 0 0 0 0Capital Outlay 0 0 0 0 0 0 0Miscellaneous 22,071 4,144 0 25,699 25,699 0 27,408TOTALS 22,071 4,144 0 25,699 25,699 0 27,408TOTAL SAGINAW TOOL & DIE LDFAPersonnel Services 0 0 0 0 0 0 0Operating Expenses 0 0 0 0 0 0 0Capital Outlay 0 0 0 0 0 0 0Miscellaneous 22,071 4,144 0 25,699 25,699 0 27,408TOTALEXPENDITURES 22,071 4,144 0 25,699 25,699 0 27,408259
SEXTON LDFA (256)<strong>2010</strong>/<strong>2011</strong> APPROVED BUDGET<strong>2010</strong> <strong>2010</strong> <strong>2011</strong>2007 2008 2009 Approved Adjusted <strong>2010</strong> ApprovedActual Actual Actual <strong>Budget</strong> <strong>Budget</strong> Projected <strong>Budget</strong>REVENUE ANALYSIS SUMMARYProperty Taxes 22,566 22,179 22,074 13,383 13,383 13,563 12,814Other Revenues 0 0 0 0 0 0 0TOTAL RESOURCES 22,566 22,179 22,074 13,383 13,383 13,563 12,8141775 COMPONENT UNITEXPENDITURE ANALYSIS SUMMARYPersonnel Services 0 0 0 0 0 0 0Operating Expenses 0 0 0 0 0 0 0Capital Outlay 0 0 0 0 0 0 0Miscellaneous 0 0 0 13,383 13,383 0 12,814TOTALS 0 0 0 13,383 13,383 0 12,814TOTAL SEXTON LDFAPersonnel Services 0 0 0 0 0 0 0Operating Expenses 0 0 0 0 0 0 0Capital Outlay 0 0 0 0 0 0 0Miscellaneous 0 0 0 13,383 13,383 0 12,814TOTALEXPENDITURES 0 0 0 13,383 13,383 0 12,814260
THOMSON LDFA (257)<strong>2010</strong>/<strong>2011</strong> APPROVED BUDGET<strong>2010</strong> <strong>2010</strong> <strong>2011</strong>2007 2008 2009 Approved Adjusted <strong>2010</strong> ApprovedActual Actual Actual <strong>Budget</strong> <strong>Budget</strong> Projected <strong>Budget</strong>REVENUE ANALYSIS SUMMARYProperty Taxes 131,763 121,391 120,251 124,398 124,398 118,850 129,969Interest and Rents 23,103 57,821 38,305 14,000 14,000 1,244 14,000Other Revenues 0 0 0 0 0 0 0TOTAL RESOURCES 154,865 179,212 158,556 138,398 138,398 120,094 143,9691775 COMPONENT UNITEXPENDITURE ANALYSIS SUMMARYPersonnel Services 0 0 0 0 0 0 0Operating Expenses 0 0 0 0 0 0 0Capital Outlay 0 0 0 0 0 0 0Miscellaneous 0 0 0 138,398 138,398 15 143,969TOTALS 0 0 0 138,398 138,398 143,969TOTAL THOMSON LDFAPersonnel Services 0 0 0 0 0 0 0Operating Expenses 0 0 0 0 0 0 0Capital Outlay 0 0 0 0 0 0 0Miscellaneous 0 0 0 138,398 138,398 15 143,969TOTALEXPENDITURES 0 0 0 138,398 138,398 15 143,969261
TREASURE ISLAND LDFA (258)<strong>2010</strong>/<strong>2011</strong> APPROVED BUDGET<strong>2010</strong> <strong>2010</strong> <strong>2011</strong>2007 2008 2009 Approved Adjusted <strong>2010</strong> ApprovedActual Actual Actual <strong>Budget</strong> <strong>Budget</strong> Projected <strong>Budget</strong>REVENUE ANALYSIS SUMMARYProperty Taxes 7,089 6,340 6,459 9,207 9,207 4,610 9,337Other Revenues 0 609 0 0 0 0 0TOTAL RESOURCES 7,089 6,949 6,459 9,207 9,207 4,610 9,3371775 COMPONENT UNITEXPENDITURE ANALYSIS SUMMARYPersonnel Services 0 0 0 0 0 0 0Operating Expenses 0 0 0 0 0 0 0Capital Outlay 0 0 0 0 0 0 0Miscellaneous 0 0 0 9,207 9,207 0 9,337TOTALS 0 0 0 9,207 9,207 0 9,337TOTAL TREASURE ISLAND LDFAPersonnel Services 0 0 0 0 0 0 0Operating Expenses 0 0 0 0 0 0 0Capital Outlay 0 0 0 0 0 0 0Miscellaneous 0 0 0 9,207 9,207 0 9,337TOTALEXPENDITURES 0 0 0 9,207 9,207 0 9,337262
COMMUNITY DEVELOPMENTBLOCK GRANT
COMMUNITY DEVELOPMENT BLOCK GRANT (275)RESOURCE ALLOCATION<strong>2010</strong>/<strong>2011</strong> APPROVED BUDGETRESOURCESAPPROPRIATIONSFEDERAL GRANTS 2,078,062 CDBG AD<strong>MI</strong>NISTRATION 459,501INTEREST 500 SPECIAL PROJECTS 570,531TRANSFERS IN 0 ECONO<strong>MI</strong>C DEVELOPMENT 50,000ECON. DEVE. SUBGRANTEES 396,416SAGINAW ECON. DEV. CORP 139,520CODE COMPLIANCE 174,014SUBGRANTEES 172,959MCKINNEY HOMELESS 109,581TRANSFERS 6,040TOTAL RESOURCES 2,078,562 TOTAL APPROPRIATIONS 2,078,562263
REVENUE ANALYSIS SUMMARY<strong>2010</strong>/<strong>2011</strong> APPROVED BUDGET<strong>2010</strong> <strong>2010</strong> <strong>2011</strong>2007 2008 2009 Approved Adjusted <strong>2010</strong> ApprovedActual Actual Actual <strong>Budget</strong> <strong>Budget</strong> Projected <strong>Budget</strong>Community Development Block Grant (CDBG)Federal Grants 3,057,413 2,835,988 2,483,945 2,365,965 4,056,312 2,878,156 2,078,062Interest and Rents 420 425 425 500 500 217 500Other Revenues 27,888 0 0 0 0 2,397 0TOTAL RESOURCES 3,085,710 2,836,405 2,484,367 2,366,463 4,056,811 2,880,770 2,078,562REVENUE ANALYSIS DETAILBlock Grant Entitlement 2,942,993 2,748,864 2,370,479 2,255,345 2,923,692 2,577,075 1,968,481Stewart McKinney Homeless 114,420 87,124 113,466 110,620 110,620 301,081 109,581Homeless P&R Program 0 0 0 0 1,022,000 0 0Total Grants 3,057,413 2,835,988 2,483,945 2,365,965 4,056,312 2,878,156 2,078,062Interest on Investments 420 425 425 500 500 217 500Total Interest and Rents 420 425 425 500 500 217 500Surplus Receipts 0 42,488 4,873 0 0 235 0Demolition Contracts 27,888 0 0 0 0 2,397 0Total Other Revenues 27,888 0 0 0 0 2,397 0TOTAL RESOURCES 3,085,721 2,836,413 2,484,370 2,366,465 4,056,812 2,880,770 2,078,562264
EXPENDITURE ANALYSIS SUMMARY<strong>2010</strong>/<strong>2011</strong> APPROVED BUDGET<strong>2010</strong> <strong>2010</strong> <strong>2011</strong>2007 2008 2009 Approved Adjusted <strong>2010</strong> ApprovedActual Actual Actual <strong>Budget</strong> <strong>Budget</strong> Projected <strong>Budget</strong>COMMUNITY DEVELOPMENT BLOCK GRANT6510 CDBG AD<strong>MI</strong>NISTRATIONPersonnel Services 439,370 430,597 433,047 469,769 469,769 479,329 396,955Operating Expenses 69,755 132,092 61,712 68,779 68,779 57,691 62,546Capital Outlay 848 1,200 587 0 0 0 0Miscellaneous 0 6,837 0 0 0 0 0TOTALS 509,973 570,726 495,346 538,548 538,548 537,020 459,5016511 SPECIAL PROJECTSPersonnel Services 74,275 76,130 85,704 85,019 85,019 98,456 87,411Operating Expenses 728,316 421,200 437,658 351,106 1,019,453 529,780 450,395Capital Outlay 0 0 0 0 0 0 0Miscellaneous 40,675 44,681 32,655 32,725 32,725 32,725 32,725TOTALS 843,266 542,011 556,017 468,850 1,137,197 660,961 570,5316512 ECONO<strong>MI</strong>C DEVELOPMENTPersonnel Services 0 0 0 0 0 0 0Operating Expenses 15 0 50,000 0 37,400 72 50,000Capital Outlay 0 0 0 0 0 0 0Miscellaneous 529,667 514,375 0 409,922 372,522 412,114 0TOTALS 529,682 514,375 50,000 409,922 409,922 412,187 50,0006513 - ECONO<strong>MI</strong>C DEVELOPMENT SUBGRANTEESPersonnel Services 0 0 0 0 0 0 0Operating Expenses 0 0 118,373 0 84,640 75,355 81,876Capital Outlay 0 0 0 0 0 0 0Miscellaneous 434,866 351,107 277,901 396,416 314,541 314,541 314,540TOTALS 434,866 351,107 396,274 396,416 399,181 389,896 396,4166520 SAGINAW ECONO<strong>MI</strong>C DEVELOPMENT CORPPersonnel Services 93,056 82,771 120,066 105,947 105,947 107,365 93,469Operating Expenses 34,464 33,346 30,146 46,857 46,857 45,564 46,051Capital Outlay 0 400 0 0 0 0 0Miscellaneous 0 0 0 0 0 0 0TOTALS 127,520 116,517 150,212 152,804 152,804 152,929 139,520265
EXPENDITURE ANALYSIS SUMMARY<strong>2010</strong>/<strong>2011</strong> APPROVED BUDGET<strong>2010</strong> <strong>2010</strong> <strong>2011</strong>2007 2008 2009 Approved Adjusted <strong>2010</strong> ApprovedActual Actual Actual <strong>Budget</strong> <strong>Budget</strong> Projected <strong>Budget</strong>COMMUNITY DEVELOPMENT BLOCK GRANT6572 CODE COMPLIANCEPersonnel Services 184,210 174,154 148,576 158,787 158,787 153,480 161,073Operating Expenses 13,508 12,245 12,390 14,213 14,213 12,523 12,941Capital Outlay 0 207 0 0 0 0 0TOTALS 197,717 186,606 160,966 173,000 173,000 166,003 174,0146574 SUBGRANTEESPersonnel Services 0 0 0 0 0 0 0Operating Expenses 0 0 0 0 0 0 0Capital Outlay 0 0 0 0 0 0 0Miscellaneous 321,820 469,431 107,071 107,500 107,500 180,586 172,959TOTALS 321,820 469,431 107,071 107,500 107,500 180,586 172,9596585 MCKINNEY HOMELESSPersonnel Services 0 0 0 0 0 0 0Operating Expenses 0 0 0 0 0 0 0Capital Outlay 0 0 0 0 0 0 0Miscellaneous 105,626 95,743 118,110 110,620 1,132,620 375,147 109,581TOTALS 105,626 95,743 118,110 110,620 1,132,620 375,147 109,5819660 OPERATING TRANSFERSPersonnel Services 0 0 0 0 0 0 0Operating Expenses 0 0 0 0 0 0 0Capital Outlay 0 0 0 0 0 0 0Miscellaneous 5,140 19,103 6,040 6,040 6,040 6,040 6,040TOTALS 5,140 19,103 6,040 6,040 6,040 6,040 6,040TOTAL COMMUNITY DEVELOPMENT BLOCK GRANTPersonnel Services 790,911 763,652 787,393 819,522 819,522 838,630 738,908Operating Expenses 846,058 598,883 710,279 480,955 1,271,342 720,986 703,809Capital Outlay 848 1,807 587 0 0 0 0Miscellaneous 1,437,794 1,501,277 541,777 1,063,223 1,965,948 1,321,154 635,845TOTALEXPENDITURES 3,075,611 2,865,619 2,040,036 2,363,700 4,056,812 2,880,770 2,078,562266
FUND: 275 – Community Development Block Grant Fund (CDBG)DEPARTMENT: Department <strong>of</strong> DevelopmentACTIVITY: 6510 – CDBG AdministrationSTRATEGIC NARRATIVECDBG Administration provides the staff and resources needed to manage over forty programs in theCommunity Development Block Grant, HOME, Emergency Shelter Grant, and Section 108 Loanprograms. This includes citizen participation, submission and performance report preparation, projectand subgrantee management, subgrantee payment request processing, annual subgrantee monitoring,program accounting, and Federal and <strong>City</strong> audits. Efforts also include participation in the strategicdevelopment <strong>of</strong> a comprehensive neighborhood revitalization strategy.1. Community DevelopmentFY <strong>2010</strong>/<strong>2011</strong> GOALS AND OBJECTIVESa. Improve sub-grantee oversight and accountabilityPercent <strong>of</strong> subgranteeaccountswith completedfinancial andprogrammaticmonitoring2009Actual<strong>2010</strong>Projected<strong>2011</strong>Target50% F / 0% P 100% F / 50% P 100% F / 50% PF = Financial MonitoringP = Programmatic Monitoring2. Neighborhood Revitalizationa. Increase awareness <strong>of</strong> continuing neighborhood revitalization efforts2009Actual<strong>2010</strong>Projected<strong>2011</strong>TargetRegular Updates 1 / 4* 4 / 4* 0 / 4*Note: Annual updates with target areas are neighborhood stakeholders* Change / Goal*Two housingsub-grantees:Circle <strong>of</strong> LoveCAC*Goal revised to applicable entities2009Actual<strong>2010</strong>Projected<strong>2011</strong>Target1 2 2267
EXPENDITURE ANALYSIS DETAIL<strong>2010</strong>/<strong>2011</strong> APPROVED BUDGET275-6510 CDBG AdministrationAllocation PlanPosition Control<strong>2010</strong>/JOB <strong>2011</strong>PERSONNEL SERVICES CLASSIFICATION BUDGET ALLOCATIONSalaries 134,344 Director <strong>of</strong> Development 0.40 36,528Overtime 1,500 Assistant Director 0.20 15,836Fringe Benefits 261,111 Block Grant Administrator 0.88 60,321Block Grant Specialist 0.50 21,659TOTAL396,955Total Personnel 1.98 134,344OPERATING EXPENSESOvertime 1,500Supplies 2,500Internal Services 20,303Other Services FICA 10,794Pr<strong>of</strong>essional Fees 9,151 Healthcare Benefits - Active 18,310Maintenance Fees 20,492 Healthcare Benefits - Retirees 135,630Other Contracted Fees 10,100 Pension 96,377TOTAL62,546 Total Fringe Benefits 261,111CAPITAL OUTLAY 0 TOTAL 1.98 396,955TOTAL0TOTAL APPROPRIATION 459,501268
EXPENDITURE ANALYSIS DETAIL<strong>2010</strong>/<strong>2011</strong> APPROVED BUDGET275-6511 Special ProjectsAllocation PlanPosition Control<strong>2010</strong>/JOB <strong>2011</strong>PERSONNEL SERVICES CLASSIFICATION BUDGET ALLOCATIONSalaries 47,075 Dangerous BuildingOvertime 0 Inspector 1.00 45,435Fringe Benefits 40,336 Intern 1.00 1,640TOTAL87,411 Total Personnel 2.00 47,075OPERATING EXPENSES Overtime 0Supplies 0Internal Services 6,203 FICA 3,601Other Services Healthcare Benefits - Active 15,369Pr<strong>of</strong>essional Fees 0 Healthcare Benefits - Retirees 0Maintenance Fees 444,192 Pension 21,366Other Contracted Fees 0Total Fringe Benefits 40,336TOTAL450,395CAPITAL OUTLAY 0TOTAL 2.00 87,411TOTAL0<strong>MI</strong>SCELLANEOUS 32,725TOTAL32,725TOTAL APPROPRIATION 570,531269
FUND: 275 – Community Development Block Grant FundDEPARTMENT: Department <strong>of</strong> DevelopmentACTIVITY: 6520 – <strong>Saginaw</strong> Economic Development Corporation (SEDC)STRATEGIC NARRATIVEThis division provides administrative funding for the <strong>Saginaw</strong> Economic Development Corporation(SEDC) staff. SEDC provides business loans for start-up and existing businesses in the <strong>City</strong>. Loanfunds are provided for business inventory, equipment, or real estate acquisition. This program isfocused on development in the <strong>City</strong>, which provides lending resources for citizens who have founddifficulty securing business development funds through the normal process. Technical assistancecounseling is also provided.1. Business/Economic DevelopmentFY <strong>2010</strong>/<strong>2011</strong> GOALS AND OBJECTIVES2009Actual<strong>2010</strong>Projected<strong>2011</strong>TargetNumber <strong>of</strong>new loans 9 6 62009Actual<strong>2010</strong>Projected<strong>2011</strong>TargetDelinquency Rate 18% 13% 10%2. Organization Development2009Actual<strong>2010</strong>Projected<strong>2011</strong>TargetNumber <strong>of</strong> newboard members 1 2 3270
EXPENDITURE ANALYSIS DETAIL<strong>2010</strong>/<strong>2011</strong> APPROVED BUDGET275-6520 <strong>Saginaw</strong> Economic Development Corp.Allocation PlanPosition Control<strong>2010</strong>/JOB <strong>2011</strong>PERSONNEL SERVICES CLASSIFICATION BUDGET ALLOCATIONSalaries 51,072 Director <strong>of</strong> Development 0.15 13,698Overtime 500 SEDC Loan Support 0.90 37,374Fringe Benefits 41,897TOTAL93,469 Total Personnel 1.05 51,072OPERATING EXPENSES Overtime 500Supplies 2,000Internal Services 7,898 FICA 3,811Other Services Healthcare Benefits - Active 13,389Pr<strong>of</strong>essional Fees 9,788 Healthcare Benefits - Retirees 0Maintenance Fees 17,500 Pension 24,697Other Contracted Fees 8,865Total Fringe Benefits 41,897TOTAL46,051CAPITAL OUTLAY 0TOTAL 1.05 93,469TOTAL0<strong>MI</strong>SCELLANEOUS 0TOTAL0TOTAL APPROPRIATION 139,520271
EXPENDITURE ANALYSIS DETAIL<strong>2010</strong>/<strong>2011</strong> APPROVED BUDGET275-6572 Code ComplianceAllocation PlanPosition Control<strong>2010</strong>/JOB <strong>2011</strong>PERSONNEL SERVICES CLASSIFICATION BUDGET ALLOCATIONSalaries 91,133 Residential Rehab.Overtime 0 Specialist 2.00 91,133Fringe Benefits 69,940Total Personnel 2.00 91,133TOTAL161,073OPERATING EXPENSESOvertime 0Supplies 0 FICA 7,163Internal Services 10,856 Healthcare Benefits - Active 38,080Other Services Healthcare Benefits - Retirees 0Pr<strong>of</strong>essional Fees 0 Pension 24,697Maintenance Fees 1,500Other Contracted Fees 585 Total Fringe Benefits 69,940TOTAL12,941TOTAL 2.00 161,073CAPITAL OUTLAY 0TOTAL0<strong>MI</strong>SCELLANEOUS 0TOTAL0TOTAL APPROPRIATION 174,014272
FUND: 275 – Community Development Block Grant FundDEPARTMENT: Department <strong>of</strong> DevelopmentACTIVITY: 6585 – CDBG – McKinney Homeless ProgramSTRATEGIC NARRATIVECDBG - McKinney Homeless Program provides staff and resources needed to manage programs in theCommunity Development Block Grant, HOME, Emergency Shelter Grant, and Section 108 LoanPrograms. These programs are listed as key components in our Neighborhood Revitalization Strategy.The Congressional Recovery Act <strong>of</strong> 2009 has funded a Homelessness Prevention and Rapid Re-HousingProgram. <strong>Saginaw</strong> is eligible for a total 1.33 million dollars over a 3-year period. The <strong>City</strong> <strong>of</strong> <strong>Saginaw</strong>intends to fully participate in the program through a collaborative effort with the <strong>Saginaw</strong> CountyConsortium <strong>of</strong> Homeless Assistance Providers (SCHAP).FY <strong>2010</strong>/<strong>2011</strong> GOALS AND OBJECTIVES1. Community Development/Homelessness Preventiona. Secure approval by HUD and MSHDA to implement HPRP through a communitycoalition <strong>of</strong> homeless prevention providers.Completeapplication andsecure approval2009Actual<strong>2010</strong>Projected<strong>2011</strong>TargetN/A N/A September 1, 2009Obligate funds N/A N/A September 01, <strong>2010</strong>Spend 60% <strong>of</strong> funds N/A N/A September 01, <strong>2011</strong>100% funds spent N/A N/A September 01, 2012273
CDBG RESIDENTIAL LOANS (276)RESOURCE ALLOCATION<strong>2010</strong>/<strong>2011</strong> APPROVED BUDGETRESOURCESAPPROPRIATIONSFEDERAL GRANTS 380,000 RESIDENTIAL LOANS 433,359INTEREST 20,000 SINGLE FA<strong>MI</strong>LY 65,459OTHER REVENUES 80,000 TRANSFERS OUT 14,394TRANSFERS IN 33,212TOTAL RESOURCES 513,212 TOTAL APPROPRIATIONS 513,212274
CDBG RESIDENTIAL LOANS (276)<strong>2010</strong>/<strong>2011</strong> APPROVED BUDGET<strong>2010</strong> <strong>2010</strong> <strong>2011</strong>2007 2008 2009 Approved Adjusted <strong>2010</strong> ApprovedActual Actual Actual <strong>Budget</strong> <strong>Budget</strong> Projected <strong>Budget</strong>REVENUE ANALYSIS SUMMARYFederal Grants (5,966) 398,031 427,392 380,000 380,000 225,051 380,000Interest and Rents 25,401 23,039 19,362 20,000 20,000 18,581 20,000Other Revenues 142,785 137,093 119,108 80,000 103,604 103,900 80,000Transfers from Other Fds 18,098 0 0 33,212 33,212 33,212 33,212TOTAL RESOURCES 180,318 558,163 565,862 513,212 536,816 380,744 513,2126540 RESIDENTIAL LOANSEXPENDITURE ANALYSIS SUMMARYPersonnel Services 116,139 114,070 144,601 137,684 137,684 107,631 117,342Operating Expenses 34,977 58,384 57,184 103,186 102,736 69,900 97,030Capital Outlay 595 0 675 0 450 226 0Miscellaneous 4,932 28,273 190,403 195,948 208,327 119,133 218,987TOTALS 156,643 200,727 392,863 436,818 449,197 296,890 433,3596550 SINGLE FA<strong>MI</strong>LYPersonnel Services 0 0 0 0 0 0 0Operating Expenses 0 0 0 0 0 0 0Capital Outlay 0 0 0 0 0 0 0Miscellaneous 22,610 358,657 172,999 62,000 73,225 45,878 65,459TOTALS 22,610 358,657 172,999 62,000 73,225 45,878 65,4599660 OPERATING TRANSFERSPersonnel Services 0 0 0 0 0 0 0Operating Expenses 0 0 0 0 0 0 0Capital Outlay 0 0 0 0 0 0 0Miscellaneous 0 0 0 14,394 14,394 14,394 14,394TOTALS 0 0 0 14,394 14,394 14,394 14,394TOTAL CDBG RESIDENTIAL LOANSPersonnel Services 116,139 114,070 144,601 137,684 137,684 107,631 117,342Operating Expenses 34,977 58,384 57,184 103,186 102,736 69,900 97,030Capital Outlay 595 0 675 0 450 226 0Miscellaneous 27,542 386,930 363,402 272,342 295,946 179,405 298,840TOTALEXPENDITURES 179,253 559,384 565,862 513,212 536,816 357,162 513,212275
FUND: 276 – Residential Loans Program FundDEPARTMENT: Department <strong>of</strong> DevelopmentACTIVITY: 6540 – Residential LoansSTRATEGIC NARRATIVEThis fund provides for staff to process a variety <strong>of</strong> housing rehabilitation programs for single-familyhomeowners primarily in the revitalization area and other parts <strong>of</strong> the <strong>City</strong> as well. Funds are alsoprovided in the budget, via loan repayments, for new loan originations. The staff will also take an activerole in the revitalization area.1. Organizational DevelopmentFY <strong>2010</strong>/<strong>2011</strong> GOALS AND OBJECTIVESa. Create a tracking system for all rehab projectsNumber <strong>of</strong>residential loansgiven for rehabprojects2009Actual<strong>2010</strong>Projected<strong>2011</strong>Target3 8 102. <strong>City</strong> Revenue Structure2009Actual<strong>2010</strong>Projected<strong>2011</strong>TargetPercent <strong>of</strong> accountsthat are delinquent 20% 10% 5%Percent <strong>of</strong> clientsreceiving phone callswithin 30 days <strong>of</strong> 1 stdelinquent payment2009Actual<strong>2010</strong>Projected<strong>2011</strong>Target20% 50% 60%3. Neighborhood Revitalizationa. Increase awareness <strong>of</strong> continued Neighborhood Revitalization effort2009Actual<strong>2010</strong>Projected<strong>2011</strong>TargetQuarterly Reviews 100% 100% 100%276
4. Complete housing rehab loan projects in revitalization areaNumber <strong>of</strong> housescompleted inrevitalization area2009Actual<strong>2010</strong>Projected<strong>2011</strong>Target3 10 15277
EXPENDITURE ANALYSIS DETAIL<strong>2010</strong>/<strong>2011</strong> APPROVED BUDGET276-6540 Residential LoansAllocation PlanPosition Control<strong>2010</strong>/JOB <strong>2011</strong>PERSONNEL SERVICES CLASSIFICATION BUDGET ALLOCATIONSalaries 61,863 Block Grant Specialist 0.50 21,659Overtime 0 Rehabiliation ApplicationFringe Benefits 55,479 Specialist 1.00 40,204TOTAL117,342 Total Personnel 1.50 61,863OPERATING EXPENSES Overtime 0Supplies 2,498Internal Services 7,258 FICA 4,829Other Services Healthcare Benefits - Active 17,284Pr<strong>of</strong>essional Fees 31,674 Healthcare Benefits - Retirees 0Maintenance Fees 35,400 Pension 33,366Other Contracted Fees 20,200Total Fringe Benefits 55,479TOTAL97,030CAPITAL OUTLAY 0TOTAL 1.50 117,342TOTAL0<strong>MI</strong>SCELLANEOUS 218,987TOTAL218,987TOTAL APPROPRIATION 433,359278
CDBG RENTAL LOANS (277)RESOURCE ALLOCATION<strong>2010</strong>/<strong>2011</strong> APPROVED BUDGETRESOURCESAPPROPRIATIONSINTEREST 15,412 RENTAL LOANS 30,412OTHER REVENUES 15,000 TRANSFERS OUT 0TOTAL RESOURCES 30,412 TOTAL APPROPRIATIONS 30,412279
CDBG RENTAL LOANS (277)<strong>2010</strong>/<strong>2011</strong> APPROVED BUDGET<strong>2010</strong> <strong>2010</strong> <strong>2011</strong>2007 2008 2009 Approved Adjusted <strong>2010</strong> ApprovedActual Actual Actual <strong>Budget</strong> <strong>Budget</strong> Projected <strong>Budget</strong>REVENUE ANALYSIS SUMMARYInterest and Rents 29,433 7,711 0 17,412 17,412 13,027 15,412Other Revenues 17,965 4,688 109 20,000 20,000 20,455 15,000TOTAL RESOURCES 47,398 12,399 109 37,412 37,412 33,482 30,4126560 RENTAL LOANSEXPENDITURE ANALYSIS SUMMARYPersonnel Services 0 0 0 0 0 0 0Operating Expenses 3,966 1,945 109 4,200 4,200 270 26,412Capital Outlay 11,562 0 0 0 0 0 0Miscellaneous 0 0 0 0 0 0 4,000TOTALS 15,528 1,945 109 4,200 4,200 270 30,4129660 OPERATING TRANSFERSPersonnel Services 0 0 0 0 0 0 0Operating Expenses 0 0 0 0 0 0 0Capital Outlay 0 0 0 0 0 0 0Miscellaneous 31,870 10,454 0 33,212 33,212 33,212 0TOTALS 31,870 10,454 0 33,212 33,212 33,212 0TOTAL CDBG RENTAL LOANSPersonnel Services 0 0 0 0 0 0 0Operating Expenses 3,966 1,945 109 4,200 4,200 270 26,412Capital Outlay 11,562 0 0 0 0 0 0Miscellaneous 31,870 10,454 0 33,212 33,212 33,212 4,000TOTALEXPENDITURES 47,398 12,399 109 37,412 37,412 33,482 30,412280
CDBG BLOCK GRANT HOME PROGRAM (278)RESOURCE ALLOCATION<strong>2010</strong>/<strong>2011</strong> APPROVED BUDGETRESOURCESAPPROPRIATIONSFEDERAL GRANTS 1,400,000 HOME PROGRAM 1,400,000TRANSFERS IN 0TOTAL RESOURCES 1,400,000 TOTAL APPROPRIATIONS 1,400,000281
CDBG BLOCK GRANT HOME PROGRAM (278)<strong>2010</strong>/<strong>2011</strong> APPROVED BUDGET<strong>2010</strong> <strong>2010</strong> <strong>2011</strong>2007 2008 2009 Approved Adjusted <strong>2010</strong> ApprovedActual Actual Actual <strong>Budget</strong> <strong>Budget</strong> Projected <strong>Budget</strong>REVENUE ANALYSIS SUMMARYFederal Grants 937,242 293,121 656,286 966,374 966,374 700,404 1,400,000Other Revenues 0 0 25,806 0 8,335 2,379 0Transfers In 13,772 5,849 0 14,394 14,394 14,394 0TOTAL RESOURCES 951,014 298,970 682,092 980,768 989,103 717,177 1,400,0006580 HOME PROGRAMSEXPENDITURE ANALYSIS SUMMARYPersonnel Services 71,198 63,308 54,085 75,306 75,306 77,795 87,264Operating Expenses 7,692 7,051 3,848 4,166 4,166 4,047 4,582Capital Outlay 0 0 0 0 0 0 0Miscellaneous 873,562 228,612 624,158 901,296 909,631 635,335 1,308,154TOTALS 952,451 298,971 682,091 980,768 989,103 717,177 1,400,000TOTAL BLOCK GRANT HOME PROGRAMSPersonnel Services 71,198 63,308 54,085 75,306 75,306 77,795 87,264Operating Expenses 7,692 7,051 3,848 4,166 4,166 4,047 4,582Capital Outlay 0 0 0 0 0 0 0Miscellaneous 873,562 228,612 624,158 901,296 909,631 635,335 1,308,154TOTALEXPENDITURES 952,452 298,971 682,091 980,768 989,103 717,177 1,400,000282
FUND: 278 – HOME Program FundDEPARTMENT: Department <strong>of</strong> DevelopmentACTIVITY: 6580 – HOME ProgramSTRATEGIC NARRATIVEThe HOME Program fund provides for city generated housing rehabilitation activities as well as current<strong>City</strong> <strong>of</strong> <strong>Saginaw</strong> Community Housing Development Organization (CHDO) sub-recipient. The focus ison providing low interest loans to low-income families for home rehabilitation. Direct grants are alsoprovided to qualifying citizens. The CHDO activity allows the city to participate with a developer innew home construction.FY <strong>2010</strong>/<strong>2011</strong> GOALS AND OBJECTIVES1. <strong>City</strong> Revenue Structurea. Maximize investment <strong>of</strong> HOME funds in cityIncrease amount <strong>of</strong>available affordablehousing to 90%spending level2009Actual<strong>2010</strong>Projected<strong>2011</strong>Target80% 100% 95%283
EXPENDITURE ANALYSIS DETAIL<strong>2010</strong>/<strong>2011</strong> APPROVED BUDGET278-6580 Home ProgramAllocation PlanPosition Control<strong>2010</strong>/JOB <strong>2011</strong>PERSONNEL SERVICES CLASSIFICATION BUDGET ALLOCATIONSalaries 48,429 Block GrantOvertime 0 Administrator 0.12 8,226Fringe Benefits 38,835 Rehabilitation ApplicationSpecialist 1.00 40,204TOTAL87,264Total Personnel 1.12 48,429OPERATING EXPENSESOvertime 0Supplies 0Internal Services 4,582Other Services FICA 3,801Pr<strong>of</strong>essional Fees 0 Healthcare Benefits - Active 17,793Maintenance Fees 0 Healthcare Benefits - Retirees 0Other Contracted Fees 0 Pension 17,241TOTAL4,582 Total Fringe Benefits 38,835CAPITAL OUTLAY 0 TOTAL 1.12 87,264TOTAL0<strong>MI</strong>SCELLANEOUS 1,308,154TOTAL1,308,154TOTAL APPROPRIATION 1,400,000284
NEIGHBORHOOD STABILIZATION PROGRAM (NSP) (279)RESOURCE ALLOCATION<strong>2010</strong>/<strong>2011</strong> APPROVED BUDGETRESOURCESAPPROPRIATIONSFEDERAL GRANTS 6,428,000 NSP I 928,000TRANSFERS IN 0 NSP II 5,500,000TOTAL RESOURCES 6,428,000 TOTAL APPROPRIATIONS 6,428,000285
NEIGHBORHOOD STABILIZATIONA FUND (NSP) (279)<strong>2010</strong>/<strong>2011</strong> APPROVED BUDGET<strong>2010</strong> <strong>2010</strong> <strong>2011</strong>2007 2008 2009 Approved Adjusted <strong>2010</strong> ApprovedActual Actual Actual <strong>Budget</strong> <strong>Budget</strong> Projected <strong>Budget</strong>REVENUE ANALYSIS SUMMARYFederal Grants 0 0 0 0 3,940,000 530,483 6,428,000Other Revenues 0 0 0 0 0 8,426 0Transfers In 0 0 0 0 0 0 0TOTAL RESOURCES 0 0 0 0 3,940,000 538,909 6,428,0006550 NSP IEXPENDITURE ANALYSIS SUMMARYPersonnel Services 0 0 0 0 0 0 0Operating Expenses 0 0 0 0 2,492,000 2,331,819 628,000Capital Outlay 0 0 0 0 0 0 0Miscellaneous 0 0 0 0 198,500 83,635 300,0006551 NSPIITOTALS 0 0 0 0 2,690,500 2,415,454 928,000Personnel Services 0 0 0 0 0 6,784 264,707Operating Expenses 0 0 0 0 500,000 384,993 5,235,293Capital Outlay 0 0 0 0 0 0 0Miscellaneous 0 0 0 0 0 0 0TOTAL NSPIITOTALS 0 0 0 0 500,000 391,777 5,500,000Personnel Services 0 0 0 0 0 6,784 264,707Operating Expenses 0 0 0 0 2,992,000 2,716,812 5,863,293Capital Outlay 0 0 0 0 0 0 0Miscellaneous 0 0 0 0 198,500 83,635 300,000TOTALEXPENDITURES 0 0 0 0 3,190,500 2,807,231 6,428,000286
FUND: 279 – Neighborhood Stabilization FundDEPARTMENT: Department <strong>of</strong> DevelopmentACTIVITY: 6550/6551 – Neighborhood Stabilization Fund (I and II)STRATEGIC NARRATIVEThis fund accounts for all residential and commercial demolition and housing rehabilitation funded byNeighborhood Stabilization dollars from the State <strong>of</strong> Michigan.1. Community DevelopmentFY <strong>2010</strong>/<strong>2011</strong> GOALS AND OBJECTIVESa. Secure funds and implement Phase 1 <strong>of</strong> Neighborhood Stabilization Program/MSHDA2009Actual<strong>2010</strong>Projected<strong>2011</strong>TargetDollars <strong>of</strong> secured funding N/A $3.5 million $5.8 millionNumber <strong>of</strong> demolishedcommercial propertiesN/A 21 10Number <strong>of</strong> abandonedproperties rehabbedN/A 0 4Number <strong>of</strong> demolitionresidential propertiesN/A 600 275287
EXPENDITURE ANALYSIS DETAIL<strong>2010</strong>/<strong>2011</strong> APPROVED BUDGET279-6550 NSP IAllocation PlanPosition Control<strong>2010</strong>/JOB <strong>2011</strong>PERSONNEL SERVICES CLASSIFICATION BUDGET ALLOCATIONSalaries 0 Total Personnel 0.00 0Overtime 0Fringe Benefits 0Overtime 0TOTAL0FICA 0OPERATING EXPENSES Healthcare Benefits - Active 0Healthcare Benefits - Retirees 0Supplies 0 Pension 0Internal Services 0Other Services Total Fringe Benefits 0Pr<strong>of</strong>essional Fees 28,000Maintenance Fees 600,000Other Contracted Fees 0 TOTAL 0.00 0TOTAL628,000CAPITAL OUTLAY 0TOTAL0<strong>MI</strong>SCELLANEOUS 300,000TOTAL300,000TOTAL APPROPRIATION 928,000288
EXPENDITURE ANALYSIS DETAIL<strong>2010</strong>/<strong>2011</strong> APPROVED BUDGET279-6551-761 NSP IIAllocation PlanPosition Control<strong>2010</strong>/JOB <strong>2011</strong>PERSONNEL SERVICES CLASSIFICATION BUDGET ALLOCATIONSalaries 196,849 Director <strong>of</strong> Development 0.30 27,396Overtime 0 Assistant Director 0.30 23,754Fringe Benefits 67,858 Licensed Inspector 0.50 34,669NSP Accountant/TOTAL264,707 Compliance Officer 1.00 63,614Construction Coordinator 1.00 47,417OPERATING EXPENSES Total Personnel 3.10 196,849Supplies 0Internal Services 0 Overtime 0Other ServicesPr<strong>of</strong>essional Fees 5,235,293 FICA 15,174Maintenance Fees 0 Healthcare Benefits - Active 41,208Other Contracted Fees 0 Healthcare Benefits - Retirees 0Pension 11,476TOTAL5,235,293Total Fringe Benefits 67,858CAPITAL OUTLAY 0TOTAL0TOTAL 3.10 264,707<strong>MI</strong>SCELLANEOUS 0TOTAL0TOTAL APPROPRIATION 5,500,000289
SECTION 108 LOANS (281)RESOURCE ALLOCATION<strong>2010</strong>/<strong>2011</strong> APPROVED BUDGETRESOURCESAPPROPRIATIONSINTEREST 10,000 INCREASE IN FUND EQUITY 10,000TOTAL RESOURCES 10,000 TOTAL APPROPRIATIONS 10,000290
SECTION 108 LOANS (281)<strong>2010</strong>/<strong>2011</strong> APPROVED BUDGET<strong>2010</strong> <strong>2010</strong> <strong>2011</strong>2007 2008 2009 Approved Adjusted <strong>2010</strong> ApprovedActual Actual Actual <strong>Budget</strong> <strong>Budget</strong> Projected <strong>Budget</strong>REVENUE ANALYSIS SUMMARYFederal Grants 0 0 0 0 0 0 0Interest and Rents 0 15,000 0 10,000 10,000 1,447 10,000TOTAL RESOURCES 0 15,000 0 10,000 10,000 1,447 10,0008559 INCREASE IN FUND EQUITYPersonnel Services 0 0 0 0 0 0 0Operating Expenses 0 0 0 0 0 0 0Capital Outlay 0 0 0 0 0 0 0Miscellaneous 0 0 0 10,000 10,000 0 10,000TOTALS 0 0 0 10,000 10,000 0 10,000TOTAL SECTION 108 LOANSEXPENDITURE ANALYSIS SUMMARYPersonnel Services 0 0 0 0 0 0 0Operating Expenses 0 0 0 0 0 0 0Capital Outlay 0 0 0 0 0 0 0Miscellaneous 0 0 0 10,000 10,000 0 10,000TOTALEXPENDITURES 0 0 0 10,000 10,000 0 10,000291
SEDC REVOLVING LOAN (282)RESOURCE ALLOCATION<strong>2010</strong>/<strong>2011</strong> APPROVED BUDGETRESOURCESAPPROPRIATIONSCHARGE FOR SERVICES 0 SEDC 400,000INTEREST AND RENTS 50,000 TRANSFERS OUT 0OTHER REVENUES 350,000TOTAL RESOURCES 400,000 TOTAL APPROPRIATIONS 400,000292
SEDC REVOLVING LOAN (282)<strong>2010</strong>/<strong>2011</strong> APPROVED BUDGET<strong>2010</strong> <strong>2010</strong> <strong>2011</strong>2007 2008 2009 Approved Adjusted <strong>2010</strong> ApprovedActual Actual Actual <strong>Budget</strong> <strong>Budget</strong> Projected <strong>Budget</strong>REVENUE ANALYSIS SUMMARYCharge for Services 750 1,000 750 0 0 2,000 0Interest and Rents 76,296 49,000 60,366 50,000 50,000 67,827 50,000Other Revenues 202,517 150,000 162,568 350,000 350,000 286,074 350,000TOTAL RESOURCES 279,562 200,000 223,684 400,000 400,000 355,901 400,0008570 SAGINAW ECONO<strong>MI</strong>C DEVELOPMENT CORPORATIONPersonnel Services 0 0 0 0 0 0 0Operating Expenses 0 0 0 0 0 0 0Capital Outlay 0 0 0 0 7,035 0 0Miscellaneous 132,979 101,663 745,320 400,000 392,965 355,901 400,000TOTALS 132,979 101,663 745,320 400,000 400,000 355,901 400,000TOTAL SEDC REVOLVING LOANSEXPENDITURE ANALYSIS SUMMARYPersonnel Services 0 0 0 0 0 0 0Operating Expenses 0 0 0 0 0 0 0Capital Outlay 0 0 0 0 7,035 0 0Miscellaneous 132,979 101,663 745,320 400,000 392,965 355,901 400,000TOTALEXPENDITURES 132,979 101,663 745,320 400,000 400,000 355,901 400,000293
POSITION ANALYSIS<strong>2010</strong>/<strong>2011</strong> APPROVED BUDGET<strong>2010</strong> <strong>2010</strong> <strong>2011</strong>2007 2008 2009 Approved Adjusted <strong>2010</strong> ApprovedActual Actual Actual <strong>Budget</strong> <strong>Budget</strong> Projected <strong>Budget</strong>SPECIAL REVENUE FUND - COMMUNITY DEVELOPMENT BLOCK GRANT (CDBG)CDBG - Administration 7.78 7.78 6.78 6.78 6.78 6.78 1.98CDBG - Community Services 1.00 1.00 2.00 2.00 2.00 2.00 2.00<strong>Saginaw</strong> Economic Dev. Corp. 1.35 1.35 1.25 1.25 1.25 1.25 1.05CDBG - Code Compliance 2.25 2.25 2.00 2.00 2.00 2.00 2.00CDBG - Residential Loans 1.70 1.70 1.70 1.50 1.70 1.70 1.50CDBG - Home Program 0.92 0.92 0.92 0.92 0.92 0.92 1.12Neighborhood Stab. Program 0.00 0.00 0.00 0.00 0.00 0.00 3.10TOTAL POSITIONS 15.00 15.00 14.65 14.45 14.65 14.65 12.75The overall Community Development Block Grant Fund will decrease by approximately 1.90 positions from the <strong>2010</strong> approved budgeted levels.In the CDBG Administration Division the Accountant/SEDC Coordinator and .20 <strong>of</strong> the Director will be redistributed to the NeighborhoodStabilization Fund (NSP). Likewise, the Office Assistant and three Intern positions will be eliminated from the FY <strong>2011</strong> budget. In the <strong>Saginaw</strong>Economic Development Corp. (SEDC) Division, .20 <strong>of</strong> the Accountant/SEDC Coordinator will be redistributed to the NSP Fund. In theResidential Loans Fund, .20 <strong>of</strong> the Rehabiliation Application Specialist will be redistributed to the Home Program Fund. In the NeighborhoodStabilization Fund, .30 <strong>of</strong> the Director <strong>of</strong> Development, .30 <strong>of</strong> the Assistant Director, .50 <strong>of</strong> the Licensed Inspector as well as the ConstructionCoordinator will be added to the complement. Furthermore, the Accountant/SEDC Coordinator will be retitled to NSP Accountant/ComplainceOfficer.294
ENTERPRISE FUNDS
CELEBRATION PARK (508)RESOURCE ALLOCATION<strong>2010</strong>/<strong>2011</strong> APPROVED BUDGETFrank N. Andersen - Celebration Park (formerly known as Andersen Water Park) is the <strong>City</strong> <strong>of</strong> <strong>Saginaw</strong>'snewest community recreation experience located in the heart <strong>of</strong> the <strong>City</strong>. Celebration Park is beingredeveloped into the most exciting recreation experience in the Tri-Cities. The <strong>City</strong>'s mission was torepurpose the former Andersen Water Park into a lower cost, lower maintenance facility that is free to thepublic and for the use <strong>of</strong> people <strong>of</strong> all ages and abilities.Frank N. Andersen - Celebration Park is community park that will be comfortable and easily accessiblewith shaded areas, walking paths, and leisure activities. It will contain a variety <strong>of</strong> activities and learningexperiences, and takes advantage <strong>of</strong> the natural surroundings. The park will provide a relaxed setting forsocial interaction and will focus on improving the community and the families that live here. The new parkwill feature a water splash park, skateboarding plaza, playground, a scenic boardwalk along Lake Linton,bocce ball courts, volleyball courts, picnic pavilion, exercise path, and open green space. Best <strong>of</strong> all thepark is free to the public.RESOURCESAPPROPRIATIONSSTATE GRANTS 200,000 CELEBRATION PARK 908,181LOCAL GRANTS 708,181TOTAL RESOURCES 908,181 TOTAL APPROPRIATIONS 908,181295
CELEBRATION PARK (508)<strong>2010</strong>/<strong>2011</strong> APPROVED BUDGET<strong>2010</strong> <strong>2010</strong> <strong>2011</strong>2007 2008 2009 Approved Adjusted <strong>2010</strong> ApprovedActual Actual Actual <strong>Budget</strong> <strong>Budget</strong> Projected <strong>Budget</strong>REVENUE ANALYSIS SUMMARYState Grants 0 0 0 480,000 480,000 48,000 200,000Local Grants 0 0 0 300,000 300,000 53,500 708,181Services and Sales 0 0 29,650 0 0 111 0Interest and Rents 0 0 0 0 0 210 0Other Revenue 0 0 0 0 55,226 0 0Transfers from Other Fds 0 0 100,000 0 107,262 107,307 0TOTAL RESOURCES 0 0 129,650 780,000 942,488 209,128 908,181REVENUE ANALYSIS DETAILState Grants 0 0 0 480,000 480,000 48,000 200,000Total State Grants 0 0 0 480,000 480,000 48,000 200,000Local Grants 0 0 0 300,000 300,000 53,500 708,181Total Local Grants 0 0 0 300,000 300,000 53,500 708,181Service - Sales 0 0 29,650 0 0 111 0Total Service - Sales 0 0 29,650 0 0 111 0Interest and Rents 0 0 0 0 0 210 0Total Interest & Rents 0 0 0 0 0 210 0Other Revenue 0 0 0 0 55,226 0 0Total Other Revenue 0 0 0 0 55,226 0 0Transfers from Other Fds 0 0 100,000 0 107,262 107,307 0Total Transfers 0 0 100,000 0 107,262 107,307 0Total Resources 0 0 129,650 780,000 942,488 209,128 908,181296
CELEBRATION PARK (508)<strong>2010</strong>/<strong>2011</strong> APPROVED BUDGET<strong>2010</strong> <strong>2010</strong> <strong>2011</strong>2007 2008 2009 Approved Adjusted <strong>2010</strong> ApprovedActual Actual Actual <strong>Budget</strong> <strong>Budget</strong> Projected <strong>Budget</strong>EXPENDITURE ANALYSIS SUMMARY7580 CELEBRATION PARKPersonnel Services 0 0 0 0 0 0 22,181Operating Expenses 0 0 38,034 780,000 1,517,488 809,717 846,000Capital Outlay 0 0 0 0 26,000 3,305 40,000Miscellaneous 0 0 0 0 0 0 0TOTALS 0 0 38,034 780,000 1,543,488 813,022 908,181TOTAL CELEBRATION PARKPersonnel Services 0 0 0 0 0 0 22,181Operating Expenses 0 0 38,034 780,000 1,517,488 809,717 846,000Capital Outlay 0 0 0 0 26,000 3,305 40,000Miscellaneous 0 0 0 3,080 0 0 0TOTAL EXPENDITURES0 0 38,034 783,080 1,543,488 813,022 908,181297
EXPENDITURE ANALYSIS DETAIL<strong>2010</strong>/<strong>2011</strong> APPROVED BUDGET508-7580 Celebration ParkAllocation PlanPosition Control<strong>2010</strong>/JOB <strong>2011</strong>PERSONNEL SERVICES CLASSIFICATION BUDGET ALLOCATIONSalaries 20,605 Splash Park Coordinator 3.00 10,232Overtime 0 Splash Park Attendants 6.00 10,373Fringe Benefits 1,576Total Personnel 9.00 20,605TOTAL22,181OPERATING EXPENSESOvertime 0Supplies 26,000 FICA 1,576Internal Services 0 Healthcare Benefits - Active 0Other Services Healthcare Benefits - Retirees 0Pr<strong>of</strong>essional Fees 20,000 Pension 0Maintenance Fees 800,000Other Contracted Fees 0 Total Fringe Benefits 1,576TOTAL846,000 TOTAL 9.00 22,181CAPITAL OUTLAY 40,000TOTAL40,000<strong>MI</strong>SCELLANOUS 0TOTAL0TOTAL APPROPRIATION 908,181298
PARKING OPERATIONS AND MAINTENANCE FUND (516)RESOURCE ALLOCATION<strong>2010</strong>/<strong>2011</strong> APPROVED BUDGETRESOURCESAPPROPRIATIONSCHARGE FOR SERVICES 170,000 PARKING OPERATIONS 314,562FINES AND FORFEITURES 120,000 TRANSFERS OUT 3,120INTEREST AND RENTS 0OTHER REVENUES 0TRANSFERS IN 27,682TOTAL RESOURCES 317,682 TOTAL APPROPRIATIONS 317,682299
PARKING SYSTEMS OPERATIONS (516)<strong>2010</strong>/<strong>2011</strong> APPROVED BUDGET<strong>2010</strong> <strong>2010</strong> <strong>2011</strong>2007 2008 2009 Approved Adjusted <strong>2010</strong> ApprovedActual Actual Actual <strong>Budget</strong> <strong>Budget</strong> Projected <strong>Budget</strong>REVENUE ANALYSIS SUMMARYCharge for Services 170,317 176,492 175,427 177,200 177,200 159,743 170,000Fines and Forfeitures 139,124 122,292 111,538 172,109 172,109 149,016 120,000Interest and Rents 0 (512) (267) 0 0 76 0Other Revenues 548 (43,063) 0 0 0 0 0Transfers from Other Funds 232,191 39,824 420,880 106,611 106,611 106,611 27,682TOTAL RESOURCES 542,180 295,033 707,578 455,920 455,920 415,446 317,682REVENUE ANALYSIS DETAILBoot Removal Fees 1,100 150 200 200 200 250 0Parking Ramp #1 37,438 37,954 37,174 37,000 37,000 35,559 35,000Parking Ramp #2 0 740 90 0 0 0 0Parking Lot Receipts 131,779 137,648 137,963 140,000 140,000 123,934 135,000Total Charge for Services 170,317 176,492 175,427 177,200 177,200 159,743 170,000Parking Violation Fines 139,124 122,292 111,538 172,109 172,109 149,016 120,000Total Fines and Forfeitures 139,124 122,292 111,538 172,109 172,109 149,016 120,000Interest on Investments 0 (512) (267) 0 0 76 0Total Interest and Rents 0 (512) (267) 0 0 76 0Surplus Receipts 11 (43,063) 0 0 0 0 0Reimbursements 537 0 0 0 0 0 0Total Other Revenues 548 (43,063) 0 0 0 0 0Transfers from Other Funds 232,191 0 0 0 0 0 0GF Transfer (Reserved) 0 39,824 420,880 106,611 106,611 106,611 27,682Total Transfers 232,191 39,824 420,880 106,611 106,611 106,611 27,682Total Resources 542,180 295,033 707,578 455,920 455,920 415,446 317,682300
PARKING SYSTEMS OPERATIONS (516)<strong>2010</strong>/<strong>2011</strong> APPROVED BUDGET<strong>2010</strong> <strong>2010</strong> <strong>2011</strong>2007 2008 2009 Approved Adjusted <strong>2010</strong> ApprovedActual Actual Actual <strong>Budget</strong> <strong>Budget</strong> Projected <strong>Budget</strong>7510 PARKING OPERATIONS/MAINTENANCEEXPENDITURE ANALYSIS SUMMARYPersonnel Services 208,754 202,561 205,787 221,250 221,250 176,872 207,206Operating Expenses 151,937 160,809 116,593 125,135 125,135 68,581 107,356Capital Outlay 321 0 0 0 0 0 0Miscellaneous 0 0 0 106,455 106,455 106,455 0TOTALS 361,012 363,370 322,380 452,840 452,840 351,908 314,5629660 TRANSFERS TO OTHER FUNDSPersonnel Services 0 0 0 0 0 0 0Operating Expenses 0 0 0 0 0 0 0Capital Outlay 0 0 0 0 0 0 0Miscellaneous 2,621 2,621 3,080 3,080 3,080 3,080 3,120TOTALS 2,621 2,621 3,080 3,080 3,080 3,080 3,120TOTAL PARKING SYSTEM FUNDPersonnel Services 208,754 202,561 205,787 221,250 221,250 176,872 207,206Operating Expenses 151,937 160,809 116,593 125,135 125,135 68,581 107,356Capital Outlay 321 0 0 0 0 0 0Miscellaneous 2,621 2,621 3,080 109,535 109,535 109,535 3,120TOTAL EXPENDITURES 363,633 365,991 325,460 455,920 455,920 354,988 317,682301
POSITION ANALYSIS<strong>2010</strong>/<strong>2011</strong> APPROVED BUDGET<strong>2010</strong> <strong>2010</strong> <strong>2011</strong>2007 2008 2009 Approved Adjusted <strong>2010</strong> ApprovedActual Actual Actual <strong>Budget</strong> <strong>Budget</strong> Projected <strong>Budget</strong>ENTERPRISE FUNDS - PARKING OPERATIONS AND MAINTENANCEParking Operations 2.50 2.25 2.00 2.00 2.00 2.00 1.00TOTAL POSITIONS 2.50 2.25 2.00 2.00 2.00 2.00 1.00In the <strong>2010</strong>/<strong>2011</strong> Approved <strong>Budget</strong>, this fund will decrease by one Meter Attendant position. Inaddition, the remaining Meter Attendant position will be retitled to Parking Enforcement Officer. Thisposition will report directly to the Licensed Inspector in the Department <strong>of</strong> Development302
FUND: 516 – Parking Operations and Maintenance FundDEPARTMENT: Public ServicesACTIVITY: 7510 – Parking OperationSTRATEGIC NARRATIVESThe functions <strong>of</strong> this fund is to provide city residents and visitors with convenient, properly maintainedand supervised municipal parking located within a reasonable distance <strong>of</strong> their destination, and toprovide enforcement <strong>of</strong> the <strong>City</strong>’s parking ordinances. This fund is responsible for the operation andmaintenance <strong>of</strong> the city parking system consisting <strong>of</strong> two parking ramps, and ten surface parking lots.One Parking Enforcement Officer with the assistance <strong>of</strong> <strong>City</strong> Code Enforcement Officers and SCENICpatrol <strong>City</strong> streets and municipal parking lots to enforce parking regulations.FY <strong>2010</strong>/<strong>2011</strong> GOALS AND OBJECTIVES1. To provide revenue for the parking system by collecting parking fees and finesa. Maintain the parking lots and ramps at existing levels2009Actual<strong>2010</strong>Projected<strong>2011</strong>TargetNumber <strong>of</strong>Citations Issued 4,646 9,000 12,0002. Continue to increase awareness <strong>of</strong> the existing downtown parking options with businesses, andmarket the facilities to attract new business and monthly parkers.a. Increase Income2009Actual<strong>2010</strong>Projected<strong>2011</strong>TargetNumber <strong>of</strong>attendants 1 1 13. To decrease the number <strong>of</strong> surface parking lots not economically beneficial to the city’soperation through sale or lease options.a. Evaluate use <strong>of</strong> lots2009Actual<strong>2010</strong>Projected<strong>2011</strong>TargetNumber<strong>of</strong> Lots 8 8 4303
EXPENDITURE ANALYSIS DETAIL<strong>2010</strong>/<strong>2011</strong> APPROVED BUDGET516-7510 Parking SystemAllocation PlanPosition Control<strong>2010</strong>/JOB <strong>2011</strong>PERSONNEL SERVICES CLASSIFICATION BUDGET ALLOCATIONSalaries 30,715 Parking Enforcement 1.00 30,715Overtime 5,000 OfficerFringe Benefits 171,491Total Personnel 1.00 30,715TOTAL207,206OPERATING EXPENSESOvertime 5,000Supplies 10,073 FICA 2,733Internal Services 7,309 Healthcare Benefits - Active 17,557Other Services Healthcare Benefits - Retirees 119,817Pr<strong>of</strong>essional Fees 46,821 Pension 31,384Maintenance Fees 39,653Other Contracted Fees 3,500 Total Fringe Benefits 171,491TOTAL107,356 TOTAL 1.00 207,206CAPITAL OUTLAY 0TOTAL0<strong>MI</strong>SCELLANEOUS 3,120TOTAL3,120TOTAL APPROPRIATION 317,682304
WAVE POOL OPERATIONS (587)RESOURCE ALLOCATION<strong>2010</strong>/<strong>2011</strong> APPROVED BUDGETRESOURCESAPPROPRIATIONSINTEREST AND RENTS 2,500 WAVE POOL OPERATIONS 2,500TOTAL RESOURCES 2,500 TOTAL APPROPRIATIONS 2,500This fund account provided for the operations <strong>of</strong> the Andersen Water Park. The operations featured anamusement park like atmosphere for local residents and out <strong>of</strong> town guests. This fund is no longer in useand is being included for historical purposes only. The revenues received are based on interest oninvestments. No monies have been expended in many years.305
WAVE POOL OPERATIONS (587)<strong>2010</strong>/<strong>2011</strong> APPROVED BUDGET<strong>2010</strong> <strong>2010</strong> <strong>2011</strong>2007 2008 2009 Approved Adjusted <strong>2010</strong> ApprovedActual Actual Actual <strong>Budget</strong> <strong>Budget</strong> Projected <strong>Budget</strong>REVENUE ANALYSIS SUMMARYInterest and Rents 4,476 3,018 802 2,500 2,500 497 2,500Other Revenues 0 107,926 0 0 107,262 107,262 0TOTAL RESOURCES 4,476 110,944 802 2,500 109,762 107,759 2,500REVENUE ANALYSIS DETAILInterest on Investments 4,476 3,018 802 2,500 2,500 497 2,500Interest and Rents 4,476 3,018 802 2,500 2,500 497 2,500Contributions 0 100,000 0 0 0 0 0Service - Sales 0 7,926 0 0 0 0 0Use <strong>of</strong> Fund Equity 0 0 0 0 107,262 107,262 0Other Revenues 0 107,926 0 0 107,262 107,262 0TOTAL RESOURCES 4,476 110,944 802 2,500 109,762 107,759 2,5007560 WAVE POOL CONCESSIONEXPENDITURE ANALYSIS SUMMARYPersonnel Services 0 0 0 0 0 0 0Operating Expenses 0 0 0 2,500 2,500 0 2,500Capital Outlay 0 0 0 0 0 0 0Miscellaneous 0 0 0 0 0 0 0TOTALS 0 0 0 2,500 2,500 0 2,5009660 Operating TransfersPersonnel Services 0 0 0 0 0 0 0Operating Expenses 0 0 0 0 0 0 0Capital Outlay 0 0 0 0 0 0 0Miscellaneous 0 0 0 0 107,262 107,307 0TOTALS 0 0 0 0 107,262 107,307 0TOTAL WAVE POOL OPERATIONSPersonnel Services 0 0 0 0 0 0 0Operating Expenses 0 0 0 2,500 2,500 0 2,500Capital Outlay 0 0 0 0 0 0 0Miscellaneous 0 0 0 0 107,262 107,307 0TOTAL EXPENDITURES 0 0 0 2,500 109,762 107,307 2,500306
CITY OF SAGINAWSEWER OPERATIONS AND MAINTENANCE FUNDThomas DarnellDirector <strong>of</strong>Public ServicesEngineeringAdministrationMaintenance& ServicesDebtServiceMeterMaintenance& ServicesCatch BasinCleaingNote:The Water Operation and Maintenance fund recognizes their ongoing large capital projects through the Water Surplus and Water BondContruction Divisions. The Debt Service Division is where all debt service is paid.
CITY OF SAGINAWSEWER TREATMENT AND PROCESS CONTROL SYSTEMSKimberly MasonDirector <strong>of</strong>Water and WastewaterTreatmentProcessControlSystemsRemoteFacilitiesDebtServiceTreatment& PumpingSewer Surplus& BondConstructionNote:The Water Operation and Maintenance fund recognizes their ongoing large capital projects through the Water Surplus and Water BondContruction Divisions. The Debt Service Division is where all debt service is paid.
SEWER OPERATIONS AND MAINTENANCE FUND (590)RESOURCE ALLOCATION<strong>2010</strong>/<strong>2011</strong> APPROVED BUDGETRESOURCESAPPROPRIATIONSFEDERAL GRANTS 238,900 SEWER AD<strong>MI</strong>NISTRATION 2,508,482NON-BUSINESS PER<strong>MI</strong>TS 600 ENGINEERING AD<strong>MI</strong>N. 177,237SERVICES - SALES 20,751,952 PROCESS CONTROL SYSTEMS 262,452FINES AND FORFEITURES 144,000 METER MAINT. & SERVICE 424,207INTEREST AND RENTS 477,500 MAINTENANCE & SERVICE 2,004,149OTHER REVENUES 6,622,030 CATCH BASIN CLEANING 349,554TREATMENT & PUMPING 6,990,848REMOTE FACILITIES 1,810,860SEWER SURPLUS 3,275,757SEWER BOND CONSTRUCTION 3,470,000DEBT SERVICE 6,583,050CUSTOMER ACCOUNTING 330,432TRANSFERS 47,954TOTAL RESOURCES 28,234,982 TOTAL APPROPRIATIONS 28,234,982Note:Th <strong>2010</strong> <strong>Budget</strong> combined the Sewer Surplus Fund and the Sewer Bond Construction Fund into the Sewer Operations and MaintenanceFund.309
REVENUE ANALYSIS SUMMARY<strong>2010</strong>/<strong>2011</strong> APPROVED BUDGET<strong>2010</strong> <strong>2010</strong> <strong>2011</strong>2007 2008 2009 Approved Adjusted <strong>2010</strong> ApprovedActual Actual Actual <strong>Budget</strong> <strong>Budget</strong> Projected <strong>Budget</strong>Federal Grants 572 879,317 387,335 874,727 481,100 0 238,900Non-Business Permits 200 600 3,200 400 400 200 600Services - Sales 17,526,550 16,172,061 16,105,403 18,814,275 18,814,275 20,176,916 20,751,952Fines and Forfeitures 66,523 24,310 26,061 24,000 24,000 23,557 144,000Interest and Rents 529,415 510,527 464,801 477,500 477,500 567,930 477,500Other Revenues 169,846 23,473 174,327 6,097,942 11,403,356 2,910,756 6,622,030TOTAL RESOURCES 18,293,106 17,610,288 17,161,127 26,288,844 31,200,631 23,679,359 28,234,982REVENUE ANALYSIS DETAILState Shared Revenue 572 160,687 0 0 0 0 0FEMA 0 0 5,664 0 0 0 0EPA Grant 0 718,630 381,671 874,727 481,100 0 238,900Total Federal Grants 572 879,317 387,335 874,727 481,100 0 238,900IPP Permits 200 600 3,200 400 400 200 600Non-Business Permits 200 600 3,200 400 400 200 600Sewer 17,360,347 16,069,908 15,953,373 18,667,275 18,667,275 20,010,663 20,604,952Sewer Connections 23,681 16,892 19,523 25,000 25,000 8,293 25,000IPP Testing and Sampling 85,015 20,987 63,960 52,000 52,000 71,803 52,000Material and Services 57,507 64,274 68,547 70,000 70,000 86,157 70,000Services - Sales 17,526,550 16,172,061 16,105,403 18,814,275 18,814,275 20,176,916 20,751,952IPP Fines & Charges 66,523 24,310 26,061 24,000 24,000 23,557 144,000Fines and Forfeitures 66,523 24,310 26,061 24,000 24,000 23,557 144,000Interest on Investments 35,521 54,971 24,092 25,000 25,000 20,284 25,000Interest on Spec Asmt 134 2,556 2,224 2,500 2,500 0 2,500Interest and Penalties 493,760 453,000 438,485 450,000 450,000 547,647 450,000Interest and Rents 529,415 510,527 464,801 477,500 477,500 567,930 477,500Special Assessments 116,709 6,433 186,970 150,742 150,742 38,322 150,742Surplus Receipts 2,889 7,149 5,088 4,000 4,000 3,962 3,000Reimbursement 31,208 71 38 0 0 0 0Insurance Claims 0 0 0 0 0 0 0Gain/Loss on Invest. 19,040 9,820 (17,769) 10,000 10,000 15,043 10,000Use <strong>of</strong> Fund Equity 0 0 0 5,933,200 6,738,614 0 2,988,288Bond Proceeds/SRF 0 0 0 0 4,500,000 2,853,428 3,470,000Other Revenues 169,846 23,473 174,327 6,097,942 11,403,356 2,910,756 6,622,030TOTAL RESOURCES 18,293,106 17,610,288 17,161,127 26,288,844 31,200,631 23,679,359 28,234,982310
EXPENDITURE ANALYSIS SUMMARY<strong>2010</strong>/<strong>2011</strong> APPROVED BUDGET<strong>2010</strong> <strong>2010</strong> <strong>2011</strong>2007 2008 2009 Approved Adjusted <strong>2010</strong> ApprovedActual Actual Actual <strong>Budget</strong> <strong>Budget</strong> Projected <strong>Budget</strong>4810 SEWER AD<strong>MI</strong>NISTRATIONPersonnel Services 738,524 802,467 751,119 805,804 805,804 824,441 890,824Operating Expenses 6,214,346 6,341,089 6,588,736 1,591,008 1,591,008 2,369,521 1,617,158Capital Outlay 272 498 0 0 0 0 500TOTALS 6,953,142 7,144,054 7,339,855 2,396,812 2,396,812 3,193,962 2,508,4824811 ENGINEERING AD<strong>MI</strong>NISTRATIONPersonnel Services 0 0 (19) 154,496 154,496 142,487 164,415Operating Expenses 0 0 0 1,500 1,500 0 12,822Capital Outlay 0 0 0 0 0 0 0TOTALS 0 0 (19) 155,996 155,996 142,487 177,2374815 PROCESS CONTROLSYSTEMSPersonnel Services 102,991 102,738 97,134 97,682 97,682 97,269 100,731Operating Expenses 54,165 12,343 11,599 141,440 144,353 11,378 146,721Capital Outlay 2,949 6,125 1,422 16,000 16,000 6,479 15,000TOTALS 160,105 121,206 110,155 255,122 258,035 115,127 262,4524820 METER MAINTENANCEAND SERVICEPersonnel Services 296,711 267,645 349,173 733,410 733,410 519,523 361,100Operating Expenses 28,706 22,101 28,801 58,304 58,304 34,110 43,107Capital Outlay 1,823 0 0 29,500 29,500 0 20,000TOTALS 327,240 289,746 377,974 821,214 821,214 553,633 424,2074821 MAINTENANCE AND SERVICEPersonnel Services 897,545 977,492 1,100,222 1,259,429 1,259,429 1,113,200 1,273,993Operating Expenses 569,235 904,675 835,903 1,029,218 1,020,118 522,681 725,206Capital Outlay 35,037 7,080 6,779 10,000 11,100 2,316 4,950TOTALS 1,501,817 1,889,247 1,942,904 2,298,647 2,290,647 1,638,196 2,004,1494822 CATCH BASIN CLEANINGPersonnel Services 206,154 203,788 0 248,115 246,034 178,732 248,115Operating Expenses 49,092 57,038 300,515 100,000 108,000 86,006 101,439Capital Outlay 0 0 0 0 0 0 0TOTALS 255,246 260,826 300,515 348,115 354,034 264,738 349,554311
EXPENDITURE ANALYSIS SUMMARY<strong>2010</strong>/<strong>2011</strong> APPROVED BUDGET<strong>2010</strong> <strong>2010</strong> <strong>2011</strong>2007 2008 2009 Approved Adjusted <strong>2010</strong> ApprovedActual Actual Actual <strong>Budget</strong> <strong>Budget</strong> Projected <strong>Budget</strong>4830 TREATMENT AND PUMPINGPersonnel Services 3,339,874 3,509,854 3,646,292 3,962,373 3,962,373 3,689,716 3,991,868Operating Expenses 1,856,873 1,807,439 2,040,558 2,971,855 3,141,855 1,987,465 2,907,680Capital Outlay 19,227 20,248 14,241 79,000 84,000 29,192 91,300TOTALS 5,215,974 5,337,541 5,701,091 7,013,228 7,188,228 5,706,374 6,990,8484835 REMOTE FACILITIESPersonnel Services 514,498 426,131 771,248 864,285 864,285 785,181 870,854Operating Expenses 679,855 585,906 554,976 1,035,080 1,015,591 462,464 940,006Capital Outlay 19,397 2,031 11,687 0 23,493 7,177 0TOTALS 1,213,750 1,014,068 1,337,911 1,899,365 1,903,369 1,254,822 1,810,8604840 SEWER SURPLUSPersonnel Services 47,617 20,806 30,965 0 0 35,911 0Operating Expenses 9,971 3,899 1,962 0 555,426 4,150 550,000Capital Outlay (7,254) 23,549 87,372 4,145,000 3,922,319 1,219,636 2,725,757TOTALS 50,334 48,254 120,299 4,145,000 4,477,745 1,259,697 3,275,7574843 SEWER BOND CONSTRUCTIONPersonnel Services 0 0 0 0 0 0 0Operating Expenses 0 0 0 0 4,765,752 458,303 3,470,000Capital Outlay 0 0 0 0 0 0 0Miscellanous 0 0 0 0 0 0 0TOTALS 0 0 0 0 4,765,752 458,303 3,470,0004845 DEBT SERVICEPersonnel Services 0 0 0 0 0 0 0Operating Expenses 0 0 0 0 0 0 0Capital Outlay 0 0 0 0 0 0 0Miscellaneous 6,806,757 6,519,784 947,826 6,424,587 6,449,587 5,875,712 6,583,050TOTALS 6,806,757 6,519,784 947,826 6,424,587 6,449,587 5,875,712 6,583,0505311 CUSTOMER ACCOUNTINGPersonnel Services 207,560 219,902 230,991 262,636 262,636 243,722 259,129Operating Expenses 338,718 343,244 187,721 72,123 72,123 240,362 71,303Capital Outlay 337 90 219 0 0 0 0TOTALS 546,615 563,236 418,931 334,759 334,759 484,084 330,432312
EXPENDITURE ANALYSIS SUMMARY<strong>2010</strong>/<strong>2011</strong> APPROVED BUDGET<strong>2010</strong> <strong>2010</strong> <strong>2011</strong>2007 2008 2009 Approved Adjusted <strong>2010</strong> ApprovedActual Actual Actual <strong>Budget</strong> <strong>Budget</strong> Projected <strong>Budget</strong>9660 TRANSFERS TO OTHER FUNDSPersonnel Services 0 0 0 0 0 0 0Operating Expenses 0 0 0 0 0 0 0Capital Outlay 0 0 0 0 0 0 0Miscellaneous 40,288 40,288 47,338 47,338 47,338 47,338 47,954TOTALS 40,288 40,288 47,338 47,338 47,338 47,338 47,954TOTAL SEWER OPERATIONS AND MAINTENANCEPersonnel Services 6,351,474 6,530,823 6,977,125 8,388,230 8,386,149 7,630,183 8,161,029Operating Expenses 9,800,961 10,077,734 10,550,771 7,000,528 12,474,030 6,176,440 10,585,442Capital Outlay 71,788 59,621 121,720 4,279,500 4,086,412 1,264,800 2,857,507Miscellaneous 6,847,045 6,560,072 995,164 6,471,925 6,496,925 5,923,050 6,631,004TOTALEXPENDITURES 23,071,268 23,228,250 18,644,780 26,140,183 31,443,516 20,994,474 28,234,982313
POSITION ANALYSIS<strong>2010</strong>/<strong>2011</strong> APPROVED BUDGET<strong>2010</strong> <strong>2010</strong> <strong>2011</strong>2007 2008 2009 Approved Adjusted <strong>2010</strong> ApprovedActual Actual Actual <strong>Budget</strong> <strong>Budget</strong> Projected <strong>Budget</strong>ENTERPRISE FUND - SEWER OPERATIONS AND MAINTENANCE FUNDSewer Administration 3.03 3.03 2.93 1.88 1.88 1.88 1.88Engineering Administration 0.00 0.00 0.00 1.76 1.76 1.76 1.51Process Control Systems 1.00 1.00 1.00 1.00 1.00 1.00 1.00Meter Maintenance and Service 5.00 5.00 6.00 7.00 7.00 7.00 3.75Maintenance and Service 11.00 11.00 24.49 18.62 18.62 18.62 13.50Catch Basin Cleaning 1.00 5.00 5.25 4.75 4.75 4.75 2.95Treatment and Pumping 45.45 45.45 47.95 47.95 47.95 47.95 47.25Remote Facilities 9.55 9.55 11.55 10.55 10.55 10.55 10.75TOTAL POSITIONS 76.03 80.03 99.17 93.51 93.51 93.51 82.59During fiscal year <strong>2010</strong>, the <strong>City</strong> under went a citywide efficiency study, performed by Plante & Moran Consultants. As part <strong>of</strong> the study, itwas recommended that the Deputy Director <strong>of</strong> Public Services become a department head, responsible for the Water and WastewaterTreatment Plants. The <strong>2011</strong> Approved <strong>Budget</strong> reflect the change in the deputy director's status to a department head level. The currentdirector <strong>of</strong> public services will still supervisor all other functions <strong>of</strong> Water and Wastewater -Meter Maintenance and Services as well asMaintenance and Services Divisions. In addition, the study also recommended that the reporting structure for the Right-<strong>of</strong>-Way Divisions bechanged. After considerable review by city administration, it was determined that the <strong>City</strong> Engineer should be responsible for the Right-<strong>of</strong>-Way Division for both Water and Sewer Operations and Maintenance Funds as well as <strong>City</strong> street operations.The Approved <strong>2010</strong>/<strong>2011</strong> <strong>Budget</strong> reflects a 10.59 decreased from the <strong>2010</strong> approved levels. In the Engineering Administration Division, .50<strong>of</strong> a Traffic Electrician I position will be eliminated from the personnel complement due to the staffing and efficiency study. To <strong>of</strong>fset thisdecrease .25 <strong>of</strong> an Assistant <strong>City</strong> Engineer will be added to the complement. The Meter Maintenance and Services Division reflects a totaldecrease <strong>of</strong> 3.25 positions. This decease is attributed to the elimination <strong>of</strong> 2 part time Laborers, which were budgeted in previous years butwere not approved, the elimination <strong>of</strong> .25 <strong>of</strong> an Administrative Pr<strong>of</strong>essional, and the redistribution <strong>of</strong> an Utilities Person III to other funds. Inthe Maintenance and Services Division the complement decrease by 4.75 positions. Similar to the Meter Maintenance and Service division,this division eliminated 4.50 part time Laborer positions as well as .25 <strong>of</strong> an Administrative Pr<strong>of</strong>essional position. Also, within thesedivisions the following positions will have title changes - Assistant Superintendent <strong>of</strong> Right <strong>of</strong> Way (ROW), Chief Foreman, and UtilitiesForeman. The new titles are ROW Administrator, Chief ROW Utilities Foreman, and ROW Utilities Foreman.In the Catch Basin Cleaning Division, the complement will decrease by 1.80 positions. This decrease is due to the redistribution <strong>of</strong> 1.75 <strong>of</strong>the Crossover Operator positions as well as .05 <strong>of</strong> an Administratvie Pr<strong>of</strong>essional to other funds. In the Treatment and Pumping Division, .20<strong>of</strong> the Assistant Suptintendent <strong>of</strong> Wastewater will be redistributed to the Remote Facilities Division. In addition, similar to the ROWAdministrator, the Environmental Compliance Manager title will be changed to the Environmental Compliance Administrator.Note:Customer Account Division is represented in the Department <strong>of</strong> Fiscal Services.314
FUND: 590 – Sewer Operations and Maintenance FundDEPARTMENT: Public ServicesACTIVITY: 4810 - AdministrationSTRATEGIC NARRATIVEThe Administration division provides the necessary planning, general supervision, and coordination <strong>of</strong>the <strong>City</strong>'s wastewater operation so that local, state, and federal standards are met in a cost-effectivemanner. The wastewater operation provides service to the <strong>City</strong> <strong>of</strong> <strong>Saginaw</strong>, two-thirds <strong>of</strong> <strong>Saginaw</strong>Township, Carrollton Township, Kochville Township and the <strong>City</strong> <strong>of</strong> Zilwaukee. The <strong>City</strong> hascompleted their state-mandated CSO control program. Virtually all direct outfalls to the <strong>Saginaw</strong> Riverhave been eliminated, as flows have been diverted to the retention basins through collector sewers.Thus, even during wet weather events, all discharges will receive either full treatment at the wastewatertreatment facility or at last the equivalent <strong>of</strong> primary treatment, including disinfection.FY <strong>2010</strong>/<strong>2011</strong> GOALS AND OBJECTIVES1. To oversee and administer the sewer system operation in an efficient and economical manner.2. To establish rates to ensure that operations, debt service, and capital expenditure needs are met.315
EXPENDITURE ANALYSIS DETAIL<strong>2010</strong>/<strong>2011</strong> APPROVED BUDGET590-4810 Sewer AdministrationAllocation PlanPosition Control<strong>2010</strong>/JOB <strong>2011</strong>PERSONNEL SERVICES CLASSIFICATION BUDGET ALLOCATIONSalaries 131,473 Director <strong>of</strong> Public Services 0.40 40,557Overtime 0 Director <strong>of</strong> Water &Fringe Benefits 759,351 Wastewater Treatment Plants 0.50 44,438Staff Pr<strong>of</strong>essional 0.98 46,478TOTAL890,824Total Personnel 1.88 131,473OPERATING EXPENSESOvertime 0Supplies 600Internal Services 1,505,187Other Services FICA 11,058Pr<strong>of</strong>essional Fees 98,251 Healthcare Benefits - Active 28,023Maintenance Fees 920 Healthcare Benefits - Retirees 665,207Other Contracted Fees 12,200 Pension 55,063TOTAL1,617,158 Total Fringe Benefits 759,351CAPITAL OUTLAY 0 TOTAL 1.88 890,824TOTAL0TOTAL APPROPRIATION 2,507,982316
EXPENDITURE ANALYSIS DETAIL<strong>2010</strong>/<strong>2011</strong> APPROVED BUDGET590-4811 Engineering AdministrationAllocation PlanPosition Control<strong>2010</strong>/JOB <strong>2011</strong>PERSONNEL SERVICES CLASSIFICATION BUDGET ALLOCATIONSalaries 87,377 <strong>City</strong> Engineer 0.25 22,668Overtime 10,000 Assistant <strong>City</strong> Engineer 0.25 16,345Fringe Benefits 67,038 Engineering Office Supv. 0.25 15,166Engineering Technician I 0.13 6,063TOTAL164,415 Surveying Technician I 0.13 6,164Survey Assistant III 0.25 10,338Administrative Pr<strong>of</strong>essional 0.25 10,633OPERATING EXPENSESTotal Personnel 1.51 87,377Supplies 0Internal Services 11,822Other Services Overtime 10,000Pr<strong>of</strong>essional Fees 0Maintenance Fees 0Other Contracted Fees 1,000 FICA 7,449TOTALHealthcare Benefits - Active 22,99912,822 Healthcare Benefits - Retirees 0Pension 36,590CAPITAL OUTLAY 0 Total Fringe Benefits 67,038TOTAL0TOTAL 1.51 164,415TOTAL APPROPRIATION 177,237317
FUND: 590-Sewer Operations and Maintenance FundDEPARTMENT: Public ServicesACTIVITY: 4815 Process Control SystemSTATEGIC NARRATIVEThe Process Controls division provides the necessary planning, coordination, implementation andsupport <strong>of</strong> the sewer system’s automation projects. The division provides design, programming, training,maintenance and technical support to ensure the continuous operation <strong>of</strong> the Wastewater Plant’s controlsystems. The division also maintains the plant’s maintenance data system, the <strong>City</strong>’s security system,and the Automatic Meter Reading (AMR) system for the Maintenance and Services division.FY <strong>2010</strong>/<strong>2011</strong> GOALS AND OBJECTIVESThe primary goal <strong>of</strong> the Process Controls division is to maintain timely and accurate operationalinformation and Plant control to the Wastewater Treatment Plant thru the Supervisory Control and DataAcquisition (SCADA) System.1. Monitor SCADA computer operation to keep them up-to-date on service packs and securityupdates.a. Evaluate system against Micros<strong>of</strong>t Tech Net and Defender Updates Lists.b. Evaluate system against American Water Works Association (AWWA) Securityinformation list.c. Evaluate systems internal performance through utilities s<strong>of</strong>tware2. Maintain network communication for optimal data transfer speed and a high degree <strong>of</strong> security.a. Monitor Received Signal Strength Indication (RSSI) and signal strength values.b. Evaluate system against AWWA security information3. Recognize changes in the wastewater system and evaluate new technology to help the SCADAsystem evolve to better serve the Wastewater Treatment Plant staffa. Meet with staff to determine plant needs and desired changesb. Evaluate new products through vender meetings, technical data periodicals, anddiscussion with other wastewater systems staff..318
EXPENDITURE ANALYSIS DETAIL<strong>2010</strong>/<strong>2011</strong> APPROVED BUDGET590-4815 Process Control SystemsAllocation PlanPosition Control<strong>2010</strong>/JOB <strong>2011</strong>PERSONNEL SERVICES CLASSIFICATION BUDGET ALLOCATIONSalaries 56,728 Instrument & Control Admin 0.50 34,952Overtime 0 Instrument & Control Tech 0.50 21,776Fringe Benefits 44,003Total Personnel 1.00 56,728TOTAL100,731OPERATING EXPENSESOvertime 0Supplies 66,000 FICA 4,340Internal Services 2,671 Healthcare Benefits - Active 15,788Other Services Healthcare Benefits - Retirees 0Pr<strong>of</strong>essional Fees 68,900 Pension 23,875Maintenance Fees 1,800Other Contracted Fees 7,350 Total Fringe Benefits 44,003TOTAL146,721TOTAL 1.00 100,731CAPITAL OUTLAY 15,000TOTAL15,000TOTAL APPROPRIATION 262,452319
FUND: 590 – Sewer Operations and Maintenance FundDEPARTMENT: Public ServicesACTIVITY: 4820 – Meter Maintenance and ServiceSTRATEGIC NARRATIVEThe Meter Maintenance and Service division’s responsibilities consist <strong>of</strong> installation, repair, and testing<strong>of</strong> the <strong>City</strong>’s 21,690 metered water connections; providing service for water turn-ons and turn-<strong>of</strong>fs dueto non-payment, and broken or leaking lines on private property; investigation <strong>of</strong> water leaks andcomplaints, installation <strong>of</strong> new meters and providing reading services for the entire metering stock. Thecost <strong>of</strong> this program is split between the Water and Sewer Operations and Maintenance Funds.1. To inspect 200 service lines.FY <strong>2010</strong>/<strong>2011</strong> GOALS AND OBJECTIVESa. Provide the funds for the operation <strong>of</strong> the Treatment Plants, Water and Sewer service, andWater Billing2009Actual<strong>2010</strong>Projected<strong>2011</strong>TargetService Calls 23,317 24,000 24,0002. To repair and test large water meters servicing commercial, industrial and wholesale customers.a. Bid out fixed base reading networkReduction <strong>of</strong>unaccountedfor water2009Actual<strong>2010</strong>Projected<strong>2011</strong>Target15.4% 12% 10%3. To provide daily service calls citywide.4. To provide emergency water service on a 24-hour basis.5. To read water meters on a monthly basis.320
EXPENDITURE ANALYSIS DETAIL<strong>2010</strong>/<strong>2011</strong> APPROVED BUDGET590-4820 Meter Maintenance & ServiceAllocation PlanPosition Control<strong>2010</strong>/JOB <strong>2011</strong>PERSONNEL SERVICES CLASSIFICATION BUDGET ALLOCATIONROW Administrator 0.25 18,560Salaries 172,748 Chief ROW Utilities Foreman 0.25 16,263Overtime 6,000 Mech Equip Repairperson II 0.25 11,112Fringe Benefits 182,352 Crossover Operator 1.00 41,622Utilities Person II 2.00 85,191TOTAL361,100Total Personnel 3.75 172,748OPERATING EXPENSESOvertime 6,000Supplies 10,500Internal Services 6,107Other Services FICA 13,866Pr<strong>of</strong>essional Fees 15,000 Healthcare Benefits - Active 65,305Maintenance Fees 11,500 Healthcare Benefits - Retirees 0Other Contracted Fees 0 Pension 103,181TOTAL43,107 Total Fringe Benefits 182,352CAPITAL OUTLAY 20,000 TOTAL 3.75 361,100TOTAL20,000TOTAL APPROPRIATION 424,207321
FUND: 590 – Sewer Operations and Maintenance FundDEPARTMENT: Public ServicesACTIVITY: 4821 –Maintenance and ServiceSTRATEGIC NARRATIVEThe Maintenance and Service division provides continuous maintenance and service on the <strong>City</strong>’s 306miles <strong>of</strong> the sewer system. Activities include cleaning and repairing <strong>of</strong> main sewers, manholes andcatch basins; construction <strong>of</strong> new sewer connections; installation <strong>of</strong> ratbait in manholes; inspection <strong>of</strong>new sewer connections; investigation <strong>of</strong> water backups; and locating and staking <strong>of</strong> the <strong>City</strong>’s sewerutilities prior to excavation by others.1. To maintain 306 miles <strong>of</strong> mainline sewer.FY <strong>2010</strong>/<strong>2011</strong> GOALS AND OBJECTIVESa. To clean 10 miles <strong>of</strong> sewer annuallyMaintain accuraterecords <strong>of</strong>activities2009Actual<strong>2010</strong>Projected<strong>2011</strong>Target12.5 miles 10 miles 10 miles2. To repair and replace mainlines and services as it becomes necessary.a. Investigate new technology for lining sewer laterals2009Actual<strong>2010</strong>Projected<strong>2011</strong>TargetNumber <strong>of</strong> SewerLaterals Replaced 186 128 100322
EXPENDITURE ANALYSIS DETAIL<strong>2010</strong>/<strong>2011</strong> APPROVED BUDGET590-4821 Maintenance & ServiceAllocation PlanPosition Control<strong>2010</strong>/JOB <strong>2011</strong>PERSONNEL SERVICES CLASSIFICATION BUDGET ALLOCATIONSalaries 588,627 ROW Administratior 0.25 18,560Overtime 20,000 Chief ROW Utilities Foreman 0.25 16,263Fringe Benefits 665,366 ROW Utilities Foreman 1.00 52,558TOTALMech Equip Repairperson II 0.25 11,1121,273,993 Office Assistant III 0.50 18,437Utilities Person III 1.50 65,660Utilities Person II 2.50 103,824OPERATING EXPENSES Crossover Operator 7.00 291,727Tree Trimmer 0.25 10,486Supplies 525,700Internal Services 22,858 Total Personnel 13.50 588,627Other ServicesPr<strong>of</strong>essional Fees 75,954Maintenance Fees 94,694 Overtime 20,000Other Contracted Fees 6,000TOTAL725,206 FICA 47,371Healthcare Benefits - Active 287,423Healthcare Benefits - Retirees 0CAPITAL OUTLAY 4,950 Pension 330,572TOTAL4,950 Total Fringe Benefits 665,366TOTAL APPROPRIATION 2,004,149 TOTAL 13.50 1,273,993323
FUND: 590 – Sewer Operations and Maintenance FundDEPARTMENT: Public ServicesACTIVITY: 4822 – Catch Basin CleaningSTRATEGIC NARRATIVEThe Catch Basin Cleaning Division provides the necessary cleaning <strong>of</strong> local and major streets catchbasins by sweeping debris from <strong>City</strong> streets that may block catch basin grates and restrictor plates.FY <strong>2010</strong>/<strong>2011</strong> GOALS AND OBJECTIVES1. To reduce the plugging <strong>of</strong> street catch basins by efficient use <strong>of</strong> street sweepers.a. To reduce the amount <strong>of</strong> finesand and dirt from entering the combined sewer system2009Actual<strong>2010</strong>Projected<strong>2011</strong>TargetCatch basinscleaned N/A 5,000 5,0002. To reduce the amount <strong>of</strong> debris on city streetsa. To sweep all local and major streets once each month during the period between April 1 st and2009<strong>2010</strong><strong>2011</strong>Actual Projected TargetMiles Swept 900 1,200 1,200324
EXPENDITURE ANALYSIS DETAIL<strong>2010</strong>/<strong>2011</strong> APPROVED BUDGET590-4822 Catch Basin CleaningAllocation PlanPosition Control<strong>2010</strong>/JOB <strong>2011</strong>PERSONNEL SERVICES CLASSIFICATION BUDGET ALLOCATIONSalaries 125,399 Heavy Equipment Operator 2.50 106,600Overtime 2,000 Tree Trimmer 0.25 10,438Fringe Benefits 120,716 Administrative Pr<strong>of</strong>essional 0.20 8,361TOTAL248,115 Total Personnel 2.95 125,399OPERATING EXPENSES Overtime 2,000Supplies 0Internal Services 1,439 FICA 9,821Other Services Healthcare Benefits - Active 53,366Pr<strong>of</strong>essional Fees 100,000 Healthcare Benefits - Retirees 0Maintenance Fees 0 Pension 57,529Other Contracted Fees 0Total Fringe Benefits 120,716TOTAL101,439CAPITAL OUTLAY 0TOTAL 2.95 248,115TOTAL0TOTAL APPROPRIATION 349,554325
FUND: 590 – Sewer Operations and Maintenance FundDEPARTMENT: Public ServicesACTIVITY: 4830 – Treatment and PumpingSTRATEGIC NARRATIVEThe Wastewater Treatment and Pumping division collects and treats combined sewage from the <strong>City</strong> <strong>of</strong><strong>Saginaw</strong>, the Weiss St. Drainage District in <strong>Saginaw</strong> Township, and sanitary sewage from the NorthwestUtilities Authority (NWUA) service area, and part <strong>of</strong> Spaulding Township. The division provides industrialpretreatment services for all areas served, and treatment <strong>of</strong> all combined sewage captured by seven retentiontreatment basins. Collection and treatment <strong>of</strong> landfill leachate from Crow Island Landfill and trucked wastesfrom several local septic tank cleaning firms are also provided. 6,247 million gallons <strong>of</strong> wastewater weretreated during fiscal year 2009 with an average treated flow <strong>of</strong> 23.58 million gallons per day.FY <strong>2010</strong>/<strong>2011</strong> GOALS AND OBJECTIVESTo efficiently and effectively treat all wastewater flows, discharge the clean water safely back to theenvironment, and to protect the public health.1. To meet all National Pollutant Discharge Elimination System Permit (NPDES) requirements.a. Number <strong>of</strong> NPDES Permit violations2009Actual<strong>2010</strong>Projected<strong>2011</strong>TargetNumber <strong>of</strong> NPDES Permitviolations 0 0 0b. Number <strong>of</strong> required reports submitted on time2009Actual<strong>2010</strong>Projected<strong>2011</strong>TargetNumber <strong>of</strong> required reportssubmitted on time. 12 12 12c. Number <strong>of</strong> months without an NPDES violation2009Actual<strong>2010</strong>Projected<strong>2011</strong>TargetNumber <strong>of</strong> months withoutan NPDES violation 12 12 122. To prevent treatment upsets, contaminant pass through, biosolids contamination, and physicaldamage to the plant and collection system.a. Number <strong>of</strong> days effluent quality exceeded discharge standardsNumber <strong>of</strong> days effluentquality exceeded dischargestandards2009Actual326<strong>2010</strong>Projected<strong>2011</strong>Target0 0 0
. Number <strong>of</strong> Sewer Use Ordinance violations by industrial usersNumber <strong>of</strong> Sewer UseOrdinance violations byindustrial users.2009Actual<strong>2010</strong>Projected<strong>2011</strong>Target85 80 703. To enhance efficiency in the operation <strong>of</strong> the plant.a. Wastewater treatment costs per million gallons2009Actual<strong>2010</strong>Projected<strong>2011</strong>TargetWastewater treatment costsper million gallons. $662 $681 $662b. Sludge disposal costs per dry ton2009Actual<strong>2010</strong>Projected<strong>2011</strong>TargetSludge disposal costs perdry ton $58 $75 $58c. Cost <strong>of</strong> treatment chemicals per million gallons <strong>of</strong> water treatedCost <strong>of</strong> treatmentchemicals per milliongallons <strong>of</strong> water treated.2009Actual<strong>2010</strong>Projected<strong>2011</strong>Target$3.62 $3.62 $3.62d. Cost <strong>of</strong> energy per million gallons <strong>of</strong> water treated2009Actual<strong>2010</strong>Projected<strong>2011</strong>TargetCost <strong>of</strong> energy (per milliongallons <strong>of</strong> water treated) $66.83 $79.52 $66.83e. Cost <strong>of</strong> lime per ton <strong>of</strong> sludge treated2009Actual<strong>2010</strong>Projected<strong>2011</strong>TargetCost <strong>of</strong> lime per ton <strong>of</strong>sludge treated $17.73 $20.26 $20.26327
EXPENDITURE ANALYSIS DETAIL<strong>2010</strong>/<strong>2011</strong> APPROVED BUDGET590-4830 Treatment & PumpingAllocation PlanPosition Control<strong>2010</strong>/JOB <strong>2011</strong>PERSONNEL SERVICES CLASSIFICATION BUDGET ALLOCATIONSalaries 2,068,209 Supt <strong>of</strong> Wastewater Tmt 0.80 68,898Overtime 90,000 Asst Supt <strong>of</strong> Wastewater 0.80 56,323Fringe Benefits 1,833,659 Chief Chemist 1.00 58,237TOTALOperating Foreman 5.00 242,7543,991,868 Plant Mtce Foreman WW 1.00 51,204Electrical Mtce Foreman 0.75 44,697Plant Engineer 0.80 53,762OPERATING EXPENSES Plant Maintenance Supervisor 0.35 23,160Environ Compliance Admin. 1.00 64,653Supplies 727,140 Environ Compliance Analyst 3.00 126,001Internal Services 74,410 Plant Mtce Electrician B 2.50 113,555Other Services Plant Operator B 10.00 423,914Pr<strong>of</strong>essional Fees 1,025,458 Equipment & Safety Specialist 0.75 31,826Maintenance Fees 932,122 Administrative Pr<strong>of</strong>essional 0.75 31,352Other Contracted Fees 148,550 Laboratory Technician 2.00 86,417Plant Mtce. Mechanic B 1.00 43,696TOTAL2,907,680 Sewage Plant Mtce Person III 1.00 43,614Sewage Plant Mtce Person II 4.00 170,793Sewage Plant Mtce Person I 5.00 210,225CAPITAL OUTLAY 91,300 Remote Facilities Person II 1.00 42,745TOTALTOTAL APPROPRIATION 6,990,848Stock Clerk WWT 0.75 31,22891,300 Custodial Worker B 1.00 39,920Laborer (Temp) 2.00 6,157Intern (Temp) 1.00 3,078Total Personnel 47.25 2,068,209Overtime 90,000FICA 167,419Healthcare Benefits - Active 670,545Healthcare Benefits - Retirees 0Pension 995,695Total Fringe Benefits 1,833,659TOTAL 47.25 3,991,868328
FUND: 590 – Sewer Operations and Maintenance FundDEPARTMENT: Public ServicesACTIVITY: 4835– Remote FacilitiesSTRATEGIC NARRATIVEThe Remote Facilities division <strong>of</strong> the Wastewater Treatment Department services a 10,000-acrewatershed. This includes 53.3 million gallons <strong>of</strong> total storage, which prevent untreated combined sewageoverflows (CSOs) from impacting the <strong>Saginaw</strong> River. Collection and treatment includes 5 PumpStations and 7 CSO Facilities.FY <strong>2010</strong>/<strong>2011</strong> GOALS AND OBJECTIVES1. The primary goals <strong>of</strong> the Remote Facilities (Retention Treatment Basins, RTBs) are to containand treat wet weather flows in excess <strong>of</strong> the capacity <strong>of</strong> the Wastewater Treatment Plant and tominimize combined sewer overflows.a. To maximize use <strong>of</strong> RTB storage capacityNumber <strong>of</strong> rainevents with n<strong>of</strong>lows from RTBsto the riverNumber <strong>of</strong>discharges fromRTBs to the river2009Actual<strong>2010</strong>Projected<strong>2011</strong>Target16 16 162009Actual<strong>2010</strong>Projected<strong>2011</strong>Target13 13 13b. To assure disinfection <strong>of</strong> all treated water discharged from the RTBs to the riverNumber <strong>of</strong>NPDES permitviolations2009Actual<strong>2010</strong>Projected<strong>2011</strong>Target2 2 0329
EXPENDITURE ANALYSIS DETAIL<strong>2010</strong>/<strong>2011</strong> APPROVED BUDGET590-4835 Remote FacilitiesAllocation PlanPosition Control<strong>2010</strong>/JOB <strong>2011</strong>PERSONNEL SERVICES CLASSIFICATION BUDGET ALLOCATIONSalaries 462,943 Supt <strong>of</strong> Wastewater Treatment 0.20 17,225Overtime 20,000 Asst. Supt <strong>of</strong> Wastewater Tmt 0.20 14,081Fringe Benefits 387,911 Plant Maintenance Supervisor 0.65 43,011TOTALPlant Engineer 0.20 13,441870,854 Electrical Maintenance Foreman 0.25 14,899Equipment & Safety Specialist 0.25 10,609Administrative Pr<strong>of</strong>essional 0.25 10,451OPERATING EXPENSES Stock Clerk WWT 0.25 10,409Plant Maint Mechanic B 1.00 44,430Supplies 407,100 Plant Maint Electrician B 0.50 22,490Internal Services 10,704 Remote Facilities Person III 1.00 42,280Other Services Remote Facilities Person II 5.00 214,585Pr<strong>of</strong>essional Fees 169,930 Laborer (Temp) 1.00 5,032Maintenance Fees 346,822Other Contracted Fees 5,450 Total Personnel 10.75 462,943TOTAL940,006Overtime 20,000CAPITAL OUTLAY 0FICA 37,347TOTAL0 Healthcare Benefits - Active 293,292Healthcare Benefits - Retirees 0Pension 57,272TOTAL APPROPRIATION 1,810,860Total Fringe Benefits 387,911TOTAL 10.75 870,854330
FUND: 590- Sewer Operation and Maintenance FundDEPARTMENT: Fiscal ServicesACTIVITY: 5311- Customer AccountingSTRATEGIC NARRATIVEThe Sewer Customer Accounting division is responsible for the billing and collections <strong>of</strong> all seweraccounts from users <strong>of</strong> the system. This involves initiating new accounts, insuring that meteredaccounts are read, edited, and billed in a timely manner, as well as closing accounts when requested ordelinquent. Staff members handle all bill payment arrangements, collection <strong>of</strong> returned checks, andinitiation <strong>of</strong> meter checks, and discontinuance <strong>of</strong> service for collection.FY <strong>2010</strong>/<strong>2011</strong> GOALS AND OBJECTIVES1. To provide quality customer service to all water and sewer customers.a. Improve the time between when the meters are read and when the bills are ready to print.Efficient training ins<strong>of</strong>tware and job dutiesfor all employeesLower the number <strong>of</strong>days between meterreads and billing2009Actual<strong>2010</strong>Projected<strong>2011</strong>Target95% 100% 100%2009Actual<strong>2010</strong>Projected<strong>2011</strong>Target12 10 7b. To decrease the customer wait time at the counter and on the phones.i. Monitor the number <strong>of</strong> complaints per calls taken each month.ii. If more than one customer is in line waiting, there will be a back up employee towait on them.2. To have accurate billing and a greater rate <strong>of</strong> collection.a. To reduce delinquent accounts by fifteen percent (15%).i. This will be accomplished by discontinuing active accounts with unpaid arrearsfive (5) days after the accounts are cycle billed.ii. This will allow for enhanced cash flows and reduction <strong>of</strong> water/sewer liens ontaxes rolls.b. To aggressively continue the collection process for those customers that are three (3)months delinquent with a balance <strong>of</strong> $100 dollars or more.i. This will be done by turning <strong>of</strong>f accounts for non-payment and by makingpayment arrangements with customers.331
EXPENDITURE ANALYSIS DETAIL<strong>2010</strong>/<strong>2011</strong> APPROVED BUDGET590-5311 Customer AccountingAllocation PlanPosition Control<strong>2010</strong>/JOB <strong>2011</strong>PERSONNEL SERVICES CLASSIFICATION BUDGET ALLOCATIONSalaries 137,453 Admin <strong>of</strong> Utilities Account 0.50 28,099Overtime 0 Collection Correspondent 0.50 19,405Fringe Benefits 121,676 Office Assistant III 1.50 54,704Customer Service Coordinator 0.38 11,674TOTAL259,129 Customer Service Rep 0.76 23,571Total Personnel 3.14 137,453OPERATING EXPENSESOvertime 0Supplies 1,500Provision for Losses 0Internal Services 23,303 FICA 10,611Other Services Healthcare Benefits - Active 47,351Pr<strong>of</strong>essional Fees 41,000 Healthcare Benefits - Retirees 0Maintenance Fees 4,600 Pension 63,714Other Contracted Fees 900Total Fringe Benefits 121,676TOTAL71,303CAPITAL OUTLAY 0TOTAL 3.14 259,129TOTAL0TOTAL APPROPRIATION 330,432332
CITY OF SAGINAWWATER OPERATIONS AND MAINTENANCE FUNDThomas DarnellDirector <strong>of</strong>Public ServicesEngineeringAdministrationMaintenance& ServicesWater Surplus &Bond ConstructionMeterMaintenance& ServicesCatchBasinNote:The Water Operation and Maintenance fund recognizes their ongoing large capital projects through the Water Surplus and Water BondContruction Divisions. The Debt Service Division is where all debt service is paid.
CITY OF SAGINAWWATER TREATMENT AND PROCESS CONTROL SYSTEMSKimberly MasonDirector <strong>of</strong>Water and WastewaterTreatmentProcessControlSystemsRawWaterDebtServiceTreatment& PumpingWater Surplus &Bond ConstructionNote:The Water Operation and Maintenance fund recognizes their ongoing large capital projects through the Water Surplus and Water BondContruction Divisions. The Debt Service Division is where all debt service is paid.
WATER OPERATIONS AND MAINTENANCE (591)RESOURCE ALLOCATION<strong>2010</strong>/<strong>2011</strong> APPROVED BUDGETRESOURCESAPPROPRIATIONSSERVICES - SALES 14,453,470 CROSS CONNECTIONS 124,610INTEREST AND RENTS 141,000 WATER AD<strong>MI</strong>NISTRATION 2,088,765OTHER REVENUES 14,031,947 ENGINEERING AD<strong>MI</strong>NISTRATION 300,198PROCESS CONTROL SYSTEMS 281,761METER MAINT. & SERVICE 514,431MAINTENANCE & SERVICE 2,405,277TREATMENT & PUMPING 4,928,367RAW WATER 1,126,289WATER SURPLUS 1,625,829WATER BOND CONSTRUCTION 12,715,771DEBT SERVICE 2,136,054CUSTOMER ACCOUNTING 340,942TRANSFERS OUT 38,123TOTAL RESOURCES 28,626,417 TOTAL APPROPRIATIONS 28,626,417Note:The <strong>2010</strong> <strong>Budget</strong> combined the Water Surplus Fund and the Water Bond Construction Fund into the Water Operations and MaintenanceFund.335
REVENUE ANALYSIS SUMMARY<strong>2010</strong>/<strong>2011</strong> APPROVED BUDGET<strong>2010</strong> <strong>2010</strong> <strong>2011</strong>2007 2008 2009 Approved Adjusted <strong>2010</strong> ApprovedActual Actual Actual <strong>Budget</strong> <strong>Budget</strong> Projected <strong>Budget</strong>Grants 554 126 14,487 0 0 0 0Service - Sales 12,395,529 12,170,108 12,097,581 14,554,470 14,554,470 13,190,719 14,453,470Interest and Rents 400,228 373,138 257,900 181,000 181,000 154,478 141,000Other Revenues 2,580,087 1,346,623 (106,642) 27,489,142 29,459,694 1,769,135 14,031,947Transfers from Other Funds 0 0 0 0 0 0 0TOTAL RESOURCES 15,376,398 13,889,995 12,263,326 42,224,612 44,195,164 15,114,333 28,626,417REVENUE ANALYSIS DETAILState Shared Revenues 554 126 0 0 0 0 0EPA Grant 0 0 14,487 0 0 0 0Total Grants 554 126 14,487 0 0 0 0Sale <strong>of</strong> Junk 4,786 380 980 0 0 11,392 4,000Turn on Charges 2,700 3,136 3,588 3,000 3,000 3,553 3,000Water 11,917,933 11,614,926 11,693,606 14,036,470 14,036,470 12,797,820 14,036,470Water Connections 25,502 8,149 9,553 15,000 15,000 4,812 10,000Materials and Services 444,608 543,517 389,854 500,000 500,000 373,142 400,000Total Service - Sales 12,395,529 12,170,108 12,097,581 14,554,470 14,554,470 13,190,719 14,453,470Interest on Investments 275,264 248,784 135,447 70,000 70,000 35,196 30,000Dividends 0 0 0 0 0 636 0Interest on Spec. Asmts 68 0 1,772 1,000 1,000 0 1,000Interest and Penalties 124,896 124,354 120,681 110,000 110,000 118,646 110,000Total Interest and Rents 400,228 373,138 257,900 181,000 181,000 154,478 141,000Special Assessments 9,516 (2,084) 4,297 5,000 5,000 (646) 0Surplus Receipts 444 470 127 0 0 210 0Cash Over and Short 0 98 0 0 0 0 0Insurance Proceeds 0 11,735 0 0 0 5,990 0Reimbursement 2,528,563 1,303,878 (111,066) 0 0 0 0Gain/Loss on Investments 14,038 5,000 0 0 0 (349) 0Gain on Bond Refunding 27,526 27,526 0 0 0 0 10,412,063Use <strong>of</strong> Fund Equity 0 0 0 8,174,142 10,144,694 0 3,619,884Bond Proceeds 0 0 0 19,310,000 19,310,000 1,763,930 0Total Other Revenues 2,580,087 1,346,623 (106,642) 27,489,142 29,459,694 1,769,135 14,031,947Sick and Vacation Fund 0 0 0 0 0 0 0Total Transfers 0 0 0 0 0 0 0TOTAL RESOURCES 15,376,398 13,889,995 12,263,326 42,224,612 44,195,164 15,114,333 28,626,417336
EXPENDITURE ANALYSIS SUMMARY<strong>2010</strong>/<strong>2011</strong> APPROVED BUDGET<strong>2010</strong> <strong>2010</strong> <strong>2011</strong>2007 2008 2009 Approved Adjusted <strong>2010</strong> ApprovedActual Actual Actual <strong>Budget</strong> <strong>Budget</strong> Projected <strong>Budget</strong>3867 CROSS CONNECTIONSPersonnel Services 107,451 70,664 104,555 169,287 169287 172,189 108,054Operating Expenses 8,969 8,149 5,581 12,262 12262 9,247 16,556Capital Outlay 0 0 0 0 0 0 0TOTALS 116,420 78,813 110,136 181,549 181,549 181,436 124,6104710 WATER AD<strong>MI</strong>NISTRATIONPersonnel Services 712,160 773,341 755,523 557,891 557,891 771,741 788,192Operating Expenses 1,874,109 2,346,629 2,569,661 1,325,010 1,323,810 1,362,251 1,300,073Capital Outlay 272 498 0 0 500 0 500Miscellaneous 8,917 0 0 0 0 0 0TOTALS 2,595,458 3,120,468 3,325,184 1,882,901 1,882,201 2,133,992 2,088,7654711 ENGINEERING AD<strong>MI</strong>NISTRTIONPersonnel Services 0 0 (19) 283,496 283,496 180,614 286,876Operating Expenses 0 0 0 1,500 1,500 0 13,322Capital Outlay 0 0 0 0 0 0 0TOTALS 0 0 (19) 284,996 284,996 180,614 300,1984715 PROCESS CONTROL SYSTEMSPersonnel Services 102,767 88,826 95,412 110,221 110,221 97,266 105,040Operating Expenses 31,746 12,553 27,530 151,090 171,740 30,200 157,721Capital Outlay 3,357 11,841 0 34,000 34,000 2,541 19,000TOTALS 137,870 113,220 122,942 295,311 315,961 130,006 281,7614720 METER MAINTENANCE ANDSERVICEPersonnel Services 264,917 182,226 323,010 365,734 365,734 356,501 442,372Operating Expenses 41,623 38,641 28,976 74,850 74,850 38,497 72,059Capital Outlay 309 0 0 0 0 0 0TOTALS 306,849 220,867 351,986 440,584 440,584 394,998 514,4314721 MAINTENANCE AND SERVICEPersonnel Services 1,004,450 897,998 969,473 1,391,520 1,391,520 1,180,054 1,251,770Operating Expenses 599,271 774,163 746,523 1,176,650 1,174,150 821,197 1,119,107Capital Outlay 13,717 9,977 1,893 7,000 9,600 8,611 34,400TOTALS 1,617,438 1,682,138 1,717,889 2,575,170 2,575,270 2,009,862 2,405,277337
EXPENDITURE ANALYSIS SUMMARY<strong>2010</strong>/<strong>2011</strong> APPROVED BUDGET<strong>2010</strong> <strong>2010</strong> <strong>2011</strong>2007 2008 2009 Approved Adjusted <strong>2010</strong> ApprovedActual Actual Actual <strong>Budget</strong> <strong>Budget</strong> Projected <strong>Budget</strong>4730 TREATMENT ANDPUMPINGPersonnel Services 2,551,753 2,573,399 2,561,266 2,848,990 2,848,990 2,544,489 2,775,723Operating Expenses 1,425,849 1,394,386 1,508,357 2,060,943 2,060,943 1,313,844 2,018,444Capital Outlay 46,027 46,797 75,411 64,000 64,000 56,079 134,200TOTALS 4,023,629 4,014,582 4,145,034 4,973,933 4,973,933 3,914,412 4,928,3674735 RAW WATERPersonnel Services 0 0 0 0 0 0 0Operating Expenses 1,121,620 1,080,486 1,081,289 1,126,289 1,126,289 1,138,243 1,126,289Capital Outlay 0 0 0 0 0 0 0TOTALS 1,121,620 1,080,486 1,081,289 1,126,289 1,126,289 1,138,243 1,126,2894740 WATER SURPLUSPersonnel Services 8,720 7,115 8,821 0 0 20,254 0Operating Expenses 2,820 8,341 53,039 928,000 (1,157,167) 117,223 1,205,329Capital Outlay 8,442 170,329 263,000 2,955,000 3,409,116 397,868 420,500TOTALS 19,982 185,785 324,860 3,883,000 2,251,949 535,345 1,625,8294741 WATER BOND CONSTRUCTIONPersonnel Services 0 0 0 0 0 0 0Operating Expenses 0 0 1 24,010,000 27,591,553 1,967,994 12,140,771Capital Outlay 0 0 0 0 0 0 575,000Miscellaneous 0 0 0 0 0 0 0TOTALS 0 0 1 24,010,000 27,591,553 1,967,994 12,715,7714745 DEBT SERVICEPersonnel Services 0 0 0 0 0 0 0Operating Expenses 0 0 0 0 0 0 0Capital Outlay 0 0 0 0 0 0 0Miscellaneous 1,311,848 1,021,197 1,587,293 2,187,738 2,187,738 2,099,339 2,136,054TOTALS 1,311,848 1,021,197 1,587,293 2,187,738 2,187,738 2,099,339 2,136,0545310 CUSTOMER ACCOUNTINGPersonnel Services 200,666 222,513 225,057 260,835 260,835 243,111 257,259Operating Expenses 209,747 195,753 142,962 84,673 84,673 147,348 83,683Capital Outlay 337 90 215 0 0 0 0TOTALS 410,750 418,356 368,234 345,508 345,508 390,459 340,942338
EXPENDITURE ANALYSIS SUMMARY<strong>2010</strong>/<strong>2011</strong> APPROVED BUDGET<strong>2010</strong> <strong>2010</strong> <strong>2011</strong>2007 2008 2009 Approved Adjusted <strong>2010</strong> ApprovedActual Actual Actual <strong>Budget</strong> <strong>Budget</strong> Projected <strong>Budget</strong>9660 TRANSFERS TO OTHER FUNDSPersonnel Services 0 0 0 0 0 0 0Operating Expenses 0 0 0 0 0 0 0Capital Outlay 0 0 0 0 0 0 0Miscellaneous 32,029 32,029 37,633 37,633 37,633 37,633 38,123TOTALS 32,029 32,029 37,633 37,633 37,633 37,633 38,123TOTAL WATER OPERATIONS AND MAINTENANCEPersonnel Services 4,952,884 4,816,082 5,043,098 5,987,974 5,987,974 5,566,218 6,015,286Operating Expenses 5,315,754 5,859,101 6,163,919 30,951,267 32,464,603 6,946,044 19,253,354Capital Outlay 72,461 239,532 340,519 3,060,000 3,517,216 465,099 1,183,600Miscellaneous 1,352,794 1,053,226 1,624,926 2,225,371 2,225,371 2,136,972 2,174,177TOTAL EXPENDITURES 11,693,893 11,967,941 13,172,462 42,224,612 44,195,164 15,114,333 28,626,417339
POSITION ANALYSIS<strong>2010</strong>/<strong>2011</strong> APPROVED BUDGET<strong>2010</strong> <strong>2010</strong> <strong>2011</strong>2007 2008 2009 Approved Adjusted <strong>2010</strong> ApprovedActual Actual Actual <strong>Budget</strong> <strong>Budget</strong> Projected <strong>Budget</strong>ENTERPRISE FUND - WATER OPERATIONS AND MAINTENANCE FUNDCross Connection 1.00 1.00 2.00 2.00 2.00 2.00 1.00Water Administration 15.30 15.90 1.47 1.47 1.47 1.47 1.47Engineering Administration 0.00 0.00 2.99 2.99 2.99 2.99 2.49Process Control Systems 1.00 1.00 2.00 2.00 2.00 2.00 1.00Meter Maintenance and Service 5.00 5.00 6.50 6.50 6.50 6.50 4.25Maintenance and Service 11.00 11.00 17.38 17.38 17.38 17.38 16.75Treatment and Pumping 32.00 32.00 36.00 36.00 36.00 36.00 34.00TOTAL POSITIONS 65.30 65.90 68.34 68.34 68.34 68.34 60.96The Approved <strong>2010</strong>/<strong>2011</strong> Water Fund's <strong>Budget</strong> reflects a total decrease <strong>of</strong> 7.38 positions. In the Cross Connection Division, the CodeEnforcement Officers will be redistributed to the Inspection Division <strong>of</strong> the General Fund. In the Water Administration Division, theDeputy Director <strong>of</strong> Public Services will be elevated to a department head level as the Director <strong>of</strong> Water and Wastewater Treatment. Thisindividual will be responsible for the Water and Wastewater Treatment Plants as well as the Process Control Systems Divisions <strong>of</strong> Waterand Sewer. This change is in alignment with the Staffing and Efficiency Study that was completed during <strong>2010</strong>. Likewise, in theEngineering Administration Division, the <strong>City</strong> Engineer will be responsible for the Right-<strong>of</strong>-Way Divisions (ROW), citywide. With thisadded resposibilities, city administation will hire an Assistant <strong>City</strong> Engineer to the personnel complement. Approximately, .25 <strong>of</strong> thisposition will be allocated to the Water Fund. Another change within this division is the elimination <strong>of</strong> the Traffic Electrician I positionfrom the personnel complement, within the Water Fund this represents .50 <strong>of</strong> the position.In <strong>2011</strong>, the Process Control Systems Division will report directly to the Director <strong>of</strong> Water and Wastewater Treatment. In addition, atthe department's request, the Intern position will be eliminated. Likewise, city administration re-titled the Instrument and ControlManager to Instrument and Control Administrator. In the Meter Maintenance and the Maintenance Divisions, .25 <strong>of</strong> an AdministrativePr<strong>of</strong>essional will be eliminated. Also two part time Laborers will be redistributed to the Maintenance and Service Division. Likewise,approximately 1.8 <strong>of</strong> Crossover Operator positions will be redistributed to other funds. The following positions will be re-titled in thisdivision - Assistant Superintendent <strong>of</strong> Right <strong>of</strong> Way (ROW), Chief Foreman and Utilities Foreman to ROW Administrator, Chief ROWUtilities Foreman, and ROW Utilities Foreman, respectively. The ROW Administrator will report directly to the <strong>City</strong> Engineer in <strong>2011</strong>.In the Treatment and Pumping Division, two Filtration Plant Maintenance I positions will be eliminated in accordance with the <strong>City</strong>'sStaffing and Efficiency Study.Note:Customer Accounting Division is represented in the Department <strong>of</strong> Fiscal Services.340
FUND: 591 – Water Operations and Maintenance FundDEPARTMENT: Public ServicesACTIVITY: 3867 – Cross ConnectionsSTRATEGIC NARRATIVEThe function <strong>of</strong> the Cross Connections division is to protect the public water supply from contaminantsthat are introduced by a direct connection to a non-potable water source. The <strong>City</strong> is mandated throughP.A. 399, at the federal level by the Safe Drinking Water Act, and at the local level by the adoption <strong>of</strong>local ordinance and rules to cause inspections to be made on customers whose use <strong>of</strong> the public watersupply requires mechanical devices to protect the potable water supply. Through the Cross Connectionsdivision, the <strong>City</strong> is required to inspect at all levels <strong>of</strong> use Industrial, Commercial, and Residentialproperties. Employees from the Maintenance and Service Division are responsible to enforce the rulesand cause inspections, re-inspections, and testing <strong>of</strong> devices to be completed as outlined in the localrules.FY <strong>2010</strong>/<strong>2011</strong> GOALS AND OBJECTIVESTo begin the inspection, re-inspection and compliance checks <strong>of</strong> devices currently in use to ensurethat device that are required are installed and that the required annual testing and inspections occurs.1. To continue inspection <strong>of</strong> residential properties as required by law to ensure the safety, healthand welfare <strong>of</strong> residents.2. To complete the annual report to the MDEQ with the results <strong>of</strong> our activities from the previousyear.341
EXPENDITURE ANALYSIS DETAIL<strong>2010</strong>/<strong>2011</strong> APPROVED BUDGET591-3867 Cross ConnectionAllocation PlanPosition Control<strong>2010</strong>/JOB <strong>2011</strong>PERSONNEL SERVICES CLASSIFICATION BUDGET ALLOCATIONSalaries 43,714 Utilities Person III 1.00 43,714Overtime 2,000.00Fringe Benefits 62,340 Total Personnel 1.00 43,714TOTAL108,054Overtime 2,000OPERATING EXPENSESFICA 3,497Supplies 700 Healthcare Benefits - Active 21,310Internal Services 12,556 Healthcare Benefits - Retirees 0Other Services Pension 37,533Pr<strong>of</strong>essional Fees 0Maintenance Fees 1,800 Total Fringe Benefits 62,340Other Contracted Fees 1,500TOTAL16,556 TOTAL 1.00 108,054CAPITAL OUTLAY 0TOTAL0TOTAL APPROPRIATION 124,610342
FUND: 591 – Water Operations and Maintenance FundDEPARTMENT: Public ServicesACTIVITY: 4710 - AdministrationSTRATEGIC NARRATIVEThe Administration division <strong>of</strong> the Water Operations and Maintenance Fund provides the necessaryplanning, general supervision and coordination <strong>of</strong> the <strong>City</strong>'s water operation so that local, state, andfederal standards are met in a cost-effective manner. Water operations involve service to a 20-community area under varying service commitments. Services are a basic requirement to the public'shealth and economic well-being. This division also works with the <strong>Saginaw</strong>-Midland Municipal WaterSupply Corporation to provide the quality and quantity <strong>of</strong> water to which this area has grownaccustomed. It is essential that an operation <strong>of</strong> this size and complexity have adequate administrativeand technical support and this division addresses that need.FY <strong>2010</strong>/<strong>2011</strong> GOALS AND OBJECTIVES1. To administer the water system operation in an efficient and economical manner.2. To negotiate and renew wholesale water customer contracts to assure long-term relationships andenhance regional economic growth.3. To establish rates to ensure that operations, debt service, and capital expenditure needs are met.343
EXPENDITURE ANALYSIS DETAIL<strong>2010</strong>/<strong>2011</strong> APPROVED BUDGET591-4710 Water AdministrationAllocation PlanPosition Control<strong>2010</strong>/JOB <strong>2011</strong>PERSONNEL SERVICES CLASSIFICATION BUDGET ALLOCATIONSalaries 131,221 Director <strong>of</strong> Public Services 0.40 40,557Overtime 0 Director <strong>of</strong> Water & WastewaterFringe Benefits 656,971 Treatment 0.50 44,438Staff Pr<strong>of</strong>essionals 0.97 46,226TOTAL788,192Total Personnel 1.47 131,221OPERATING EXPENSESOvertime 0Supplies 2,000Internal Services 1,044,163Other Services FICA 10,230Pr<strong>of</strong>essional Fees 243,240 Healthcare Benefits - Active 27,881Maintenance Fees 1,470 Healthcare Benefits - Retirees 559,329Other Contracted Fees 9,200 Pension 59,531TOTAL1,300,073 Total Fringe Benefits 656,971CAPITAL OUTLAY 500 TOTAL 1.47 788,192TOTAL500TOTAL APPROPRIATION 2,088,765344
EXPENDITURE ANALYSIS DETAIL<strong>2010</strong>/<strong>2011</strong> APPROVED BUDGET591-4711 Engineering AdministrationAllocation PlanPosition Control<strong>2010</strong>/JOB <strong>2011</strong>PERSONNEL SERVICES CLASSIFICATION BUDGET ALLOCATIONSalaries 155,563 <strong>City</strong> Engineer 0.25 22,668Overtime 10,000 Assistant <strong>City</strong> Engineer 0.25 16,345Fringe Benefits 121,313 Engineering Office Super 0.25 15,166Engineering Technician I 0.12 5,596TOTAL286,876 Engineering Assistant 1.50 69,127Surveying Technican I 0.12 5,690Survey Assistant III 0.25 10,338OPERATING EXPENSES Administrative Pr<strong>of</strong>essional 0.25 10,633Supplies 500 Total Personnel 2.49 155,563Internal Services 11,822Other ServicesPr<strong>of</strong>essional Fees 0 Overtime 10,000Maintenance Fees 0Other Contracted Fees 1,000FICA 12,666TOTAL13,322 Healthcare Benefits - Active 44,725Healthcare Benefits - Retirees 0Pension 63,922CAPITAL OUTLAY 0Total Fringe Benefits 121,313TOTAL0TOTAL APPROPRIATION 300,198TOTAL 2.49 286,876345
FUND: 591-Water Operations and Maintenance FundDEPARTMENT: Public ServicesACTIVITY: 4715 Process Control SystemSTRATEGIC NARRATIVEThe Process Controls Division provides the necessary planning, coordination, implementation andsupport <strong>of</strong> the water system’s automation projects. The division provides design, programming, training,maintenance and technical support to ensure the continuous operation <strong>of</strong> the Water Plant’s controlsystems. This division also maintains the plants maintenance data system, the <strong>City</strong>’s security system andthe Automatic Meter Reading (AMR) system for the Maintenance and Services Division.FY <strong>2010</strong>/<strong>2011</strong> GOALS AND OBJECTIVESThe primary goal <strong>of</strong> the Process Controls Division is to maintain timely and accurate operationalinformation and Plant control to the Water Treatment Plant thru the Supervisory Control and DataAcquisition (SCADA) System.1. Monitor SCADA computer operation to keep them up-to-date on service packs and securityupdates.a. Evaluate system against Micros<strong>of</strong>t Tech Net and Defender Updates Lists.b. Evaluate system against American Water Works Association (AWWA) Securityinformation list.c. Evaluate systems internal performance through utilities s<strong>of</strong>tware.2. Maintain network communication for optimal data transfer speed and a high degree <strong>of</strong> security.a. Monitor Received Signal Strength Indication (RSSI) and signal strength values.b. Evaluate system against AWWA security information3. Recognize changes in the water system and evaluate new technology to help the SCADA systemevolve to better serve the Water Plant staff.a. Meet with staff to determine plant needs and desired changesb. Evaluate new products through vender meetings, technical data periodicals, anddiscussion with other water systems staff.346
EXPENDITURE ANALYSIS DETAIL<strong>2010</strong>/<strong>2011</strong> APPROVED BUDGET591-4715 Process Control SystemsAllocation PlanPosition Control<strong>2010</strong>/JOB <strong>2011</strong>PERSONNEL SERVICES CLASSIFICATION BUDGET ALLOCATIONSalaries 56,728 Instrument & Control Admin. 0.50 34,952Overtime 500 Instrument & Control Tech 0.50 21,776Fringe Benefits 47,812Total Personnel 1.00 56,728TOTAL105,040OPERATING EXPENSESOvertime 500Supplies 76,000 FICA 4,378Internal Services 2,671 Healthcare Benefits - Active 15,788Other Services Healthcare Benefits - Retirees 0Pr<strong>of</strong>essional Fees 68,900 Pension 27,646Maintenance Fees 2,800Other Contracted Fees 7,350 Total Fringe Benefits 47,812TOTAL157,721TOTAL 1.00 105,040CAPITAL OUTLAY 19,000TOTAL19,000TOTAL APPROPRIATION 281,761347
FUND: 591 – Water Operations and Maintenance FundDEPARTMENT: Public ServicesACTIVITY: 4720 – Meter Maintenance and ServiceSTRATEGIC NARRATIVEThe Meter Maintenance and Service division’s responsibilities consist <strong>of</strong> installation, repair and testing<strong>of</strong> the <strong>City</strong>’s 21,690 metered water connections; providing service for water turn-ons and turn-<strong>of</strong>fs dueto non-payment, broken or leaking lines on private property; investigation <strong>of</strong> water leaks andcomplaints, read water meters monthly, and installation <strong>of</strong> new meters. The cost <strong>of</strong> this service is splitbetween the Water and Sewer Operations and Maintenance Funds.1. To inspect 200 service lines.FY <strong>2010</strong>/<strong>2011</strong> GOALS AND OBJECTIVESa. To provide funds for the Treatment Plants and Water Billing2009Actual<strong>2010</strong>Projected<strong>2011</strong>TargetNumber <strong>of</strong>Service Calls 23,317 24,000 24,0002. To repair and test large water meters servicing commercial, industrial, and wholesale customers.a. To install a fixed base network to read wholesale and residential customers2009Actual<strong>2010</strong>Projected<strong>2011</strong>TargetReduce the % <strong>of</strong>unaccounted for water 15.4% 12% 10%3. To provide daily service calls citywide.4. To provide emergency water service on a 24-hour basis.5. To read water meters on a monthly basis.348
EXPENDITURE ANALYSIS DETAIL<strong>2010</strong>/<strong>2011</strong> APPROVED BUDGET591-4720 Water Metering Maintenance & ServiceAllocation PlanPosition Control<strong>2010</strong>/JOB <strong>2011</strong>PERSONNEL SERVICES CLASSIFICATION BUDGET ALLOCATIONROW Administrator 0.25 18,560Salaries 214,758 Chief ROW Utilities Foreman 0.25 16,263Overtime 6,000 Mech Equip Repairperson II 0.25 11,112Fringe Benefits 221,614 Utilities Person II 3.00 127,156Crossover Operators 1.00 41,667TOTAL442,372Total Personnel 4.25 214,758OPERATING EXPENSESOvertime 6,000Supplies 10,500Internal Services 11,809Other Services FICA 17,204Pr<strong>of</strong>essional Fees 25,000 Healthcare Benefits - Active 97,026Maintenance Fees 24,750 Healthcare Benefits - Retirees 0Other Contracted Fees 0 Pension 107,384TOTAL72,059 Total Fringe Benefits 221,614CAPITAL OUTLAY 0 TOTAL 4.25 442,372TOTAL0TOTAL APPROPRIATION 514,431349
FUND: 591 – Water Operations and Maintenance FundDEPARTMENT: Public ServicesACTIVITY: 4721 – Maintenance and ServiceSTRATEGIC NARRATIVEThe Maintenance and Service division provides continuous maintenance and service on the <strong>City</strong>’s waterdistribution system. The primary responsibility <strong>of</strong> this section involves all types <strong>of</strong> maintenanceprograms and the <strong>City</strong>’s 475 miles <strong>of</strong> water distribution mains. It involves repair <strong>of</strong> all water mainbreaks and leaks; installation and repair <strong>of</strong> new fire hydrants and valves; and locating and staking <strong>of</strong><strong>City</strong> water utilities prior to excavation by others.FY <strong>2010</strong>/<strong>2011</strong> GOALS AND OBJECTIVES1. To maintain 375 miles <strong>of</strong> <strong>City</strong> water distribution mains and 100 miles <strong>of</strong> transmission maina. Replace one mile <strong>of</strong> water main annuallyPerform leak detectionon <strong>City</strong> mains to reducethe unaccountedfor water (in feet)2009Actual<strong>2010</strong>Projected<strong>2011</strong>Target6,000 10,000 5,000b. Valve Check Program350
EXPENDITURE ANALYSIS DETAIL<strong>2010</strong>/<strong>2011</strong> APPROVED BUDGET591-4721 Maintenance & ServiceAllocation PlanPosition Control<strong>2010</strong>/JOB <strong>2011</strong>PERSONNEL SERVICES CLASSIFICATION BUDGET ALLOCATIONSalaries 647,869 ROW Administrator 0.25 18,560Overtime 46,000 Chief ROW Utilities Foreman 0.25 16,263Fringe Benefits 557,901 ROW Utilities Foreman 1.00 50,793TOTALMech Equip Repairperson II 0.25 11,1121,251,770 Office Assistant III 0.50 18,437Utilities Person III 1.50 65,710Utilities Person II 3.50 149,002OPERATING EXPENSES Crossover Operator 7.00 291,576Custodial Worker (PT) 1.00 18,720Supplies 764,600 Laborer (Temp) 2.00 7,696Internal Services 22,128Other Services Total Personnel 16.75 647,869Pr<strong>of</strong>essional Fees 119,704Maintenance Fees 190,095Other Contracted Fees 22,580 Overtime 46,000TOTAL1,119,107FICA 53,887Healthcare Benefits - Active 306,780CAPITAL OUTLAY 34,400 Healthcare Benefits - Retirees 0Pension 197,234TOTAL34,400Total Fringe Benefits 557,901TOTAL APPROPRIATION 2,405,277TOTAL 16.75 1,251,770351
FUND: 591 – Water Operations and Maintenance FundDEPARTMENT: Public ServicesACTIVITY: 4730 – Treatment and PumpingSTRATEGIC NARRATIVEThe Water Treatment and Pumping Division is responsible for providing high quality drinking water tothe residents <strong>of</strong> 22 water systems in a three county service area. Water is vital to both human health andeconomic growth. The <strong>City</strong> <strong>of</strong> <strong>Saginaw</strong> has owned, operated, and managed these facilities for more than75 years. In calendar year 2009, an annual average <strong>of</strong> 20.1 million gallons <strong>of</strong> water, per day, weredelivered to our customers.FY <strong>2010</strong>/<strong>2011</strong> GOALS AND OBJECTIVES1. The primary goal <strong>of</strong> the Water Treatment and Pumping Division is to maintain high standards <strong>of</strong>quality and efficiency that provide safe, reliable, and affordable drinking water to the customers<strong>of</strong> the <strong>Saginaw</strong> water system and to meet or exceed all Federal and State regulatoryrequirements.a. Number <strong>of</strong> violations for failure to meet federal and state drinking water standards andrequirements.2009<strong>2010</strong><strong>2011</strong>Actual Projected TargetViolations 0 0 0b. Percent <strong>of</strong> Partnership for Safe Water goals met for measured water turbidity (100%
3. To evaluate efficiency measurements to maximize affordability for customers.a. Electrical tracking spreadsheet.Product/ElectricalGals/KWH2009Actual<strong>2010</strong>Projected<strong>2011</strong>Target997.07 990.00 990.002009Actual<strong>2010</strong>Projected<strong>2011</strong>TargetElectrical Cost$/KWH $.0710 $.0753 $.0798Note: It is important to note that it is difficult to effectively track and improve electrical power useefficiencies when our water demands are decreasing and electrical costs increasing.b. Chemical cost tracking spreadsheet.Chemical CostsAvg.$/MGTreated2009Actual<strong>2010</strong>Projected<strong>2011</strong>Target$33.97 $38.00 $41.80c. Chemical use tracking spreadsheet.2009Actual<strong>2010</strong>Projected<strong>2011</strong>TargetChemical UsedLbs./MG 155.85 160.00 *158.00Note: The Treatment Plant is trying to reduce overall chemical costs/use through processoptimization. Staff has been successful to date in reducing pounds chemical used throughoptimization measures. Examples <strong>of</strong> these measures are SolarBee installation;flocculation/coagulation chemical dosing s<strong>of</strong>tware and dynamic rapid mix installation.*This division is realizing an increased cost in pounds per million gallons when the newdisinfection system is installed due to the water content <strong>of</strong> this chemical. The cost <strong>of</strong> bleachversus gaseous chlorine is ~ 4 times greater. Other chemical costs also continue to rise, fluoridecost doubled for fiscal year <strong>2010</strong> and we are expecting another increase <strong>of</strong> ~ 10% in <strong>2011</strong> formost <strong>of</strong> the chemicals used in treatment. The on-going goal is to improve overall efficiency <strong>of</strong> thechemicals used no matter the cost <strong>of</strong> the commodity.The reason the more expensive disinfection chemical is being used is due to safety and securityconcerns as well as an anticipated regulatory push away from gaseous chlorine. This push isalso due to national safety and security concerns on the part <strong>of</strong> the federal and stategovernments.353
d. Diesel tracking spreadsheet.GeneratedKWH/GalDiesel2009Actual<strong>2010</strong>Projected<strong>2011</strong>Target11.00 12.44 12.502009Actual<strong>2010</strong>Projected<strong>2011</strong>TargetDiesel CostAvg.$/Gal $1.57 $4.00 $4.50Note: Diesel fuel costs have been depressed due to economic conditions. This division expects a return tohigher prices once the world economy stabilizes.e. Natural gas tracking spreadsheet.2009Actual<strong>2010</strong>Projected<strong>2011</strong>TargetGas UseCCF/Yr. 120.026 135,000 130,0002009Actual<strong>2010</strong>Projected<strong>2011</strong>TargetGas CostsAvg. $/CCF 0.9631 0.9944 1.0342Note: Chemical and energy costs are rising and water demands are declining as industry and population islost. This factor is out <strong>of</strong> the <strong>City</strong>’s control and greatly affects the results <strong>of</strong> efficiency measures. Staff willcontinue to look for ways to operate efficiently and produce the best product possible at a reasonable cost.354
EXPENDITURE ANALYSIS DETAIL<strong>2010</strong>/<strong>2011</strong> APPROVED BUDGET591-4730 Treatment & PumpingAllocation PlanPosition Control<strong>2010</strong>/JOB <strong>2011</strong>PERSONNEL SERVICES CLASSIFICATION BUDGET ALLOCATIONSalaries 1,411,189 Superintendent <strong>of</strong> Water Tmt 1.00 75,950Overtime 75,000 Asst Super <strong>of</strong> Water Tmt 1.00 70,404Fringe Benefits 1,289,534 Chief Chemist 1.00 58,337TOTALOperating Foreman 5.00 253,5752,775,723 Plant Mtce Foreman 1.00 56,498Biologist 1.00 49,753Plant Mtce Electrician II 1.00 46,108OPERATING EXPENSES Plant Mtce Electrician I 2.00 86,795Filtration Plant Mtce III 3.00 127,465Supplies 634,400 Filtration Plant Mtce II 3.00 115,487Internal Services 63,885 Plant Mtce Mechanic A 1.00 49,453Other Services Plant Operator A 5.00 210,028Pr<strong>of</strong>essional Fees 268,585 Equipment & Safety Specialist 1.00 42,434Maintenance Fees 972,481 Administrative Pr<strong>of</strong>essional 1.00 31,291Other Contracted Fees 79,093 Laboratory Technician 1.00 42,905TOTALStock Clerk WT 1.00 34,9222,018,444 Custodial Worker A 1.00 34,624Laborer (Temp) 5.00 25,160CAPITAL OUTLAY 134,200 Total Personnel 34.00 1,411,189TOTAL134,200Overtime 75,000TOTAL APPROPRIATION 4,928,367FICA 117,407Healthcare Benefits - Active 500,661Healthcare Benefits - Retirees 0Pension 671,466Total Fringe Benefits 1,289,534TOTAL 34.00 2,775,723355
FUND: 591 – Water Operations and Maintenance FundDEPARTMENT: Public ServicesACTIVITY: 4735 – Raw WaterSTRATEGIC NARRATIVEThis division provides for the purchase <strong>of</strong> raw water from the <strong>Saginaw</strong>-Midland Municipal WaterSupply Corporation (SMMWSC). The system brings water from Lake Huron, beginning at WhitestonePoint, through a joint supply line, to Junction Station, at which point it is pumped through separatebranch lines to the cities <strong>of</strong> Midland and <strong>Saginaw</strong>. The joint line is operated and maintained by a Board<strong>of</strong> Trustees, which is an intergovernmental body composed <strong>of</strong> six members: three appointed by each <strong>of</strong>the <strong>Saginaw</strong> and Midland <strong>City</strong> Councils. The <strong>City</strong> <strong>of</strong> <strong>Saginaw</strong> owns 23/43rds <strong>of</strong> the Water SupplySystem (53.49%) and currently receives approximately 50.27% percent <strong>of</strong> the average daily supply.These numbers correspond to <strong>Saginaw</strong>’s contributions as its share <strong>of</strong> expenses is based on use, while itsshare <strong>of</strong> debt service is based on ownership.FY <strong>2010</strong>/<strong>2011</strong> GOALS AND OBJECTIVES1. To efficiently provide delivery <strong>of</strong> adequate quantities <strong>of</strong> raw water to supply the <strong>City</strong>’s WaterTreatment System.2. To work with the <strong>City</strong> <strong>of</strong> Midland on Best Management Practices <strong>of</strong> the SMMWSC.a. Participation on the Water Advisory Committeeb. Utilization <strong>of</strong> the Kochville Pumping Station during peak demands to keep SMMWSCraw water pumping costs down.356
FUND: 591- Water Operations and Maintenance FundDEPARTMENT: Fiscal ServicesACTIVITY: 5310- Customer AccountingSTRATEGIC NARRATIVEThe Water Customer Accounting division is responsible for the billing and collections <strong>of</strong> all water accountsfrom users <strong>of</strong> the system. This involves initiating new accounts, insuring that metered accounts are read,edited, and billed in a timely manner, as well as closing accounts when requested or delinquent. Staffmembers handle all bill payment arrangements, collection <strong>of</strong> returned checks, and initiation <strong>of</strong> meter checks,and discontinuance <strong>of</strong> service for collection.FY <strong>2010</strong>/<strong>2011</strong> GOALS AND OBJECTIVES1. To provide quality customer service to all water and sewer customers.a. Improve the time between when the meters are read and when the bills are ready to print.Efficient trainingin s<strong>of</strong>tware and jobduties for allemployeesLower the number<strong>of</strong> days betweenmeter reads andbilling2009Actual<strong>2010</strong>Projected<strong>2011</strong>Target95% 100% 100%2009Actual<strong>2010</strong>Projected<strong>2011</strong>Target12 10 7b. To decrease the customer wait time at the counter and on the phones.i. Monitor the number <strong>of</strong> complaints per calls taken each month.ii. If more than one customer is in line waiting, there will be a back up employee to waiton them.2. To have accurate billing and a greater rate <strong>of</strong> collection.a. To reduce delinquent accounts by fifteen percent (15%).i. This will be accomplished by discontinuing active accounts with unpaid arrears five(5) days after the accounts are cycle billed. This will allow for enhanced cash flowsand reduction <strong>of</strong> water/sewer liens on property taxes.b. To aggressively continue the collection process for those customers that are three (3) monthsdelinquent with a balance <strong>of</strong> $100 dollars or more.i. This will be done by turning <strong>of</strong>f accounts for non-payment and by making paymentarrangements with customers.357
EXPENDITURE ANALYSIS DETAIL<strong>2010</strong>/<strong>2011</strong> APPROVED BUDGET591-5310 Customer AccountingAllocation PlanPosition Control<strong>2010</strong>/JOB <strong>2011</strong>PERSONNEL SERVICES CLASSIFICATION BUDGET ALLOCATIONSalaries 136,526 Admin <strong>of</strong> Utilities Account 0.50 28,099Overtime 0 Collection Correspondent 0.50 19,405Fringe Benefits 120,734 Office Assistant III 1.50 54,704Customer Service Coordinator 0.37 11,367TOTAL257,260 Customer Service Rep 0.74 22,951Total Personnel 3.11 136,526OPERATING EXPENSESOvertime 0Supplies 1,500Provision for Losses 0Internal Services 23,133 FICA 10,540Other Services Healthcare Benefits - Active 46,931Pr<strong>of</strong>essional Fees 41,000 Healthcare Benefits - Retirees 0Maintenance Fees 4,600 Pension 63,263Other Contracted Fees 13,450Total Fringe Benefits 120,734TOTAL83,683CAPITAL OUTLAY 0TOTAL 3.11 257,260TOTAL0TOTAL APPROPRIATION 340,943358
INTERNAL SERVICE FUNDS
CITY OF SAGINAWDEPARTMENT OF PUBLIC SERVICES - INTERNAL SERVICE FUNDSThomas DarnellDirector <strong>of</strong>Public ServicesPublic WorksBuildingRadioOperationsMotor PoolOperations
PUBLIC WORKS BUILDING (641)RESOURCE ALLOCATION<strong>2010</strong>/<strong>2011</strong> APPROVED BUDGETRESOURCESAPPROPRIATIONSSERVICES - SALES 463,278 PUBLIC WORKS BUILDING 462,226TRANSFERS OUT 1,052TOTAL RESOURCES 463,278 TOTAL APPROPRIATIONS 463,278360
PUBLIC WORKS BUILDING (641)<strong>2010</strong>/<strong>2011</strong> APPROVED BUDGET<strong>2010</strong> <strong>2010</strong> <strong>2011</strong>2007 2008 2009 Approved Adjusted <strong>2010</strong> ApprovedActual Actual Actual <strong>Budget</strong> <strong>Budget</strong> Projected <strong>Budget</strong>REVENUE ANALYSIS SUMMARYServices - Sales 378,204 279,726 312,988 465,508 423,729 337,320 463,278Interest and Rents 0 45 0 0 0 0 0Other Revenues 538 0 0 0 0 23 0Transfers from Other Funds 0 0 0 0 0 0 0TOTAL RESOURCES 378,742 279,771 312,988 465,508 423,729 337,343 463,2784439 PUBLIC WORKS BUILDINGEXPENDITURE ANALYSIS SUMMARYPersonnel Services 118,020 133,441 124,310 162,116 162,116 123,906 216,144Operating Expenses 196,825 177,107 174,319 260,575 260,575 182,560 246,082Capital Outlay 28,789 517 15,829 0 0 0 0TOTALS 343,634 311,065 314,458 422,691 422,691 306,466 462,2268559 INCREASE IN FUND EQUITYPersonnel Services 0 0 0 0 0 0 0Operating Expenses 0 0 0 0 0 0 0Capital Outlay 0 0 0 0 0 0 0Miscellaneous 0 0 0 41,779 0 0 0TOTALS 0 0 0 41,779 0 0 09660 TRANSFERS TO OTHER FUNDSPersonnel Services 0 0 0 0 0 0 0Operating Expenses 0 0 0 0 0 0 0Capital Outlay 0 0 0 0 0 0 0Miscellaneous 883 883 1,038 1,038 1,038 1,038 1,052TOTALS 883 883 1,038 1,038 1,038 1,038 1,052TOTAL PUBLIC WORKS BUILDINGPersonnel Services 118,020 133,441 124,310 162,116 162,116 123,906 216,144Operating Expenses 196,825 177,107 174,319 260,575 260,575 182,560 246,082Capital Outlay 28,789 517 15,829 0 0 0 0Miscellaneous 883 883 1,038 1,038 1,038 1,038 1,052TOTAL EXPENDITURES 344,517 311,948 315,496 423,729 423,729 307,504 463,278361
FUND: 641 – General FundDEPARTMENT: Public ServicesACTIVITY: 4439 – Public Service BuildingSTRATEGIC NARRATIVEThe Public Services Center was built to consolidate the <strong>City</strong>’s public services into a single facility.Construction <strong>of</strong> the center, which began in December 1977, was financed primarily by a $2.95 millionlocal Public Works grant from the Economic Development Administration. The <strong>City</strong> Councilsupplemented this grant with Public Improvement Fund allocations in the amount <strong>of</strong> $244,530. The<strong>City</strong>’s Public Services Department includes several divisions, but only the Motor Pool, Parks GroundsMaintenance, Streets & Bridges, Engineering, GIS and Facilities Maintenance Operations are housedwithin the Public Service Center.FY <strong>2010</strong>/<strong>2011</strong> GOALS AND OBJECTIVES1. Plan for and administer capital improvements to maximize the use <strong>of</strong> the Public Service Center.2. Implement utility and energy saving programs to <strong>of</strong>fset increasing cost <strong>of</strong> utilities.3. Continue implementing preventive maintenance programs for heating, mechanical and plumbingsystems to extend their operating life.4. Continue upgrades on building security as mandated by the Home Land Security Directives forall city and government facilities.362
EXPENDITURE ANALYSIS DETAIL<strong>2010</strong>/<strong>2011</strong> APPROVED BUDGET641-4439 Public Works BuildingAllocation PlanPosition Control<strong>2010</strong>/JOB <strong>2011</strong>PERSONNEL SERVICES CLASSIFICATION BUDGET ALLOCATIONSalaries 119,422 Bldg Operations Supervisor 0.50 34,866Overtime 3,000 Labor Foreman Street/Fringe Benefits 93,722 Building Operations 0.50 23,891Maintenance Person II 1.00 41,945TOTAL216,144 Custodial Worker (PT) 1.00 18,720OPERATING EXPENSESTotal Personnel 3.00 119,422Supplies 24,490 Overtime 3,000Internal Services 1,531Other ServicesPr<strong>of</strong>essional Fees 34,330 FICA 8,205Maintenance Fees 185,731 Healthcare Benefits - Active 47,461Other Contracted Fees 0 Healthcare Benefits - Retirees 0Pension 38,056TOTAL246,082Total Fringe Benefits 93,722CAPITAL OUTLAY 0TOTAL0TOTAL 3.00 216,144TOTAL APPROPRIATION 462,226363
CITY OF SAGINAWDEPARTMENT OF TECHNICAL SERVICES - INTERNAL SERVICE FUNDSTimothy MoralesAssistant <strong>City</strong> ManagerAdministrative ServicesJeffrey KlopcicDirector <strong>of</strong>Technical ServicesTechnical ServicesGIS<strong>Saginaw</strong> GovernmentTelevision(SGTV)Technical ServicesISNote:SGTV is a component <strong>of</strong> general government but reports to the Technical Services Department.
DEPARTMENT OF TECHNICAL SERVICESGEOGRAPHICAL INFORMATION SYSTEMS (GIS) (650)RESOURCE ALLOCATION<strong>2010</strong>/<strong>2011</strong> APPROVED BUDGETRESOURCESAPPROPRIATIONSSERVICES - SALES 35,000 GEOGRAPHICAL INFORMATIONSYSTEMS 454,839CHARGE FOR SERVICES 445,449 INCREASE IN FUND EQUITY 61,934OTHER REVENUES 37,376 TRANSFERS 1,052TOTAL RESOURCES 517,825 TOTAL APPROPRIATIONS 517,825365
TECHNICAL SERVICES - GIS (650)<strong>2010</strong>/<strong>2011</strong> APPROVED BUDGET<strong>2010</strong> <strong>2010</strong> <strong>2011</strong>2007 2008 2009 Approved Adjusted <strong>2010</strong> ApprovedActual Actual Actual <strong>Budget</strong> <strong>Budget</strong> Projected <strong>Budget</strong>REVENUE ANALYSIS SUMMARYFederal Grants 47,519 0 0 0 0 0 0Services - Sales 30,264 31,054 (578) 45,000 45,000 72,047 35,000Charge for Services 308,148 248,618 409,054 428,147 428,147 428,052 445,449Other Revenues 34,028 29,126 72,062 36,032 56,120 6,601 37,376TOTAL RESOURCES 419,959 308,798 480,538 509,179 529,267 506,700 517,8251738 GEOGRAPHICAL INFORMATION SYSTEMSEXPENDITURE ANALYSIS SUMMARYPersonnel Services 247,714 358,251 373,384 373,774 373,774 357,561 346,038Operating Expenses 91,767 100,163 96,359 121,267 141,355 89,204 93,101Capital Outlay 420 9,828 183 13,100 13,100 9,531 15,700TOTALS 339,901 468,242 469,926 508,141 528,229 456,297 454,8398559 INCREASE IN FUND EQUITYPersonnel Services 0 0 0 0 0 0 0Operating Expenses 0 0 0 0 0 0 0Capital Outlay 0 0 0 0 0 0 0Miscellaneous 0 0 0 0 0 0 61,934TOTALS 0 0 0 0 0 0 61,9349660 TRANSFERS TO OTHER FUNDSPersonnel Services 0 0 0 0 0 0 0Operating Expenses 0 0 0 0 0 0 0Capital Outlay 0 0 0 0 0 0 0Miscellaneous 883 883 1,038 1,038 1,038 1,038 1,052TOTALS 883 883 1,038 1,038 1,038 1,038 1,052TOTAL GEOGRAPHICAL INFORMATION SYSTEMSPersonnel Services 247,714 358,251 373,384 373,774 373,774 357,561 346,038Operating Expenses 91,767 100,163 96,359 121,267 141,355 89,204 93,101Capital Outlay 420 9,828 183 13,100 13,100 9,531 15,700Miscellaneous 883 883 1,038 1,038 1,038 1,038 62,986TOTALEXPENDITURES 340,784 469,125 470,964 509,179 529,267 457,335 517,825366
FUND: 650 – Technical Services - GIS FundDEPARTMENT: Technical ServicesACTIVITY: 1738 – Geographical Information Systems (GIS)STRATEGIC NARRATIVESThe Geographic Information Systems division <strong>of</strong> the Technical Services Departments maintains anddevelops land based computer layers for the <strong>City</strong> Business processes, creates desktop and webapplications for end user information retrieval and provides mapping services for departmental uses.FY <strong>2010</strong>/<strong>2011</strong> GOALS AND OBJECTIVES1. Integration <strong>of</strong> information from various sources and formats to enhance efficiency and promotebetter decision making for governmental policy makers.a. Integrate crime-reporting s<strong>of</strong>tware for enhanced incident mapping capabilities.b. Provide new technology to Police department.Create a real timeconnection in NETRMS for instant crimemapping throughGoogle apps<strong>2010</strong> <strong>2011</strong> 2012Actual Projected Target80% 100% 100%c. Provide sustainable atmosphere for intergovernmental cooperation.<strong>Saginaw</strong> Area GISAuthority website andapplication redesign.Provide enhancedcapabilities and newlook.2009 <strong>2010</strong> <strong>2011</strong>Actual Projected Target25% 100% 100%d. Enhance public access to governmental services and resources through Internet portals.Create e-governmentonline credit cardpayment application2009 <strong>2010</strong> <strong>2011</strong>Actual Projected Target75% 100% 100%367
EXPENDITURE ANALYSIS DETAIL<strong>2010</strong>/<strong>2011</strong> APPROVED BUDGET650-1738 Technical Services GISAllocation PlanPosition Control<strong>2010</strong>/JOB <strong>2011</strong>PERSONNEL SERVICES CLASSIFICATION BUDGET ALLOCATIONSalaries 183,247 Technical ServicesOvertime 7,000 Director 0.50 39,868Fringe Benefits 155,791 GIS Analyst 1.00 54,959Info. Technology Analyst 1.00 49,628TOTAL346,038 GIS Technician 1.00 38,793OPERATING EXPENSESTotal Personnel 3.50 183,247Supplies 14,000 Overtime 7,000Internal Services 48,016Other ServicesPr<strong>of</strong>essional Fees 18,905 FICA 14,554Maintenance Fees 2,680 Healthcare Benefits - Active 51,851Other Contracted Fees 9,500 Healthcare Benefits - Retirees 0Pension 89,386TOTAL93,101Total Fringe Benefits 155,791CAPITAL OUTLAY 15,700TOTAL15,700TOTAL 3.50 346,038TOTAL APPROPRIATION 454,839368
DEPARTMENT OF TECHNICAL SERVICESINFORMATION SERVICES (IS) (658)RESOURCE ALLOCATION<strong>2010</strong>/<strong>2011</strong> APPROVED BUDGETRESOURCESAPPROPRIATIONSCHARGE FOR SERVICES 1,324,077 INFORMATION SERVICES 1,319,981TRANSFERS OUT 4,096TOTAL RESOURCES 1,324,077 TOTAL APPROPRIATIONS 1,324,077369
TECHNICAL SERVICES - IS (658)<strong>2010</strong>/<strong>2011</strong> APPROVED BUDGET<strong>2010</strong> <strong>2010</strong> <strong>2011</strong>2007 2008 2009 Approved Adjusted <strong>2010</strong> ApprovedActual Actual Actual <strong>Budget</strong> <strong>Budget</strong> Projected <strong>Budget</strong>REVENUE ANALYSIS SUMMARYServices - Sales 2,905 0 0 0 0 0 0Charge for Services 1,572,383 1,368,350 1,350,307 1,488,678 1,488,678 1,533,222 1,324,077Interest and Rents 9,840 7,563 0 5,000 5,000 0 0Other Revenues 1,300 0 0 0 0 0 0Transfers from Other Funds 0 0 0 0 0 0 0TOTAL RESOURCES 1,586,428 1,375,913 1,350,307 1,493,678 1,493,678 1,533,222 1,324,0771720 INFORMATION SERVICESEXPENDITURE ANALYSIS SUMMARYPersonnel Services 737,811 720,232 739,656 757,333 757,333 714,159 691,988Operating Expenses 855,046 717,035 600,989 732,302 726,480 612,578 605,368Capital Outlay 37,536 55,068 10,263 0 5,822 5,783 22,625TOTALS 1,630,393 1,492,335 1,350,908 1,489,635 1,489,635 1,332,520 1,319,9819660 TRANSFERS TO OTHER FUNDSPersonnel Services 0 0 0 0 0 0 0Operating Expenses 0 0 0 0 0 0 0Capital Outlay 0 0 0 0 0 0 0Miscellaneous 3,441 3,441 4,043 4,043 4,043 4,043 4,096TOTALS 3,441 3,441 4,043 4,043 4,043 4,043 4,096TOTAL INFORMATION SERVICESPersonnel Services 737,811 720,232 739,656 757,333 757,333 714,159 691,988Operating Expenses 855,046 717,035 600,989 732,302 726,480 612,578 605,368Capital Outlay 37,536 55,068 10,263 0 5,822 5,783 22,625Miscellaneous 3,441 3,441 4,043 4,043 4,043 4,043 4,096TOTALEXPENDITURES 1,633,834 1,495,776 1,354,951 1,493,678 1,493,678 1,336,563 1,324,077370
FUND: 658 – Technical Services - Information Services FundDEPARTMENT: Information Management ServicesACTIVITY: 1720 – Technical Services - ISSTRATEGIC NARRATIVETechnical Services - Information Services provides Information Technology services for all <strong>City</strong> <strong>of</strong><strong>Saginaw</strong>’s Departments. Activities include telecommunications, cellular phones, computer networkingservices, s<strong>of</strong>tware and hardware selection and installation, systems analysis and design, programming,problem resolution, end-user training, and on-line and batch processing.The ultimate goal is to provide citizens, the business community and <strong>City</strong> employees with timely,appropriate and convenient access to information and services through the use <strong>of</strong> technology. It isimperative for the <strong>City</strong> to thoughtfully plan technology investments, to maximize and optimize thoseinvestments and to leverage technology in ways that will create more effective and efficient government andhelp to build the public trust. In an environment <strong>of</strong> rapid change and finite resources, the <strong>City</strong> must focus onprojects and programs that will strengthen the <strong>City</strong>’s technical infrastructure, widen the ability tocommunicate internally and with the community, allow easy access to data and services and streamlinebureaucratic processes. Careful planning and cautious acceptance are necessary to maximize the benefits <strong>of</strong>technology. Emphasis is also needed to ensure that Information Services projects are managed consistently,are cost effective and are aligned with the <strong>City</strong>’s strategic visions.FY <strong>2010</strong>/<strong>2011</strong> GOALS AND OBJECTIVES1. Provide a stable, reliable, secure and cost effective computing environment.a. Reduce the turn around time for end-<strong>of</strong>-lease computer equipment return to IBMAverage number <strong>of</strong> additionaldays before equipment isshipped to IBM after end-<strong>of</strong>leasedate2009Actual<strong>2010</strong>Projected<strong>2011</strong>Target219 160 100b. Increase system availability2009Actual<strong>2010</strong>Projected<strong>2011</strong>TargetPercentage uptime <strong>of</strong> majorcomputer systems 99.72% 99.85% 99.90%c. Complete a Disaster Recovery / Business Continuity Plan.Formal Disaster Recovery /Business Continuity Plan2009ActualN/A<strong>2010</strong>ProjectedDefine scope andanalysis with allDepartments<strong>2011</strong>TargetFormal DisasterRecovery /BusinessContinuity Plandocument371
d. Reduce telephone costs through contract consolidation and disconnection <strong>of</strong> underutilizedtelephone lines.2009Actual<strong>2010</strong>Projected<strong>2011</strong>TargetTotal cost for <strong>City</strong> <strong>of</strong><strong>Saginaw</strong> landline telephoneservice$163,511 $142,000 N/ATotal number <strong>of</strong> landlinetelephone lines / circuits541 lines5 circuits535 lines5 circuitsN/A372
EXPENDITURE ANALYSIS DETAIL<strong>2010</strong>/<strong>2011</strong> APPROVED BUDGET658-1720 Technical Services ISAllocation PlanPosition Control<strong>2010</strong>/JOB <strong>2011</strong>PERSONNEL SERVICES CLASSIFICATION BUDGET ALLOCATIONSalaries 315,983 Technical ServicesOvertime 25,000 Director 0.50 39,868Fringe Benefits 351,005 Assistant Director <strong>of</strong>Technical Services 1.00 69,904TOTAL691,988 Application Analyst 2.00 118,739Tech. Support Specialist 2.00 87,472OPERATING EXPENSES Total Personnel 5.50 315,983Supplies 42,823Internal Services 92,461 Overtime 25,000Other ServicesPr<strong>of</strong>essional Fees 296,465Maintenance Fees 146,279 FICA 23,936Other Contracted Fees 27,340 Healthcare Benefits - Active 81,444Healthcare Benefits - Retirees 66,565TOTAL605,368 Pension 179,060CAPITAL OUTLAY 22,625Total Fringe Benefits 351,005TOTAL22,625 TOTAL 5.50 691,988TOTAL APPROPRIATION 1,319,981373
RADIO OPERATIONS (660)RESOURCE ALLOCATION<strong>2010</strong>/<strong>2011</strong> APPROVED BUDGETRESOURCESAPPROPRIATIONSCHARGE FOR SERVICES 213,310 RADIO OPERATIONS 94,921INTEREST 10,000 INCREASE IN FUND EQUITY 127,865TRANSFERS OUT 524TOTAL RESOURCES 223,310 TOTAL APPROPRIATIONS 223,310374
RADIO OPERATIONS (660)<strong>2010</strong>/<strong>2011</strong> APPROVED BUDGET<strong>2010</strong> <strong>2010</strong> <strong>2011</strong>2007 2008 2009 Approved Adjusted <strong>2010</strong> ApprovedActual Actual Actual <strong>Budget</strong> <strong>Budget</strong> Projected <strong>Budget</strong>REVENUE ANALYSIS SUMMARYCharge for Services 216,180 216,181 216,181 216,181 216,181 213,300 213,310Interest and Rents 45,366 35,286 0 10,000 10,000 0 10,000Other Revenues 0 17 86 0 0 0 0Transfers from Other Funds 0 0 0 0 0 0 0TOTAL RESOURCES 261,546 251,484 216,267 226,181 226,181 213,300 223,3104422 RADIO OPERATIONSEXPENDITURE ANALYSIS SUMMARYPersonnel Services 6,593 12,804 8,203 3,230 3,230 5,288 3,230Operating Expenses 62,540 64,407 78,971 86,030 86,030 29,751 81,691Capital Outlay 0 0 0 10,000 10,000 0 10,000TOTALS 69,133 77,211 87,174 99,260 99,260 35,039 94,9218559 INCREASE IN FUND EQUITYPersonnel Services 0 0 0 0 0 0 0Operating Expenses 0 0 0 0 0 0 0Capital Outlay 0 0 0 0 0 0 0Miscellaneous 0 0 0 126,404 126,404 0 127,865TOTALS 0 0 0 126,404 126,404 0 127,8659660 TRANSFERS TO OTHER FUNDSPersonnel Services 0 0 0 0 0 0 0Operating Expenses 0 0 0 0 0 0 0Capital Outlay 0 0 0 0 0 0 0Miscellaneous 440 440 910,517 517 517 517 524TOTALS 440 440 910,517 517 517 517 524TOTAL RADIO OPERATIONSPersonnel Services 6,593 12,804 8,203 3,230 3,230 5,288 3,230Operating Expenses 62,540 64,407 78,971 86,030 86,030 29,751 81,691Capital Outlay 0 0 0 10,000 10,000 0 10,000Miscellaneous 440 440 910,517 126,921 126,921 517 128,389TOTALEXPENDITURES 69,572 77,651 997,691 226,181 226,181 35,556 223,310375
EXPENDITURE ANALYSIS DETAIL<strong>2010</strong>/<strong>2011</strong> APPROVED BUDGET660-4422 Radio OperationsAllocation PlanPosition Control<strong>2010</strong>/JOB <strong>2011</strong>PERSONNEL SERVICES CLASSIFICATION BUDGET ALLOCATIONSalaries 0Overtime 3,000 Total Personnel 0.00 0Fringe Benefits 230TOTAL3,230 Overtime 3,000OPERATING EXPENSES FICA 230Healthcare Benefits - Active 0Supplies 30,500 Healthcare Benefits - Retirees 0Internal Services 7,203 Pension 0Other ServicesPr<strong>of</strong>essional Fees 36,788 Total Fringe Benefits 230Maintenance Fees 4,600Other Contracted Fees 2,600TOTAL 0.00 3,230TOTAL81,691CAPITAL OUTLAY 10,000TOTAL10,000TOTAL APPROPRIATION 94,921376
MOTOR POOL OPERATIONS (661)RESOURCE ALLOCATION<strong>2010</strong>/<strong>2011</strong> APPROVED BUDGETRESOURCESAPPROPRIATIONSCHARGE FOR SERVICES 1,541,354 GARAGE OPERATIONS 2,254,127OTHER REVENUES 723,529 TRANSFERS 10,756TOTAL RESOURCES 2,264,883 TOTAL APPROPRIATIONS 2,264,883377
MOTOR POOL OPERATIONS (661)<strong>2010</strong>/<strong>2011</strong> APPROVED BUDGET<strong>2010</strong> <strong>2010</strong> <strong>2011</strong>2007 2008 2009 Approved Adjusted <strong>2010</strong> ApprovedActual Actual Actual <strong>Budget</strong> <strong>Budget</strong> Projected <strong>Budget</strong>REVENUE ANALYSIS SUMMARYCharge for Services 1,517,397 2,966,328 2,051,202 1,680,736 1,680,736 728,593 1,541,354Interest and Rents 0 0 0 0 0 0 0Other Revenues 3,326 1,134,529 308,444 1,164,935 900,963 964,232 723,529Transfers from Other Funds 0 5,301 0 0 0 0 0TOTAL RESOURCES 1,520,723 4,106,158 2,359,646 2,845,671 2,581,699 1,692,826 2,264,8834480 GARAGE OPERATIONSEXPENDITURE ANALYSIS SUMMARYPersonnel Services 706,656 767,833 828,649 1,116,223 1,116,223 960,818 1,136,420Operating Expenses 924,854 792,556 925,037 1,028,185 1,013,040 682,897 1,117,707Capital Outlay 1,526 1,190 10,636 0 134,278 0 0Miscellaneous 5,297 22,085 6,979 362,513 307,513 38,494 0TOTALS 1,638,333 1,583,664 1,771,301 2,506,921 2,571,054 1,682,208 2,254,1279660 TRANSFERS TO OTHER FUNDSPersonnel Services 0 0 0 0 0 0 0Operating Expenses 0 0 0 0 0 0 0Capital Outlay 0 0 0 0 0 0 0Miscellaneous 9,037 9,037 10,618 10,618 10,618 10,618 10,756TOTALS 9,037 9,037 10,618 10,618 10,618 10,618 10,756TOTAL MOTOR POOL OPERATIONSPersonnel Services 706,656 767,833 828,649 1,116,223 1,116,223 960,818 1,136,420Operating Expenses 924,854 792,556 925,037 1,028,185 1,013,040 682,897 1,117,707Capital Outlay 1,526 1,190 10,636 0 134,278 0 0Miscellaneous 14,334 31,122 17,597 373,131 318,131 49,112 10,756TOTALEXPENDITURES 1,647,370 1,592,701 1,781,919 2,517,539 2,581,672 1,692,826 2,264,883378
FUND: 661 – Motor Pool Operation FundDEPARTMENT: Public ServicesACTIVITY: 4480 – Motor Pool OperationSTRATEGIC NARRATIVESThe primary function <strong>of</strong> the Motor Pool Operation Fund is to provide the maintenance, repair andreplacement <strong>of</strong> motorized equipment. The Division currently maintains <strong>City</strong>-owned motor vehicles,leased vehicles and 134 miscellaneous pieces <strong>of</strong> equipment. Currently, the Garage maintains all <strong>City</strong>vehicular equipment, with the exception <strong>of</strong> that assigned to the Fire Department.FY <strong>2010</strong>/<strong>2011</strong> GOALS AND OBJECTIVES1. To implement a vehicle replacement revolving funds to finance vehicle replacement.a. To maintain the Motor Pool fleetNumber <strong>of</strong>Completed JobOrders2009Actual<strong>2010</strong>Projected<strong>2011</strong>Target2,828 3,000 3,100b. Increase the number <strong>of</strong> Lube Oil and Filter (LOF)2009Actual<strong>2010</strong>Projected<strong>2011</strong>TargetCompleteLOF’s 329 350 3502. Make preventative maintenance a priority.a. Advise all divisions <strong>of</strong> need for preventative maintenance379
EXPENDITURE ANALYSIS DETAIL<strong>2010</strong>/<strong>2011</strong> APPROVED BUDGET661-4480 Motor Pool OperationsAllocation PlanPosition Control<strong>2010</strong>/JOB <strong>2011</strong>PERSONNEL SERVICES CLASSIFICATION BUDGET ALLOCATIONSalaries 427,674 Fleet Administrator 1.00 65,590Overtime 50,000 Labor Foreman Garage/Stree 1.00 52,458Fringe Benefits 658,746 Adminstrative Pr<strong>of</strong>essional 0.20 8,361Mech Equip Repairperson II 1.00 43,981TOTAL1,136,420 Mech Equip Repairperson II 5.00 216,472Parts Stock Clerk II 1.00 40,812OPERATING EXPENSES Total Personnel 9.20 427,674Supplies 482,445Internal Services 327,497 Overtime 50,000Other ServicesPr<strong>of</strong>essional Fees 122,294Maintenance Fees 184,971 FICA 37,636Other Contracted Fees 500 Healthcare Benefits - Active 178,841Healthcare Benefits - Retirees 234,648TOTAL1,117,707 Pension 207,621CAPITAL OUTLAY 0Total Fringe Benefits 658,746TOTAL0 TOTAL 9.20 1,136,420<strong>MI</strong>SCELLANEOUS 0TOTAL0TOTAL APPROPRIATION 2,254,127380
SELF-INSURANCE FUND (677)RESOURCE ALLOCATION<strong>2010</strong>/<strong>2011</strong> APPROVED BUDGETThe Self Insurance Fund was established by <strong>City</strong> Council to serve as a general insurance reserve forliabilities and claims not covered by commerical carriers or to pay deductibles. This fund accounts for thepayment <strong>of</strong> insurance premiums, the distribution <strong>of</strong> insurance costs to other <strong>City</strong> funds and records theinsurance claims liability.RESOURCESAPPROPRIATIONSCHARGE FOR SERVICES 915,567 SELF INSURANCE 1,176,135OTHER REVENUES 591,099 OPERATING TRANSFERS 330,531TOTAL RESOURCES 1,506,666 TOTAL APPROPRIATIONS 1,506,666381
SELF-INSURANCE FUND (677)<strong>2010</strong>/<strong>2011</strong> APPROVED BUDGET<strong>2010</strong> <strong>2010</strong> <strong>2011</strong>2006 2008 2009 Approved Adjusted <strong>2010</strong> ApprovedActual Acutal Actual <strong>Budget</strong> <strong>Budget</strong> Projected <strong>Budget</strong>REVENUE ANALYSIS SUMMARYCharge for Services 1,930,676 800,131 3,097,522 785,198 785,198 831,276 915,567Interest and Rents 15,912 13,463 0 15,000 15,000 0 0Other Revenues 0 0 140,325 994,368 994,368 477,808 591,099Transfers from Other Funds 0 0 0 0 0 0 0Current Reserve GF 0 0 0 0 0 0 0TOTAL RESOURCES 1,946,588 813,594 3,237,847 1,794,566 1,794,566 1,309,084 1,506,6661762 SELF INSURANCEEXPENDITURE ANALYSIS SUMMARYPersonnel Services 0 0 2,603 0 0 0 0Operating Expenses 1,612,136 917,047 2,272,512 1,501,378 1,501,378 1,015,896 1,176,135Capital Outlay 0 0 0 0 0 0 0Miscellaneous 10,770 4,388 2,213 0 0 0 0TOTALS 1,622,906 921,435 2,277,328 1,501,378 1,501,378 1,015,896 1,176,1359660 OPERATING TRANSFERSPersonnel Services 0 0 0 0 0 0 0Operating Expenses 0 0 0 0 0 0 0Capital Outlay 0 0 0 0 0 0 0Miscellaneous 0 0 0 293,188 293,188 293,188 330,531TOTALS 0 0 0 293,188 293,188 293,188 330,531TOTAL SELF INSURANCEPersonnel Services 0 0 2,603 0 0 0 0Operating Expenses 1,612,136 917,047 2,272,512 1,501,378 1,501,378 1,015,896 1,176,135Capital Outlay 0 0 0 0 0 0 0Miscellaneous 10,770 4,388 2,213 293,188 293,188 293,188 330,531TOTALEXPENDITURES 1,622,906 921,435 2,277,328 1,794,566 1,794,566 1,309,084 1,506,666382
INTERNAL SERVICE FUNDPOSITION ANALYSIS<strong>2010</strong>/<strong>2011</strong> APPROVED BUDGET<strong>2010</strong> <strong>2010</strong> <strong>2011</strong>2007 2008 2009 Approved Adjusted <strong>2010</strong> ApprovedActual Actual Actual <strong>Budget</strong> <strong>Budget</strong> Projected <strong>Budget</strong>INTERNAL SERVICE FUNDPublic Works Building 2.20 2.20 2.50 2.50 2.50 2.50 3.00Technical Services GIS Fund 4.00 4.00 4.00 4.00 4.00 4.00 3.50Technical Services IS Fund 7.00 7.00 7.00 7.00 7.00 7.00 5.50Motor Pool Operations 9.20 9.20 9.20 10.20 10.20 10.20 9.20Workers Compensation 0.60 0.60 0.60 0.60 0.60 0.60 0.60TOTAL POSITIONS 23.00 23.00 23.30 24.30 24.30 24.30 21.80The <strong>2010</strong>/<strong>2011</strong> Approved <strong>Budget</strong> for the Internal Service Fund will decrease, in total, by 2.50 from the <strong>2010</strong> budget levels. During FY <strong>2010</strong>, theDirector <strong>of</strong> Information Services and one Application Analyst positions were eliminated from the complement. This elimination was attributed toretirement by both individuals. As a result <strong>of</strong> these retirements, city administration reorganized the Department <strong>of</strong> Information Services and theGeographical Information System from the Department <strong>of</strong> Public Services into one department. This new department has been renamed to theDepartment <strong>of</strong> Technical Services. The GIS Administrator was elevated to department head status and re-titled Director <strong>of</strong> Technical Services. Inaddition, the Web Development Officer was reclassified to the Information Technology Analyst. The Director <strong>of</strong> Technical Services will reportdirectly to the Assistant <strong>City</strong> Manager for Administrative Services and a portion <strong>of</strong> this position's salary has been split between the two areas.Another change for the Internal Service Fund is the addition <strong>of</strong> the Fleet Administrator to the Motor Pool Operations Fund. This individual willreport directly to the Director <strong>of</strong> Public Services. With the addition <strong>of</strong> this position, one Mechanic Equipment Repairperson II position will beeliminated from the complement. Also, in <strong>2010</strong> the Motor Pool Operations Fund had a Crossover Operator. This position has been allocated tothe Streets Fund.Finally, the Public Works Building Fund will increase by .50. The increase in this fund is due to the redistribution <strong>of</strong> the Building and GroundsSupervisor by 25% and the Labor Foreman for Streets/Building Operations by 25%.383
CITY OF SAGINAWWORKERS COMPENSATION FUND - INTERNAL SERVICE FUNDSDennis JordanDirector <strong>of</strong>Employee ServicesWorkers Comp.AdministrationEmployee HealthServices
WORKERS COMPENSATION (678)RESOURCE ALLOCATION<strong>2010</strong>/<strong>2011</strong> APPROVED BUDGETRESOURCESAPPROPRIATIONSCHARGE FOR SERVICES 1,251,955 WORKERS COMPENSATIONAD<strong>MI</strong>NISTRATION 1,159,688INTEREST 40,000 EMPLOYEE HEALTH SERV. 132,267TOTAL RESOURCES 1,291,955 TOTAL APPROPRIATIONS 1,291,955385
WORKERS COMPENSATION (678)<strong>2010</strong>/<strong>2011</strong> APPROVED BUDGET<strong>2010</strong> <strong>2010</strong> <strong>2011</strong>2007 2008 2009 Approved Adjusted <strong>2010</strong> ApprovedActual Actual Actual <strong>Budget</strong> <strong>Budget</strong> Projected <strong>Budget</strong>REVENUE ANALYSIS SUMMARYState Grants 0 0 0 0 0 2,416 0Charge for Services 1,512,846 1,136,424 897,211 1,251,955 1,251,955 1,211,883 1,251,955Interest and Rents 44,303 34,489 33,555 40,000 40,000 8,254 40,000Other Revenues 0 0 0 0 0 0 0Transfers from Other Funds 0 0 0 0 0 0 0TOTAL RESOURCES 1,557,149 1,170,913 930,766 1,291,955 1,291,955 1,222,553 1,291,9551750 WORKERS COMPENSATION AD<strong>MI</strong>NISTRATIONEXPENDITURE ANALYSIS SUMMARYPersonnel Services 0 0 (208) 0 0 0 0Operating Expenses 1,146,303 1,114,367 840,614 1,170,510 1,170,510 791,827 1,159,688Capital Outlay 0 0 766 0 0 0 0Miscellaneous 0 0 0 0 0 0 0TOTALS 1,146,303 1,114,367 841,172 1,170,510 1,170,510 791,827 1,159,6881751 EMPLOYEE HEALTH SERVICESPersonnel Services 38,256 37,097 44,270 44,296 44,296 44,361 45,550Operating Expenses 58,702 59,203 76,879 77,149 77,149 79,349 86,717Capital Outlay 0 0 0 0 0 0 0TOTALS 96,958 96,300 121,149 121,445 121,445 123,710 132,267TOTAL WORKERS COMPENSATIONPersonnel Services 38,256 37,097 44,062 44,296 44,296 44,361 45,550Operating Expenses 1,205,005 1,173,570 917,493 1,247,659 1,247,659 871,176 1,246,405Capital Outlay 0 0 766 0 0 0 0Miscellaneous 0 0 0 0 0 0 0TOTALEXPENDITURES 1,243,261 1,210,667 962,321 1,291,955 1,291,955 915,537 1,291,955386
FUND: 678 – Worker’s Compensation FundDEPARTMENT/DIVISION: Worker’s CompensationACTIVITY: 1750 – Worker’s Compensation AdministrationSTRATEGIC NARRATIVESThe <strong>City</strong> <strong>of</strong> <strong>Saginaw</strong> is a self-insured employer governed by the Michigan Workers’ DisabilityCompensation Act. The program is coordinated with the Office <strong>of</strong> Employee Services, a third partyadministrator and medical treatment facilities. Occupational health services are provided by CovenantOccupational Medical Center. The <strong>City</strong>’s third party administrator, Cambridge Integrated Services,handles all medical and lost time claims by claims management, bill review and payment <strong>of</strong> all medicalexpenses and generates indemnity payments on behalf <strong>of</strong> the <strong>City</strong>.The primary focus <strong>of</strong> the program is medical cost containment, along with aggressive case and riskmanagement. The program elements include job hazard analysis, aggressive handling <strong>of</strong> injury andillness, and an early return to work program. Departments continue to promote a safety program bysafety training, maintaining equipment and utilizing personal protective equipment. The team effort <strong>of</strong>our safety program with labor and management strive to improve the safety and health <strong>of</strong> employees andtheir working environment.FY <strong>2010</strong>/<strong>2011</strong> GOALS AND OBJECTIVES1. Provide a Healthy and Safe Work Environment for all employeesa. To reduce work related illnesses and injuries.Number <strong>of</strong> workrelated illnessesand injuries2009Actual<strong>2010</strong>Projected<strong>2011</strong>Target74 70 < 70387
EXPENDITURE ANALYSIS DETAIL<strong>2010</strong>/<strong>2011</strong> APPROVED BUDGET678-1750 Worker's Comp AdministrationAllocation PlanPosition Control<strong>2010</strong>/JOB <strong>2011</strong>PERSONNEL SERVICES CLASSIFICATION BUDGET ALLOCATIONSalaries 0Overtime 0 Total Personnel 0.00 0Fringe Benefits 0TOTAL0 Overtime 0OPERATING EXPENSES FICA 0Healthcare Benefits - Active 0Supplies 0 Healthcare Benefits - Retirees 0Internal Services 0 Pension 0Other ServicesPr<strong>of</strong>essional Fees 1,010,660 Total Fringe Benefits 0Maintenance Fees 20,300Other Contracted Fees 128,728TOTAL 0.00 0TOTAL1,159,688CAPITAL OUTLAY 0TOTAL0TOTAL APPROPRIATION 1,159,688388
EXPENDITURE ANALYSIS DETAIL<strong>2010</strong>/<strong>2011</strong> APPROVED BUDGET678-1751 Employee Health ServicesAllocation PlanPosition Control<strong>2010</strong>/JOB <strong>2011</strong>PERSONNEL SERVICES CLASSIFICATION BUDGET ALLOCATIONSalaries 28,009 Administrative Assistant I 0.60 28,009Overtime 0Fringe Benefits 17,541 Total Personnel 0.60 28,009TOTAL45,550Overtime 0OPERATING EXPENSESFICA 2,257Supplies 0 Healthcare Benefits - Active 3,063Internal Services 13,717 Healthcare Benefits - Retirees 0Other Services Pension 12,221Pr<strong>of</strong>essional Fees 73,000Maintenance Fees 0 Total Fringe Benefits 17,541Other Contracted Fees 0TOTAL86,717 TOTAL 0.60 45,550CAPITAL OUTLAY 0TOTAL0TOTAL APPROPRIATION 132,267389
FIDUCIARY FUNDS
UNFUNDED LIABILITIES FUND (674)RESOURCE ALLOCATION<strong>2010</strong>/<strong>2011</strong> APPROVED BUDGETThis fund was established to begin funding <strong>of</strong> the unfunded health insurance permiums that are fully paidfor all <strong>City</strong> retirees. The unfunded liability is estimated to be over $215 million. An actuarial valuationprovides recommended funding levels over the next five years.RESOURCESAPPROPRIATIONSINTEREST AND RENTS 30,000 INCREASE IN FUND EQUITY 500,000CHARGE TO OTHER FUNDS 470,000TOTAL RESOURCES 500,000 TOTAL APPROPRIATIONS 500,000390
UNFUNDED LIABILITIES FUND (674)<strong>2010</strong>/<strong>2011</strong> APPROVED BUDGET<strong>2010</strong> <strong>2010</strong> <strong>2011</strong>2007 2008 2009 Approved Adjusted <strong>2010</strong> ApprovedActual Actual Actual <strong>Budget</strong> <strong>Budget</strong> Projected <strong>Budget</strong>REVENUE ANALYSIS SUMMARYInterest and Rents 47,062 40,406 51,490 30,000 30,000 18,912 30,000Other Revenues 283,039 (194,206) (555,700) 0 0 75,282 0Charge to Other Funds 400,000 400,000 470,000 470,000 470,000 470,000 470,000TOTAL RESOURCES 730,101 246,200 (34,210) 500,000 500,000 564,194 500,0008559 INCREASE IN FUND EQUITYEXPENDITURE ANALYSIS SUMMARYPersonnel Services 0 0 0 0 0 0 0Operating Expenses 0 0 0 0 0 0 0Capital Outlay 131,448 0 0 0 0 0 0Miscellaneous 0 112,503 0 500,000 500000 0 500,000TOTALS 131,448 112,503 0 500,000 500,000 0 500,000TOTAL UNFUNDED LIABILITIESPersonnel Services 0 0 0 0 0 0 0Operating Expenses 0 0 0 0 0 0 0Capital Outlay 131,448 0 0 0 0 0 0Miscellaneous 0 112,503 0 500,000 500,000 0 500,000TOTALEXPENDITURES 131,448 112,503 0 500,000 500,000 0 500,000391
FOREST LAWN CEMETERY (711)RESOURCE ALLOCATION<strong>2010</strong>/<strong>2011</strong> APPROVED BUDGETRESOURCESAPPROPRIATIONSCHARGE FOR SERVICES 19,000 INCREASE IN FUND EQUITY 19,000TOTAL RESOURCES 19,000 TOTAL APPROPRIATIONS 19,000The permenant fund is used to report resources that are legally restricted to the extent that only earnings,not principle, may be used for cemetery care purposes in support <strong>of</strong> the <strong>City</strong>'s program.392
FOREST LAWN CEMETERY (711)<strong>2010</strong>/<strong>2011</strong> APPROVED BUDGET<strong>2010</strong> <strong>2010</strong> <strong>2011</strong>2007 2008 2009 Approved Adjusted <strong>2010</strong> ApprovedActual Actual Actual <strong>Budget</strong> <strong>Budget</strong> Projected <strong>Budget</strong>REVENUE ANALYSIS SUMMARYCharge for Services 28,961 0 0 19,000 19,000 0 19,000Other Revenues 0 0 0 0 0 0 0TOTAL RESOURCES 28,961 0 0 19,000 19,000 0 19,0008559 INCREASE IN FUND EQUITYEXPENDITURE ANALYSIS SUMMARYPersonnel Services 0 0 0 0 0 0 0Operating Expenses 0 0 0 0 0 0 0Capital Outlay 0 0 0 0 0 0 0Miscellaneous 0 0 0 19,000 19,000 0 19,000TOTALS 0 0 0 19,000 19,000 0 19,000TOTAL FOREST LAWN CEMETERYPersonnel Services 0 0 0 0 0 0 0Operating Expenses 0 0 0 0 0 0 0Capital Outlay 0 0 0 0 0 0 0Miscellaneous 0 0 0 19,000 19,000 0 19,000TOTALEXPENDITURES 0 0 0 19,000 19,000 0 19,000393
OAKWOOD CEMETERY (712)RESOURCE ALLOCATION<strong>2010</strong>/<strong>2011</strong> APPROVED BUDGETRESOURCESAPPROPRIATIONSCHARGE FOR SERVICES 6,000 INCREASE IN FUND EQUITY 6,000TOTAL RESOURCES 6,000 TOTAL APPROPRIATIONS 6,000The permenant fund is used to report resources that are legally restricted to the extent that only earnings,not principle, may be used for cemetery care purposes in support <strong>of</strong> the <strong>City</strong>'s program.394
OAKWOOD CEMETERY (712)<strong>2010</strong>/<strong>2011</strong> APPROVED BUDGET<strong>2010</strong> <strong>2010</strong> <strong>2011</strong>2007 2008 2009 Approved Adjusted <strong>2010</strong> ApprovedActual Actual Actual <strong>Budget</strong> <strong>Budget</strong> Projected <strong>Budget</strong>REVENUE ANALYSIS SUMMARYCharge for Services 0 6,000 0 6,000 6,000 0 6,000Other Revenues 0 0 0 0 0 0 0TOTAL RESOURCES 0 6,000 0 6,000 6,000 0 6,0008559 INCREASE IN FUND EQUITYEXPENDITURE ANALYSIS SUMMARYPersonnel Services 0 0 0 0 0 0 0Operating Expenses 0 0 0 0 0 0 0Capital Outlay 0 0 0 0 0 0 0Miscellaneous 0 0 0 6,000 6,000 0 6,000TOTALS 0 0 0 6,000 6,000 0 6,000TOTAL OAKWOOD CEMETERYPersonnel Services 0 0 0 0 0 0 0Operating Expenses 0 0 0 0 0 0 0Capital Outlay 0 0 0 0 0 0 0Miscellaneous 0 0 0 6,000 6,000 0 6,000TOTALEXPENDITURES 0 0 0 6,000 6,000 0 6,000395
POLICE AND FIRE PENSION FUND (732)RESOURCE ALLOCATION<strong>2010</strong>/<strong>2011</strong> APPROVED BUDGETAssets accumulated for the payment <strong>of</strong> retirement benefits for <strong>City</strong> Police and Fire personnel are recorded inthis fund. Benefits for retired members are paid from this fund and active members contribute to the pensionsystem through payroll deductions. The <strong>City</strong> contributes to the fund by annual appropriation from the GeneralFund which is determined and set by annual valuations.RESOURCESAPPROPRIATIONSCHARGE TO OTHER FUNDS 4,931,700 POLICE AND FIRE PENSION 926,050INTEREST AND RENTS 2,596,466 POLICE PENSION 6,610,000OTHER REVENUES 5,807,884 FIRE PENSION 5,800,000TOTAL RESOURCES 13,336,050 TOTAL APPROPRIATIONS 13,336,050396
POLICE AND FIRE PENSION (732)<strong>2010</strong>/<strong>2011</strong> APPROVED BUDGET<strong>2010</strong> <strong>2010</strong> <strong>2011</strong>2007 2008 2009 Approved Adjusted <strong>2010</strong> ApprovedActual Actual Actual <strong>Budget</strong> <strong>Budget</strong> Projected <strong>Budget</strong>REVENUE ANALYSIS SUMMARYCharge to Other Funds 4,842,384 4,740,074 4,931,700 5,250,000 4,453,364 4,453,364 4,931,700Interest and Rents 3,619,500 3,343,055 3,485,175 3,600,000 3,600,000 2,752,386 2,596,466Other Revenues 16,677,043 (10,407,788) (22,154,327) 4,541,466 4,541,466 15,268,550 5,807,884TOTAL RESOURCES 25,138,927 (2,324,659) (13,737,452) 13,391,466 12,594,830 22,474,300 13,336,0501765 POLICE AND FIRE PENSIONEXPENDITURE ANALYSIS SUMMARYPersonnel Services 0 0 38,478 41,341 41,341 41,407 44,324Operating Expenses 818,202 666,782 613,431 870,125 870,125 676,683 881,726Capital Outlay 0 0 0 0 0 0 0Miscellaneous 0 0 0 0 0 0 0TOTALS 818,202 666,782 651,909 911,466 911,466 718,091 926,0501766 POLICE PENSIONPersonnel Services 6,347,818 6,498,613 6,614,020 6,600,000 6,600,000 6,724,468 6,610,000Operating Expenses 0 0 0 0 0 0 0Capital Outlay 0 0 0 0 0 0 0Miscellaneous 0 0 0 0 0 0 0TOTALS 6,347,818 6,498,613 6,614,020 6,600,000 6,600,000 6,724,468 6,610,0001767 FIRE PENSIONPersonnel Services 5,434,880 5,790,217 5,792,959 5,880,000 5,880,000 5,875,027 5,800,000Operating Expenses 0 0 0 0 0 0 0Capital Outlay 0 0 0 0 0 0 0Miscellaneous 0 0 0 0 0 0 0TOTALS 5,434,880 5,790,217 5,792,959 5,880,000 5,880,000 5,875,027 5,800,000TOTAL POLICE AND FIRE PENSION FUNDPersonnel Services 11,782,698 12,288,830 12,445,457 12,521,341 12,521,341 12,640,903 12,454,324Operating Expenses 818,202 666,782 613,431 870,125 870,125 676,683 881,726Capital Outlay 0 0 0 0 0 0 0Miscellaneous 0 0 0 0 0 0 0TOTALEXPENDITURES 12,600,900 12,955,612 13,058,888 13,391,466 13,391,466 13,317,586 13,336,050397
POSITION ANALYSIS<strong>2010</strong>/<strong>2011</strong> APPROVED BUDGET<strong>2010</strong> <strong>2010</strong> <strong>2011</strong>2007 2008 2009 Approved Adjusted <strong>2010</strong> ApprovedActual Actual Actual <strong>Budget</strong> <strong>Budget</strong> Projected <strong>Budget</strong>FIDUCIARY FUND - POLICE AND FIRE PENSIONPolice and Fire Pension 0.00 0.00 0.45 0.45 0.45 0.45 0.45TOTAL POSITIONS 0.00 0.00 0.45 0.45 0.45 0.45 0.45The Approved <strong>2010</strong>/<strong>2011</strong> personnel complement will remain the same. However, effective July 1, the Personnel Generalist position hasbeen reclassified to Assistant Director <strong>of</strong> Employee Services. Beginning in FY 2009, .45 <strong>of</strong> a Personnel Generalist was allocated to thePolice and Fire Pension Fund.398
EXPENDITURE ANALYSIS DETAIL<strong>2010</strong>/<strong>2011</strong> APPROVED BUDGET732-1765 Police & Fire PensionAllocation PlanPosition Control<strong>2010</strong>/JOB <strong>2011</strong>PERSONNEL SERVICES CLASSIFICATION BUDGET ALLOCATIONSalaries 27,695 Assist. Dir. <strong>of</strong> Employee Serv. 0.45 27,695Overtime 0Fringe Benefits 16,629 Total Personnel 0.45 27,695TOTAL44,324Overtime 0OPERATING EXPENSESFICA 2,205Supplies 0 Healthcare Benefits - Active 2,331Internal Services 57,776 Healthcare Benefits - Retirees 0Other Services Pension 12,093Pr<strong>of</strong>essional Fees 676,250Maintenance Fees 1,500 Total Fringe Benefits 16,629Other Contracted Fees 146,200TOTAL881,726 TOTAL 0.45 44,324CAPITAL OUTLAY 0TOTAL0TOTAL APPROPRIATION 926,050399
BLISS PARK EXPENDITURE ENDOWMENT (737)RESOURCE ALLOCATION<strong>2010</strong>/<strong>2011</strong> APPROVED BUDGETOver the years, the <strong>City</strong> has accepted several bequests or donations to be held in trust to support some publicpurpose. Assets <strong>of</strong> these trusts are placed in non-expendable trusts and invested. Proceeds from theseinvestments are credited to expendable trust funds and are available for expenditures as required to fulfillthe terms <strong>of</strong> the trust.Bliss Park Expenditure Endowment is such a fund. This fund provides for the beautification activities thattake place seasonally in the park. Activities include the restocking <strong>of</strong> the gardens and the temporarycaretaker employed to maintain the park. The source <strong>of</strong> funding is the A.T. Bliss Endowment (expendable).RESOURCESAPPROPRIATIONSOTHER REVENUES 8,700 BLISS PARK MAINTENANCE 8,700TOTAL RESOURCES 8,700 TOTAL APPROPRIATIONS 8,700400
BLISS PARK EXPENDITURE ENDOWMENT (737)<strong>2010</strong>/<strong>2011</strong> APPROVED BUDGET<strong>2010</strong> <strong>2010</strong> <strong>2011</strong>2007 2008 2009 Approved Adjusted <strong>2010</strong> ApprovedActual Actual Actual <strong>Budget</strong> <strong>Budget</strong> Projected <strong>Budget</strong>REVENUE ANALYSIS SUMMARYInterest and Rents 0 52 166 0 0 31 0Other Revenues 0 0 0 8,700 8,700 4,429 8,700TOTAL RESOURCES 0 52 166 8,700 8,700 4,460 8,7007545 BLISS PARK MAINTENANCEEXPENDITURE ANALYSIS SUMMARYPersonnel Services 0 0 0 0 0 0 0Operating Expenses 2,842 9,150 7,087 8,700 8,700 4,460 8,700Capital Outlay 0 0 0 0 0 0 0Miscellaneous 0 0 0 0 0 0 0TOTALS 2,842 9,150 7,087 8,700 8,700 4,460 8,700TOTAL BLISS PARK EXPENDITURE ENDOWMENTPersonnel Services 0 0 0 0 0 0 0Operating Expenses 2,842 9,150 7,087 8,700 8,700 4,460 8,700Capital Outlay 0 0 0 0 0 0 0Miscellaneous 0 0 0 0 0 0 0TOTALEXPENDITURES 2,842 9,150 7,087 8,700 8,700 4,460 8,700401
DEBT SERVICE
CITY OF SAGNAWDEBT SERVICEOVERVIEW:The <strong>City</strong> currently has three debt issues outstanding for a general obligation nature. These issuesare ultimately secured by the full faith, credit and taxing power <strong>of</strong> the <strong>City</strong>.Water Supply System Revenue Bond, Series 2000On March 6, 2000, the corporation issued $14,955,000 Water Supply System RevenueRefunding Bond, Series 2000. The bonds were issued under the provision Act 94, Public Acts <strong>of</strong>Michigan, 1933, as amended, for the purpose <strong>of</strong> defraying the cost <strong>of</strong> acquiring, constructing, andinstalling improvements to the Cities’ Water Supply System and refunding certain <strong>of</strong> the Cities’outstanding Water Supply System Refunding Bonds. The Bonds are payable solely from net revenues <strong>of</strong>the System.The <strong>Saginaw</strong>-Midland Municipal Water Supply Corporation, 2002 Refunding IssueOn September 1, 2002, the corporation issued $11,180,000 Water Supply Refunding RevenueBonds (Limited Tax General Obligation), Series 2002. The bonds were issued under the provisions <strong>of</strong>Act 94, Public Acts <strong>of</strong> Michigan, 1933, as amended, Act 233, Public Acts <strong>of</strong> Michigan, 1995, asamended, Act 34, Public Acts <strong>of</strong> Michigan, 2001, as amended, and resolutions and ordinances <strong>of</strong> the<strong>Saginaw</strong>-Midland Municipal Water Supply Corporation for the purpose <strong>of</strong> refunding the Corporation’soutstanding Water Supply System Revenue Bonds, Series 1993. The Bonds are payable solely from netrevenues <strong>of</strong> the <strong>Saginaw</strong> Midland Water Supply SystemThe <strong>Saginaw</strong>-Midland Municipal Water Supply Corporation, 2006 IssueOn April 24, 2006, the corporation issued $2,665,000 Water Supply System Revenue Bonds(Limited Tax General Obligation) Series 2006. The bonds were issued under the provisions <strong>of</strong> Act 94,Pubic Acts <strong>of</strong> Michigan, 1933, as amended, Act 233, Public Acts <strong>of</strong> Michigan, 1995, as amended, andOrdinance No. 1 as amended by subsequently adopted Ordinances and Ordinance No. 2005-1 <strong>of</strong> theIssuer, for the purpose <strong>of</strong> defraying the cost <strong>of</strong> acquiring and constructing enlargements and extensionsto the <strong>Saginaw</strong>-Midland Water Supply Corporation. The Bonds are payable solely from net revenues <strong>of</strong>the System.Water Supply System Revenue Bond, Series 2008On May 6, 2008, the corporation issued $11,100,000 Water Supply System Revenue Bonds,Series 2008. The bonds were issued under the provision Act 94, Public Acts <strong>of</strong> Michigan, 1933, asamended, for the purpose <strong>of</strong> paying part <strong>of</strong> the cost <strong>of</strong> acquiring and constructing improvements to theCities’ Water Supply System. These bonds are payable solely from net revenues <strong>of</strong> the System.The <strong>Saginaw</strong>-Midland Municipal Water Supply Corporation, 2009 IssueOn January 29, 2009, the corporation issued $5,910,000 Water Supply System RevenueRefunding Bonds, Series 2009. These bonds were issued under the provision Act 94, Public Acts <strong>of</strong>Michigan 1933, as amended, Act 233, Public Acts <strong>of</strong> Michigan, 1995, as amended, and the resolutions402
and ordinances <strong>of</strong> the <strong>Saginaw</strong>-Municipal Water Supply Corporation for the purpose <strong>of</strong> refundingcertain <strong>of</strong> the Cities’ outstanding Water Supply System Refunding Bonds, 1998 Refunding Issue. Thesebonds are payable solely from net revenues <strong>of</strong> the System.DIRECT DEBT:DatedDatePrincipalOutstandingPurposeGeneral Obligation Bonds06/27/91 Sewage Disposal (MMBA)* $2,405,00004/01/93 Sewage Disposal (MMBA)* 2,570,00004/01/93 Sewage Disposal (MMBA)* 6,080,00006/29/93 Sewage Disposal (MMBA)* 2,015,00009/30/93 Sewage Disposal (MMBA)* 3,605,00003/27/97 Sewer (MMBA)* 975,00006/25/98 Sewer 1998 (MMBA)* 4,175,00004/01/99 Sewer 1998-B (MMBA) 1 580,00006/24/99 Sewer 1999-A (MMBA) 1 10,230,00012/01/01 Sewer LT (CSO) 1,000,00009/22/05 Sewer LT (SRF) 2,970,00009/21/06 Sewer LT (SRF) 1,440,00009/20/07 Sewer LT (SRF) 4,795,000 42,840,000Revenue Bonds12/01/07 Water (New Issue) 11,100,000 11,100,000Share <strong>of</strong> County Issued Bonds*03/28/91 Drain, Weiss Street 2,779,92006/27/96 Drain, Weiss Street 1,081,080 3,861,000Share <strong>of</strong> Sag-Mid Water Corp. Bonds*2/15/98 Water Revenue Refunding 660,57712/19/02 Water Supply Corp., Refunding 4,787,21304/24/06 Water Supply Corp., Series 2006 1,278,37701/29/09 Water, Revenue Refunding, LT 3,161,257 9,887,424TOTAL DIRECT DEBT 67,688,424Less: Self-Supported Sewer Bonds* (30,890,000)Revenue Bonds (10,850,000)Share <strong>of</strong> <strong>Saginaw</strong>/Midland Water Supply (8,876,386) ($50,616,386)NET DIRECT DEBT $17,072,038OVERLAPPING DEBT:PercentNet <strong>City</strong>’sShareMunicipalityDebt Share76.61% <strong>Saginaw</strong> School District $64,950,000 $49,758,19513.58 <strong>Saginaw</strong> County 39,004,899 5,296,86513.75 <strong>Saginaw</strong> I/S/D 3,200,000 440,0006.19 Delta Community College 0 0TOTAL OVERLAPPING DEBT $55,495,060NET DIRECT & OVERLAPPING DEBT $72,567,098* Self-Supporting Bonds are sold to finance a project whose revenues will be used to pay <strong>of</strong>f the interest and principal on thatBond.403
DEBT RATIOSPer Capita 2009 State Equalized Value $23,440.88Per Capita 2009 True Cash Value $47,446.31Per Capita Net Direct Debt $583,74Per Capita Net Direct and Overlapping Debt $2,481.27Percent <strong>of</strong> Net Direct Debt <strong>of</strong> 2009 SEV 2.49%Percent <strong>of</strong> Net Direct and Overlapping <strong>of</strong> 2009 SEV 10.59%Percent <strong>of</strong> Net Direct Debt <strong>of</strong> 2009 TCV 1.23%Percent <strong>of</strong> Net Direct and Overlapping <strong>of</strong> 2009 TCV 5.23%LEGAL DEBT MARGINThe net indebtedness <strong>of</strong> the <strong>City</strong> shall not be in excess <strong>of</strong> 10% <strong>of</strong> the State Equalized Valuation<strong>of</strong> all real and personal property. Obligations which are not included in the computation <strong>of</strong> legal debtmargin are:(1) Special Assessment Bonds;(2) Mortgage Bonds;(3) Michigan Transportation Bonds;(4) Revenue Bonds;(5) Bonds issued, or contracts or assessment obligations, incurred, to comply with an order <strong>of</strong> theWater Resources Commission (now the Department <strong>of</strong> Environmental quality) or a court <strong>of</strong>competent jurisdiction;(6) Other obligations incurred for water supply, sewage, drainage or refuse disposal projectsnecessary to protect the public health by abutting pollution.Assessed valuation, December 31, 2008 $748,435,274Debt Limit (10% <strong>of</strong> SEV) $ 74,843,527Debt applicable to limit: (1) $26,040,000Less:Assets in Debt Service fundsAvailable for payment <strong>of</strong> principal 0Net Amount Subject to Legal Debt Limit 26,040,000LEGAL DEBT MARGIN AVAILABLE $48,804,000404
SCHEDULE OF BOND MATURITIES – (As <strong>of</strong> 06/30/10)GeneralObligationBondsShare <strong>of</strong>Sag-Mid WaterAuthority BondsRevenueCounty IssuedYearBondsBonds<strong>2010</strong> 4,795,000 200,000 1,113,882 819,720<strong>2011</strong> 4,920,000 200,000 1,582,258 828,6302012 5,025,000 200,000 1,600,751 837,5402013 4,495,000 200,000 1,632,978 136,6202014 4,620,000 200,000 1,672,118 139,5902015 2,040,000 200,000 1,733,417 142,5602016 2,085,000 300,000 1,801,472 145,5302017 2,130,000 300,000 704,977 02018 2,085,000 300,000 213,954 02019 2,125,000 400,000 213,954 02020 1,670,000 400,000 213,954 02021 630,000 400,000 0 02022 640,000 500,000 0 02023 550,000 500,000 0 02024 550,000 600,000 0 02025 565,000 600,000 0 02026 575,000 600,000 0 02027 380,000 700,000 0 02028 0 700,000 0 02029 0 800,000 0 02030 0 800,000 0 02031 0 900,000 0 02032 0 900,000 0 0$39,880,000 $10,900,000 $12,483,715 $3,050,190DEBT HISTORYThe <strong>City</strong> has no record <strong>of</strong> default on its obligations.FUTURE BONDING: The <strong>City</strong> does not anticipate the issuance <strong>of</strong> any additional bonds or noteswithin the next six (6) monthsSource: Bendzinski & Co.405
CAPITAL IMPROVEMENT PLAN
CITY OF SAGINAWCAPITAL IMPROVEMENT PLANOVERVIEWThe <strong>City</strong> <strong>of</strong> <strong>Saginaw</strong> annually compiles a five-year plan <strong>of</strong> Capital expenditures. The plan is a comprehensive list<strong>of</strong> major capital projects supported by the resources <strong>of</strong> the respective governmental fund groups. The processinvolves all <strong>City</strong> departments, with requested capital projects submitted first to the <strong>Budget</strong> Office for generalreview and summation, then to the <strong>City</strong> Manager for prioritization and approval.The <strong>City</strong>’s objective is to work in partnership with others to maintain, improve, and develop the <strong>City</strong>-ownedinfrastructure. The <strong>City</strong> <strong>of</strong> <strong>Saginaw</strong>’s intentions are to develop a Capital Improvement Plan that plans for andguides needed capital improvements and expenditures in a fiscally sound manner and to ensure that theseimprovements are consistent with the goals and policies <strong>of</strong> the <strong>City</strong> Council and the residents <strong>of</strong> <strong>Saginaw</strong>.The multi-year capital improvement plan alternatives and financing options are not intended to preclude othercombinations or initiatives, but rather may provide a framework within which beneficial solutions may be forged.The Capital Improvement Plan is vital to the <strong>City</strong> because it provides for equipment acquisition, enables newconstruction or upgrades <strong>of</strong> public facilities and infrastructure, and has a positive impact on the local economy. Inaddition, this plan is a necessary step in an organized effort to strengthen the quality <strong>of</strong> public facilities andservices as well as provide a framework for the realization <strong>of</strong> community goals and objectives. It also provides asound basis on which to build a healthy and vibrant community. Recognition <strong>of</strong> this importance prompted <strong>City</strong>administration to propose additions to, and finance continuation <strong>of</strong>, the existing CIP. The <strong>City</strong> anticipates severalnew projects for consideration in FY <strong>2010</strong>/<strong>2011</strong>.PROCESSThe Capital <strong>Budget</strong> Procedure follows the same preparation schedule as the Operating <strong>Budget</strong> Procedure. Thisprocess begins as the department directors evaluate capital expenditure needs and identify priorities for the <strong>City</strong>Manager’s review. The <strong>City</strong> Manager evaluates these requests and determines which capital expenditure projectshould be undertaken. The capital projects are then presented to <strong>City</strong> Council and the <strong>City</strong>’s PlanningCommission along with a capital financing strategy for review and approval. If <strong>City</strong> Council approves the actionpresented, then it is legally enacted through the passage <strong>of</strong> an ordinance.FUNDING RELATIONSHIP BETWEEN OPERATING AND CAPITAL BUDGETSThe operating budget includes expenditures that generally recur annually and are appropriated for a single year.These include personnel, utilities, pr<strong>of</strong>essional services, supplies, and maintenance costs. It provides for all cityservices, but does not result in major physical assets in the <strong>City</strong>. Major sources to fund the operating budget aregenerated in taxes, state revenue sharing monies, user fees, fines and forfeitures, intergovernmental payments,one-time revenue sources, and appropriations <strong>of</strong> undesignated fund balance.The capital budget, in contrast, usually includes one-time expenses for projects that may last more than one year.The result <strong>of</strong> these projects is physical assets in the <strong>City</strong>. Wide fluctuations are expected in the capital budgetfrom year to year depending on the phasing <strong>of</strong> projects and resources available to fund the projects. Resources forthe capital budget generally come from the issuance <strong>of</strong> General Obligation Bonds or Revenue Bonds, Federal orState aid programs, grants, or foundations, service groups, business and private donations.Regardless <strong>of</strong> the differences, the operating and capital budgets are closely linked, with the capital budget havinga direct impact on the operating budget. The operating budget assumes the cost <strong>of</strong> maintaining and operating new406
or renovated facilities that involve capital investment. In many instances, the operating budget would have to beadjusted on an ongoing basis. Capital Improvement <strong>Budget</strong>s, on the other hand, will result in decreases inmaintenance costs through the replacement or improvement <strong>of</strong> older less efficient facilities, equipment, orvehicles.The operating budget also includes debt service appropriations for the payment <strong>of</strong> long-term debt, principal,interest and related costs. The majority <strong>of</strong> the <strong>City</strong>’s capital improvement costs has been funded through theissuance <strong>of</strong> tax supported general obligation bonds, and utilities user fee supported revenue bonds, which aregenerally repaid over the useful life <strong>of</strong> the improvement being financed.It must be mentioned that there are certain funds that are legally restricted to certain types <strong>of</strong> projects. Forexample, Major and Local Street Funds, wherein revenues are derived, for the most part, from the State <strong>of</strong>Michigan Gas & Weight Tax; the Water and Sewer Operations and Maintenance Funds, wherein revenues arederived from user fees; and the Rubbish Collection Fund wherein funding is received through a combination <strong>of</strong>user fees and property taxes. [Any <strong>of</strong> these funds and other governmental funds projects may be purchased byusing cash or through a bond issuance.]Projects are considered for financing through a bond issue if they meet certain criteria. These include projects <strong>of</strong>a significant dollar amount, which is over $1 million, and a useful life exceeding the length <strong>of</strong> the bond issue.Another consideration for a capital project is to spread the annual cash requirements <strong>of</strong> a debt issue over time s<strong>of</strong>uture users share in the cost <strong>of</strong> the project.CONCLUSION:In fiscal year <strong>2010</strong>/<strong>2011</strong>, the <strong>City</strong>’s total capital budget is $58,712,657. The repair, maintenance, and addition <strong>of</strong>infrastructure in the <strong>City</strong> require long-term planning. The Capital Improvement Plan outlines each project and itsfunding source and provides a detailed record <strong>of</strong> capital requests for each <strong>of</strong> the next five fiscal years; a summary<strong>of</strong> resources, appropriations, expenditures by type, and projects by type has been provided.407
CITY OF SAGINAWCAPITAL IMPROVEMENT PLANSUMMARY OF RESOURCESFY <strong>2011</strong> - FY 2015Projected Revenues FY <strong>2011</strong> FY 2012 FY 2013 FY 2014 FY 2015 TotalGeneral Fund 1,945,200 588,420 3,430,181 766,376 297,817 7,027,994Major/Local Street 302,772 0 390,791 40,000 0 733,563Andersen Enrichment 0 32,000 38,800 0 0 70,800Boat Launch Operations 0 0 45,000 0 0 45,000Sewer Fund (user fees/bond) 1,317,000 4,725,000 1,710,000 710,000 2,135,000 10,597,000Water Fund (user fees/bond) 6,812,477 15,131,000 11,646,000 10,390,000 7,180,000 51,159,477Public Works Building 0 23,000 0 410,000 0 433,000Technical Services 4,759 60,000 50,000 0 0 114,759Motor Pool Operations 0 125,000 364,000 79,000 39,000 607,000Federal Grant 30,666,148 6,547,674 12,755,662 1,530,000 1,290,000 52,789,484State Grant 17,664,301 0 2,878,547 0 0 20,542,848Local Grants 0 0 0 120,000 40,000 160,000TOTAL RESOURCES 58,712,657 27,232,094 33,308,981 14,045,376 10,981,817 144,280,925408
CITY OF SAGINAWCAPITAL IMPROVEMENT PLANSUMMARY OF EXPENDITURES BY DEPARTMENTFY <strong>2011</strong> - FY 2015Estimated Expenditures FY <strong>2011</strong> FY 2012 FY 2013 FY 2014 FY 2015 TotalGeneral Fund 1,945,200 588,420 3,430,181 766,376 297,817 7,027,994Major/Local Streets 48,633,221 6,339,074 16,025,000 1,690,000 1,330,000 74,017,295Andersen Enrichment 0 32,000 38,800 0 0 70,800Boat Launch Operations 0 0 45,000 0 0 45,000Sewer Fund 1,317,000 4,725,000 1,710,000 710,000 2,135,000 10,597,000Water Fund 6,812,477 15,339,600 11,646,000 10,390,000 7,180,000 51,368,077Public Works Building 0 23,000 0 410,000 0 433,000Technical Services 4,759 60,000 50,000 0 0 114,759Motor Pool Operations 0 125,000 364,000 79,000 39,000 607,000TOTAL APPROPRIATIONS 58,712,657 27,232,094 33,308,981 14,045,376 10,981,817 144,280,925409
CITY OF SAGINAWCAPITAL IMPROVEMENT PLANSUMMARY OF EXPENDITURES BY TYPE AND PROJECTFY <strong>2011</strong> - FY 2015Expenditure Types FY <strong>2011</strong> FY 2012 FY 2013 FY 2014 FY 2015 TotalArchitecture/Engineering 7,100,491 1,210,000 17,060,000 4,000,000 3,980,000 33,350,491Construction/Acquisition 46,609,421 22,219,869 7,744,000 3,250,000 5,775,000 85,598,290Equipment 2,277,000 2,228,000 4,118,000 1,295,000 142,000 10,060,000Vehicles 677,500 852,225 898,181 360,376 319,817 3,108,099Land Acquisition 75,000 0 0 0 0 75,000Other 1,973,245 722,000 3,488,800 5,140,000 765,000 12,089,04558,712,657 27,232,094 33,308,981 14,045,376 10,981,817 144,280,925Project Type FY <strong>2011</strong> FY 2012 FY 2013 FY 2014 FY 2015 TotalRoutine Replacement 35,946,559 892,195 1,069,000 1,828,000 358,000 40,093,754Rehabilitation or Enhancement 16,207,628 23,247,874 29,919,800 10,265,000 10,170,000 89,810,302Efficiency Project 1,030,200 65,000 65,000 65,000 0 1,225,200New/Expansion 4,850,770 2,174,000 1,357,000 1,527,000 134,000 10,042,770Vehicles 677,500 853,025 898,181 360,376 319,817 3,108,89958,712,657 27,232,094 33,308,981 14,045,376 10,981,817 144,280,925410
CITY OF SAGINAWCAPITAL IMPROVEMENT PLAN(please note that only those items that were budgeted or has request for multiple years are reflected in the report)ManagerRequest ApprovedFuture YearsDept. Project Funding FY 11 FY 11 FY 12 FY 13 FY 14 FY 15POLICE DEPARTMENT3014 Replace Entire Ro<strong>of</strong> on Police Department GF 0 0 48,195 0 0 0If deferred: Deferred due to fiscal constraints.Operating Impact:Replacement <strong>of</strong> entire ro<strong>of</strong> due to aging and multiple temporary repairs.TOTAL PROJECT COST 48,1953014 Bullet Trap in Gun Range GF 0 0 20,000 0 0 0If deferred: Deferred due to fiscal constraints.TOTAL PROJECT COST 20,000Operating Impact:The bullet trap was originally built in 1978 and repaired in 1996. After 32 years <strong>of</strong> constant use this range must be rebuilt.3012 Police Patrol Vehicles GF 257,500 0 265,225 273,181 281,376 289,817If deferred: Deferred due to fiscal constraints.Operating Impact:Normal replacement <strong>of</strong> 10 patrol vehicles, to ensure <strong>of</strong>ficer's safety and lower repair costs.TOTAL PROJECT COST 1,367,099TOTAL POLICE DEPARTMENT1,435,294411
CITY OF SAGINAWCAPITAL IMPROVEMENT PLAN(please note that only those items that were budgeted or has request for multiple years are reflected in the report)ManagerRequest ApprovedFuture YearsDept. Project Funding FY 11 FY 11 FY 12 FY 13 FY 14 FY 15FIRE DEPARTMENT3751 Replace Ro<strong>of</strong> Fire Station #2 GF 30,000 0 0 0 0 0If deferred: Deferred due to fiscal constraints.TOTAL PROJECT COST 30,000Operating Impact:Building was re-ro<strong>of</strong>ed in the 1990's with numerous large and small patches being applied to repair leaks and weatherdamage. Ro<strong>of</strong> leaks continue to cause interior wall and ceiling damage and could lead to mold infestation.3751 Repair Heating & Cooling System Station #1 GF 26,000 0 0 0 0 0If deferred: Deferred due to fiscal constraints.TOTAL PROJECT COST 26,000Operating Impact:The installation <strong>of</strong> solid-state electronic temperature controls for the steam heat registers and cleaning system piping andradiators. During the winter months the interior environment <strong>of</strong> the station becomes untenable due to excessive heat.3751 Replace Ro<strong>of</strong> Fire Station #1 GF 15,000 0 15,000 0 0 0(2-year project)If deferred: Deferred due to fiscal constraints.TOTAL PROJECT COST 30,000Operating Impact:Building was re-ro<strong>of</strong>ed in 1992 with numerous large and small patches being applied to repair leaks and weather damagesthrough the years since. Ro<strong>of</strong> leaks continue to cause interior wall and ceiling damage and could lead to mold infestation.412
CITY OF SAGINAWCAPITAL IMPROVEMENT PLAN(please note that only those items that were budgeted or has request for multiple years are reflected in the report)ManagerRequest ApprovedFuture YearsDept. Project Funding FY 11 FY 11 FY 12 FY 13 FY 14 FY 153751 Repair and Resurface Fire Station #1 GF 35,000 0 0 0 0 0Parking AreaIf deferred: Deferred due to fiscal constraints.TOTAL PROJECT COST 35,000Operating Impact:Employee and public parking areas have been patched and cracks sealed with partial lot replacement on numerousoccasions. This facility is a polling place, a touring site for children <strong>of</strong> all ages, a civic meeting place, and an EmergencyOperations Center. Resurfacing improves safety and reduces liability.3751 Repair and Resurface Fire Station #2 GF 20,000 0 0 0 0 0Parking AreaIf deferred: Deferred due to fiscal constraints.TOTAL PROJECT COST 20,000Operating Impact:Employee and public parking areas have been patched and cracks sealed with partial lot replacement on numerousoccasions. This facility is a polling place, a touring site for children <strong>of</strong> all ages, and a civic meeting place. Resurfacingimproves safety and reduces liability.3751 Repair and Resurface Fire Station #3 GF 15,000 0 0 0 0 0Parking AreaIf deferred: Deferred due to fiscal constraints.TOTAL PROJECT COST 15,000Operating Impact:Employee and public parking areas have been patched and cracks sealed with partial lot replacement on numerousoccasions. This facility is a polling place, a touring site for children <strong>of</strong> all ages, and a civic meeting place. Resurfacingimproves safety and reduces liability.413
CITY OF SAGINAWCAPITAL IMPROVEMENT PLAN(please note that only those items that were budgeted or has request for multiple years are reflected in the report)ManagerRequest ApprovedFuture YearsDept. Project Funding FY 11 FY 11 FY 12 FY 13 FY 14 FY 153751 Repair and Resurface Fire Station #4 GF 10,000 0 0 0 0 0Parking AreaIf deferred: Deferred due to fiscal constraints.TOTAL PROJECT COST 10,000Operating Impact:Employee and public parking areas have been patched and cracks sealed with partial lot replacement on numerousoccasions. This facility is a polling place, a touring site for children <strong>of</strong> all ages as well as a civic meeting place.Resurfacing improves safety and reduces liability.3751 One Fire Pumper GF 420,000 0 0 0 0 0If deferred: Deferred due to fiscal constraints.TOTAL PROJECT COST 420,000Operating Impact:Replacement <strong>of</strong> a 1980 Ford pumper. Due to age <strong>of</strong> existing apparatus, replacement parts are not readily available andoperating expenses is high. Changes in technology have improved dependability and employee safety and reducedmunicipal liability.3751 Repair/Replace Fire Training Tower GF 51,500 0 0 0 0 0If deferred: Deferred due to fiscal constraints.TOTAL PROJECT COST 51,500Operating Impact:The Fire training tower is a focal point for multiple areas <strong>of</strong> training that has been neglected concerning repairs for manyyears. Many areas are unusable due to rotting wood, unsafe stairway supports, and rusted and fatigued metal. Thesprinkler system is inoperable and the structure is general unsafe. Fire training props are a safe, inexpensive way to trainoperations personnel and are necessary to maintain peak efficiency and performance.414
CITY OF SAGINAWCAPITAL IMPROVEMENT PLAN(please note that only those items that were budgeted or has request for multiple years are reflected in the report)ManagerRequest ApprovedFuture YearsDept. Project Funding FY 11 FY 11 FY 12 FY 13 FY 14 FY 153751 Fire Station Modification for Aerial Apparatus GF 35,000 0 0 0 0 0Station #1If deferred: Deferred due to fiscal constraints.TOTAL PROJECT COST 35,000Operating Impact:Required if a fire apparatus replacement program is authorized to accommodate reserve/new aerial ladder truckTOTAL FIRE DEPARTMENT672,500CEMETERIES1747 Pole Barn structure repair and ro<strong>of</strong> GF 0 0 0 18,000 15,000 0replacementIf deferred: Deferred due to fiscal constraints.TOTAL PROJECT COST 33,000Operating Impact:1747 Chapel ro<strong>of</strong>, ceiling, and wall repair GF 0 0 0 100,000 0 0If deferred: Deferred due to fiscal constraints.Operating Impact:Replacement <strong>of</strong> chapel ro<strong>of</strong>, ceiling and wall repairs.TOTAL PROJECT COST 100,000415
CITY OF SAGINAWCAPITAL IMPROVEMENT PLAN(please note that only those items that were budgeted or has request for multiple years are reflected in the report)ManagerRequest ApprovedFuture YearsDept. Project Funding FY 11 FY 11 FY 12 FY 13 FY 14 FY 151747 Replacement <strong>of</strong> Service Barn GF 0 0 0 0 300,000 0If deferred:Operating Impact:Deferred due to fiscal constraints.TOTAL PROJECT COST 300,0001747 Structural repairs to ro<strong>of</strong> supports GF 0 0 25,000 0 0 0If deferred:Operating Impact:Deferred due to fiscal constraints.TOTAL PROJECT COST 25,0001747 Road Repair GF 0 0 20,000 20,000 20,000 0If deferred:Operating Impact:Deferred due to fiscal constraints.TOTAL PROJECT COST 60,000TOTAL CEMETERIES518,000WATER OPERATIONS AND MAINTENANCE4740/4741 Chemical Feed Upgrade and development WF 424,529 424,529 0 0 0 300,0004741 <strong>of</strong> Water System Master PlanIf deferred:TOTAL PROJECT COST 724,529Operating Impact:Ongoing project from previous fiscal years to upgrade the Water Systems chemical feed and to develop a water systemmaster plan416
CITY OF SAGINAWCAPITAL IMPROVEMENT PLAN(please note that only those items that were budgeted or has request for multiple years are reflected in the report)ManagerRequest ApprovedFuture YearsDept. Project Funding FY 11 FY 11 FY 12 FY 13 FY 14 FY 154740 Interim Disinfections System WF 43,108 41,000 0 0 0 0If deferred:Operating Impact:New disinfections systemTOTAL PROJECT COST 41,0004740 Gratiot Ground Storage Tank Blast and WF 244,178 244,178 0 0 0 0PaintIf deferred:TOTAL PROJECT COST 244,178Operating Impact:Blast and Paint Project for Gratiot Road Storage Tank4740 Train Shed Structural Beam Repair WF 100,000 100,000 0 0 0 0If deferred:Operating Impact:Structural repair to Train Shed beam supportTOTAL PROJECT COST 100,0004740 Pressure Manhole Improvement Gatehouse WF 100,000 100,000 0 0 0 0If deferred:0 0 0 0TOTAL PROJECT COST 100,000Operating Impact:Repair to deteriorating Pressure Manhole concrete structure417
CITY OF SAGINAWCAPITAL IMPROVEMENT PLAN(please note that only those items that were budgeted or has request for multiple years are reflected in the report)ManagerRequest ApprovedFuture YearsDept. Project Funding FY 11 FY 11 FY 12 FY 13 FY 14 FY 154741 Gate House Cross Connection Mitigation WF 300,000 300,000 0 0 0 0If deferred:Operating Impact:Gatehouse cross connection issue <strong>of</strong> concern.TOTAL PROJECT COST 300,0004741 Kochville Piping Corrosion Repairs WF 100,000 100,000 0 0 0 0If deferred:Operating Impact:Engineering evaluation/design and subsequent construction for mitigation.TOTAL PROJECT COST 100,0004741 36" Water Main Loop Center to Davis Rd. WF 1,400,000 1,400,000 6,600,000 0 0 0MainsIf deferred:TOTAL PROJECT COST 1,400,000Operating Impact:Hydraulic modeling and system operation indicates a loop is required to address redundancy, hydraulic andpressure problems related to these mains.4741 Kochville Padmount B/U Power Generator WF 700,000 700,000 0 0 0 0If deferred:Operating Impact:Backup generator at Whitestone Pointer the Kochville Raw Water Storage ReservoirsTOTAL PROJECT COST 700,000418
CITY OF SAGINAWCAPITAL IMPROVEMENT PLAN(please note that only those items that were budgeted or has request for multiple years are reflected in the report)ManagerRequest ApprovedFuture YearsDept. Project Funding FY 11 FY 11 FY 12 FY 13 FY 14 FY 154741/4740 Portable Generator and connections at 4 WF 200,000 200,000 0 0 0 0remote stationsIf deferred:TOTAL PROJECT COST 200,000Operating Impact:Backup generator connections at 4 remote stations4741 Storage Building WTP WF 100,000 100,000 0 0 0 0If deferred:Operating Impact:Vehicle and equipment storage building due to limited storage capacity with existing facilitiesTOTAL PROJECT COST 100,0004741 Security System Upgrades WF 2,435,662 2,435,622 0 0 0 0If deferred:Operating Impact:Security Systems UpgradesTOTAL PROJECT COST 2,435,6224741 New Booster Station Property WF 75,000 75,000 0 0 0 0If deferred:Operating Impact:New station property if purchase required due to location requirements.TOTAL PROJECT COST 75,000419
CITY OF SAGINAWCAPITAL IMPROVEMENT PLAN(please note that only those items that were budgeted or has request for multiple years are reflected in the report)ManagerRequest ApprovedFuture YearsDept. Project Funding FY 11 FY 11 FY 12 FY 13 FY 14 FY 154740 Northern Pumping Station Improvements WF 0 0 300,000 0 0 0If deferred:Deferred due to fiscal constraints. TOTAL PROJECT COST 300,000Operating Impact:Engineering design and construction administration as required for new station construction ormodifications to existing station as determined by final master plan4741 WTP Window Replacement WF 0 0 500,000 0 0 0If deferred:Operating Impact:Window replacements as necessary from evaluationsTOTAL PROJECT COST 500,0004741 Finished Water Reservoir Improvements WF 0 0 170,000 680,000 0 0If deferred:TOTAL PROJECT COST 850,000Operating Impact:Improvements related to finished water reservoirs as recommended by Sanitary Survey and ConsultingEngineers4740/4741 36" Finished Transmission Main Analysis WF 0 0 750,000 2,500,000 0 0and RepairsIf deferred:TOTAL PROJECT COST 3,250,000Operating Impact:Condition analysis including engineering, pr<strong>of</strong>essional services, and subsequent construction for 36"finished water transmission main repair/replacement420
CITY OF SAGINAWCAPITAL IMPROVEMENT PLAN(please note that only those items that were budgeted or has request for multiple years are reflected in the report)ManagerRequest ApprovedFuture YearsDept. Project Funding FY 11 FY 11 FY 12 FY 13 FY 14 FY 154740/4741 Kochville Reservoir/Boosting Station WF 0 0 260,000 1,040,000 0 0ImprovementsIf deferred:TOTAL PROJECT COST 1,300,000Operating Impact:Improvements indicated by the master plan for blending raw water, smaller raw water pump with VFD,update sample pumps and bulbler systems, and masonry repairs to façade4741 Diesel Generators/Elevated Storage WF 0 0 0 200,000 4,000,000 0Analysis and ConstructionIf deferred:TOTAL PROJECT COST 4,200,000Operating Impact:4740 Reese and Frankenmuth Station Upgrades WF 0 0 60,000 60,000 240,000 0If deferred:Operating Impact:Upgrades as necessary for upgrades to meet peak flow demands and fireflowsTOTAL PROJECT COST 360,0004740/4741 Sedimentation & Sludge Collection WF 0 0 0 270,000 1,350,000 0System UpgradesIf deferred:TOTAL PROJECT COST 1,620,000Operating Impact:Plate settlers for improved sedimentation processes and sludge removal system improvements421
CITY OF SAGINAWCAPITAL IMPROVEMENT PLAN(please note that only those items that were budgeted or has request for multiple years are reflected in the report)ManagerRequest ApprovedFuture YearsDept. Project Funding FY 11 FY 11 FY 12 FY 13 FY 14 FY 154740/4741 High Service Pump Station Improvements WF 0 0 0 320,000 1,390,000 440,000If deferred:TOTAL PROJECT COST 2,150,000Operating Impact:Improvements to HS pump room, replace HSP #6 elbow, provide ground level access to pumps and repairWashington Valve Vault4740 Replacement Raw Water Meters WF 0 0 0 0 20,000 0If deferred:Operating Impact:Replacement <strong>of</strong> worn raw water meter equipment at WTPTOTAL PROJECT COST 20,0004740 Replacement <strong>of</strong> Screen Room Overhead WF 0 0 0 0 0 20,000CraneIf deferred:TOTAL PROJECT COST 20,000Operating Impact:4741 Station Modifications - Portable Generator WF 100,000 100,000 0 0 0 0ConnectionsIf deferred:TOTAL PROJECT COST 100,000Operating Impact:Required station modification for connections at remote station locations422
CITY OF SAGINAWCAPITAL IMPROVEMENT PLAN(please note that only those items that were budgeted or has request for multiple years are reflected in the report)ManagerRequest ApprovedFuture YearsDept. Project Funding FY 11 FY 11 FY 12 FY 13 FY 14 FY 154740 36" Transmission Main Condition Analysis WF 20,000 20,000 0 0 0 0If deferred:Operating Impact:Non destructive condition analysis <strong>of</strong> 12 miles, 36" precast lined concrete cylinder pipeTOTAL PROJECT COST 20,0004740 WTP Window & Masonry Evaluation and WF 80,000 80,000 0 0 0 0DesignIf deferred:TOTAL PROJECT COST 80,000Operating Impact:Evaluation and design as needed for necessary window improvements to the WTP buildings4740 WTP Vehicle and Equipment Storage Building WF 80,000 80,000 0 0 0 0If deferred:Operating Impact:TOTAL PROJECT COST 80,0004740 WTP Parking Lot Improvements WF 20,000 20,000 80,000 0 0 0If deferred:Operating Impact:Evaluation <strong>of</strong> parking area asphalt condition and designTOTAL PROJECT COST 20,000423
CITY OF SAGINAWCAPITAL IMPROVEMENT PLAN(please note that only those items that were budgeted or has request for multiple years are reflected in the report)ManagerRequest ApprovedFuture YearsDept. Project Funding FY 11 FY 11 FY 12 FY 13 FY 14 FY 154740 Settling Basin Sludge Collector Drive Chain WF 40,000 40,000 0 0 0 0If deferred:Operating Impact:TOTAL PROJECT COST 40,0004740 Bloomfield/Reese Pump Station Network WF 40,000 40,000 0 0 0 0ConnectIf deferred:TOTAL PROJECT COST 40,000Operating Impact:Addition <strong>of</strong> SCADA radio communication between <strong>Saginaw</strong> Water Plant and the Bloomfield/ReesePumping station for system monitoring4740 Frankenmuth Pump Station Network WF 40,000 50,000 0 0 0 0ConnectIf deferred:TOTAL PROJECT COST 50,000Operating Impact:Addition <strong>of</strong> SCADA radio communication between <strong>Saginaw</strong> Water Plant and the Frankenmuth Pumpingstation for system monitoring4740 Freeland Pump Station Network WF 30,000 30,000 0 0 0 0ConnectIf deferred:TOTAL PROJECT COST 30,000Operating Impact:Addition <strong>of</strong> SCADA radio communication between <strong>Saginaw</strong> Water Plant and the Freeland Pumping stationfor system monitoring424
CITY OF SAGINAWCAPITAL IMPROVEMENT PLAN(please note that only those items that were budgeted or has request for multiple years are reflected in the report)ManagerRequest ApprovedFuture YearsDept. Project Funding FY 11 FY 11 FY 12 FY 13 FY 14 FY 154740 Card Access at Aqua, Gratiot, and Kochville WF 40,000 40,000 0 0 0 0If deferred:Operating Impact:Addition <strong>of</strong> a card door access system at above listed locationsTOTAL PROJECT COST 40,0004741 East Genesee Streetscape WF 0 0 1,300,000 0 0 0If deferred:Operating Impact:Replacement <strong>of</strong> an 1890's ear water main with streetscape projectTOTAL PROJECT COST 1,300,0004741 Woodbridge Water main WF 0 0 671,000 0 0 0If deferred:Operating Impact:Replace water main in conjunction with road reconstructionTOTAL PROJECT COST 671,0004741 Court Street Water main WF 0 0 0 781,000 0 0If deferred:Operating Impact:Replace early 1900's water main with road projectTOTAL PROJECT COST 781,000425
CITY OF SAGINAWCAPITAL IMPROVEMENT PLAN(please note that only those items that were budgeted or has request for multiple years are reflected in the report)ManagerRequest ApprovedFuture YearsDept. Project Funding FY 11 FY 11 FY 12 FY 13 FY 14 FY 154741 Electrical Power Improvements WF 0 0 0 0 0 1,700,000If deferred:Operating Impact:Electrical improvements to WTP switchgear and electrical supply due to old age and master planTOTAL PROJECT COST 1,700,0004741 Reese/Frankenmuth Station Upgrades/ WF 0 0 60,000 60,000 240,000 0EvaluationsIf deferred:TOTAL PROJECT COST 360,000Operating Impact:Upgrades as necessary to meet peak flow demands and fireflows as indicated4741 Engineering 36" Water main Loop Center WF 0 0 1,400,000 0 0 0to Davis RoadIf deferred:TOTAL PROJECT COST 1,400,000Operating Impact:Engineering for a loop to the transmission mains in Center and Davis Roads4741 Michigan Avenue Water main WF 0 0 0 1,600,000 1,600,000 0ConnectIf deferred:TOTAL PROJECT COST 3,200,000Operating Impact:Replace 10" water main that is 150 years old with a couple blocks consisting <strong>of</strong> AC piping426
CITY OF SAGINAWCAPITAL IMPROVEMENT PLAN(please note that only those items that were budgeted or has request for multiple years are reflected in the report)ManagerRequest ApprovedFuture YearsDept. Project Funding FY 11 FY 11 FY 12 FY 13 FY 14 FY 154741 Hamilton Street Water main WF 0 0 0 0 530,000 0If deferred:Operating Impact:Replace deteriorating water main with road projectTOTAL PROJECT COST 530,0004741 Second Street Relocate 24" Water main WF 0 0 0 350,000 0 0If deferred:Operating Impact:Relocate 24" transmission main due to vacating <strong>of</strong> Second AvenueTOTAL PROJECT COST 350,0004741 Genesee Avenue Water main WF 0 0 0 0 1,800,000 0If deferred:Operating Impact:Replace 1900's era water main in conjunction with road projectTOTAL PROJECT COST 1,800,000TOTAL WATER OPERATIONS AND MAINTENANCE33,682,329427
CITY OF SAGINAWCAPITAL IMPROVEMENT PLAN(please note that only those items that were budgeted or has request for multiple years are reflected in the report)ManagerRequest ApprovedFuture YearsDept. Project Funding FY 11 FY 11 FY 12 FY 13 FY 14 FY 15SEWER OPERATIONS AND MAINTENANCE4840 Replace Ro<strong>of</strong> at Retention Treatment Basins SF 25,000 25,000 25,000 25,000 25,000 25,000If deferred:Operating Impact:Replace un-repairable ro<strong>of</strong>s at the retention treatment basinsTOTAL PROJECT COST 125,0004840 Replace Sodium Hypochlorite Feed Pumps SF 25,000 25,000 25,000 25,000 25,000 25,000at RTBsIf deferred:TOTAL PROJECT COST 125,000Operating Impact:Replacement <strong>of</strong> the sodium hypochlorite feed pumps4840 Final Settling Tank Substructure Replacement SF 100,000 0 100,000 100,000 0 0If deferred:Operating Impact:TOTAL PROJECT COST 200,0004840 Update Plant Heating System SF 125,000 125,000 0 0 0 0If deferred:Operating Impact:Replace 60 year old boiler for WWTP operations buildingTOTAL PROJECT COST 125,000428
CITY OF SAGINAWCAPITAL IMPROVEMENT PLAN(please note that only those items that were budgeted or has request for multiple years are reflected in the report)ManagerRequest ApprovedFuture YearsDept. Project Funding FY 11 FY 11 FY 12 FY 13 FY 14 FY 154840 Replace Primary Settling Tank Weirs and SF 30,000 50,000 30,000 30,000 30,000 0Baffles (1 each year)If deferred:TOTAL PROJECT COST 140,000Operating Impact:4840 Accusonic flow meter replacement/repair SF 70,000 70,000 75,000 80,000 80,000 85,000(Remote Facilities)If deferred:TOTAL PROJECT COST 390,000Operating Impact:Repair and replace where necessary the accusonic flow meters at the 7 rtbs4840 Engineering Services for Influent Bar Screen SF 100,000 0 0 0 0 0ReplacementIf deferred:TOTAL PROJECT COST 100,000Operating Impact:4830 Replace Influent diversion gate SF 20,000 20,000 20,000 0 0 0MainsIf deferred:TOTAL PROJECT COST 40,000Operating Impact:Replace 60 year old influent flow diversion gates429
CITY OF SAGINAWCAPITAL IMPROVEMENT PLAN(please note that only those items that were budgeted or has request for multiple years are reflected in the report)ManagerRequest ApprovedFuture YearsDept. Project Funding FY 11 FY 11 FY 12 FY 13 FY 14 FY 154840 Aerator Replacement SF 325,000 0 0 0 0If deferred:Operating Impact:TOTAL PROJECT COST 325,0004840 Structural Repairs - Aeration Tanks SF 400,000 400,000 0 0 0 0If deferred:Operating Impact:TOTAL PROJECT COST 400,0004840 Lift and Storm Station Tower Installation SF 27,000 27,000 0 0 0 0If deferred:Operating Impact:Purchase and installation <strong>of</strong> 6 monopoles for the lift and storm station SCADA networkTOTAL PROJECT COST 27,0004741 Replacement <strong>of</strong> WWT SCADA Computers SF 20,000 20,000 0 0 0 0If deferred:Operating Impact:Replacement <strong>of</strong> WWT and CSO Basin SCADA computersTOTAL PROJECT COST 20,000430
CITY OF SAGINAWCAPITAL IMPROVEMENT PLAN(please note that only those items that were budgeted or has request for multiple years are reflected in the report)ManagerRequest ApprovedFuture YearsDept. Project Funding FY 11 FY 11 FY 12 FY 13 FY 14 FY 154840/4741 Radio Read Upgrade SF 0 0 400,000 550,000 550,000 0WF 0 0 400,000 550,000 550,000 0If deferred:TOTAL PROJECT COST 1,500,000Operating Impact:Upgrade water/sewer meter reading system to fixed base network4841 E. Genesee Avenue Sewers SF 0 0 0 0 0 2,000,000If deferred:Operating Impact:Reline main sewers with road projectTOTAL PROJECT COST 2,000,0004840 Replace 13 year old Vactor jet SF 0 0 450,000 0 0 0If deferred:Operating Impact:TOTAL PROJECT COST 450,0004840 East Genesee Streetscape SF 0 0 1,500,000 0 0 0If deferred:Operating Impact:Replacement <strong>of</strong> an elliptical double brick sewer installed in the 1860'sTOTAL PROJECT COST 1,500,000431
CITY OF SAGINAWCAPITAL IMPROVEMENT PLAN(please note that only those items that were budgeted or has request for multiple years are reflected in the report)ManagerRequest ApprovedFuture YearsDept. Project Funding FY 11 FY 11 FY 12 FY 13 FY 14 FY 154840 Woodbridge Sewer SF 0 0 550,000 0 0 0If deferred:Operating Impact:Replacement <strong>of</strong> a structurally deficient sewer mainline with road reconstructionTOTAL PROJECT COST 550,0004841 Court Street Sewer SF 0 0 600,000 0 0 0If deferred:Operating Impact:Reline existing mainline sewer with road projectTOTAL PROJECT COST 600,0004840/4741 Replace 3 tandem dumps w/front plow WF 0 0 0 150,000 0 0and hitch SF 0 0 0 150,000 0 0If deferred:TOTAL PROJECT COST 300,000Operating Impact:TOTAL SEWER OPERATIONS AND MAINTENANCE8,917,000MOTOR POOL OPERATIONS4480 Facilities Maintenance Chevy Cab Utilities MP 0 0 45,000 45,000 45,000 0Truck(BGM)If deferred: Deferred due to fiscal constraintsTOTAL PROJECT COST 135,000Operating Impact:Purchase 3500 series utility maintenance truck for the Building and Grounds Maintenance Division432
CITY OF SAGINAWCAPITAL IMPROVEMENT PLAN(please note that only those items that were budgeted or has request for multiple years are reflected in the report)ManagerRequest ApprovedFuture YearsDept. Project Funding FY 11 FY 11 FY 12 FY 13 FY 14 FY 154480 Facilities Maintenance Chevy 3/4 Ton 4x4 MP 0 0 32,000 32,000 34,000 0(BGM)If deferred: Deferred due to fiscal constraintsTOTAL PROJECT COST 98,000Operating Impact:Vehicle use by Building and Ground Maintenance to haul and tow trailers4480 Facility Maintenance Case Loader MP 0 0 0 38,000 0 0(BGM)If deferred: Deferred due to fiscal constraintsTOTAL PROJECT COST 38,000Operating Impact:New loader need to install and remove two sets <strong>of</strong> floating docks and for installing fencing4480 New Snow mobile MP 0 0 0 130,000 0 0(BGM)If deferred: Deferred due to fiscal constraintsTOTAL PROJECT COST 130,000Operating Impact:4480 Backhoe MP 0 0 0 50,000 0 0(BGM)If deferred: Deferred due to fiscal constraintsTOTAL PROJECT COST 50,000Operating Impact:433
CITY OF SAGINAWCAPITAL IMPROVEMENT PLAN(please note that only those items that were budgeted or has request for multiple years are reflected in the report)ManagerRequest ApprovedFuture YearsDept. Project Funding FY 11 FY 11 FY 12 FY 13 FY 14 FY 154480 4x4 Pickup Truck Heavy Duty MP 0 0 30,000 60,000 0 30,000(BGM)If deferred: Deferred due to fiscal constraintsTOTAL PROJECT COST 120,000Operating Impact:4480 Utility Tractor (Diesel) MP 0 0 18,000 9,000 0 9,000(WAB)If deferred: Deferred due to fiscal constraintsTOTAL PROJECT COST 36,000Operating Impact:TOTAL MOTOR POOL OPERATIONS607,000ENGINEERING & TRAFFIC ENGINEERINGEngineering East Genesee Avenue Reconstruction and FED 0 0 3,194,074 0 0 0Streetscape WF 0 0 1,120,000 0 0 0SF 0 0 1,000,000 0 0 0If deferred:TOTAL PROJECT COST 5,314,074Operating Impact:Road reconstruction and streetscape amenities on from Franklin Street to Janes Avenue434
CITY OF SAGINAWCAPITAL IMPROVEMENT PLAN(please note that only those items that were budgeted or has request for multiple years are reflected in the report)ManagerRequest ApprovedFuture YearsDept. Project Funding FY 11 FY 11 FY 12 FY 13 FY 14 FY 15Engineering Woodbridge Street - Houghton to Davenport FED 0 0 840,000 0 0 0WF 0 0 608,600 0 0 0SF 0 0 550,000 0 0 0If deferred:TOTAL PROJECT COST 1,998,600Operating Impact:Reconstruction and utility replacement on Woodbridget from Houghton to DavenportEngineering Court Street resurfacing and water main FED 0 0 1,304,000 0 0 0replacement WF 0 0 1,036,000 0 0 0If deferred:TOTAL PROJECT COST 2,340,000Operating Impact:Court Street resurfacing and ADA ramp installation from Court Street Bridge to Bay RoadEngineering Michigan Avenue resurfacing and water main FED 0 0 56,000 1,620,000 0 0replacement WF 0 0 84,000 3,235,000 0 0If deferred:TOTAL PROJECT COST 4,995,000Operating Impact:Michigan Avenue resurfacing and ADA ramp installation from Stephens to State StreetEngineering East Genesee at Hess Street FED 0 0 236,000 0 0 0MSF 0 0 59,000 0 0 0If deferred:TOTAL PROJECT COST 295,000Operating Impact:Upgrade existing signal to box span signal with new pedestrian crossing signals and install sidewalks andramps where required435
CITY OF SAGINAWCAPITAL IMPROVEMENT PLAN(please note that only those items that were budgeted or has request for multiple years are reflected in the report)ManagerRequest ApprovedFuture YearsDept. Project Funding FY 11 FY 11 FY 12 FY 13 FY 14 FY 15Engineering M-13 Hess to M-46 FED 6,000,000 0 0 0 0 0WF 50,000 0 0 0 0 0SF 50,000 0 0 0 0 0If deferred:TOTAL PROJECT COST 6,100,000Operating Impact:Reconstruction on M-13 from Hess to M-46, to include sanitary, storm and water main replacementEngineering Bay Street from Court Street to Genesee FED 0 0 400,000 0 0 0AvenueIf deferred:TOTAL PROJECT COST 400,000Operating Impact:Add center turn lane on Bay Street from Court Street to Genesee AvenueEngineering CDBG Ramps FED 0 50,000 50,000 50,000 50,000 50,000If deferred:Operating Impact:Reconstruction <strong>of</strong> existing intersection ramps to make ADA compliantTOTAL PROJECT COST 250,000Engineering CDBG Resurfacing FED 150,000 150,000 200,000 200,000 200,000 200,000If deferred:Operating Impact:Resurfacing over 270 miles <strong>of</strong> major and local streets as well as ADA ramp improvementsTOTAL PROJECT COST 950,000436
CITY OF SAGINAWCAPITAL IMPROVEMENT PLAN(please note that only those items that were budgeted or has request for multiple years are reflected in the report)ManagerRequest ApprovedFuture YearsDept. Project Funding FY 11 FY 11 FY 12 FY 13 FY 14 FY 15Engineering Ezra Rust from M-13 to Court Street FED 0 0 0 0 560,000 0Bridge WF 0 0 0 0 740,000 0If deferred:TOTAL PROJECT COST 1,300,000Operating Impact:Remove and replace curb and gutters as well as mill and pave existing roadwayEngineering Fordney Street from M-46 to Ezra Rust FED 0 0 0 0 640,000 0WF 0 0 0 0 660,000 0If deferred:TOTAL PROJECT COST 1,300,000Operating Impact:Reconstruct existing roadway with three lane concrete pavement, replace existing water main and servicesEngineering East Genesee - Harold to Hess FED 0 0 0 40,000 0 440,000WF 0 0 0 60,000 0 1,690,000If deferred:TOTAL PROJECT COST 2,230,000Operating Impact:Mill and pave with 2" asphalt, ADA ramp improvements, and replace water mainsEngineering East Genesee - Harold to Hess FED 0 0 0 0 0 440,000WF 0 0 0 0 0 1,210,000If deferred:TOTAL PROJECT COST 1,650,000Operating Impact:Mill and pave with 2" asphalt, ADA ramp improvements, and replace water mains437
CITY OF SAGINAWCAPITAL IMPROVEMENT PLAN(please note that only those items that were budgeted or has request for multiple years are reflected in the report)ManagerRequest ApprovedFuture YearsDept. Project Funding FY 11 FY 11 FY 12 FY 13 FY 14 FY 15Engineering Weiss Street at Hermansau Street Signal FED 0 0 0 0 0 160,000Installation and left turn lane LOC 0 0 0 0 0 40,000If deferred:TOTAL PROJECT COST 200,000Operating Impact:Install left turn lane on Hermansau at Weiss and add traffic signals at intersectionEngineering Treanor Street from Williamson to Dixie FED 0 0 0 0 640,000 0Highway LOC 0 0 0 0 120,000 0MSF 0 0 0 0 40,000 0If deferred:TOTAL PROJECT COST 800,000Operating Impact:Crush and shape asphalt pavingEngineering Niagara Street from railroad tracks to FED 0 0 0 0 80,000 0Davenport WF 0 0 0 0 90,000 0If deferred:TOTAL PROJECT COST 170,000Operating Impact:Reconstruction and water main replacementEngineering EECBG and Clean Energy Coalition FED 1,030,200 1,030,200 0 0 0 0If deferred:Operating Impact:ARRA project to improve <strong>City</strong> facilitiesTOTAL PROJECT COST 1,030,200438
CITY OF SAGINAWCAPITAL IMPROVEMENT PLAN(please note that only those items that were budgeted or has request for multiple years are reflected in the report)ManagerRequest ApprovedFuture YearsDept. Project Funding FY 11 FY 11 FY 12 FY 13 FY 14 FY 15Engineering Interchange at I-675 and Warren Avenue FED 0 0 0 9,304,986 0 0STA 0 0 0 2,594,842 0 0MSF 0 0 0 350,262 0 0If deferred:TOTAL PROJECT COST 12,250,090Operating Impact:Reconstruction <strong>of</strong> existing bridges at Fifth and Sixth Street on I-675 as well as the installation <strong>of</strong> newramps at Fitzhugh and Wadsworth, and removal <strong>of</strong> roadways at 2nd and Weadock for installation <strong>of</strong> rampsEngineering Interchange at I-675 at Veteran Memorial FED 0 0 170,000 1,540,766 0 0Parkway STA 0 0 0 283,705 0 0MSF 0 0 0 40,529 0 0If deferred:TOTAL PROJECT COST 2,035,000Operating Impact:Deck replacement, substructure repairs, paint and approach work on Veteran Memorial ParkwayEngineering I-675 Ramp throughout <strong>City</strong> limits FED 3,240,458 3,240,458 0 0 0 0STA 360,051 360,051 0 0 0 0MSF 15,002 15,002 0 0 0 0If deferred:TOTAL PROJECT COST 3,615,511Operating Impact:Joint repairs, patches, overlay, and shoulders along I-675439
CITY OF SAGINAWCAPITAL IMPROVEMENT PLAN(please note that only those items that were budgeted or has request for multiple years are reflected in the report)ManagerRequest ApprovedFuture YearsDept. Project Funding FY 11 FY 11 FY 12 FY 13 FY 14 FY 15Engineering I-675 North and South Bound Lighting FED 2,172,000 2,172,000 0 0 0 0MSF 9,300 9,300 0 0 0 0If deferred:TOTAL PROJECT COST 2,181,300Operating Impact:Upgrade freeway lighting on I-675Engineering I-675 over Michigan Avenue FED 1,749,440 1,749,440 0 0 0 0MSF 8,470 8,470 0 0 0 0If deferred:TOTAL PROJECT COST 1,757,910Operating Impact:Deck patching, replace joints, partial paint, pier repair, pin and hanger replacement on I-675Engineering I-675 throughout <strong>City</strong> limits FED 14,653,500 14,653,500 0 0 0 0MSF 180,000 180,000 0 0 0 0If deferred:TOTAL PROJECT COST 14,833,500Operating Impact:Deep concrete overlay, pin and Hanger replacement, zone painting, deck facia repair, substructure repairs,slope paving repairs, barrier wall repair, beam end repairs, pedestrian fence, concrete surface sealers, andapproach workEngineering I-675 Bridge replacement - 21st and 11th FED 1,639,000 1,639,000 0 0 0 0street pedestrian bridge MSF 20,000 20,000 0 0 0 0If deferred:Operating Impact: TOTAL PROJECT COST 1,659,000Replace existing pedestrian bridge at 21st and removal <strong>of</strong> existing bridge at 11th Street over I-675440
CITY OF SAGINAWCAPITAL IMPROVEMENT PLAN(please note that only those items that were budgeted or has request for multiple years are reflected in the report)ManagerRequest ApprovedFuture YearsDept. Project Funding FY 11 FY 11 FY 12 FY 13 FY 14 FY 15Engineering I-675 Bridge replacement over river, M-13, FED 18,316,000 0 0 0 0 0railroad, and east bound ramp MSF 70,000 0 0 0 0 0If deferred:TOTAL PROJECT COST 18,386,000Operating Impact:Miscellaneous bridge workTOTAL ENGINEERING AND TRAFFIC88,041,185PARKS AND FACILITIES7540 Site Improvement AND 0 0 0 38,800 0 0If deferred:Operating Impact:Deferred due to fiscal constraints.TOTAL PROJECT COST 38,8007540 Repave Parking Lot AND 0 0 32,000 0 0 0If deferred:Operating Impact:TOTAL PROJECT COST 32,0007575 1420 Series II w/Deck GF 0 0 36,000 38,000 17,000 0If deferred:Operating Impact:Two trim mowersTOTAL PROJECT COST 91,000441
CITY OF SAGINAWCAPITAL IMPROVEMENT PLAN(please note that only those items that were budgeted or has request for multiple years are reflected in the report)ManagerRequest ApprovedFuture YearsDept. Project Funding FY 11 FY 11 FY 12 FY 13 FY 14 FY 157575 <strong>City</strong> Hall HVAC GF 0 0 0 2,685,000 0 0If deferred:TOTAL PROJECT COST 2,685,000Operating Impact:<strong>City</strong> Hall twin gas boilers were installed in 1979 and 1980 to heat the building. Both boilers have reached their life spanand dependability. With the replacement <strong>of</strong> the steam heating system to an HVAC ro<strong>of</strong> top system the building will bemore dependable, uniformed heating and cooling for each floor.7575 <strong>City</strong> Hall Energy Efficient Windows GF 0 0 65,000 65,000 65,000 0If deferred:TOTAL PROJECT COST 195,000Operating Impact:The windows in <strong>City</strong> Hall are single pane glass and are over 60 plus years old. They provide very poor insulation and arecausing massive heat loss. With the purchase <strong>of</strong> new energy efficient windows thousands <strong>of</strong> dollars will be saved in utilitycosts for years to come.7575 <strong>City</strong> Hall New Ro<strong>of</strong> GF 0 0 0 135,000 0 0If deferred:Operating Impact:New Ro<strong>of</strong> for <strong>City</strong> HallTOTAL PROJECT COST 135,0004439 PSB Ro<strong>of</strong> Replacement PWB 0 0 23,000 0 0 0If deferred:Operating Impact:Repair Ro<strong>of</strong> at Public Services BuildingTOTAL PROJECT COST 23,000442
CITY OF SAGINAWCAPITAL IMPROVEMENT PLAN(please note that only those items that were budgeted or has request for multiple years are reflected in the report)ManagerRequest ApprovedFuture YearsDept. Project Funding FY 11 FY 11 FY 12 FY 13 FY 14 FY 157575 <strong>City</strong> Hall Heater Units GF 0 0 0 0 210,000 0If deferred:Operating Impact:Replace five ro<strong>of</strong> top heater units at <strong>City</strong> HallTOTAL PROJECT COST 210,0007575/7571 Weed Abatement - Flail Mower TRF - 75c GF 0 0 16,000 8,000 0 8,000If deferred:Operating Impact:Weed cutting lawn mowerTOTAL PROJECT COST 32,0007546 Rust Street Boat Launch Repairs BL 0 0 0 45,000 0 0If deferred:TOTAL PROJECT COST 45,000Operating Impact:Upgrade boating access to the <strong>Saginaw</strong> River to include handicap access, redesign parking lot, and repair docks4439 Employee Parking Lot Re-pavement PWB 0 0 0 200,000 0 0If deferred:Operating Impact:TOTAL PROJECT COST 200,000443
CITY OF SAGINAWCAPITAL IMPROVEMENT PLAN(please note that only those items that were budgeted or has request for multiple years are reflected in the report)ManagerRequest ApprovedFuture YearsDept. Project Funding FY 11 FY 11 FY 12 FY 13 FY 14 FY 157575 580D Wing Mower (TORO) GF 0 0 68,000 68,000 68,000 0If deferred:Operating Impact:Purchase <strong>of</strong> three mowersTOTAL PROJECT COST 204,000TOTAL PARKS AND FACILITIES3,890,800TECHNICAL SERVICES1720 Switch/Firewall Replacement TE 4,759 4,759 60,000 50,000 0 0If deferred: Deferred due to fiscal constraints.Operating Impact:Replacement <strong>of</strong> multiple switches and firewallsTOTAL PROJECT COST 114,7591711 Mounted Projector/Screen TE 0 0 10,000 20,000 0 0If deferred:Operating Impact:Deferred due to fiscal constraints.TOTAL PROJECT COST 30,000TOTAL TECHNICAL SERVICES144,759444
CITY OF SAGINAWCOMMUNITY PROFILE<strong>2010</strong> – <strong>2011</strong>
RELIVE THE HISTORY OF SAGINAWThe Castle Museum has been owned and operated by theHistorical Society <strong>of</strong> <strong>Saginaw</strong> County since 1992. Throughexploration, preservation, and presentation, the continuingstory <strong>of</strong> the people <strong>of</strong> <strong>Saginaw</strong> is told. The operatingmuseum in the Castle is a unique architectural gem, listed onthe National Register <strong>of</strong> Historic Places. Built as a federalpost <strong>of</strong>fice in 1898, it reflects the French heritage <strong>of</strong> early<strong>Saginaw</strong>. The Castle provides a full spectrum <strong>of</strong> museumactivities such as changing and traveling exhibitions,educational programs, film presentations, publications, andresearch services.<strong>Saginaw</strong> Art Museum totals more than 15,000 square feet.Amidst ongoing exhibitions and events, some <strong>of</strong> themuseum’s permanent collection includes 19 th and 20 thcentury American and European artists, Civil War-erasculptural groups, the work <strong>of</strong> Eanger Irving Couse(considered <strong>Saginaw</strong>’s most famous artist), and an Asian artcollection, including the celebration <strong>of</strong> <strong>Saginaw</strong>’s Sister <strong>City</strong>relationship with Tokushima, Japan. The home is thefoundation and the grandest piece <strong>of</strong> the museum’spermanent collection.Temple Theater was built by the Elf Khurafeh Shrine andopened its doors on July 28, 1927. At that time, it was thelargest theater in Michigan outside <strong>of</strong> the Detroit area,seating 2,196. Featured Big Bands were Duke Ellington aswell as <strong>Saginaw</strong>’s own Eddy Band, which still plays some <strong>of</strong>its concerts at the Temple. The Temple Theatre introducedmajor blockbusters <strong>of</strong> the time, such as Casablanca and GoneWith The Wind to <strong>Saginaw</strong>. Following WWII, wide-screenproductions such as “Cinemascope” required majorrenovation, which was undertaken in 1953.446
RELIVE CELEBRATIONS SQUAREOjibway Island, named after the Ojibwa (Chippewa)natives, is a wonderful, shaded get-a-away for riversidewalks, biking, family outings, concerts, and celebrations.The WKCQ Country Fest and Cinco de Mayo takes placehere annually. Ojibway Island is also host to the best view intown for the stunning 4 th <strong>of</strong> July fireworks display each year.Japanese Cultural Center & Tea Garden, comprised <strong>of</strong>the teahouse and garden, was established as a symbol <strong>of</strong>friendship and cultural exchange with <strong>Saginaw</strong>’s Sister <strong>City</strong>,Tokushima, Japan. The teahouse is <strong>of</strong> authentic design andrepresents traditional Japanese architecture. The teahouseprovides a ceremonial setting for the tea ceremony (Chado),promoting the concept <strong>of</strong> global and international harmony,respect, purity, and tranquility, and expressing “Peacethrough a bowl <strong>of</strong> tea”. The scenic gardens are open yearround,providing the perfect setting for wedding ceremonies.Children’s Zoo in Celebration Square is not just home tobobcats, alligators, macaws, bald eagles, or cotton-toptamarins, but also to volunteers, interns, and sponsors thathelp to provide an exiting zoo atmosphere. Throw anawesome birthday party in the Party Pavilion. Take a classfield trip and learn fun animal facts in the Amphitheater. Getcreative with the Adopt-a-Garden program. You can evenbring the animals to you with the Zoo-to-You OutreachProgram!447
RELIVE CELEBRATIONS SQUAREAndersen Enrichment Center overlooks the manicuredLucille E. Andersen Memorial Garden, which includes acircular pool with a Marshall M. Frederick sculpture gracingthe center and is surrounded by beautiful flowering shrubs,trees, and plants. The Center serves as the home <strong>of</strong> the<strong>Saginaw</strong> County Enrichment Commission, whose mission isto promote the arts and entertainment in the area. The Centerhosts business meetings, conferences, art exhibits, weddingreceptions, and other social events.Garber Tennis Court is located beside the AndersenEnrichment Center. It consists <strong>of</strong> eight playable courts,which are available for daily use. Two annual tennistournaments and tennis lessons are available during thesummer.Cathedral District is located on the east side <strong>of</strong> the river.This neighborhood was home to the business leaders thatwent on to create what would be known as downtown<strong>Saginaw</strong>. The most prominent leaders <strong>of</strong> <strong>Saginaw</strong> made theirhomes in this neighborhood during the 1890’s through the1950’s. This area is currently undergoing a massive infusion<strong>of</strong> capital and civic energy to preserve the historic propertiesas well as rid the area <strong>of</strong> its blight. It is currently listed on theNational Register <strong>of</strong> Historic Places.448
RELIVE SAGINAW! A COOL CITY!The Dow Event Center was previously known as The<strong>Saginaw</strong> Civic Center built in 1972 by the <strong>City</strong> <strong>of</strong><strong>Saginaw</strong>. The Civic Center was comprised <strong>of</strong> threemain parts: Wendler Arena, Heritage Theater, andUnity Hall. The Center has <strong>of</strong>fered all Countyresidents hundreds <strong>of</strong> entertainment, sports, cultural,and educational opportunities annually. Acts who haveperformed at the Center in the past include: ElvisPresley, Patti LaBelle, Stevie Wonder, Reba McEntire,Smashing Pumpkins, Kid Rock, Diana Ross, SesameStreet Live, Disney on Ice, Jerry Seinfeld, Bill Cosby,George Carlin, Les Miserables, The Nutcracker Ballet,Rent and Riverdance, to name a few.Morley Plaza holds numerous activities for thecitizens <strong>of</strong> <strong>Saginaw</strong>, such as Friday Night Live, whichconsists <strong>of</strong> various concerts. People gather herethroughout the summer months (May – August) toenjoy the weather, people, activities, music and the<strong>City</strong> <strong>of</strong> <strong>Saginaw</strong>.Pit & Balcony Community Theatre provides <strong>Saginaw</strong> witha wide variety <strong>of</strong> shows and entertainment every year. Itholds numerous Broadway shows, musicals, and auditionsfor upcoming shows and workshops for children and adults.It <strong>of</strong>fers 12 months <strong>of</strong> on-stage opportunities for actors,actresses and audiences alike. From teens to parents andbeyond, Pit & Balcony provides the creative outlet for<strong>Saginaw</strong>’s performance artists.449
RELIVE OUR PARKS AND WATERFRONTHoyt Park is next to the <strong>Saginaw</strong> Zoo and iscomprised <strong>of</strong> great entertainment and attractions allyear long. In the summertime, Hoyt Park has 6 s<strong>of</strong>tballfields and is a popular place to walk, run, or bike. Inthe winter, it has a sledding hill. “Play Ball at HoytPark” is a <strong>Saginaw</strong> Christian Fellowship YouthBaseball League, which attracts a large crowd everysummer.Wickes Park, an award winning, destination-styleplayground and was partially designed by areachildren. The wonderful playscape features uniqueclimbing apparatus, a beamed hill, and a hard-surfacetrack for small pedal vehicles, benches and many othercolorful features. The Michigan Municipal Leaguehonored the playground with an Achievement Awardin 1998. That was the first time <strong>Saginaw</strong> had won thishonor.<strong>Saginaw</strong>’s Waterfront is along side many businesses,which includes a public walkway for walkers andmany bike riders. This beautiful waterfront providesmany citizens with fishing, various outdoor activities,relaxation, and peace <strong>of</strong> mind after a long day at work.Many walkers and joggers are guaranteed a goodworkout with a distance <strong>of</strong> approximately 4.15 milesstarting from the Johnson Street Bridge to the EastStreet Bridge.450
CULTURAL INDULGENCES<strong>Saginaw</strong> is in the heart <strong>of</strong> Mid-Michigan---and at the heart <strong>of</strong> great entertainment, cultural events, and quality <strong>of</strong>life opportunities. Indulge your cultural and creative side by visiting one <strong>of</strong> <strong>Saginaw</strong> County's many museums, galleries,art shops, shows, and concerts.Green Point Environmental Learning Center consists <strong>of</strong> nearly 150 kinds <strong>of</strong> birds throughout the year. (It iscomprised <strong>of</strong> 82-acres featuring 40 tree species, <strong>of</strong> which some are very old trees, that provide good nesting habitat forsquirrels, woodpeckers, and wood ducks.) The wildlife viewing room affords views <strong>of</strong> songbirds, small mammals, andother wildlife. There are several feeding stations, wherein an individual can interact with these creatures. In addition, thecenter hosts a variety <strong>of</strong> programs throughout the year for school children <strong>of</strong> all ages that focus on nature-related topicssuch as habitat, wildlife <strong>of</strong> Green Point, invasive species, and ecosystems. They <strong>of</strong>fer special guided hikes at various timesduring the year. Green Point hosts the Federal Junior Duck Stamp contest for Michigan each year.The Historical Society <strong>of</strong> <strong>Saginaw</strong> County and Castle Museum is committed to serving the community byinforming the community <strong>of</strong> the <strong>Saginaw</strong> region through exploration, preservation, and presentation <strong>of</strong> their historical andcultural heritage, their dynamic presence, and the possibilities <strong>of</strong> the future. The Historical Society operates in the CastleMuseum, which is a unique and significant gem <strong>of</strong> <strong>Saginaw</strong>.Jazz on Jefferson is an experience on Jefferson Street, which our community cannot forget. Downtown<strong>Saginaw</strong> turns into a slice <strong>of</strong> San Francisco. One can experience sidewalk cafes, street performers, and front-yardmusicians.Lawn Chair Film Festival is geared to the 20 year old and up crowd with one additional family feature perseason. It takes place during the summer on Sunday nights in Old <strong>City</strong> <strong>Saginaw</strong> at North Hamilton and Ames. This eventis great for family and friends to gather together for a good blockbuster night. It also features outstanding independent,foreign, and classic movies. It draws on average an audience between 700 and 1,500.Mid-Michigan Children’s Museum is a fun, hands-on place where children use their curiosity and creativity tolearn about their world. It aims to broaden and enrich the educational opportunities for children ages 0-12, to enhancetheir understanding <strong>of</strong> the world; and to support parents, caregivers, and education facilitators <strong>of</strong> children’s explorations.Public Libraries <strong>of</strong> <strong>Saginaw</strong> Hoyt Main Library features a variety <strong>of</strong> programs for youth, teens, and adults yearround. Hoyt Library is the historic Downtown <strong>Saginaw</strong> source <strong>of</strong> new arrivals for every age group as well as home <strong>of</strong> anextensive genealogical collection. It also has comprehensive online resource for finding library materials from anywherein the state.Positive Results in a Downtown Environment (PRIDE) was formed in 1975 and is composed <strong>of</strong> volunteerscommitted to promoting and beautifying Downtown <strong>Saginaw</strong>. Its annual events include the Memorial Day Parade, AnnualChristmas Parade, Holidays in the Heart <strong>of</strong> the <strong>City</strong>, Friday Night Live, the Downtown <strong>Saginaw</strong> Farmer’s Market, andHarvest Days.451
Read Enjoy And Discover (READ) helps students improve their reading skills and discover the joy <strong>of</strong> reading.READ mentors make sharing their love <strong>of</strong> reading their primary focus while also providing a positive role model as wellas teaching values, such as courage, honesty, friendship, kindness, truthfulness, integrity, and compassion.Riverside <strong>Saginaw</strong> Film Festival features 14 films and numerous documentaries over six days at the TempleTheatre, Castle Museum, Pit & Balcony Community Theatre, Hoyt Library, the Lawn Chair Film Festival, and the CourtTheatre. It is a community event designed to celebrate, explore, and screen great movies, thus adding to the cultural life <strong>of</strong>the <strong>Saginaw</strong> Valley and beyond.<strong>Saginaw</strong> Arts & Enrichment Commission serves as a catalyst for the arts by encouraging, developing, andpromoting organizations and activities that enhance the economic vitality and quality <strong>of</strong> life in the <strong>Saginaw</strong> Community.Current activities include the All Area Arts Awards, Hispanic Heritage and Black History Student Art Exhibitions, Art atthe Andersen, <strong>Saginaw</strong> Cultural Events Roundtable, Visiting Artist Residency, Hollyday Fair, Artifacts newsletter, onlineevents calendar, and many other programs.<strong>Saginaw</strong> Art Museum features an expansive permanent collection, enhanced museum store, and travelingexhibits <strong>of</strong> national and international merit. Lectures, tours, and classes are just part <strong>of</strong> the wide range <strong>of</strong> educational<strong>of</strong>ferings and community outreach. <strong>Saginaw</strong> Art Museum also features a multi-purpose lecture theatre, and an enlargedVision Area, as well as the Museum’s popular hands-on children’s gallery.<strong>Saginaw</strong> Bay Symphony Orchestra has performed an annual concert series since its creation in 1935. It is afully pr<strong>of</strong>essional ensemble drawing its members from throughout Michigan. The Orchestra performs a wide variety <strong>of</strong>chamber, pops, educational, and historic concerts plus opera, ballet, and modern dance.<strong>Saginaw</strong> Choral Society is comprised <strong>of</strong> a 100 member, auditioned volunteer performance, which annuallypresents a season <strong>of</strong> classical, contemporary, and popular concerts for the community. The chorus has earned muchcritical acclaim, has garnered local, state, and national awards and has built a substantial regional following.<strong>Saginaw</strong> Eddy Concert Band consists <strong>of</strong> 60 members from retired music teachers, music majors from localcolleges such as Central Michigan, to otherwise musically inclined <strong>Saginaw</strong>ians. The <strong>Saginaw</strong> Eddy Concert Band playsstandard marches, musical scores with accompanying vocalists, classical selections adapted for concert bands and more.St. John’s Episcopal Church was founded in 1851 and is the oldest church in the <strong>Saginaw</strong> Valley. It is locatedon North Michigan Street. It boasts stained glass windows from both the United States and Europe. <strong>Saginaw</strong> has otherchurches in the area, ranging from Catholic, Baptists, Church <strong>of</strong> God In Christ, Methodist, and many more denominations.Friends <strong>of</strong> Theodore Roethke are committed to promoting, preserving, and protecting the literary legacy <strong>of</strong><strong>Saginaw</strong>’s Pulitzer Prize winner, Theodore Roethke, by restoring his family residences and collaborating with othercommunities. The Roethke House is a center for educational opportunities, historical awareness, and cultural values.<strong>Saginaw</strong> Code Enforcement Neighborhood Improvement Cooperative (SCENIC) was formed andimplemented on June 1, 2008. The team is made up <strong>of</strong> <strong>City</strong> employees from a variety <strong>of</strong> departments including: police,fire, inspections, zoning, and public works. These groups <strong>of</strong> employees work together to address many types <strong>of</strong> situationsthat have a negative impact in our community, thereby preventing blight from gaining a greater foothold. SCENIC alsoprovides a communication link between the residents <strong>of</strong> <strong>Saginaw</strong> and <strong>City</strong> Hall, by having at least one <strong>of</strong> our members ateach <strong>of</strong> the many neighborhood organization meetings.452
INTERESTING FACTSMichigan State University Community and Economic Development Program ranked <strong>Saginaw</strong>County fourth out <strong>of</strong> 83 Michigan counties for “Percent <strong>of</strong> Workforce Employed in InformationTechnology” according to a recent study.The Rehmann Group, with headquarters in <strong>Saginaw</strong>, was listed as one <strong>of</strong> “Detroit Metro Area's101 Best and Brightest Companies to Work For.” The Rehmann Group is the second largestaccounting firm in Michigan behind Plante & Moran, Inc.The <strong>Saginaw</strong> Metro Area was ranked Number 23 for Culture & Leisure in the Forbes MagazineBest Small Places List.<strong>Saginaw</strong> County was named one <strong>of</strong> the “100 Best Communities for Young People in the Nation”by America's Promise.Recently, Salary.com ranked the <strong>Saginaw</strong> area one <strong>of</strong> the “Top 5 Best Places to Live for Cost <strong>of</strong>Living”.Recently, “Forbes Magazine” ranked the <strong>Saginaw</strong> area Number 51 for Metro Area for Engineers.<strong>Saginaw</strong> is home to the largest group <strong>of</strong> cardiovascular surgeons in the State <strong>of</strong> Michigan -Michigan Cardio Vascular Institute.<strong>Saginaw</strong> County is home to two major hospital facilities that provide a wide array <strong>of</strong> medicalservices, which include St. Mary’s <strong>of</strong> Michigan and Covenant Healthcare.453
Synergy Medical Education Alliance <strong>of</strong>fers five, community-based, fully-accredited residencytraining programs in emergency medicine, family practice, internal medicine, general surgery,and obstetrics and gynecology.<strong>Saginaw</strong> County is 23rd in the nation in sugar beets harvested, 28th in the nation in dry ediblebeans harvested, and third in soybeans harvested in the State <strong>of</strong> Michigan.The Michigan Travel Bureau ranked <strong>Saginaw</strong> County Number 3 for Tourist Destination in theState <strong>of</strong> Michigan.The Birch Run Frankenmuth exit <strong>of</strong>f I-75 in <strong>Saginaw</strong> County is the second busiest exit fortourism in the nation, second to Orlando, Florida.<strong>Saginaw</strong> is home to the <strong>Saginaw</strong> Spirit Hockey Club, which is a member <strong>of</strong> the Ontario HockeyLeague. The Spirit hosted the 2007 Bell OHL All-Star Classic.<strong>Saginaw</strong> County has over 541 acres <strong>of</strong> parkland with year-round recreational opportunities.<strong>Saginaw</strong> has 26 public and private golf courses, 30 parks and an 82-acre trail system for skiing orhiking.<strong>Saginaw</strong> County is home to 15 museums, 34 meeting facilities, 43 hotels, 12 bed & breakfasts,and 67 different religious denominations.The second annual AG Edwards Nest Egg Index ranked the <strong>Saginaw</strong> Metro Area 278th out <strong>of</strong>934 U.S. communities for personal savings.454
EDUCATION<strong>Saginaw</strong> Valley State University (SVSU) is one <strong>of</strong> the most prestigious colleges in the state <strong>of</strong> Michigan. After anextensive study, Dr. John Dale Russell (Chancellor and Executive Secretary <strong>of</strong> the New Mexico Board <strong>of</strong> EducationFinance) submitted the Russell Report to the Michigan State Legislature's Joint Senate-House Committee. The reportendorsed the concept <strong>of</strong> a higher education based learning system in the <strong>Saginaw</strong>, Bay <strong>City</strong> and Midland communities,thus marks the beginning for the formative years <strong>of</strong> SVSU.In November <strong>of</strong> 1963, <strong>Saginaw</strong> Valley College was chartered as a private college. The first classes were held in thebasement <strong>of</strong> the current Delta College site. Here the students attended classes until <strong>Saginaw</strong> Valley College was built. InDecember <strong>of</strong> 1963, the <strong>Saginaw</strong> Board <strong>of</strong> Director's introduced four possible name choices: College <strong>of</strong> the North,<strong>Saginaw</strong> Valley College, John Fitzgerald Kennedy College or University Center College.It was determined with a clear majority that <strong>Saginaw</strong> Valley College wasthe name <strong>of</strong> choice, thus by the end <strong>of</strong> 1963 <strong>Saginaw</strong> Valley College wasborn. In addition to establishing roots, <strong>Saginaw</strong> Valley College’s insigniawas also created. This is an example <strong>of</strong> <strong>Saginaw</strong> Valley College’s first identity. The explanation <strong>of</strong> its symbol reflects theunique identity <strong>of</strong> the college.The 1980’s were a decade <strong>of</strong> great growth for the college. In November <strong>of</strong> 1987, <strong>Saginaw</strong> Valley State College wasreclassified as <strong>Saginaw</strong> Valley State University (SVSU) with a student enrollment <strong>of</strong> nearly 6,000. SVSU began thedecade by crossing international borders and hosting the University’s first international students. In 1981, SVSU receivedenough votes from the Academic Affairs President’s Council to begin its Engineering Program.SVSU's academic excellence also was recognized through accreditations. In 1994, the North Central Association <strong>of</strong>Colleges and Schools renewed SVSU's accreditation for 10 years, the longest renewal in the University's history and asign <strong>of</strong> the University's level <strong>of</strong> performance, integrity and quality. Currently, SVSU is known for its excellentachievements, beautiful campus, and great academic programs.Delta College is a community college, which is located withinblocks <strong>of</strong> <strong>Saginaw</strong> Valley State University. During the 1950s,the demand for education beyond high school createdtremendous support for a new community college to serve theBay, Midland, and <strong>Saginaw</strong> Counties.455
In September 1961, Delta College opened its doors to approximately 1,800 students who hoped for a brighter tomorrow.It was founded in 1961 in a rural 640-acre campus. Current enrollment at Delta College is 10,387, <strong>of</strong> which 1,439 studentsearned a degree or certificate in the 2006/2007 academic year.Their mission is a responsive, dynamic community college, to educate, inspire, challenge, and support a diversecommunity <strong>of</strong> learners to achieve academic, pr<strong>of</strong>essional, and personal excellence.Delta College is our community’s first choice to learn, work and grow. From a foundation <strong>of</strong> leadership, Delta Collegeuses innovation and teamwork to achieve excellence.Today, Delta College enrolls an average <strong>of</strong> 10,000 students annually. These individuals range from high school studentstaking Delta classes to older adults returning to college to enhance their skills or wanting a fresh start.The main campus has been expanded and renovated (with more than $68 million in changes since 1999). Delta Collegehas established three <strong>of</strong>f-campus centers – the Planetarium & Learning Center in Bay <strong>City</strong> (with show and specialprogram attendance exceeding 300,000 people during its first ten years <strong>of</strong> operation), the Midland Center, and the RickerCenter in <strong>Saginaw</strong> – to better serve each community.Ross Medical Education Center was founded in 1976. Ross MedicalEducation Center has maintained a single focus. We are dedicated toproviding quality curriculum and instruction that meets the needs <strong>of</strong>students in our health training programs. Ross provides medical trainingthat is focused on the essentials that will establish you in your alliedhealth career. Ross prepares graduates to begin rewarding careers in thehealthcare industry in as little as 30 weeks! We provide focused, handsontraining that gives our students the skills they need to succeed in thefast-growing healthcare field. By eliminating general education andenrichment classes, you enter the job market ahead <strong>of</strong> the competition.Many high school graduates and adults can attend other colleges and universities, which are considered extensions, suchas: Northwood University (main campus located in Midland, <strong>MI</strong>), Davenport University (main campus located in GrandRapids, <strong>MI</strong>), and Central Michigan (main campus located in Mount Pleasant, <strong>MI</strong>).456
TRANSPORTATION<strong>Saginaw</strong> Transit Authority Regional Services(STARS) is a public transportation system forthe Urbanized <strong>Saginaw</strong> Area, which travelsabout 1.5 million miles per year.Over 2,700 people ride our buses each day to work, doctor visits, shopping, or school. It provides basic transportationneeds and is an important partner in economic development.STARS also serves as an effective solution to mobility challenged citizens. Annually, over 48,000 senior citizens andpersons with disabilities utilize the LIFT service.STARS LIFT is a curb-to-curb service designed for senior citizens, persons with mobility disabilities, and the generalpublic not conventionally served by STARS fixed routes.It is the vision <strong>of</strong> <strong>Saginaw</strong> Transit Authority Regional Services to become a premier public transportation agency serving<strong>Saginaw</strong> and the Metropolitan Region with excellence and the highest quality <strong>of</strong> innovative service delivery to ourcustomers.STARS recently completed a $900,000 renovation <strong>of</strong> its waiting area and plaza outside <strong>of</strong> its 615 Johnson Street busgarage. A 780 sq. ft. indoor waiting area with restrooms and a sidewalk snowmelt system was <strong>of</strong>ficially named the RosaParks Transfer Plaza.The facility features two restrooms, security cameras, vending machines, and an outdoor route monitor similar to anairport’s video screens that show arrivals and departures. The waiting area features bench seating for 22 and space for upto 35 people.457
Midland, Bay, <strong>Saginaw</strong> (MBS) InternationalAirport, formally named Tri-<strong>City</strong> Airport, is aspecial municipality owned by the cities <strong>of</strong>Midland, <strong>Saginaw</strong> and the County <strong>of</strong> Bay.The airport is located in Freeland, Michigan, which is centrally located between the three owning communities. A ninemembercommission, composed <strong>of</strong> three representatives from each owning community, governs the airport.MBS is proud to provide the traveling public scheduled air service from major airline carriers. At MBS, you will be sureto find plenty <strong>of</strong> safe, inexpensive parking, both long and short term, with only a short walking distance to the passengerterminal.MBS also <strong>of</strong>fers a variety <strong>of</strong> ground transportation, which includes four car rental agencies, and a number <strong>of</strong>taxi/limousine companies that service the airport.Whether waiting for your flight or picking up a passenger, MBS <strong>of</strong>fers many food and beverage selections provided in theGladCo Food Court. Computer access is available for the convenience <strong>of</strong> the traveler who may need to log onto theInternet or check messages while away from the home or <strong>of</strong>fice. MBS <strong>of</strong>fers a game room and gift shop, which featureseverything from reading materials and snacks to unique gifts for those awaiting flight arrivals or departures.The MBS International Airport Commission approved a designin the fall <strong>of</strong> 2008 for a new terminal. The building is expected tobe complete in three to five years, and is designed with areatravelers in mind. The new MBS terminal will costapproximately $48 million to build, but it will be done withoutthe use <strong>of</strong> current or new local taxes.MBS International Airport continues to grow and constantly strives to make improvements in an effort to ensure that theyprovide to you high level <strong>of</strong> service, convenience, safety, and value. MBS is ready to serve you!DISTANCE FROM MBS AIRPORT TO THESE CITIES:CITY <strong>MI</strong>LES CITY <strong>MI</strong>LESAtlanta, GA 811 Detroit, <strong>MI</strong> 117Orlando, FL 1250 Cincinnati, OH 346Chicago, IL 296 New York, NY 717458
NATIONAL, STATE, LOCAL RECOGNITIONS OF CITY ACHIEVEMENTSTree <strong>City</strong> USA Award: The <strong>City</strong> <strong>of</strong> <strong>Saginaw</strong> received a Tree <strong>City</strong> USA designation from the Tree <strong>City</strong> USA® program,sponsored by The National Arbor Day Foundation in cooperation with the USDA Forest Service and the National Association<strong>of</strong> State Foresters. Requirements include, a tree board or department, tree care ordinance, community forestry program with anannual budget <strong>of</strong> at least $2 per capita and an Arbor Day observance and proclamation.SCENIC (<strong>Saginaw</strong> Code Enforcement Neighborhood Improvement Co-Operative): SCENIC is a combination <strong>of</strong> the<strong>Saginaw</strong> Fire Department, Department <strong>of</strong> Development, and <strong>Saginaw</strong> Police Department. Specific areas <strong>of</strong> the communityhave been designated, prioritized, and a cooperative effort among these departments has reduced the financial andworkload burden on a single department, providing a broader base <strong>of</strong> expertise. In May <strong>2010</strong> the SCENIC team receivedthe Environmental Crime Award <strong>of</strong> Excellence from the Michigan Association <strong>of</strong> Police.<strong>City</strong> <strong>of</strong> <strong>Saginaw</strong>’s Green Team: The Green Team was a recipient <strong>of</strong> the Region 4 Michigan Municipal League <strong>2010</strong>Community Excellence Award, which was held in Dewitt, <strong>MI</strong> on May 19, <strong>2010</strong>. Our Green Team will now compete forthe statewide Community Excellence Award against six other regions at the MML’s Annual Convention in Dearborn, <strong>MI</strong>to be held September 24 – 24, <strong>2010</strong>.July 1, 2009 – June 30, <strong>2010</strong>: Distinguished <strong>Budget</strong> Award – For the second year in a row, the <strong>City</strong> <strong>of</strong> <strong>Saginaw</strong> received theGovernment’s Finance Officer’s Association (GFOA) Distinguished <strong>Budget</strong> Award. The GFOA established the Distinguished<strong>Budget</strong> Presentation Awards Program (<strong>Budget</strong> Awards Program) in 1984 to encourage and assist state and local governments toprepare budget documents <strong>of</strong> the very highest quality that reflect both the guidelines established by the National AdvisoryCouncil on State and Local <strong>Budget</strong>ing and the GFOA’s recommended practices on budgeting and then to recognize individualgovernments that succeed in achieving that goal.2007-2008 Hockey Champs: The <strong>Saginaw</strong> Spirit was born when Dick Garber, the owner <strong>of</strong> several local automobiledealerships, purchased the North Bay Centennials and moved the team after the 2001–02 season to <strong>Saginaw</strong> and renamed themthe <strong>Saginaw</strong> Spirit. The <strong>Saginaw</strong> Spirit won the title during the 2007-2008 season. The <strong>Saginaw</strong> Spirit has done extensivepromotions in the Mid-Michigan area, increasing their fan base and season ticket-holder numbers. The Spirit has one <strong>of</strong> thehighest attendance rates in the Ontario Hockey League.January 25, 2007: America’s Promise – The Alliance for Youth announced <strong>Saginaw</strong> County as the winner <strong>of</strong> a nationalcompetition to identify the “100 Best Communities for Young People.” In partnership with Capital One, the 100 Bestcompetition honors communities, ranging from small towns to urban neighborhoods across America, for their commitment toprovide healthy, safe and caring environments for young people. Hundreds <strong>of</strong> communities in all 50 states, the District <strong>of</strong>Columbia, Puerto Rico, and the U.S. Virgin Islands took part in the competition.459
UPCO<strong>MI</strong>NG PROJECTAndersen Water Park was considered a place where children could relax, enjoy the water and have fun! Forthe past several years the park was closed due to a decline in attendance beginning in 2002. The <strong>City</strong> <strong>of</strong> <strong>Saginaw</strong> openedAndersen Water Park in the summer <strong>of</strong> 1988. The park consisted <strong>of</strong> a wave pool, twin water slides, concession building,wooden deck, and bathrooms with showers and lockers.The <strong>City</strong> <strong>of</strong> reinvented the Andersen Water Park now renamed “Frank N Andersen Celebration Park” toregenerate fun family times for children <strong>of</strong> all ages. Members <strong>of</strong> the Task Force felt it would be a great idea to have achildren's splash park, Skate Park, boardwalk, play-scape, bocce ball court and picnic pavilion. Thus far the fund-raisingteam has raised the estimated goal <strong>of</strong> $1,622,00.00. Construction began last spring on the splash park and the <strong>City</strong> islooking forward to a <strong>2010</strong> 4th <strong>of</strong> July grand opening. Several goals for the reinventing <strong>of</strong> the “Frank N. AndersenCelebration Park” are as follows:1 It will provide a safe, accessible place to play for people <strong>of</strong> all ages2 It will provide a lower cost, lower maintenance, but higher use facility that will last 20-plus years3 It will provide an attractive, unique, water-based recreation feature that will bring even more people toCelebration Square and the Riverfront460
DEVELOPMENT PROJECTSEast Genesee Avenue Reconstruction and StreetscapeCost: $5,300,000 Completion Date: Scheduled for <strong>2011</strong>/2012Woodbridge Street – Houghton to DavenportCost: $2,000,000 Completion Date: Scheduled for <strong>2011</strong>/2012Court Street Resurfacing and Water Main ReplacementCost: $2,340,000 Completion Date: Scheduled for <strong>2011</strong>/2012Michigan Avenue Resurfacing and Water Main ReplacementCost: $4,595,000 Completion Date: Scheduled for 2012/2013East Genesee Avenue at Hess StreetCost: $295,000 Completion Date: Scheduled for <strong>2011</strong>/2012M-13 from Hess to M-46Cost: $6,100,000 Completion Date: Scheduled for <strong>2010</strong>/<strong>2011</strong>Bay Street from Court Street to Genesee StreetCost: $400,000 Completion Date: Scheduled for <strong>2011</strong>/2012Community Development Block Grant Ramps – CDBGCost: $300,000 Completion Date: Scheduled for 2015/2016Community Development Block Grant Resurfacing – CDBGCost: $1,150,000 Completion Date: Scheduled for 2015/2016Ezra Rust from M-13 to Court Street BridgeCost: $1,300,000 Completion Date: Scheduled for 2013/2014Fordney Street from M-46 to Ezra RustCost: $1,300,000 Completion Date: Scheduled for 2013/2014East Genesee Avenue – Harold to HessCost: $2,230,000 Completion Date: Scheduled for 2014/2015East Genesee Avenue – Janes to HartsuffCost: $1,650,000 Completion Date: Scheduled for 2014/2015Weiss Street at Hermansau Street – Signal Installation and Right Turn LaneCost: $200,000 Completion Date: Scheduled for 2014/2015Treanor Street from Williamson to Dixie HighwayCost: $800,000 Completion Date: Scheduled for 2013/2014Niagara Street from Railroad Tracks to DavenportCost: $2,400,000 Completion Date: Scheduled for 2015/2016461
Mackinaw Street – State Street to Weiss StreetCost: $300,000 Completion Date: Scheduled for 2015/2016Energy Efficiency Conservation Block Grant & Clean Energy Coalition FundsCost: $1,030,200 Completion Date: Scheduled for <strong>2010</strong>/<strong>2011</strong>Interchange at I-675 and Warren AvenueCost: $12,250,000 Completion Date: Scheduled for 2012/2013Interchange at I-675 at Veterans Memorial ParkwayCost: $1,865,000 Completion Date: Scheduled for 2012/2013I-675 Ramp throughout <strong>City</strong> LimitsCost: $3,615,511 Completion Date: Scheduled for <strong>2010</strong>/<strong>2011</strong>I-675 North and South Bound LightingCost: $2,200,000 Completion Date: Scheduled for <strong>2010</strong>/<strong>2011</strong>I-675 over Michigan AvenueCost: $440,000 Completion Date: Scheduled for <strong>2010</strong>/<strong>2011</strong>I-675 over Schaeffer StreetCost: $1,335,000 Completion Date: Scheduled for <strong>2010</strong>/<strong>2011</strong>I-675 Throughout <strong>City</strong> LimitsCost: $14,833,500 Completion Date: Scheduled for <strong>2010</strong>/<strong>2011</strong>I-675 Bridge Replacement – 21 st & 11th Street Pedestrian BridgesCost: $1,659,000 Completion Date: Scheduled for <strong>2010</strong>/<strong>2011</strong>I-675 Bridge Replacement over River, M-13 and Railroad and Eastbound on RampCost: $18,520,000 Completion Date: Scheduled for <strong>2010</strong>/<strong>2011</strong>462
CITY OF SAGINAW’S NEW BUSINESS, ATTRACTIONS & EXPANSIONSHall Commercial Properties, LLCCost: $125,000.00 Jobs Created/Retained: 3Germania Town & Country ClubCost: $100,000.00 Jobs Created/Retained: 3<strong>Saginaw</strong> PlasticsCost: $45,343.00 Jobs Created/Retained: 1Ivan Phillips Funeral Home, LLCCost: $52,200.00 Jobs Created/Retained: 1GT, LLCCost: $71,100.00 Jobs Created/Retained: 2Burtrum Furs & LeathersCost: $20,025.00 Jobs Created/Retained: 1Styles <strong>of</strong> CharacterCost: $39,525.33 Jobs Created/Retained: 1Erie MarkingCost: $55,000.00 Jobs Created/Retained: 1.5AKT Peerless Environmental Services, Inc.Cost: N/A Jobs Created/Retained: 6CIGNY’SCost: $384,546.00 Jobs Created/Retained: 2Dow Corning Solar Solutions Applications CenterCost: $3,500,000.00 Jobs Created/Retained: 2Garber BuickCost: N/A Jobs Created/Retained: 71Merrill AviationCost: $55,230.00 Jobs Created/Retained: 10Merrill Tool & Machine, Inc.Cost: $4,489,770.00 Jobs Created/Retained: 10Morley Companies, Inc.Cost: $4,500,000.00 Jobs Created/Retained: 350Prints PlusCost: $140,000.00 Jobs Created/Retained: 2<strong>Saginaw</strong> Control & EngineeringCost: $430,000.00 Jobs Created/Retained: 4463
BUILDING PER<strong>MI</strong>T SUMMARY1999 – 2009The residential, industrial, and commercial new construction and repairs and alterations building permit fees and actualnumbers <strong>of</strong> permits issued are represented by the following data:Year Building Permit Fees Number <strong>of</strong> Permits Issued1999 $223,090.00 2,0602000 $273,578.00 2,0042001 $237,892.00 2,2132002 $365,420.00 2,4032003 $242,499.00 1,8962004 $229,765.00 1,6082005 $196,557.00 1,4852006 $286,144.00 1,8962007 $189,665.00 1,4632008 $184,037.00 1,4062009 $141,081.00 1,276Breakdown <strong>of</strong> Permits Issued:Year DP EP MP BP PP1999 111 589 444 603 3132000 88 560 468 585 3032001 119 642 453 699 3002002 99 656 597 712 3392003 39 525 531 553 2482004 66 406 477 475 1842005 60 404 400 420 2012006 109 470 553 440 3242007 98 368 416 427 1542008 154 397 262 421 1722009 144 275 304 342 211DP = Demolition PermitsEP = Electrical PermitsMP = Mechanical PermitsBP = Building PermitsPP = Plumbing PermitsSource: Information provided by The <strong>City</strong> <strong>of</strong> <strong>Saginaw</strong>’s Zoning & Development Department <strong>of</strong> Inspections464
SAGINAW – LOOKING IN AT A DISTANCE<strong>City</strong> <strong>of</strong> <strong>Saginaw</strong> FactsSettledBy the Native Americans in 3,000 B.C.By the Europeans in 1822IncorporatedAs a <strong>City</strong> in 1823As a Village in 1854Population55, 620(Note: Population is for the year 2008)LocationEastern Mid-MichiganClimateAverage High: 57.0 FAverage Low: 39.2 FAnnual High Extreme: 82.3 F(Note: Temperatures based on 2009 Statistics)Source:Wikipedia Website: http://en.wikipedia.org/wiki/<strong>Saginaw</strong>,_Michigan465
A SNAPSHOT OFTHE CITY OF SAGINAWA comparison <strong>of</strong> the <strong>City</strong> <strong>of</strong> <strong>Saginaw</strong>’s condition over a 19-year period includes:Year Ended 1990 Year Ended 2009Number <strong>of</strong> Businesses on <strong>City</strong> Business Tax-rolls: 1,578 1,488Number <strong>of</strong> Households: 23,182 20,127December, 1990 December, 2009Employment Data for the <strong>City</strong> <strong>of</strong> <strong>Saginaw</strong>:Workforce: 27,034 25,750Employed: 23,432 20,393Unemployed: 3,602 5,357Unemployment Rate: 13.3% 20.8%Average Income (Personal & Per Capita) $27,980 $40,806** Average income information provided is from 2008 StatisticsGENERAL INFORMATION ABOUT THE CITY OF SAGINAW (2009 Statistics):State Income Tax Rate:4.35% (for the lowest bracket)*State Property Taxes:AverageSales Tax: 6.00%State Gas Tax Rate:$0.35 per gallonRetirement Tax Break from State: YesCost <strong>of</strong> Living: 75.7 (low compared to U.S. average <strong>of</strong> 100)Median Age: 30.7Notes: Number <strong>of</strong> Businesses on <strong>City</strong> Business Taxrolls (1,578) is from year 1992. Number <strong>of</strong> households (23,182) is from year 2000*The State Income Tax Rate is computed from the lowest tax bracket and uses the federal adjusted gross income with modification.Sources: (1) www.milmi.org(2) U.S. Bureau <strong>of</strong> Census, Business and Employment Statistics(3) <strong>City</strong> <strong>of</strong> <strong>Saginaw</strong>’s Assessor’s Office466
MAJOR EMPLOYERS IN THE SAGINAW AREATop 20 Withholding EmployersFor Year 2009Rank Company/Organization 2009Withholding Amount1 Covenant Medical Center Inc. $1,406,569.202 St. Mary’s <strong>of</strong> Michigan $ 648,578.193 School District <strong>City</strong> <strong>of</strong> <strong>Saginaw</strong> $ 520,282.504 State <strong>of</strong> Michigan $ 324,610.505 General Motors Company $ 305,156.276 TRW Integrated Chassis Systems, LLC $ 290,752.917 <strong>City</strong> <strong>of</strong> <strong>Saginaw</strong> $ 276,516.598 General Motors Corporation $ 274,673.929 US MN Postal Data Center $ 266,738.9810 <strong>Saginaw</strong> County Courthouse $ 236,608.3511 Department <strong>of</strong> Veterans Affairs $ 224,462.6612 <strong>Saginaw</strong> Veterans Administration Hospital $ 222,612.0913 Delphi Automotive Systems Corp. $ 191,056.9814 AT&T Services Incorporated $ 108,132.3615 Michigan Cardiovascular Institute, PC $ 93,339.9116 Health Delivery Incorporated $ 90,109.3017 Steering Solutions $ 86,045.4718 Michigan Bell Telephone Company $ 84,611.4819 Dow Chemical Company $ 84,533.3120 Synergy Medical Education Alliance $ 83,257.402009 TOTAL: $ 5,818,648.37Sources: (1) Information provided by <strong>City</strong> <strong>of</strong> <strong>Saginaw</strong>’s Income Tax Division <strong>of</strong> the Department <strong>of</strong> Fiscal Services(2) Sperling’s Best Places Website467
EMPLOYMENT / LABOR FORCEYear Civilian Labor Force Employment Unemployment Unemployment Rate1990 27,034 23,432 3,602 13.3%1991 26,774 22,928 3,846 14.4%1992 27,166 23,115 4,051 14.9%1993 27,081 23,556 3,525 13.0%1994 27,317 24,167 3,150 11.5%1995 27,045 24,219 2,826 10.4%1996 26,859 24,589 2,270 8.5%1997 27,109 25,010 2,099 7.7%1998 27,102 25,015 2,087 7.7%1999 27,253 25,300 1,953 7.2%2000 25,651 23,799 1,852 7.2%2001 25,898 23,319 2,579 10.0%2002 25,632 22,485 3,147 12.3%2003 26,465 22,447 4,018 15.2%2004 26,315 22,431 3,884 14.8%2005 26,077 22,542 3,535 13.6%2006 26,094 22,746 3,348 12.8%2007 25,503 22,357 3,146 12.3%2008 25,134 21,425 3,709 14.8%2009 25,750 20,393 5,357 20.8%Averages 26,463 23,264 3,199 12.12%Unemployment Rate – <strong>City</strong> <strong>of</strong> <strong>Saginaw</strong>, 2009(Monthly Rate)January February March April May June19.9% 19.9% 20.6% 19.2% 21.3% 22.4%July August September October November December22.5% 19.9% 20.1% 20.0% 21.1% 22.5%Source: Michigan Labor Market Information, Data Explorer (Labor & Economic Growth, Historical Statistics)468
UNEMPLOYMENT RATE COMPARISONYEAR SAGINAW BAY CITY DETROIT FLINT <strong>MI</strong>DLAND1990 13.30% 10.50% 15.30% 16.10% 4.10%1991 14.40% 11.40% 17.90% 20.00% 4.60%1992 14.90% 12.50% 17.40% 20.50% 5.40%1993 13.00% 10.10% 13.60% 17.40% 5.30%1994 11.50% 10.10% 11.20% 14.50% 4.60%1995 10.40% 8.20% 10.10% 11.60% 3.70%1996 8.50% 6.60% 10.00% 10.30% 2.70%1997 7.70% 6.10% 9.00% 9.20% 2.30%1998 7.70% 6.00% 8.40% 9.50% 2.10%1999 7.20% 5.80% 8.10% 8.80% 1.90%2000 7.20% 4.40% 7.30% 8.10% 2.50%2001 10.00% 5.70% 10.10% 10.80% 3.20%2002 12.30% 7.10% 12.00% 13.10% 4.10%2003 15.20% 8.10% 13.90% 17.40% 4.80%2004 14.80% 8.10% 14.00% 14.50% 4.90%2005 13.60% 7.60% 14.10% 13.90% 4.50%2006 12.80% 7.40% 13.70% 14.40% 4.30%2007 12.30% 7.30% 14.30% 14.60% 4.20%2008 14.80% 8.50% 16.00% 18.40% 4.80%2009 20.80% 12.80% 25.00% 25.00% 7.50%UMEPLOYMENT COMPARISON – SURROUNDING AREAS30.00%25.00%20.00%15.00%10.00%5.00%0.00%19901991199219931994199519961997199819992000200120022003200420052006200720082009<strong>2010</strong>SAGINAW BAY CITY DETROIT FLINT <strong>MI</strong>DLANDSource: Michigan Labor Market Information, Data Explorer (Labor & Economic Growth, Historical Statistics)469
BANKING INSTITUTIONSI N THE CITY OF SAGINAWBank <strong>of</strong> America elected four new directors, June 5, 2009, Susan S. Bies, William P. Boardman, D. Paul Jones,and Donald E. Powell. On April 21, 2009, Independent Bank associates throughout Michigan participated in TeachChildren to Save Day, by visiting local schools and provided lessons to students on how to save and manage their manage.Fifth Third Mortgage Company participated in the government’s Homeowner Affordability and Stability Program(HASP). October 2008, National <strong>City</strong> Bank was bought by PNC Financial Services Group, Inc., which is headquartered inCleveland, OH.Within the corporate limits <strong>of</strong> the <strong>City</strong> <strong>of</strong> <strong>Saginaw</strong> are 9 different banking institutions with a total <strong>of</strong> 56 <strong>of</strong>fices.Even though these banks are spread out throughout the County <strong>of</strong> <strong>Saginaw</strong>, there are still quite a few within the city limits<strong>of</strong> <strong>Saginaw</strong>, Michigan.Rank *Banking # Of <strong>City</strong>- Total Total Headquarters Book ValueInstitute Based Offices Assets D eposits Location Per Common ShareC ommunity1 State Bank 1 $268,939,000 $219,085,000 St. Charles, <strong>MI</strong> Not Publicly Traded2 1State Bank 3 $153,580,788 $118,011,137 <strong>Saginaw</strong>, <strong>MI</strong> Not Publicly Traded3 Fifth Third Bank 2 $111,505,000 $80,096 Grand Rapids, M I $12.444 Citizens Bank 12 $11,931,631 $ 8,909,340 Flint, <strong>MI</strong> $2.695 Chemical Bank 3 $4,250,712 $3,418,125 Midland, <strong>MI</strong> Not Publicly Traded6 IndependentBank6 $2,965,364 $2,565,768 Ionia, <strong>MI</strong> $1.697 Bank <strong>of</strong> America 7 $2,223,299 $991,611 Troy, <strong>MI</strong> $21.488 JP Morgan Chase 7 $2,031,989 $938,367 Columbus, O H$39.889 National <strong>City</strong> 15 $269,863 $186,922 Cleveland, OH $47.68Totals 56 $5 57,697,646 $3 54,186,366 - $20.98 (Average)S ource: www.communitystatebank.net, www.1ststatebank.com, www.53.com, www.citizensbanking.com, www.chemicalbankmi.com,www.independentbank.com, www.bank<strong>of</strong>america.com, www.chase.com, www.nationalcity.com* Banking institutions are ranked by their total assets.470
CITY OF SAGINAWSTATISTICAL SECTION2009 DATA
CITY OF SAGINAW, <strong>MI</strong>CHIGANDEMOGRAPHIC STATISTICS1900-2000Population Trends<strong>City</strong> <strong>of</strong> Percent Tri-Cities Percent<strong>Saginaw</strong> Increase Total IncreaseYear Population (Decrease) Population* (Decrease)1900 42,322 0% 78,604 0%1910 50,510 27.25% 84,517 7.52%1920 61,903 143.10% 187,071 100.21%1930 80,715 20.37% 209,341 11.90%1940 82,794 8.08% 232,453 9.94%1950 92,918 17.66% 277,638 19.44%1960 98,265 24.26% 349,244 25.79%1970 91,849 15.20% 400,851 14.78%1980 77,508 3.78% 421,518 5.16%1990 69,512 (7.06) 399,320 (5.27)2000 61,799 (.90) 403,070 .94%Note: Percent change calculation is computed by subtracting the previous year population from the current year population anddividing it by the previous year population. This information is updated every ten (10) years.*Tri-Cities include: <strong>Saginaw</strong>, Bay <strong>City</strong>, and MidlandSource: U.S. Bureau <strong>of</strong> Census: Various Reports; Michigan Manual: Various editions472
CITY OF SAGINAW, <strong>MI</strong>CHIGANDEMOGRAPHIC STATISTICSFOR YEAR ENDED 2009Police InformationPolice Bureau Complement:Crimes by Type:% %2008 2009 Change 2008 2009 ChangeOfficers by Rank: Homicide 23 13 0.57Police Chief 1 1 - Rape 51 47 0.92Deputy Chief 0 0 - Robbery 309 268 0.87Lieutenants 5 5 - Assault- Aggravated 1,126 838 0.74Sergeants 14 14 - Burglary 1,486 1,589 1.07Police Officers 80 82 1.03 Larceny 917 912 0.99Total Police Motor Vehicle Theft 239 167 0.70Bureau Complement: 100 102 2 Arson 225 134 0.60Calls for Service: 69,824 68,624 0.98 Total Crimes by Type: 4,376 3,968 0.91Fire InformationFire Bureau Complement:Calls for Service by Situation Found:2008 2009 Change 2008 2009 ChangePersonnel by Rank:Fire Chief 1 1 - Fire 665 532 3.40Battalion Chiefs 3 3 - Rupture/Explosion 3 2 0.67Fire Captains 7 7 - EMS/Rescue 73 86 1.18Lieutenants 13 12 0.92 Hazardous Condition 511 323 0.63Fire Marshall 1 1 - Service Call 390 216 0.55Deputy Good Intent 376 299 0.80Fire Marshall 1 1 - False Call 276 270 0.98Fire Engineer 20 20 - Other 8 3 0.36Fire Training &Safety Officer 1 1 - Total Calls by Situation: 2,302 1,731 0.75Firefighters 22 22 -Total FireBureau Complement: 69 68 0.99Note: All positions listed for Police & Fire Departments are sworn in positions only.Source: (1) Fire & Police Bureau Complement information retrieved from the <strong>City</strong> <strong>of</strong> <strong>Saginaw</strong>’s 08/09 Personnel Complement(2) Police crimes by type information retrieved from Michigan.gov website, Uniform Crime Reports, 2009 Data(3) Fire department calls by situation information retrieved from <strong>City</strong> <strong>of</strong> <strong>Saginaw</strong>’s Fire Department473
CITY OF SAGINAW, <strong>MI</strong>CHIGANPRINCIPAL REAL ESTATE TAXPAYERSTOP 25 TAXPAYERSAs <strong>of</strong> December 31, 2009OWNER# OF REAL AD SPECIALPERSONALAD SPECIAL TOTAL(TAXPAYER) PARCELS VALOREM ACT ROLLS VALOREM ACT ROLLSConsumers Energy 57 282,679 - 17,851,800 - 18,134,479General Motors LLC 6 - - 7,204,500 6,113,500 13,318,000TRW Integrated- - 7,845,300 - 7,845,300Chassis Systems 3Linear Motion LLC 6 3,316,540 - 1,426,200 538,300 5,281,040Enterprise1 - - 4,671,400 - 4,671,400Automotive SystemsGeneral Motors Corp. 8 4,558,793 - - - 4,558,793Means Industries, Inc. 7 406,460 - - - 406,460Corvus Nodular3,493,544 - - - 3,493,544Interests II, LLC 1SSP Associates, Inc. 13 2,933,199 - 421,900 - 3,355,099C<strong>MI</strong>-Schneible Co. 3 - - 2,412,300 859,900 3,272,200Fullerton Tool Co. Inc. 9 317,856 - 2,155,900 396,600 2,870,356IRG <strong>Saginaw</strong>, LLC 2 2,829,568 - - - 2,829,568Riverfront2,562,167 - 248,200 - 2,810,367Medical Realty 2Charter- - 2,667,600 - 2,667,600Communications II 1Meredith Corporation 3 618,282 - 1,763,300 - 2,381,582Hausbeck Pickle Co. 3 1,283,811 - 1,060,500 - 2,344,311B & W Heat Treating 1 - - 2,322,000 - 2,322,000Rifkin Scrap Iron &343,475 - 950,300 927,300 2,221,075Metal 16Michigan Production692,610 - 1,095,100 - 1,787,710Machine 2Downtown Area1,748,418 - - - 1,748,418Development, LLC 2Citizens Bank1,735,044 - - - 1,735,044<strong>of</strong> <strong>Saginaw</strong> 10Central Foundry 5 1,729,043 - - - 1,729,043Housing & Urban1,591,185 - - - 1,591,185Development 71Reardon Properties 5 970,931 407,606 131,700 - 1,510,237Findlay BrookwoodPark, LTD (DHALP) 11,487,134 - - - 1,487,134TOTALS 238 $ 32,900,739 $ 407,606 $ 54,228,000 $ 8,835,600 $ 96,371,945Note: Information is listed in numerical order according to its rank for Top 25 Taxpayers in <strong>City</strong> <strong>of</strong> <strong>Saginaw</strong>Source: Information provided by <strong>City</strong> <strong>of</strong> <strong>Saginaw</strong>’s <strong>City</strong> Assessor <strong>of</strong> the Department <strong>of</strong> Fiscal Services474
CITY OF SAGINAWGLOSSARY ABBREVIATIONSANDTERMS
_______________________________________________________________________GLOSSARY OF ABBREVIATED TERMS_______________________________________________________________________-A-AASHTOAFSCMEAGAMRARMSAsmt.ATPAAuth.Avg.AWWA-B-B.C.BP-C-CADCCFCDBGCIPCorp.CPOCSO-D-DBODDADP-E-Endow.EP-F-FBIFICAFTFYFYI-G-Gals.GASBGFGFOAGISGMGovt.American Association <strong>of</strong> State Highway and Transportation OfficialsAmerican Federation <strong>of</strong> State, County & Municipal EmployeesAlbert GallatinAutomated Meter ReadingAutomated Record Management SystemAssessmentAutomobile Theft Prevention AuthorityAuthorityAverageAmerican Water Works AssociationBefore ChristBuilding PermitComputer-Aided DesignHundred Cubic FeetCommunity Development Block GrantCapital Improvement PlanCorporationCommunity Policing OfficeCombined Sewage OverflowsDemolition <strong>of</strong> BuildingsDowntown Development AuthorityDemolition PermitEndowmentElectrical PermitFederal Bureau <strong>of</strong> InvestigationFederal Insurance and Compensation ActFull TimeFiscal YearFamily Youth InitiativeGallonsGovernmental Accounting Standards BoardGeneral FundGovernment Finance Officers AssociationGeographical Information SystemGeneral MotorsGovernment476
_______________________________________________________________________GLOSSARY OF ABBREVIATED TERMS_______________________________________________________________________-H-HOMEH.R.H.T.E.-I-IFTInc.ITS-J-J.A.G.-K-KWH-L-Lbs.LDFAL.E.I.N.LELILLC-M-MBSMCLAMDEQMDOTMG<strong>MI</strong>OSHAMPMSPMSU-N-NBANBCNEZNFLNo.NPDESNSFNTUNWUA-P-P.A.P.C.PEGPILOTHome Observation <strong>of</strong> Measurement <strong>of</strong> the EnvironmentHuman ResourcesHarvard Technology EnterpriseIndustrial Facilities TaxIncorporatedIntelligent Transportation SystemJustice Assistance GrantKilowatt HourPoundsLocal Development Finance AuthorityLaw Enforcement Information NetworkLaw Enforcement Leadership InstituteLimited Liability CompanyMidland, Bay <strong>City</strong>, and <strong>Saginaw</strong>Madden Central Leagues AllianceMichigan Department <strong>of</strong> Environmental QualityMichigan Department <strong>of</strong> TransportationMilligramMichigan Occupational Safety and Health AdministrationMechanical PermitMichigan State PoliceMichigan State UniversityNational Basketball AssociationNational Broadcasting CompanyNeighborhood EnterpriseNational Football LeagueNumberNational Pollutant Discharge Elimination SystemNon-Sufficient FundsNumber <strong>of</strong> Transfer UnitsNorthwest Utilities AuthorityPartial AgreementPr<strong>of</strong>essional CorporationPublic, Educational, and GovernmentalPayment in Lieu <strong>of</strong> Taxes477
_______________________________________________________________________GLOSSARY OF ABBREVIATED TERMS_______________________________________________________________________POAMPPPRIDEPTPTO-Q-QVF-R-READRev.RSSIRTBsRV-S-SBCSCADASCATTSCENICSEDCSEIUSGTVSMMWSCSONARSRRFSTARSSVCSVSU-T-Temp.TIFATV-U-UDAAUFCUSAUSDAUS MN-W-WKCQWWIIWWTP-Y-Yr.Police Officers Association <strong>of</strong> MichiganPlumbing PermitPositive Results in a Downtown EnvironmentPart TimePersonal Time OffQuality Voter FilerRead Enjoy And DiscoverRevenueReceived Signal Strength IndicationRetention Treatment BasinsRecreational VehicleSouthwestern Bell CorporationSupervisory Control and Data Acquisition<strong>Saginaw</strong> County Auto Theft Team<strong>Saginaw</strong> Code Enforcement Neighborhood Improvement Cooperative<strong>Saginaw</strong> Economic Development CorporationService Employees International Union<strong>Saginaw</strong> Government TeleVision<strong>Saginaw</strong>-Midland Municipal Water Supply CorporationSound Navigation & RangingSepanta Robotic Research Foundation<strong>Saginaw</strong> Transit Authority Regional ServicesService/Serviced/Servicing<strong>Saginaw</strong> Valley State UniversityTemporaryTax Increment Finance AuthorityTelevisionUnlawfully Driving Away an AutomobileUltimate Fighting ChampionshipUnited States <strong>of</strong> AmericaUnited States Department <strong>of</strong> AgricultureUnited States <strong>of</strong> MinnesotaRadio station networkWorld War TwoWastewater Treatment PlantYear478
GLOSSARY OF TERMSA –ACCRUAL BASIS – The method <strong>of</strong> accounting under which revenues are recorded when they are earned(whether or not cash is received at that time) and expenditures are recorded when goods or services are received(whether or not cash disbursements are made at that time.)ACTIVITIES – Specific services performed to accomplish program objectives and goals.AGENCY FUND – Permanently established endowments where the annual income is used at the discretion <strong>of</strong>the organization in pursuit <strong>of</strong> a particular mandate.ALLOCATION – The assignment or distribution <strong>of</strong> available resources such as revenue, personnel, buildings,and equipment among various <strong>City</strong> departments, bureaus, divisions, or <strong>of</strong>fices.APPROPRIATION – An authorization made by <strong>City</strong> Council, which permits the <strong>City</strong> to incur obligations andto make expenditures or resources.APPROVED (ADOPTED) BUDGET – The revenue and expenditure plan for the <strong>City</strong> for the fiscal year asenacted by <strong>City</strong> Council.ARBITRAGE – Excess investment pr<strong>of</strong>its earned on the investment <strong>of</strong> lower-cost, tax-exempt bond proceeds.ASSESSED VALUATION – The value placed upon real and personal property by the County taxassessor/appraiser as the basis for levying taxes.ASSET – Property owned by the <strong>City</strong> which has monetary value.AUDIT – Prepared by an independent certified public accounting firm, the primary objective <strong>of</strong> an audit is todetermine if the <strong>City</strong>’s general purpose financial statements present fairly the <strong>City</strong>’s financial position andresults <strong>of</strong> operations in conformity with the generally accepted accounting principles.BALANCED BUDGET – Proposed revenues and other resources equal proposed appropriations.B –BOND – A long-term promise to repay a specified amount <strong>of</strong> money (the face value amount <strong>of</strong> the bond) on aparticular date (maturity date). Bonds are primarily used to finance capital projects.BUDGET – A plan <strong>of</strong> financial operation compromised <strong>of</strong> an estimate <strong>of</strong> proposed expenditures for a fiscalyear and the proposed means <strong>of</strong> financing those expenditures to fund <strong>City</strong> services in accordance with adoptedpolicy.479
BUDGET CALENDAR – The schedule <strong>of</strong> key dates or milestones that the <strong>City</strong> follows in the preparation andadoption <strong>of</strong> the budget.BUDGET DOCUMENT – A compilation <strong>of</strong> the spending and funding plans for the various funds, along withsupporting narrative, schedules, tables, and charts which, in total, comprises the annual resource allocation plan.BUDGET ORDINANCE – An ordinance considered and adopted by <strong>City</strong> Council to formally enact theproposed budget as amended.BUDGET TRANSFER - Adjustment made to the budget during the fiscal year to properly account forunanticipated changes which occur in revenues and/or expenditures and for program initiatives approved duringthe fiscal year.BUREAU – The largest organizational component within a department which design is tied to service output orfunction.C –CAPITAL BUDGET – A spending plan for improvements to or acquisition <strong>of</strong> land, facilities, equipment, andinfrastructure. The capital budget (1) balances revenues and expenditures, (2) specifies the sources <strong>of</strong> revenues,(3) lists each project or acquisition, and (4) must ordinarily be approved through adoption <strong>of</strong> an appropriationby the legislative body.CAPITAL EXPENDITURE – The acquisition <strong>of</strong> fixed assets, usually authorized in the capital budget thatincludes land, buildings, infrastructure, and equipment.CAPITAL IMPROVEMENT PLAN (CIP) – A multi-year plan to provide for equipment acquisition,improvement to public facilities, and construction <strong>of</strong> new facilities.CAPITAL OUTLAY – Expenditures relating to the purchase <strong>of</strong> equipment, facility modifications, land, andother fixed assets.CASH BASIS – The method <strong>of</strong> accounting under which revenues are recorded when received in cash andexpenditures are recorded when actually paid.CREDIT RATING – The credit worthiness <strong>of</strong> an entity, as evaluated by independent agencies such asMoody’s Investors Service, Inc. and Standard and Poor’s Corp.D –DEBT SERVICE – Payment <strong>of</strong> interest and principal on an obligation resulting from issuance <strong>of</strong> bonds andnotes.DEBT SERVICE FUND – A fund used to account for the accumulation <strong>of</strong> resources for, and the payment <strong>of</strong>,general long-term debt principal, interest and related costs.DEFICIT – An excess <strong>of</strong> liabilities and reserves <strong>of</strong> a fund over its assets.480
DEPARTMENT – The largest organizational component <strong>of</strong> the <strong>City</strong> which has been assigned overallmanagement responsibility for an operation or a group <strong>of</strong> related operations within a functional area.DESIGNATED FUND BALANCE - A portion <strong>of</strong> unreserved fund balance assigned by <strong>City</strong> policy for aspecific future use.DIRECT COSTS – Expenses that are directly attributable to the production <strong>of</strong> service, such as wages, benefits,supplies, and contract services, and that would be eliminated if the service were discontinued.DIVISION – The largest organizational component within a bureau which design is tied to a specific serviceoutput or function.E –ENCUMBRANCE – A reservation <strong>of</strong> funds for an anticipated expenditure prior to actual payment for an item.ENTERPRISE FUND – A fund used to account for revenues received for goods and services provided to thegeneral public on a continuous basis and primarily financed through user charges.EXPENDITURE – Actual outlay <strong>of</strong> money for goods or services.EXPENSE – Expenditures and other obligations (e.g., encumbrances) to expend money for goods and services.F –FICA – <strong>City</strong>’s portion <strong>of</strong> mandatory Social Security contribution (6.20%) and mandatory Medicare contribution(1.45%) for its employees payable to the federal government.FIDUCIARY FUND – A fund that accounts for resources that governments hold in trust for individuals orother governments.FISCAL YEAR (FY) – A twelve-month period designated as the operating year for an entity. The fiscal yearfor the <strong>City</strong> <strong>of</strong> Harrisburg is January 1 – December 31.FIXED ASSET – Asset <strong>of</strong> a long-term nature such as land, buildings, machinery, furniture, and otherequipment. The <strong>City</strong> has defined fixed assets as those with an expected useful life in excess <strong>of</strong> one year and anacquisition cost in excess <strong>of</strong> $5,000.FRINGE BENEFITS – Health and welfare related benefits for all full-time employees, such as medical,dental, vision, and life insurance coverage, and a prescription drug plan which are included in the employee’scompensation package.FUND – An accounting entity that records all financial transactions for specified activities or governmentfunctions. The six fund types used by the <strong>City</strong> are – General Fund, Capital Projects Fund, Debt Service Fund,Special Revenue Funds, Propriety (Utility) Funds, and Trust and Agency Funds.FUND BALANCE – A cumulative excess <strong>of</strong> revenues over expenditures segregated by fund.481
G –GENERAL OBLIGATION BOND and NOTE – Forms <strong>of</strong> borrowing (debt financing) which reflect writtenpromises from the <strong>City</strong> to repay sums <strong>of</strong> money on specific dates at specified interest rates backed by the fullfaith, credit, and taxing power <strong>of</strong> the municipality.GOVERNMENTAL FUNDS – Funds that account for the services provided to the general citizenry asopposed to a specific group. These funds focus on current financial resources, emphasizing budgetary controland available cash.GRANT – A sum <strong>of</strong> money allotted from a specific governmental or non-pr<strong>of</strong>it organization to be used undercertain circumstances for a designated purpose.I –INDIRECT COSTS – Costs that are incidental to the production <strong>of</strong> goods and services, such as administration,budgeting, accounting, personnel, purchasing, legal, and similar staff support services. Unlike direct costs,indirect costs do not disappear if the service or good is discontinued.Also known as overhead.INFRASTRUCTURE – The basic physical framework or foundation <strong>of</strong> the <strong>City</strong>, referring to its buildings,roads, bridges, sidewalks, water system, and sewer system.INTERFUND TRANSFER – A transfer <strong>of</strong> money from one fund <strong>of</strong> the <strong>City</strong> to another fund <strong>of</strong> the <strong>City</strong>.L –LIABILITY – Debt or other legal obligations arising out <strong>of</strong> transactions in the past which must be paid,renewed, or refunded at some future date.LINE-ITEM BUDGET – A budget that lists detailed expenditure categories such as salary, postage, andmaintenance service contracts. The specific amount budgeted is also listed by category.LONG-TERM DEBT – Debt with a maturity <strong>of</strong> more than one year after date <strong>of</strong> issuance.M –<strong>MI</strong>LL – A taxation unit equal to one dollar <strong>of</strong> tax obligation for every $1,000 <strong>of</strong> assessed valuation <strong>of</strong> property.<strong>MI</strong>LLAGE – The total tax obligation per $1,000 <strong>of</strong> assessed valuation <strong>of</strong> property.MODIFIED ACCRUAL – The method <strong>of</strong> accounting that is a mixture <strong>of</strong> both cash and accrual basesconcepts. Revenues are recorded when they are both measurable and available to meet current liabilities.Expenditures are recorded when goods or services are received.482
N –NOTE – A short-term promise to repay a specified amount <strong>of</strong> money (the face value <strong>of</strong> the note) on a particulardate (maturity date). Notes are primarily used to supplement current cash flow in anticipation <strong>of</strong> taxes and otherrevenues to be received, or to provide interim financing for capital projects in anticipation <strong>of</strong> the issuance <strong>of</strong>bonds.O –OBJECTIVE – A statement <strong>of</strong> purpose defined more specifically than a goal. (A goal may include severalrelated objectives.) An objective normally indicates anticipated levels <strong>of</strong> achievement and is usually timelimited and quantifiable.OPERATING BUDGET – That portion <strong>of</strong> a budget that deals with recurring expenditures such as salaries,electric bills, postage, printing and duplicating, paper supplies, and gasoline.OPERATING EXPENSES – Ongoing costs associated with sustaining <strong>City</strong> government operations such as:communications, pr<strong>of</strong>essional fees, insurance, rentals, maintenance and repairs, contracted services, supplies,and minor capital.ORGANIZATIONAL CHART – A chart representing the authority, responsibility, and relationships amongdepartments, bureaus, and divisions within the <strong>City</strong> organization.PART-TIME POSITION – A position regularly scheduled for no more than 25 hours per week.P –PERFORMANCE-BASED BUDGETING – A method <strong>of</strong> allocating resources to achieve specific objectivesbased on program goals and measured results.PERFORMANCE INDICATOR – A variable measuring the degree <strong>of</strong> goal and objective fulfillment achievedby programs.PERSONNEL SERVICES – Expenditures relating to compensating employees <strong>of</strong> the <strong>City</strong> including wages,salaries, and special pay such as longevity, holiday, vacation, sick, personal, and bereavement; overtime andshift differential; fringe benefits such as FICA, health, and life insurances; and miscellaneous expenditures suchas pension plan contributions, workers’ compensation, and unemployment compensation costs.PROGRAM – An organized set <strong>of</strong> activities directed toward a common purpose or goal that an agencyundertakes or proposes to carry out its responsibilities.PROPERTY TAX RATE – A rate set either by a local governing board or in state law that, when applied tothe tax base (assessed value), represents the property owner’s tax liability.PROPOSED BUDGET – The <strong>City</strong>’s resource allocation plan for the fiscal year as prepared and recommendedby the Mayor for consideration by <strong>City</strong> Council.PROPRIETARY FUND – A fund that accounts for business-like operations that intend to recover their fullcost through charges to customers and users.483
RESOURCE ALLOCATION PLAN – The <strong>City</strong>’s revenue and expenditure plan for the fiscal year.R –REVENUE – Money received or collected by the <strong>City</strong> through taxation, licenses, grants, fees, fines, forfeitures,charges, investments, and interfund transfers.REVENUE BOND – Long-term borrowing that is backed by the revenues from a specific project such as wateror sewer system improvement.REVENUE STABILIZATION RESERVE – Revenue stabilization reserve that provides resources when taxrevenues temporarily decline (as the result <strong>of</strong> a recession, the loss <strong>of</strong> a major taxpayer, or other similarcircumstance).RISK MANAGEMENT – The coordinated and continuous effort to minimize potential financial and humanresource losses arising from workers’ compensation, liability, and property exposures.S –SPECIAL REVENUE FUND – A fund used to account for the proceeds <strong>of</strong> specific revenue sources that arelegally restricted to expenditures for specified purposes.T –TAX BASE – The total value <strong>of</strong> taxable property in the <strong>City</strong>.UNFUNDED LIABILITY – A liability that accrues to a fund for which there is no source <strong>of</strong> revenue.U –UNIT – The smallest organizational component within a bureau, which by design further delineates thedistribution <strong>of</strong> workload to achieve a specific output or function.YIELD – The rate <strong>of</strong> return earned on an investment based on the cost <strong>of</strong> the investment.Y –484
1315 South Washington Avenue, <strong>Saginaw</strong>, <strong>MI</strong> 48601-2599