B. ReproductionDuring reproduction, at each time step the current observationξ = [x,ẋ,F] is used to define a weight factor h irepresenting the influence of the i-th stateh i (ξ t ) =with α i,t =α i,t∑ Kk=1 α , (4)k,t(∑ K)α k,t−1 a ki N(ξ t ; µ i ,Σ i ),k=1where α i,t is the forward variable (defined recursivelythrough the HMM representation) corresponding to the probabilityof partially observing the sequence {ξ 1 ,ξ 2 ,...,ξ t } oflength t and of being in state i at time t, see [16].A target position ˆx and target velocity ˆẋ to attain are thenestimated through Gaussian Mixture Regression (GMR) asˆẋ =ˆx =K∑i=1h i (ξ) ( µ O i + Σ OIi (Σ I i ) −1 (ξ I − µ I i ) ) , (5)K∑h i (ξ)i=1(µ O′i)+ Σ OI′i (Σ I′i ) −1 (ξ I′ − µ I′i ) . (6)One advantage of GMR over other regression approachesis that it does not learn a model for a predetermined setof input and output variables. Instead, the joint distributionof the data is first learned <strong>by</strong> the model through a compactrepresentation encapsulating locally the correlations acrossthe different variables. Regression is then performed <strong>by</strong> specifyingon-the-fly which are the input and output variables, see[13], [14], [17] for details. In the original version of GMR,the weight (4) is computed based on position informationonlyN(ξ; µ i ,Σ i )h i (ξ) = ∑ Kk=1 N(ξ; µ . (7)k,Σ k )We extend here the GMR approach <strong>by</strong> replacing theweight originally computed through the Gaussian MixtureModel (GMM) representation (7) <strong>by</strong> its analogous HiddenMarkov Model (HMM) representation (4), which encapsulatesrobustly the sequential nature of the task.Fig. 2 illustrates the principle of the regression process.From the current position and velocity of the system, a tasklevelproportional-derivative controller similar to a massspring-dampersystem is computed to reach for the desiredvelocity ˆẋ and for the desired position ˆx. 4 The accelerationcommand in task space is determined <strong>by</strong>ẍ =ẍ V{ }} {(ˆẋ − ẋ)κ V +where κ V and κ P are gains defined asκ V = 1 ∆t ,ẍ P{ }} {(ˆx − x)κ P , (8)L(x) = κ κP P max − L(x)max , (9)L max − L min4 Note that this controller also shares similarities with the second-orderdifferential equation defined <strong>by</strong> a Vector Integration To Endpoint (VITE)system [18].withL max = maxi∈{1,K} log ( N(µ x i ;µ x i ,Σ x i ) ) ,L min = min log ( N(x;µ x i ,Σ x i ) ) .i∈{1,K}x∈WIn the above equation, the notation L is used to define loglikelihoods(that correspond to weighted distance measures).κ P max is the maximum gain to attain a target position (κ P max =0.08 has been fixed empirically). W defines the robot’sworkspace, or a predetermined range of situations fixed apriori for the reproduction attempts. ∆t is the duration of aniteration step (a constant ∆t = 0.01 is considered here).At each iteration, κ P (x) is thus close to zero if x is withinthe boundary determined <strong>by</strong> the Gaussian distributions (i.e.confidence bounds defined <strong>by</strong> the centers and covariancematrices). If x is far away from the positions that have beendemonstrated, the system comes back towards the closestGaussian distribution (in a likelihood sense) with a maximumgain of κ P max, still following the trend of motion in this region(determined <strong>by</strong> ˆẋ).Here, velocity and position are updated at each iterationthrough Euler numerical integrationẋ t = ẋ t−∆t + ∆t ẍ , x t = x t−∆t + ∆t ẋ t . (10)Note however that other numerical methods for ordinarydifferential equations can similarly be used here [19]. Aninverse kinematics solution that allows to solve a maintask and simultaneously takes supplementary constraints intoaccount is then used to control the robot in joint space, asdescribed in [20].In (8), ẍ V allows to follow the demonstrated dynamicsand ẍ P prevents the robot from moving far away froman unlearned situation and to come back to an alreadyencountered context if a perturbation occurs. By using bothterms concurrently, the robot follows the learned non-lineardynamics while coming back to a known position if itdeviates from the demonstrated motion and arrives in aportion of the workspace that remains undiscovered. Anillustration of the complete process is presented in Fig. 3. Thefirst row illustrates the process to determine components toreach a desired velocity ˆẋ and a desired position ˆx througha second order dynamical system. The vector fields in thesecond row show the influence of the two commands whenused separately. On the one hand, ẍ V follows the learnedmotion but tends to move away from the demonstrationsafter a few iterations or <strong>by</strong> starting from an unexploredposition. On the other hand, ẍ P moves toward the closestpoint of the generalized trajectory. The vector field in thelast row shows the reproduction behavior when consideringboth commands simultaneously. The final controller followsthe demonstrated dynamics and prevents the robot frommoving away from an unlearned situation <strong>by</strong> coming backto an already encountered position if it deviates from thedemonstrated motion.Fig. 4 illustrates the influence of the variability observedduring demonstrations for the reproduction attempts. It also
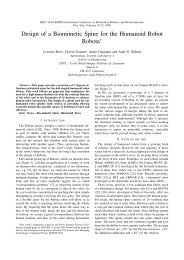
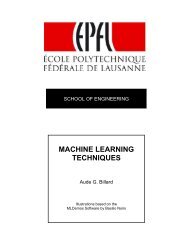
x0.40.30.20.1F10506Robot is leadingRobot is following0−0.10 2 4 6t−50 2 4 6tẋ42660ẋ8 x 10⁻³ 42xẋ8 x 10⁻³ F42−28 x 10 −3 F−5 0 5 1000−2−0.1 0 0.1 0.2 0.3 0.4−2−5 0 5 10Fig. 6. Illustration of the changes of correlations between force F andvelocity ẋ along the task. The trajectories in black and grey representrespectively the cases where the robot is leading and following.ẋ8 x 10⁻³ 6420−2−0.1 0 0.1 0.2 0.3 0.4xẋ86420−2−5 0 5 10x 10−3FF1086420ẋ43215 x 10−3 tFig. 5. Demonstrations of the <strong>collaborative</strong> task to the robot (first tworows) and associated HMM model (last row). The 5 trajectories in blackand the 5 trajectories in grey represent respectively the demonstrations ofthe robot acting as a leader and as a follower. The points represent thebeginning of the motions.shows the evolution of the adaptive gain κ P defined in (9)along the task.IV. EXPERIMENTAL RESULTSThis experiment aims at validating that the proposedmodel can distinguish stereotypical following and leadingbehaviors (i.e. where the user is explicitly told to follow oneor the other behavior along the task) and that the model canlead to different controllers during reproduction. This is afirst step to determine if the proposed model could address infurther work more complex types of behaviors (and switchingacross those). We assessed the robustness of the proposedsystem in the series of simulations where different possibleinput force profiles are fed into the system to modulate thekinematic behavior of the robot.Fig. 5 shows the demonstrations provided to the robot(first and second row) and the associated HMM models (lastrow). The dataset and model of the robot acting as a leader(conversely the user acting as a follower) are representedin black line. The dataset and model of the robot actingas a follower (conversely the user acting as a leader) arerepresented in grey line. In the fourth graph, we see that thecorrelations between ẋ and F change along the motion. Inthe two situations (leading and following), the correlationscan be roughly decomposed into three parts correspondingto the beginning of the motion (user/robot initiating thex−20 2 4 6 80.30.250.20.150.10.050−0.050 2 4 6 8ttx00 2 4 6 80.40.30.20.10−0.10 2 4 6Fig. 7. Reproduction attempts in the case of perturbed force signals (firstthree graphs) and <strong>by</strong> starting from different initial positions (last graph).task), middle of the motion (user and robot lifting the objecttogether) and end of the motion (user/robot notifying theend the task), see also Fig. 6. The first and last datapointsare characterized <strong>by</strong> a force and velocity close to zero (ormoving towards zero). The non-linearities observed alongthe task show that approximating the <strong>collaborative</strong> behaviorwith a system of constant damping factor (i.e. linear relationbetween force and velocity) would be inefficient to model the<strong>collaborative</strong> behaviors. We see in the last graph that HMMscan encapsulate compactly and efficiently these differentcorrelations along the motion (two HMMs with 5 states havebeen used here for the leading and following cases).Fig. 7 shows reproduction attempts highlighting the robustnessof the system to temporal and spatial variability.To highlight the generalization capabilities of the systemin terms of temporal variations, the force signal recordedduring one of the demonstration (when the robot acts asa follower) is used to simulate the force input during areproduction attempt. These results are represented in solidt8