2012 Jiva April Cover 220 GSM Art Card Glossy ... - Jivaonline.net
2012 Jiva April Cover 220 GSM Art Card Glossy ... - Jivaonline.net
2012 Jiva April Cover 220 GSM Art Card Glossy ... - Jivaonline.net

You also want an ePaper? Increase the reach of your titles
YUMPU automatically turns print PDFs into web optimized ePapers that Google loves.
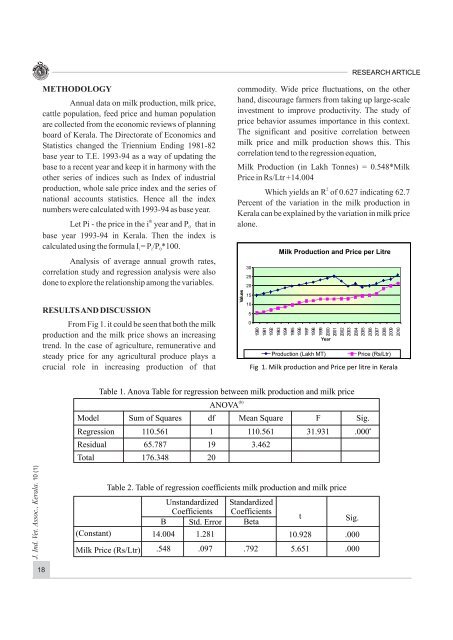
RESEARCH ARTICLEMETHODOLOGYAnnual data on milk production, milk price,cattle population, feed price and human populationare collected from the economic reviews of planningboard of Kerala. The Directorate of Economics andStatistics changed the Triennium Ending 1981-82base year to T.E. 1993-94 as a way of updating thebase to a recent year and keep it in harmony with theother series of indices such as Index of industrialproduction, whole sale price index and the series ofnational accounts statistics. Hence all the indexnumbers were calculated with 1993-94 as base year.thLet Pi - the price in the i year and P0that inbase year 1993-94 in Kerala. Then the index iscalculated using the formula I = P /P *100.i i 0Analysis of average annual growth rates,correlation study and regression analysis were alsodone to explore the relationship among the variables.commodity. Wide price fluctuations, on the otherhand, discourage farmers from taking up large-scaleinvestment to improve productivity. The study ofprice behavior assumes importance in this context.The significant and positive correlation betweenmilk price and milk production shows this. Thiscorrelation tend to the regression equation,Milk Production (in Lakh Tonnes) = 0.548*MilkPrice in Rs/Ltr +14.0042Which yields an R of 0.627 indicating 62.7Percent of the variation in the milk production inKerala can be explained by the variation in milk pricealone.302520Milk Production and Price per LitreRESULTS AND DISCUSSIONFrom Fig 1. it could be seen that both the milkproduction and the milk price shows an increasingtrend. In the case of agriculture, remunerative andsteady price for any agricultural produce plays acrucial role in increasing production of thatValues151050199019911992199319941995199619971998199920002001200<strong>220</strong>032004200520062007200820092010YearProduction (Lakh MT)Price (Rs/Ltr)Fig 1. Milk production and Price per litre in KeralaTable 1. Anova Table for regression between milk production and milk price(b)ANOVAModel Sum of Squares df Mean Square F Sig.aRegression 110.561 1 110.561 31.931 .000Residual 65.787 19 3.462Total 176.348 20J. Ind. Vet. Assoc., Kerala. 10 (1)Table 2. Table of regression coefficients milk production and milk priceUnstandardized StandardizedCoefficients CoefficientsB Std. Error BetatSig.(Constant)Milk Price (Rs/Ltr)14.004.5481.281.097 .79210.9285.651.000.00018