23 Assessing and Mitigating the Impacts of Road Network Unreliability
23 Assessing and Mitigating the Impacts of Road Network Unreliability
23 Assessing and Mitigating the Impacts of Road Network Unreliability

Create successful ePaper yourself
Turn your PDF publications into a flip-book with our unique Google optimized e-Paper software.
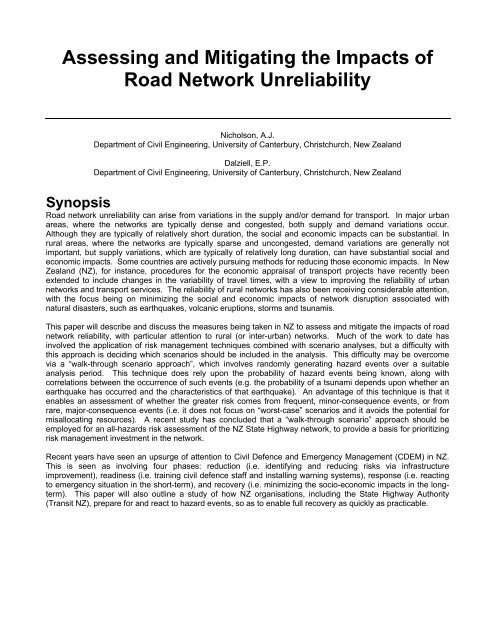
<strong>Assessing</strong> <strong>and</strong> <strong>Mitigating</strong> <strong>the</strong> <strong>Impacts</strong> <strong>of</strong><strong>Road</strong> <strong>Network</strong> <strong>Unreliability</strong>Nicholson, A.J.Department <strong>of</strong> Civil Engineering, University <strong>of</strong> Canterbury, Christchurch, New Zeal<strong>and</strong>Dalziell, E.P.Department <strong>of</strong> Civil Engineering, University <strong>of</strong> Canterbury, Christchurch, New Zeal<strong>and</strong>Synopsis<strong>Road</strong> network unreliability can arise from variations in <strong>the</strong> supply <strong>and</strong>/or dem<strong>and</strong> for transport. In major urbanareas, where <strong>the</strong> networks are typically dense <strong>and</strong> congested, both supply <strong>and</strong> dem<strong>and</strong> variations occur.Although <strong>the</strong>y are typically <strong>of</strong> relatively short duration, <strong>the</strong> social <strong>and</strong> economic impacts can be substantial. Inrural areas, where <strong>the</strong> networks are typically sparse <strong>and</strong> uncongested, dem<strong>and</strong> variations are generally notimportant, but supply variations, which are typically <strong>of</strong> relatively long duration, can have substantial social <strong>and</strong>economic impacts. Some countries are actively pursuing methods for reducing those economic impacts. In NewZeal<strong>and</strong> (NZ), for instance, procedures for <strong>the</strong> economic appraisal <strong>of</strong> transport projects have recently beenextended to include changes in <strong>the</strong> variability <strong>of</strong> travel times, with a view to improving <strong>the</strong> reliability <strong>of</strong> urbannetworks <strong>and</strong> transport services. The reliability <strong>of</strong> rural networks has also been receiving considerable attention,with <strong>the</strong> focus being on minimizing <strong>the</strong> social <strong>and</strong> economic impacts <strong>of</strong> network disruption associated withnatural disasters, such as earthquakes, volcanic eruptions, storms <strong>and</strong> tsunamis.This paper will describe <strong>and</strong> discuss <strong>the</strong> measures being taken in NZ to assess <strong>and</strong> mitigate <strong>the</strong> impacts <strong>of</strong> roadnetwork reliability, with particular attention to rural (or inter-urban) networks. Much <strong>of</strong> <strong>the</strong> work to date hasinvolved <strong>the</strong> application <strong>of</strong> risk management techniques combined with scenario analyses, but a difficulty withthis approach is deciding which scenarios should be included in <strong>the</strong> analysis. This difficulty may be overcomevia a “walk-through scenario approach”, which involves r<strong>and</strong>omly generating hazard events over a suitableanalysis period. This technique does rely upon <strong>the</strong> probability <strong>of</strong> hazard events being known, along withcorrelations between <strong>the</strong> occurrence <strong>of</strong> such events (e.g. <strong>the</strong> probability <strong>of</strong> a tsunami depends upon whe<strong>the</strong>r anearthquake has occurred <strong>and</strong> <strong>the</strong> characteristics <strong>of</strong> that earthquake). An advantage <strong>of</strong> this technique is that itenables an assessment <strong>of</strong> whe<strong>the</strong>r <strong>the</strong> greater risk comes from frequent, minor-consequence events, or fromrare, major-consequence events (i.e. it does not focus on “worst-case” scenarios <strong>and</strong> it avoids <strong>the</strong> potential formisallocating resources). A recent study has concluded that a “walk-through scenario” approach should beemployed for an all-hazards risk assessment <strong>of</strong> <strong>the</strong> NZ State Highway network, to provide a basis for prioritizingrisk management investment in <strong>the</strong> network.Recent years have seen an upsurge <strong>of</strong> attention to Civil Defence <strong>and</strong> Emergency Management (CDEM) in NZ.This is seen as involving four phases: reduction (i.e. identifying <strong>and</strong> reducing risks via infrastructureimprovement), readiness (i.e. training civil defence staff <strong>and</strong> installing warning systems), response (i.e. reactingto emergency situation in <strong>the</strong> short-term), <strong>and</strong> recovery (i.e. minimizing <strong>the</strong> socio-economic impacts in <strong>the</strong> longterm).This paper will also outline a study <strong>of</strong> how NZ organisations, including <strong>the</strong> State Highway Authority(Transit NZ), prepare for <strong>and</strong> react to hazard events, so as to enable full recovery as quickly as practicable.
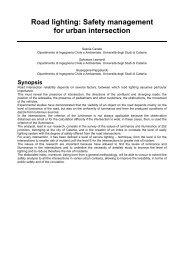
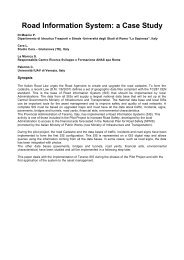
<strong>Assessing</strong> <strong>and</strong> <strong>Mitigating</strong> <strong>the</strong> <strong>Impacts</strong> <strong>of</strong><strong>Road</strong> <strong>Network</strong> <strong>Unreliability</strong>INTRODUCTIONHistorical ReviewDuring <strong>the</strong> last 20-30 years <strong>the</strong>re has been growing concern about ‘lifeline systems’ (e.g. water supply, energysupply, sewage disposal, communication, <strong>and</strong> transportation systems) <strong>and</strong> <strong>the</strong>ir vulnerability to damage <strong>and</strong>disruption during major disasters, such as earthquakes, tsunamis <strong>and</strong> storms. While lifeline engineering initiallyfocused on considering each lifeline system in isolation, a study <strong>of</strong> <strong>the</strong> inter-dependence <strong>of</strong> lifeline systems(Centre for Advanced Engineering, 1991; Hopkins et al. 1991) found that <strong>the</strong> transportation system is <strong>the</strong> mostimportant lifeline system, because <strong>the</strong> restoration <strong>of</strong> virtually all o<strong>the</strong>r lifeline systems depends on people <strong>and</strong>equipment being able to move to <strong>the</strong> sites where damage has occurred, <strong>and</strong> damage to <strong>the</strong> transportationsystem inhibits repairs to <strong>the</strong> o<strong>the</strong>r lifeline systems.Lifeline engineering also initially focused on reducing <strong>the</strong> expected costs <strong>of</strong> repairs to lifeline systems, throughrelocating <strong>the</strong> services <strong>and</strong> streng<strong>the</strong>ning selected components. However, <strong>the</strong>se costs are likely to be smallerthan <strong>the</strong> o<strong>the</strong>r costs, such as <strong>the</strong> cost <strong>of</strong> temporary works <strong>and</strong> increased user costs during <strong>the</strong> period <strong>of</strong>disruption. For instance, one study found that <strong>the</strong> cost <strong>of</strong> temporary work (e.g. upgrading an alternative route fordiverted vehicular traffic, construction <strong>of</strong> a temporary bridge to carry water, sewage, etc.) was 50% greater than<strong>the</strong> cost <strong>of</strong> replacing a highway bridge washed away during a storm (Works Consultancy Services 1990).Yee et al. (1996) studied how <strong>the</strong> 1994 Los Angeles (Northridge) earthquake, which closed highways thatcarried some <strong>of</strong> <strong>the</strong> highest daily traffic volumes in <strong>the</strong> world, affected user costs. They found that even after <strong>the</strong>establishment <strong>of</strong> detours around closed highway facilities <strong>and</strong> carpool lanes, <strong>and</strong> <strong>the</strong> enhancement <strong>of</strong> rail <strong>and</strong>bus services, <strong>the</strong> cost <strong>of</strong> motorist delay associated with <strong>the</strong> closure <strong>of</strong> just one facility (Interstate Highway 10)was almost US$1 million per day.This estimate <strong>of</strong> <strong>the</strong> increased user cost excluded <strong>the</strong> socio-economic costs due to <strong>the</strong> disruption <strong>of</strong> commercialtraffic movements <strong>and</strong> business, <strong>and</strong> <strong>the</strong>se costs are likely to be much greater than <strong>the</strong> direct cost <strong>of</strong> replacingdamaged infrastructure. For instance, <strong>the</strong> business interruption losses resulting from <strong>the</strong> collapse <strong>of</strong> <strong>the</strong> WorldTrade Center buildings have been estimated [Münchener Rück, 2001] to “far exceed” <strong>the</strong> cost <strong>of</strong> <strong>the</strong> propertylosses (i.e. <strong>the</strong> cost <strong>of</strong> replacing <strong>the</strong> structures <strong>and</strong> <strong>the</strong> equipment <strong>and</strong> supplies in <strong>the</strong> structures).The economies in developed countries depend heavily on <strong>the</strong>ir transportation systems, <strong>and</strong> that dependence isincreasing due to <strong>the</strong> adoption <strong>of</strong> "just-in-time" production methods, which involve reducing <strong>the</strong> space <strong>and</strong>investment associated with goods storage <strong>and</strong> relying on a high quality transport service. Surveys <strong>of</strong>transportation system users (e.g. Parkhurst et al. [1992]) have shown that while <strong>the</strong> quality <strong>of</strong> service embracesa wide range <strong>of</strong> service attributes, one <strong>of</strong> <strong>the</strong> most important is reliability. Parkhurst et al. found that userscommonly mentioned unreliability, <strong>and</strong> <strong>the</strong> consequent variability <strong>and</strong> unpredictability <strong>of</strong> travel times, as anegative service attribute. Hence, <strong>the</strong> reliability <strong>of</strong> transport networks is becoming an increasingly importantissue.Sources <strong>of</strong> <strong>Unreliability</strong>Nicholson <strong>and</strong> Du [1997] suggest unreliability can be considered to arise from two distinctly different sources;dem<strong>and</strong> (or flow) variations <strong>and</strong> supply (or capacity) variations. Figure 1 shows that for an arc with capacity xBa0B,<strong>the</strong> travel time varies as a result <strong>of</strong> arc flow variation. The travel time varies about tBa2B (corresponding to an arcflow vBaB=vBa2B), between a lower bound tBa3B (corresponding to <strong>the</strong> lower bound arc flow vBa3B) <strong>and</strong> an upper bound tBa1B*(corresponding to <strong>the</strong> upper bound arc flow vBa1B). Figure 2 shows that for an arc with flow vBaPBP, <strong>the</strong> travel timevaries as a result <strong>of</strong> arc capacity variation. The travel time again varies about tBa2 B(corresponding to an arccapacity xBaB=xBa1B), between a lower bound tBa3B (corresponding to <strong>the</strong> upper bound arc capacity xBa0B) <strong>and</strong> an upperbound tBa1B (corresponding to <strong>the</strong> lower bound arc capacity xBa2B).
Figure 1: Arc Flow VariationFigure 2: Arc Capacity VariationIn reality, travel time variation can arise from ei<strong>the</strong>r or both sources, <strong>and</strong> it is not always an easy matter toidentify <strong>the</strong> separate effects <strong>of</strong> flow <strong>and</strong> capacity variations. For instance, if an accident occurs during <strong>the</strong> earlypart <strong>of</strong> a peak period <strong>and</strong> results in a road being partly blocked, it may well be difficult to separate <strong>the</strong> effect <strong>of</strong><strong>the</strong> capacity reduction <strong>and</strong> <strong>the</strong> increasing traffic flow. In major urban areas, where <strong>the</strong> networks are typicallydense <strong>and</strong> congested, both supply <strong>and</strong> dem<strong>and</strong> variations can readily occur. Although such variations in urbanareas are typically <strong>of</strong> relatively short duration, <strong>the</strong> social <strong>and</strong> economic impacts can be substantial. In rural areas,however, where <strong>the</strong> networks are typically sparse <strong>and</strong> uncongested, dem<strong>and</strong> variations are generally notimportant, but supply variations, which can well be <strong>of</strong> relatively long duration, can have substantial social <strong>and</strong>economic impacts.The main focus <strong>of</strong> transportation network reliability research has been upon reducing <strong>the</strong> impact <strong>of</strong> arc capacityvariations. This is probably because <strong>the</strong>re are authorities that are responsible for managing transportationnetworks <strong>and</strong> are expected to minimise <strong>the</strong> frequency <strong>and</strong> consequence <strong>of</strong> such events. However, travel time
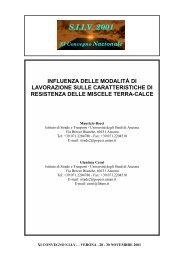
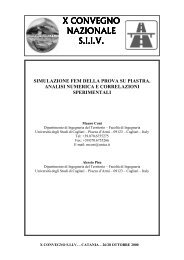
variations associated with variations in travel dem<strong>and</strong> are <strong>the</strong> result <strong>of</strong> decisions made by many individualtravellers, <strong>and</strong> are thus less amenable to reduction via direct intervention.In some countries (e.g. New Zeal<strong>and</strong>), <strong>the</strong> reliability <strong>of</strong> rural networks has also been receiving considerablestudy, with <strong>the</strong> focus being on minimizing <strong>the</strong> social <strong>and</strong> economic impacts <strong>of</strong> network disruption associated withnatural hazards (e.g. earthquakes, volcanic eruptions, storms <strong>and</strong> tsunamis), for which <strong>the</strong> duration <strong>of</strong> disruptionmay be measured in weeks or months. One such study is briefly described later. More recently, however, <strong>the</strong>reliability <strong>of</strong> urban networks has also been receiving much attention, <strong>and</strong> one such study is also briefly describedlater. Although <strong>the</strong> duration <strong>of</strong> disruption might be relatively short (i.e. measured in minutes or hours), <strong>the</strong>frequency <strong>of</strong> such events, <strong>and</strong> <strong>the</strong> number <strong>of</strong> users involved may well mean that <strong>the</strong> socio-economic impactsmight exceed those <strong>of</strong> major disasters.Mitigation OptionsThere are various methods for mitigating <strong>the</strong> effects <strong>of</strong> supply <strong>and</strong>/or dem<strong>and</strong> variations <strong>and</strong> improving networkreliability. They include [Nicholson <strong>and</strong> Du, 1994]:• improving component reliability (e.g. replacing or streng<strong>the</strong>ning bridges);• improving <strong>the</strong> network configuration (e.g. constructing new links);• having st<strong>and</strong>-by components, which are activated after degradation <strong>of</strong> <strong>the</strong> original component (e.g.Bailey bridges, emergency air-ferry services);• monitoring critical components, to detect degradation <strong>and</strong> advise users <strong>of</strong> alternatives;• undertaking regular preventive maintenance;• identifying priorities for repairing degraded components to minimise <strong>the</strong> socio-economic impacts, <strong>and</strong>optimally deploying resources for repair work.Lifeline engineering has traditionally focused upon <strong>the</strong> first option, but Goodwin [1992] suggested pursuing <strong>the</strong>second option. He proposed <strong>the</strong> concept <strong>of</strong> a “quality margin” in transport, akin to a margin <strong>of</strong> safety, suggestingthat transport planners “should deliberately allow for spare capacity in <strong>the</strong> system, some redundancy — someinefficiency, in a sense — in order to enjoy benefits that are not measured by maximum production”. There isdoubt, however, regarding <strong>the</strong> practicability <strong>of</strong> increasing reliability by providing spare capacity, because <strong>of</strong> <strong>the</strong>tendency for transportation system to function like queueing systems.Queueing <strong>the</strong>ory has been applied to <strong>the</strong> analysis <strong>of</strong> traffic flow at intersections <strong>and</strong> along links for many years(e.g. Gerlough <strong>and</strong> Huber [1975]), with <strong>the</strong> emphasis being upon estimating <strong>the</strong> mean travel time or delay forusers. One <strong>of</strong> <strong>the</strong> simplest queueing <strong>the</strong>ory models is <strong>the</strong> M/M/1 model, where traffic arrives according to aPoisson process (i.e. <strong>the</strong> headways between vehicles are negative exponentially distributed), <strong>the</strong> service times(i.e. <strong>the</strong> times spent at <strong>the</strong> head <strong>of</strong> <strong>the</strong> queue before a suitable gap occurs in <strong>the</strong> priority flow) are also negativeexponentially distributed, <strong>and</strong> <strong>the</strong>re is one service channel (i.e. one approach lane for <strong>the</strong> non-priority flow).According to Wolff [1988], for such a system <strong>the</strong> total travel time (i.e. <strong>the</strong> time from joining <strong>the</strong> queue until beingable to join or cross <strong>the</strong> priority flow) will vary according to <strong>the</strong> negative exponential distribution, where <strong>the</strong>parameter is <strong>the</strong> mean service rate (µ) minus <strong>the</strong> mean arrival rate (λ), for λ < µ. That is, <strong>the</strong> mean travel time2equals [1/(µ-λ)] <strong>and</strong> <strong>the</strong> variance <strong>of</strong> <strong>the</strong> travel time equals [1/(µ-λ)P P]. As <strong>the</strong> mean arrival rate (λ) increases <strong>and</strong>approaches <strong>the</strong> mean service rate (µ), both <strong>the</strong> mean travel time <strong>and</strong> <strong>the</strong> variance <strong>of</strong> <strong>the</strong> travel time increasetowards infinity. It can be seen from <strong>the</strong> expressions that <strong>the</strong> variance will increase more rapidly than <strong>the</strong> mean.Figure 3 shows how <strong>the</strong> mean <strong>and</strong> variance <strong>of</strong> <strong>the</strong> travel time increase as <strong>the</strong> traffic intensity ρ (=λ/µ) increases.It can be seen in Figure 3 that <strong>the</strong> mean travel time starts to increase much more rapidly once <strong>the</strong> traffic intensityρ exceeds about 80%, <strong>and</strong> it is thus common practice when designing transport facilities to define <strong>the</strong> practicalcapacity <strong>of</strong> such a system to be 80% <strong>of</strong> <strong>the</strong> <strong>the</strong>oretical capacity (e.g. Austroads [1988]). This implies a safetymargin <strong>of</strong> 20%. It can also be seen in Figure 3 that for ρ less than 60%, <strong>the</strong> variance <strong>of</strong> <strong>the</strong> travel time is verysimilar to <strong>the</strong> mean travel time, but <strong>the</strong> variance starts to increase much more rapidly once <strong>the</strong> traffic intensity ρexceeds about 60%. If one was to design to keep <strong>the</strong> ratio <strong>of</strong> <strong>the</strong> variance to <strong>the</strong> mean low (less than unity, say),to achieve a high level <strong>of</strong> reliability, <strong>the</strong> practical capacity would be only about 60% <strong>of</strong> <strong>the</strong> <strong>the</strong>oretical capacity.This implies that <strong>the</strong> safety margin should be about 40% (or about double that commonly used at present).While it has been shown, for a simple M/M/1 queueing system, that <strong>the</strong> traffic intensity at which <strong>the</strong> travel timevariance starts to increase rapidly is markedly lower than <strong>the</strong> traffic intensity at which <strong>the</strong> mean travel time startsto increase rapidly, it seems likely that this will also apply for <strong>the</strong> more complex queueing systems used foranalysing some traffic flow situations.
MeanVariance353025201510500 0.2 0.4 0.6 0.8 1Figure 3: Mean <strong>and</strong> Variance <strong>of</strong> Travel Time Versus Traffic IntensityThe mean arrival <strong>and</strong> service rates reflect <strong>the</strong> dem<strong>and</strong> <strong>and</strong> supply, respectively, while <strong>the</strong> travel time represents<strong>the</strong> average ra<strong>the</strong>r than <strong>the</strong> marginal travel cost. In <strong>the</strong> absence <strong>of</strong> a mechanism for ensuring <strong>the</strong> marginal travelcost equals <strong>the</strong> marginal utility, it is difficult to see how maintaining such a large safety margin as 40% could beachieved, as <strong>the</strong> provision <strong>of</strong> such a large margin will lead to lower mean travel times <strong>and</strong> thus greater usage.That is, designing for a large quality margin, as proposed by Goodwin [1992], is unlikely to lead to greaterreliability, unless we can ensure equality <strong>of</strong> <strong>the</strong> marginal costs <strong>and</strong> utilities (via congestion pricing, say).In New Zeal<strong>and</strong>, it is common to categorise mitigation options as follows:• reduction (i.e. identifying <strong>and</strong> reducing risks via infrastructure improvement);• readiness (i.e. training civil defence staff <strong>and</strong> installing warning systems);• response (i.e. reacting to emergency situation in <strong>the</strong> short-term);• recovery (i.e. minimizing <strong>the</strong> socio-economic impacts in <strong>the</strong> long-term).Reduction options (e.g. improving component reliability <strong>and</strong> network configuration, undertaking regularpreventive maintenance) have been <strong>the</strong> primary focus <strong>of</strong> mitigation effort in <strong>the</strong> past, but <strong>the</strong>re has recently beena shift towards readiness options (including deploying st<strong>and</strong>-by components for activation after degradation <strong>of</strong><strong>the</strong> original component), response options (e.g. monitoring critical components <strong>and</strong> advising users <strong>of</strong>degradation <strong>and</strong> alternatives travel options), <strong>and</strong> recovery options (e.g. identifying priorities for repairingdegraded components to minimise <strong>the</strong> socio-economic impacts).INTER-URBAN HIGHWAY NETWORKSCentral North Isl<strong>and</strong> <strong>Network</strong> StudyThis network includes <strong>the</strong> Desert <strong>Road</strong> section <strong>of</strong> State Highway 1, which is <strong>the</strong> main route between Wellington(<strong>the</strong> capital) <strong>and</strong> Auckl<strong>and</strong> (<strong>the</strong> largest urban area), <strong>and</strong> carries <strong>the</strong> bulk <strong>of</strong> <strong>the</strong> traffic between those two cities(<strong>and</strong> between o<strong>the</strong>r urban areas). It is a two-lane two-way highway, carrying about 4000 vehicles/day, withabout 15% being heavy commercial vehicles. The Desert <strong>Road</strong> is New Zeal<strong>and</strong>’s highest section <strong>of</strong> StateHighway, reaching an elevation <strong>of</strong> 1130 metres above sea level, <strong>and</strong> it lies largely within a seismically active <strong>and</strong>ecologically-sensitive area, with three active volcanoes close by on <strong>the</strong> western side.This study involved using st<strong>and</strong>ard risk evaluation <strong>and</strong> management methods, <strong>and</strong> <strong>the</strong> first step was to identify<strong>the</strong> hazards, which were found to be:• snow <strong>and</strong> ice formation;• ash fall during volcanic eruptions;• lahar damage to roads <strong>and</strong> bridges;• earthquake damage to roads <strong>and</strong> bridges;• motor vehicle accidents.
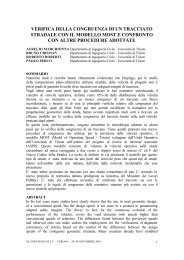
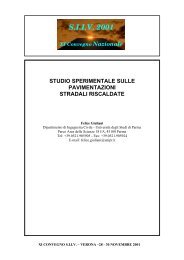
The next step was to estimate, for each hazard, both <strong>the</strong> probability <strong>and</strong> <strong>the</strong> consequence <strong>of</strong> its occurrence. Theconsequence includes <strong>the</strong> cost <strong>of</strong> any remedial work (e.g. bridge repairs or replacement) <strong>and</strong> <strong>the</strong> economic costborne by users whose travel is affected. The user costs will depend on <strong>the</strong> closure duration, as well as <strong>the</strong>availability <strong>of</strong> alternative routes <strong>and</strong> cost <strong>of</strong> diverting (or loss <strong>of</strong> utility if users cancel or postpone <strong>the</strong>ir travel).It was necessary to derive a frequency distribution <strong>of</strong> closure duration for each hazard. This was done using amixture <strong>of</strong> historical information about <strong>the</strong> probability <strong>of</strong> events <strong>and</strong> an underst<strong>and</strong>ing <strong>of</strong> <strong>the</strong> generatingmechanisms <strong>of</strong> each <strong>of</strong> <strong>the</strong> hazards, plus Monte Carlo simulation (see Dalziell [1998] for details).The closure costs depend on <strong>the</strong> reason for closure, because <strong>of</strong> correlation between route conditions (i.e.whe<strong>the</strong>r open or closed) in <strong>the</strong> network, particularly for events (e.g. major earthquakes or volcanic eruptions)where <strong>the</strong> effects are likely to be geographically wide-spread. It was <strong>the</strong>refore necessary to allow for <strong>the</strong>simultaneous closing <strong>of</strong> <strong>the</strong> Desert <strong>Road</strong> <strong>and</strong> <strong>the</strong> nearby alternative north-south route (State Highway 4) <strong>and</strong>connecting routes (Figure 4). There are three more distant alternative north-south routes, which were includedin <strong>the</strong> network used for estimating <strong>the</strong> cost <strong>of</strong> link closures (Figure 4), but <strong>the</strong> probability that <strong>the</strong>y will also beclosed was deemed negligible. A total <strong>of</strong> 22 closure scenarios (i.e. combinations <strong>of</strong> <strong>the</strong> Desert <strong>Road</strong> with zero ormore <strong>of</strong> <strong>the</strong> nearby alternative roads being closed) were considered.In addition to considering <strong>the</strong> dependence <strong>of</strong> route conditions, it was necessary to consider <strong>the</strong> interactionsbetween <strong>the</strong> different hazards (i.e. whe<strong>the</strong>r <strong>the</strong> occurrence <strong>of</strong> one hazard affects <strong>the</strong> occurrence <strong>of</strong> ano<strong>the</strong>rhazard). Interactions can be ‘two-way’ or ‘one-way’ (e.g. snow <strong>and</strong> ice may increase <strong>the</strong> probability <strong>of</strong> a trafficaccident occurring, but a traffic accident will have no effect on <strong>the</strong> probability <strong>of</strong> snow <strong>and</strong> ice forming). They canaffect probabilities <strong>and</strong>/or consequences (e.g. snow or ice may have no effect on <strong>the</strong> probability <strong>of</strong> a volcaniceruption, but may make a lahar larger <strong>and</strong> more destructive).The SATURN computer model was used to estimate traffic flows within <strong>the</strong> network, which included all towns in<strong>the</strong> region <strong>and</strong> roads used for travel through <strong>the</strong> region <strong>and</strong>/or between <strong>the</strong> towns in <strong>the</strong> region. All <strong>the</strong> roads aretwo-lane two-way highways, carrying between 500 <strong>and</strong> 5000 vehicles/day (i.e. <strong>the</strong> network is not congested). Auser-optimal equilibrium traffic assignment was used, with <strong>the</strong> route choice depending on <strong>the</strong> time <strong>and</strong> distancecosts, while <strong>the</strong> total cost <strong>of</strong> road closures was assumed to be <strong>the</strong> sum <strong>of</strong>:• <strong>the</strong> change in <strong>the</strong> vehicle operating <strong>and</strong> occupant time cost;• <strong>the</strong> lost user benefit from those trips that are cancelled or suppressed;• <strong>the</strong> change in <strong>the</strong> accident cost (based on accidents being proportional to <strong>the</strong> vehicle-km <strong>of</strong> travel oneach link).When some links in <strong>the</strong> network are closed, trips using those links have to be redistributed to o<strong>the</strong>r routes, <strong>and</strong><strong>the</strong> costs on <strong>the</strong> new routes will exceed <strong>the</strong> costs on <strong>the</strong> original routes, provided <strong>the</strong>re is no change in <strong>the</strong>numbers <strong>of</strong> trips between <strong>the</strong> zones. As <strong>the</strong> price <strong>of</strong> making a trip increases, however, some travellers may wellfind that <strong>the</strong> new cost <strong>of</strong> travel exceeds <strong>the</strong> utility derived from making <strong>the</strong> trip, <strong>and</strong> will cancel <strong>the</strong>ir trip. Thiswas modelled using <strong>the</strong> elastic assignment procedure available in SATURN, with <strong>the</strong> number <strong>of</strong> trips beingrelated to <strong>the</strong> cost according to <strong>the</strong> power relationship:PT Cij = TOij(COij/ CCij)where TBCijB <strong>and</strong> CBCijB are <strong>the</strong> number <strong>of</strong> trips <strong>and</strong> <strong>the</strong> travel cost (respectively) between an origin zone i <strong>and</strong> adestination zone j when one or more road links are closed, TBOijB <strong>and</strong> CBOijB are <strong>the</strong> corresponding number <strong>of</strong> trips<strong>and</strong> travel cost when all links are open, <strong>and</strong> P is <strong>the</strong> elasticity parameter. Now CBCijB will be greater than CBOijB for anuncongested network, <strong>and</strong> hence TBCijB will be less than TBOij Bprovided P is greater than zero. A good agreementbetween <strong>the</strong> predicted link flows with <strong>the</strong> Desert <strong>Road</strong> closed <strong>and</strong> <strong>the</strong> link flows observed during a nine-dayclosure (before <strong>the</strong> study commenced) was found for P equal to three.Table 1 shows <strong>the</strong> total closure cost (per hour), along with <strong>the</strong> cost components, for four <strong>of</strong> <strong>the</strong> 22 closurescenarios, with elastic travel dem<strong>and</strong> (P=3). All costs are expressed in July 1997 NZ$ (equivalent to US$0.66 inJuly 1997). While closure <strong>of</strong> <strong>the</strong> Desert <strong>Road</strong> alone costs <strong>the</strong> New Zeal<strong>and</strong> economy nearly $8,000 per hour,closure costs reach nearly $<strong>23</strong>,000 per hour when <strong>the</strong> nearby major north-south route (State Highway 4) is alsoclosed, <strong>and</strong> <strong>the</strong> detour lengths <strong>and</strong> <strong>the</strong> loss <strong>of</strong> user benefits (due to <strong>the</strong> suppression <strong>of</strong> travel) are greater.Simultaneous closures <strong>of</strong> o<strong>the</strong>r nearby roads have less impact, as <strong>the</strong>y do not create a major barrier to <strong>the</strong>north-south traffic flow.
Figure 4: <strong>Network</strong> ModelTable 1: The Costs ($/hr) <strong>of</strong> Various <strong>Road</strong> Closure ScenariosClosure ScenarioOperating plusTotal CostAccidents Lost User Benefit Total CostTime<strong>of</strong> ClosureAll <strong>Road</strong>sOpen180,590 43,017 N/A 2<strong>23</strong>,607 N/ADesert RdClosed172,610 40,858 18,129 <strong>23</strong>1,597 7,990Desert Rd <strong>and</strong>SH 4 Closed164,412 38,570 43,498 246,480 22,870Desert Rd <strong>and</strong>SH 47 Closed165,220 38,846 33,887 <strong>23</strong>7,953 14,350Desert Rd <strong>and</strong>SH 49 Closed169,944 39,783 26,058 <strong>23</strong>5,785 12,180It can be seen from Table 1 that <strong>the</strong> sum <strong>of</strong> <strong>the</strong> operating, time <strong>and</strong> accidents costs is less for <strong>the</strong> four closurescenarios than for <strong>the</strong> situation <strong>of</strong> all roads open, <strong>and</strong> this is also <strong>the</strong> case for <strong>the</strong> o<strong>the</strong>r 18 closure scenarios
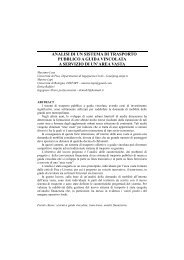
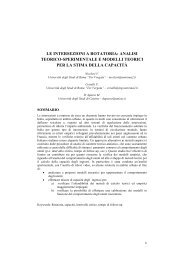
[Dalziell, 1998]. It is important to note that it is only after <strong>the</strong> lost travel benefits, due to trips being cancelled orpostponed, have been taken into account that one gets an economic loss due to road closure.Table 2 shows <strong>the</strong> effect <strong>of</strong> closure <strong>of</strong> <strong>the</strong> Desert <strong>Road</strong> on travel within <strong>the</strong> whole network. If <strong>the</strong> elasticity <strong>of</strong>dem<strong>and</strong> is ignored (i.e. P=0 <strong>and</strong> <strong>the</strong>re is no change in <strong>the</strong> number <strong>of</strong> trips), <strong>the</strong> total travel <strong>and</strong> total cost are bothpredicted to increase (by about 2.2% <strong>and</strong> 2.6% respectively). These increases arise from <strong>the</strong> extra traveldistance required to reach destinations. However, if <strong>the</strong> elasticity <strong>of</strong> dem<strong>and</strong> is taken into account (i.e. P=3), <strong>the</strong>number <strong>of</strong> trips is predicted to decrease by 3.3%, with <strong>the</strong> consequence being that both <strong>the</strong> total travel <strong>and</strong> <strong>the</strong>total cost are both predicted to decrease (by 4.5% <strong>and</strong> 4.4% respectively).Table 2: The Effect <strong>of</strong> Closure on Travel Within <strong>the</strong> Study <strong>Network</strong>Measure <strong>of</strong> Effect Desert Rd Open Desert Rd Closed(P=0)Desert Rd Closed(P=3)Total Trips (veh-trips/h) 1,956 1,956 1891Total Travel (veh-km/h) 299,890 306,610 286,250Total Cost (veh-$/h) 180,590 185,210 172,610Table 3 shows that closure <strong>of</strong> <strong>the</strong> Desert <strong>Road</strong> causes a 7.4% decrease in travel across <strong>the</strong> screenline (Figure4), when allowing for <strong>the</strong> elasticity <strong>of</strong> dem<strong>and</strong>. This is a larger reduction than for trips in <strong>the</strong> whole network,reflecting <strong>the</strong> fact that many trips do not involve using <strong>the</strong> Desert <strong>Road</strong>. It can also be seen that 80-90% <strong>of</strong> <strong>the</strong>traffic diverting from <strong>the</strong> Desert <strong>Road</strong> diverts to State Highway 4 if it is open, ra<strong>the</strong>r than <strong>the</strong> more distantalternative routes.Table 3: The Effect <strong>of</strong> Closure on Flows (veh/h) Across <strong>the</strong> ScreenlineCrossing PointDesert Rd OpenDesert Rd Closed(P=0)Desert Rd Closed(P=3)SH1 (Desert Rd) 155 0 0SH4 100 225 185O<strong>the</strong>r Routes 555 585 565Total 810 810 750The value <strong>of</strong> P indicates a high dem<strong>and</strong> elasticity. This probably reflects <strong>the</strong> public perception that if <strong>the</strong> Desert<strong>Road</strong> is closed due to snow <strong>and</strong> ice, <strong>the</strong>n <strong>the</strong> driving conditions on <strong>the</strong> nearby alternative routes will also be verydangerous, <strong>and</strong> <strong>the</strong> wea<strong>the</strong>r will be unsuitable for many recreational pursuits (<strong>the</strong> Central North Isl<strong>and</strong> is apopular recreation area), so fewer trips will be generated.A point-estimate <strong>of</strong> <strong>the</strong> closure cost does not reflect <strong>the</strong> uncertainty regarding <strong>the</strong> probabilities <strong>and</strong>consequences <strong>of</strong> <strong>the</strong> hazards, <strong>and</strong> a st<strong>and</strong>ard risk evaluation method (Monte Carlo simulation) was used toobtain <strong>the</strong> probability distribution <strong>of</strong> <strong>the</strong> annual cost <strong>of</strong> closures for each hazard (Figure 5). This shows that snow<strong>and</strong> ice is <strong>the</strong> most important hazard, <strong>the</strong> expected annual cost being $1.9 million, compared to $1.5, $0.3 <strong>and</strong>$0.2 million for earthquakes, traffic accidents <strong>and</strong> volcanic events, respectively. In addition, <strong>the</strong> likelihood <strong>of</strong> <strong>the</strong>annual closure cost exceeding $1.2 million is much greater for closure due to snow <strong>and</strong> ice than for closure dueto earthquake (or <strong>the</strong> o<strong>the</strong>r causes <strong>of</strong> closure).The acceptability <strong>of</strong> <strong>the</strong> risks was <strong>the</strong>n assessed, <strong>the</strong> criterion being that a risk is not acceptable if <strong>the</strong> benefit <strong>of</strong>mitigation (i.e. <strong>the</strong> reduction in <strong>the</strong> expected cost <strong>of</strong> road closure) is sufficiently greater than <strong>the</strong> cost <strong>of</strong> mitigatingthat risk (in New Zeal<strong>and</strong>, <strong>the</strong> benefit/cost ratio must exceed about four). Mitigation options may affect <strong>the</strong>probability <strong>and</strong>/or cost <strong>of</strong> road closure. For instance, <strong>the</strong> threshold event size required for road closure mayincrease, <strong>and</strong>/or <strong>the</strong> time to repair <strong>and</strong> re-open <strong>the</strong> road may reduce. It was necessary to re-calculate <strong>the</strong> risk <strong>of</strong>road closure (by re-calculating <strong>the</strong> probability <strong>and</strong> cost <strong>of</strong> closure) with each mitigation option in place. Thebenefit <strong>of</strong> a mitigation option is <strong>the</strong> expected cost <strong>of</strong> road closure without <strong>the</strong> mitigation in place, minus <strong>the</strong>
expected cost <strong>of</strong> road closure with <strong>the</strong> mitigation in place. This was compared to <strong>the</strong> sum <strong>of</strong> <strong>the</strong> capital <strong>and</strong>maintenance costs <strong>of</strong> <strong>the</strong> mitigation, to assess <strong>the</strong> worth <strong>of</strong> <strong>the</strong> mitigation.100%EarthquakesSnow <strong>and</strong> IceTraffic AccidentsVolcanic EventsComparison <strong>of</strong> Expected <strong>Impacts</strong> for Different HazardsProbability <strong>of</strong> Exceedence80%60%40%20%0%VolcanicTraffic AccidentsEarthquakesSnow & Ice0.0 1.0 2.0 3.0 4.0 5.0Average Annual Cost <strong>of</strong> Closures (Million $)Figure 5: Closure Cost Exceedance Probabilities for Each HazardFour options for mitigating <strong>the</strong> effect <strong>of</strong> snow <strong>and</strong> ice were considered, namely <strong>the</strong> application <strong>of</strong> salt or calciummagnesium acetate (CMA), with <strong>and</strong> without a road wea<strong>the</strong>r information system (RWIS). The probabilitydistribution <strong>of</strong> <strong>the</strong> benefit-cost ratio for each mitigation option was estimated (using Monte Carlo simulation).From this information, <strong>the</strong> likelihood that <strong>the</strong> benefit-cost ratio will exceed <strong>the</strong> threshold value for implementationwas identified for each mitigation option.It was found that <strong>the</strong> use <strong>of</strong> a RWIS, in conjunction with applying salt or CMA, enhances <strong>the</strong> benefit-cost ratiosubstantially, because it lowers <strong>the</strong> probability <strong>of</strong> road closure with a lower rate <strong>of</strong> application <strong>of</strong> salt or CMA.Although <strong>the</strong> ‘salt with RWIS’ option was <strong>the</strong> most attractive from an economics viewpoint, followed by <strong>the</strong> ‘salt’,‘CMA with RWIS” <strong>and</strong> ‘CMA’ options respectively, it was decided to apply CMA <strong>and</strong> investigate installation <strong>of</strong> aRWIS, because <strong>the</strong> adverse ecological effects <strong>of</strong> using salt within a National Park were deemed unacceptable.National State Highway <strong>Network</strong> StudySince <strong>the</strong> completion <strong>of</strong> <strong>the</strong> Central North Isl<strong>and</strong> study, research to:• assess <strong>the</strong> feasibility <strong>of</strong> an all-hazards risk assessment for <strong>the</strong> whole State Highway network;• develop a framework that captures <strong>the</strong> complexities <strong>of</strong> <strong>the</strong> task, while being cost-effective <strong>and</strong>practicable;has been undertaken by Dalziell <strong>and</strong> Metcalfe [2004]. They concluded that a lack <strong>of</strong> statistical independencebetween <strong>the</strong> states <strong>of</strong> different parts <strong>of</strong> a networked system (i.e. one part being more likely to be damaged ifano<strong>the</strong>r part is damaged), which was identified as a potential problem by Du <strong>and</strong> Nicholson [1997], is a majorchallenge, <strong>and</strong> using individual site hazard distributions can give misleading results. They also noted that <strong>the</strong>rehas been a move towards <strong>the</strong> use <strong>of</strong> scenario analysis to estimate system-wide losses for geographicallydistributed networks. The benefit <strong>of</strong> this is <strong>the</strong> greater ease <strong>of</strong> visualizing <strong>and</strong> communicating <strong>the</strong> potentiallosses to decision-makers, but it can be difficult to determine which scenarios should be included in <strong>the</strong> analysis.To resolve this issue, <strong>the</strong>y propose using a “walkthrough scenario” approach [Taylor et al., 2001]. This involvesr<strong>and</strong>omly generating hazard events over an analysis period selected by <strong>the</strong> user, with a r<strong>and</strong>om process beingused to generate (using hazard occurrence models) <strong>the</strong> number, size <strong>and</strong> location <strong>of</strong> hazard events during <strong>the</strong>period. If <strong>the</strong> user is interested in a 50 year exposure period, <strong>the</strong>n a 250,000 year walkthrough period will give5000 samples <strong>of</strong> 50-year exposure periods, upon which to base his/her conclusion.
Dalziell <strong>and</strong> Metcalfe [2004] note that an advantage <strong>of</strong> <strong>the</strong> “walkthrough scenario” approach is that it is possibleto obtain a sense <strong>of</strong> when an event occurs <strong>and</strong> what o<strong>the</strong>r events might occur at much <strong>the</strong> same time. Thisinformation can be combined with classical discounted cash flow analysis, to assess how long afterimplementation <strong>of</strong> a mitigation option it is likely to be before <strong>the</strong> benefits <strong>of</strong> <strong>the</strong> implementation are achieved.They also note a difficulty with <strong>the</strong> approach, namely <strong>the</strong> very large number <strong>of</strong> simulations required if applying<strong>the</strong> approach to a large network where several different hazards exist. While <strong>the</strong> Central North Isl<strong>and</strong> <strong>Network</strong>study considered five hazard types (snow <strong>and</strong> ice, volcanic ash, lahar, earthquake <strong>and</strong> motor vehicle accidents),Dalziell <strong>and</strong> Metcalfe suggest a study <strong>of</strong> <strong>the</strong> National Highway <strong>Network</strong> would also need to include l<strong>and</strong>slides,flooding, tsunami <strong>and</strong> wildfire. The computing requirement might be ameliorated using a form <strong>of</strong> artificialintelligence, where multi-criteria associative memory is used to identify similarities between scenarios [Chang etal., 2000]. If a scenario is generated that indicates a similar pattern <strong>of</strong> road closures to that indicated in apreviously generated scenario, <strong>the</strong>n <strong>the</strong> traffic modelling results for <strong>the</strong> previous scenario may be used ra<strong>the</strong>rthan going through <strong>the</strong> full traffic modelling process again.The Central North Isl<strong>and</strong> <strong>Network</strong> study included only <strong>the</strong> more tangible (or readily quantified) costs <strong>and</strong> benefits<strong>of</strong> closure <strong>and</strong> mitigation. Dalziell <strong>and</strong> Metcalfe note that a more holistic closure impact assessment isappropriate, with effects like community isolation being considered. They suggest that doing so would not beeasy, because while <strong>the</strong> public might accept a short period <strong>of</strong> isolation, <strong>the</strong>y may rapidly become less acceptingas <strong>the</strong> period <strong>of</strong> isolation gets longer (reflecting <strong>the</strong> non-linear response <strong>of</strong> <strong>the</strong> public), especially if <strong>the</strong>y perceivemismanagement <strong>of</strong> <strong>the</strong> recovery process, or if <strong>the</strong> recovery <strong>of</strong> <strong>the</strong> road network is slow compared with o<strong>the</strong>rcritical infrastructure. The effect <strong>of</strong> road closure might depend heavily upon when it occurs (e.g. <strong>the</strong> impact onprimary producers will be greater if <strong>the</strong> closure coincides with <strong>the</strong> harvesting period, than if it occurs at ano<strong>the</strong>rtime). The indirect economic impacts <strong>of</strong> closure may be very large; for example, Chang [2000] found markedlong-term differences in <strong>the</strong> economic recovery <strong>of</strong> urban areas in Japan that suffered significant long-term trafficdisruption after <strong>the</strong> Kobe earthquake, compared with those areas that had <strong>the</strong>ir transportation system restoredsoon after <strong>the</strong> earthquake.URBAN ROAD NETWORKSFor <strong>the</strong> rural highway network studies described above, <strong>the</strong> level <strong>of</strong> congestion is such that dem<strong>and</strong> variationscan generally be readily h<strong>and</strong>led, <strong>and</strong> supply variations are <strong>the</strong> major concern. Where <strong>the</strong> supply variation isdue to a natural hazard event, closure duration is long <strong>and</strong> <strong>the</strong> use <strong>of</strong> equilibrium-based traffic modellingmethods is likely to produce reasonably accurate <strong>of</strong> <strong>the</strong> effects on traffic flows a network. For urban roadnetworks, which are typically dense <strong>and</strong> congested, both supply <strong>and</strong> dem<strong>and</strong> variations are causes <strong>of</strong> majorconcern. Such variations in urban areas are typically <strong>of</strong> relatively short duration, <strong>and</strong> <strong>the</strong> appropriateness <strong>of</strong>equilibrium-based traffic modelling methods is extremely doubtful, because <strong>the</strong> time for moving towardsequilibrium might be too short for reaching equilibrium (even approximately). An alternative approach is to use<strong>of</strong> microsimulation, where each individual vehicle is modelled for its entire trip through <strong>the</strong> road network, with itsprogress being determined by vehicle following, gap acceptance <strong>and</strong> lane changing models, plus <strong>the</strong> constraintsformed by <strong>the</strong> physical properties <strong>of</strong> <strong>the</strong> road network (i.e. lane arrangement, traffic signal timings, etc.).Berdica et al. [2001] used <strong>the</strong> Paramics computer model was used to study <strong>the</strong> effect <strong>of</strong> short-term closures inpart <strong>of</strong> <strong>the</strong> road network in Christchurch, New Zeal<strong>and</strong> (Figure 6). With this approach, Individual drivercharacteristics, including <strong>the</strong> level <strong>of</strong> aggression (used for determining <strong>the</strong> critical gap for lane changing) <strong>and</strong> <strong>the</strong>level <strong>of</strong> awareness (used for determining whe<strong>the</strong>r a driver will divert to minor roads to avoid congestion), can beconsidered. This model allows for drivers being presented with up-to-date information on <strong>the</strong> level <strong>of</strong> congestionin <strong>the</strong> network, <strong>and</strong> changing <strong>the</strong>ir route to avoid congestion (i.e. a dynamic assignment approach).Closures <strong>of</strong> a road, located in <strong>the</strong> centre <strong>of</strong> <strong>the</strong> network <strong>and</strong> carrying much <strong>of</strong> <strong>the</strong> traffic to, from <strong>and</strong> through <strong>the</strong>area, were simulated. The closures ranged from 10 to 40 minutes, <strong>and</strong> were set symmetrically around <strong>the</strong>middle <strong>of</strong> <strong>the</strong> 8-9 am peak hour (i.e. <strong>the</strong> 20 minute closure started at 8:20 am <strong>and</strong> ended at 8.40am), with <strong>the</strong>simulation running beyond 9 am, to allow for <strong>the</strong> effects <strong>of</strong> closure to dissipate. Given <strong>the</strong> stochastic nature <strong>of</strong>Paramics, it was necessary to do multiple runs with different seed values for <strong>the</strong> r<strong>and</strong>omisation processes, <strong>and</strong><strong>the</strong> results presented here are <strong>the</strong> averages <strong>of</strong> five runs.The study showed that <strong>the</strong> average travel time for a trip during normal operation (i.e. without any closure) isaround 3 min. The average travel time increases only slightly for a closure duration <strong>of</strong> 10 minutes, but increasesrapidly for longer closures, reaching almost 19 minutes for a 40 minute closure (Figure 7). The average travel
distance is about 1.68 km during normal operation, <strong>and</strong> increases steadily to reach a maximum <strong>of</strong> 1.83 km for a30 minute closure. It is interesting that for a longer closure, <strong>the</strong> average travel distance appears to decline. Thisis probably due to <strong>the</strong> network size, which did not allow drivers to divert a long way to avoid congestion. If <strong>the</strong>area surrounding <strong>the</strong> modelled network is congested, <strong>the</strong>re will be little scope for reducing travel time bydiverting, so <strong>the</strong> decline in average travel distance (as <strong>the</strong> closure duration gets quite long) might well occur for alarger network. It can be seen that <strong>the</strong> average travel time is much more sensitive to an increase in closureduration than is <strong>the</strong> average travel distance. This is not surprising, given <strong>the</strong> constraint upon <strong>the</strong> ability to divert.1. University <strong>of</strong> Canterbury Campus2. Memorial Avenue3. Hamilton Avenue4. Creyke <strong>Road</strong>5. Puriri Street6. Clyde <strong>Road</strong>7. Riccarton <strong>Road</strong>8. Ilam <strong>Road</strong>9. Waimari <strong>Road</strong>N10. Maidstone <strong>Road</strong><strong>23</strong>BLOCKAGE10914568 710kFigure 6: Coded road network: simulation network within <strong>the</strong> marked polygon[km/trip]1.851.801.751.701.651.60Average TravelDistanceAverage Travel Time0 10 20 30 4020.0018.0016.0014.0012.0010.008.006.004.002.000.00[min/trip]Closure Time [min]Figure 7: Average travel times <strong>and</strong> distances for different closures durations
Figure 8 shows how <strong>the</strong> average travel time varies as <strong>the</strong> starting time for trips changes. It can be seen thattrips released well before <strong>the</strong> closure starts are not affected. The greatest effect on average travel time is forthose trips which start at or shortly after <strong>the</strong> middle <strong>of</strong> <strong>the</strong> closure period (i.e. 8.30 am), <strong>and</strong> increases to about27 minutes (or about six times <strong>the</strong> average travel time under normal operation) for a 40 minute closure. That is,<strong>the</strong> travel time is quite sensitive to variations in <strong>the</strong> trip starting time. It can also be seen from Figure 8 that as<strong>the</strong> closure duration increases, <strong>the</strong> travel time takes longer to return to <strong>the</strong> ‘normal operation’ value (i.e. 3minutes), so that trips commenced well after <strong>the</strong> closure ends will experience greatly increased travel times.Average Travel Time [min/trip]30.0025.0020.0015.0010.005.00Open10 min20 min30 min40 min0.008:05 8:15 8:25 8:35 8:45 8:55Release Time PeriodFigure 8: Average travel times for different closures durationsBerdica et al. [2001] also assessed <strong>the</strong> effect <strong>of</strong> closure duration on <strong>the</strong> travel cost (user time plus vehicleoperating cost) within <strong>the</strong> study network, for trips to, from <strong>and</strong> through <strong>the</strong> area during <strong>the</strong> morning peak period(Table 4). Given that several short closures are likely within a city each day, <strong>the</strong> expected annual cost <strong>of</strong> <strong>the</strong>m islikely to be larger than for occasional long closures in <strong>the</strong> inter-urban highway network.Table 4: Travel Cost for Various Closure DurationsClosure Duration (min) 0 10 20 30 40Travel Cost (July 1999 NZ$) 9,100 10,800 18,600 36,900 54,500VALUATION OF TRAVEL RELIABILITY IMPROVEMENTThe st<strong>and</strong>ard transportation project appraisal procedure in New Zeal<strong>and</strong> [Transfund NZ, 2004] provides forchanges in <strong>the</strong> reliability <strong>of</strong> journey times to be included in <strong>the</strong> appraisal. The procedure allows for “<strong>the</strong>unpredictable variations in journey times, which are experienced for a journey undertaken at broadly <strong>the</strong> sametime every day” (i.e. “day-to-day variations in traffic congestion, typically as a result <strong>of</strong> day-to-day variations inflow”). That is, <strong>the</strong> procedure allows for reliability associated with dem<strong>and</strong> variations only, <strong>and</strong> “does not accountfor <strong>the</strong> delays that may result from major incidents on <strong>the</strong> road network” (i.e. incidents involving supplyvariations).It should also be noted that <strong>the</strong> procedure does not estimate variations in <strong>the</strong> travel times <strong>of</strong> individual travellers,but estimates <strong>the</strong> variation in <strong>the</strong> mean travel times. The latter can be substantially less than <strong>the</strong> former,especially for periods with low flow rates, when <strong>the</strong>re can be considerable variability in <strong>the</strong> travel times <strong>of</strong>individual travellers, because <strong>of</strong> <strong>the</strong> lack <strong>of</strong> constraint on <strong>the</strong>ir speed choice arising from traffic congestion.
The procedure involves using <strong>the</strong> st<strong>and</strong>ard deviation <strong>of</strong> travel time (s) as <strong>the</strong> measure <strong>of</strong> travel time variability. Itis assumed that <strong>the</strong> st<strong>and</strong>ard deviation <strong>of</strong> travel time it is related to <strong>the</strong> ratio <strong>of</strong> <strong>the</strong> volume (v) to <strong>the</strong> capacity (c)according to <strong>the</strong> following sigmoid-shaped relationship:(smax− smin)s = smin+v1+exp[ b( ) − a]cwhere sBminB <strong>and</strong> sBmaxB are <strong>the</strong> minimum <strong>and</strong> maximum st<strong>and</strong>ard deviations <strong>of</strong> travel time (when v equals zero <strong>and</strong>c respectively), <strong>and</strong> a <strong>and</strong> b are constants. The values <strong>of</strong> sBminB, sBmaxB, a <strong>and</strong> b vary according to <strong>the</strong> type <strong>of</strong> facility(e.g. motorway, urban arterial, rural highway, signalised intersection, unsignalised intersection).It can be shown that <strong>the</strong> above relationship for <strong>the</strong> st<strong>and</strong>ard deviation <strong>of</strong> <strong>the</strong> travel time implies that <strong>the</strong> st<strong>and</strong>arddeviation:• equals sBminB when v equals zero;• increases only gradually as v increases from zero to about 0.85ac;• increases rapidly as v increases from about 0.85ac to about 1.15ac;• equals [(sBminB + sBmaxB)/2] when v equals ac;• increases gradually towards sBmaxB as v increases above about 1.15ac.The use <strong>of</strong> <strong>the</strong> st<strong>and</strong>ard deviation <strong>of</strong> travelling time as <strong>the</strong> measure <strong>of</strong> variability has <strong>the</strong> advantage that <strong>the</strong> unitsare <strong>the</strong> same as <strong>the</strong> units <strong>of</strong> travelling time, <strong>and</strong> <strong>the</strong> appraisal procedure values a one minute reduction in <strong>the</strong>st<strong>and</strong>ard deviation <strong>of</strong> travel time at 0.8 <strong>and</strong> 1.3 times <strong>the</strong> value <strong>of</strong> a one minute reduction in <strong>the</strong> travel time, forcars <strong>and</strong> commercial vehicles respectively. The procedure involves assessing <strong>the</strong> change in <strong>the</strong> st<strong>and</strong>arddeviation <strong>of</strong> travel time for only a part <strong>of</strong> most journeys (i.e. <strong>the</strong> part <strong>of</strong> <strong>the</strong> journey on <strong>the</strong> part <strong>of</strong> <strong>the</strong> networkwhich might be changed).Whereas <strong>the</strong> travel time for a journey is simply <strong>the</strong> sum <strong>of</strong> <strong>the</strong> travel times for <strong>the</strong> segments <strong>of</strong> <strong>the</strong> journey, <strong>and</strong><strong>the</strong> variance <strong>of</strong> <strong>the</strong> travel time for a journey is simply <strong>the</strong> sum <strong>of</strong> <strong>the</strong> variances <strong>of</strong> <strong>the</strong> travel times for <strong>the</strong>segments <strong>of</strong> <strong>the</strong> journey, <strong>the</strong> st<strong>and</strong>ard deviation <strong>of</strong> <strong>the</strong> travel time for <strong>the</strong> complete journey (sBtotalB) is not <strong>the</strong> sum<strong>of</strong> <strong>the</strong> st<strong>and</strong>ard deviations <strong>of</strong> travel times for <strong>the</strong> n (say) segments, as:2 22total = (s1) + (s2) + ... + (sn) ≠ s1+ s2s + ... + snHence, one cannot place a value on a reduction in <strong>the</strong> st<strong>and</strong>ard deviation <strong>of</strong> <strong>the</strong> travel time for one segment <strong>of</strong> ajourney, without knowledge <strong>of</strong> <strong>the</strong> variability <strong>of</strong> travel times for <strong>the</strong> o<strong>the</strong>r segments.In reality, transportation system users are interested in <strong>the</strong> variability <strong>of</strong> <strong>the</strong> travel times for complete journeys.Now2 221 + (s2) + ... + (sn ) < s1+ s2+ ... s n( s )+<strong>and</strong> <strong>the</strong> discrepancy increases as <strong>the</strong> number (n) <strong>of</strong> segments with unpredictable travel time increases. Hencean x% reduction in <strong>the</strong> st<strong>and</strong>ard deviation for one segment will mean a smaller than x% reduction in <strong>the</strong> st<strong>and</strong>arddeviation for <strong>the</strong> complete journey (i.e. <strong>the</strong> change in journey travel time reliability will be over-estimated), <strong>and</strong><strong>the</strong> degree <strong>of</strong> over-estimation will increase as n increases. The economic appraisal procedure [Transfund NZ,2004] allows for this, by multiplying <strong>the</strong> value <strong>of</strong> a reduction in <strong>the</strong> st<strong>and</strong>ard deviation <strong>of</strong> travel time for part <strong>of</strong> <strong>the</strong>trip by a factor, which varies from 100% for regional models to 50% for corridor models to 30% for intersections<strong>and</strong> individual passing lanes.TRANSPORT NETWORK RESILIENCEDefinitionsIn addition to promoting <strong>the</strong> four-phase approach (i.e. reduction, readiness, response <strong>and</strong> recovery), <strong>the</strong> recentupsurge <strong>of</strong> attention to Civil Defence <strong>and</strong> Emergency Management (CDEM) in NZ has resulted in greaterattention being given to <strong>the</strong> concept <strong>of</strong> ‘resilience’. This refers to <strong>the</strong> ability <strong>of</strong> a system to accommodate variable<strong>and</strong> unexpected conditions without <strong>the</strong>re being a catastrophic failure, <strong>and</strong> has been defined as “<strong>the</strong> capacity toabsorb shocks gracefully” [Foster, 1993].It is helpful to distinguish between a ‘crisis’ <strong>and</strong> a ‘disaster’. A crisis occurs when <strong>the</strong>re is an event which has <strong>the</strong>potential to lead to a disaster, while a disaster occurs when a system is pushed beyond a state <strong>of</strong> relativestability or equilibrium, <strong>and</strong> its capacity to manage or control <strong>the</strong> situation is overwhelmed. That is, a crisisprecedes a disaster, but is not necessarily followed by a disaster. The term ‘vulnerability’ refers to <strong>the</strong> ease withwhich <strong>the</strong> system can be pushed outside its state <strong>of</strong> stability or equilibrium. Resilience refers to <strong>the</strong> ability <strong>of</strong> a
system to respond to a crisis situation <strong>and</strong> prevent it escalating into a disaster or, if this is impossible, <strong>the</strong> ability<strong>of</strong> <strong>the</strong> system to withst<strong>and</strong> <strong>the</strong> stresses imposed by <strong>the</strong> disaster <strong>and</strong> to function in <strong>the</strong> changed environment.Given <strong>the</strong> importance <strong>of</strong> business interruption losses, which can far exceed property losses [Münchener Rück,2001] <strong>the</strong> ability <strong>of</strong> business <strong>and</strong> o<strong>the</strong>r organisations to respond <strong>and</strong> recover is getting more attention. A sixyearresearch programme has recently commenced at <strong>the</strong> University <strong>of</strong> Canterbury, with <strong>the</strong> aim <strong>of</strong> minimizing<strong>the</strong> business interruption losses associated with crises <strong>and</strong> disasters. This research has three ‘objectives’ orparts, as described below.Organisational Planning for Hazard EventsTThe goal <strong>of</strong> this ‘objective’ is tTo underst<strong>and</strong> how New Zeal<strong>and</strong> organisations prioritise investment for hazardevents, develop a framework for improved internal organisational planning, <strong>and</strong> facilitate integration <strong>of</strong> hazardplanning with o<strong>the</strong>r organisations. A case study approach is being used, with <strong>the</strong> selected organisationsincluding <strong>the</strong> State Highway Authority, a major roading contractor, a rural District Council, <strong>and</strong> various privatebusinesses.This ‘objective’ will explore <strong>the</strong> following issues:• how organisations dedicate resources to prepare for <strong>and</strong> respond to hazards, <strong>the</strong> reasons forinvestment in emergency planning <strong>and</strong> how obligations to customers, regulators, government policy,<strong>and</strong> accounting practices influence <strong>the</strong>se;• <strong>the</strong> use <strong>of</strong> risk management approaches to emergency planning <strong>and</strong> how very low probability, extremeconsequence events <strong>and</strong> <strong>the</strong> potential for organisational collapse are managed;• <strong>the</strong> sophistication <strong>of</strong> operational <strong>and</strong> strategic plans for responding to extreme events, critical interfacesbetween organisations <strong>and</strong> how <strong>the</strong>se are addressed;• <strong>the</strong> consultation <strong>and</strong> communication <strong>of</strong> risk <strong>and</strong> expectations within organisations, with <strong>the</strong>irstakeholders, between organisations <strong>and</strong> with <strong>the</strong> community.Prioritisation <strong>and</strong> Deployment <strong>of</strong> Physical <strong>and</strong> Human ResourcesTThe goal <strong>of</strong> this ‘objective’ is to dTevelop a decision support tool that can be used following a hazard event forprioritising physical response <strong>and</strong> recovery <strong>of</strong> networked infrastructure, as <strong>the</strong> prioritisation <strong>of</strong> repairs acrossdamaged networks is an issue for many lifeline providers. The road network has been chosen as <strong>the</strong> case studybecause <strong>of</strong> its importance as a key lifeline in <strong>the</strong> aftermath <strong>of</strong> a hazard event.This ‘objective’ will focus on <strong>the</strong> following issues:• how information is collected <strong>and</strong> communicated during response <strong>and</strong> recovery activities at present, <strong>and</strong>which aspects <strong>of</strong> this process are effective or less effective;• what <strong>the</strong> information requirements <strong>of</strong> different stakeholders are during response <strong>and</strong> recovery activities,<strong>and</strong> how data collection activities <strong>and</strong> analysis can be prioritised to meet <strong>the</strong>se requirements;• how information <strong>and</strong> decision-making are shared between organisations, particularly where critical linkscross organisational boundaries (such as State Highways interfacing with major urban arterials), <strong>and</strong>how <strong>the</strong> process might be better facilitated in <strong>the</strong> future;• to scope <strong>and</strong> develop a decision-support tool for road managers that help <strong>the</strong>m to assimilate actualdamage information as it is received <strong>and</strong> to optimise <strong>the</strong> deployment <strong>of</strong> available resources <strong>and</strong>prioritise infrastructure repairs.Legal <strong>and</strong> Contractual FrameworksThe goal <strong>of</strong> this ‘objective’ is to establish a comprehensive procurement framework <strong>and</strong> programmemanagement plan for reconstruction in <strong>the</strong> event <strong>of</strong> a national natural disaster. It is unlikely that current normalprocurement mechanisms used in <strong>the</strong> construction industry will deliver <strong>the</strong> best economic outcome in <strong>the</strong> event<strong>of</strong> a national disaster. It is likely that without a comprehensive reconstruction procurement framework, rapidreconstruction will be significantly hampered.This ‘objective’ will focus on <strong>the</strong> following issues:• <strong>the</strong> analysis <strong>of</strong> subcontracting arrangements <strong>and</strong> how will <strong>the</strong>y be affected after a major disaster, <strong>the</strong>interconnectedness between organisations where <strong>the</strong>y use common contractors, <strong>and</strong> <strong>the</strong> impact thismay have on recovery;
• <strong>the</strong> analysis <strong>of</strong> NZ legal frameworks for construction (specifically <strong>the</strong> Resource Management Act <strong>and</strong> <strong>the</strong>Building Act), <strong>the</strong> relevance <strong>of</strong> <strong>the</strong>se Acts to post-disaster reconstruction, whe<strong>the</strong>r <strong>the</strong>y would help orhinder, <strong>and</strong> whe<strong>the</strong>r <strong>the</strong> current Acts can be used to develop a legal framework for reconstruction;• <strong>the</strong> analysis <strong>of</strong> contractual aspects <strong>of</strong> construction projects (especially common construction contractsused in NZ) <strong>and</strong> <strong>the</strong>ir relevance <strong>and</strong> usefulness after a natural disaster, <strong>and</strong> <strong>the</strong> analysis <strong>of</strong> internationalcontracts <strong>and</strong> how <strong>the</strong>se st<strong>and</strong>ard contracts can be/have been modified to suit New Zeal<strong>and</strong> conditions;• <strong>the</strong> analysis <strong>of</strong> major international disasters <strong>and</strong> contracts for rebuilding, how contracts to rebuild after adisaster have been set up, <strong>the</strong> procurement mechanisms that have been used <strong>and</strong> <strong>the</strong> applicability <strong>of</strong>this international experience in New Zeal<strong>and</strong>.CONCLUSIONThe assessment <strong>and</strong> management <strong>of</strong> risk associated with natural hazards has been receiving considerableattention in New Zeal<strong>and</strong> for some time. The focus was initially on reducing <strong>the</strong> risk through infrastructureimprovements, especially <strong>the</strong> streng<strong>the</strong>ning or replacement <strong>of</strong> those transport network components (especiallybridges) that were considered weak <strong>and</strong> likely to fail, as a result <strong>of</strong> hazard events that are rare but may havedramatic consequences (e.g. earthquakes <strong>and</strong> volcanic events).The Central North Isl<strong>and</strong> study has highlighted <strong>the</strong> fact that as far as user costs are concerned, <strong>the</strong> impact <strong>of</strong>more frequent events with less dramatic consequences (e.g. road closures due to snow <strong>and</strong> ice during storms)may exceed <strong>the</strong> impact <strong>of</strong> rare events with more dramatic consequences. In addition, it has highlighted <strong>the</strong> needto consider <strong>the</strong> whole network, <strong>and</strong> allow for <strong>the</strong> re-routing <strong>of</strong> traffic, especially where <strong>the</strong> re-routing leads to suchincreases in user costs that <strong>the</strong> travel dem<strong>and</strong> is reduced substantially. In such circumstances, <strong>the</strong> loss <strong>of</strong>benefit associated with trips being cancelled or postponed needs to be taken into account.The Central North Isl<strong>and</strong> study has resulted in recognition <strong>of</strong> <strong>the</strong> likely benefits <strong>of</strong> undertaking a risk assessment<strong>and</strong> management a study for <strong>the</strong> national State Highway network. While such a study has not yet been done, itseems likely that a ‘walk-through scenario” approach would be <strong>the</strong> best way to proceed, if <strong>the</strong> important matter <strong>of</strong><strong>the</strong> dependency <strong>of</strong> network component states is to be addressed properly.There is rapidly growing concern about <strong>the</strong> reliability <strong>of</strong> travel within urban networks, especially where <strong>the</strong>re isconsiderable traffic congestion. The study <strong>of</strong> one urban network has revealed that <strong>the</strong> impact <strong>of</strong> short closureson user costs can be quite substantial, <strong>and</strong> given <strong>the</strong> frequency <strong>of</strong> such closures, it is likely that <strong>the</strong> impact willbe at least as great as for long closures resulting from natural hazard events. Equilibrium-based models, whileappropriate for long closures, are not appropriate for short closures, for which a microsimulation approachseems suitable.It has recently been decided to use <strong>the</strong> st<strong>and</strong>ard deviation <strong>of</strong> travel time as <strong>the</strong> measure <strong>of</strong> travel time reliability,for including <strong>the</strong> benefits <strong>of</strong> improvements in travel time reliability in <strong>the</strong> appraisal <strong>of</strong> urban transport networkprojects. There is a methodological problem associated with this approach, arising from <strong>the</strong> need to estimate <strong>the</strong>effect <strong>of</strong> a reduction in travel time variability for part <strong>of</strong> a trip, on <strong>the</strong> variability <strong>of</strong> <strong>the</strong> travel time for <strong>the</strong> completetrip.The concept <strong>of</strong> transport network resilience appears to hold considerable promise. It appears that <strong>the</strong> conceptcan be applied to organisations which are users <strong>of</strong> <strong>the</strong> transport system, as well as those responsible for <strong>the</strong>proper functioning <strong>of</strong> <strong>the</strong> system (<strong>the</strong> road controlling authorities). While road controlling authorities might seekto reduce unreliability arising from supply variations, users might seek to adjust <strong>the</strong>ir business arrangements soas to reduce <strong>the</strong> effect <strong>of</strong> supply variations on <strong>the</strong>ir organisation. This might lead to changes in <strong>the</strong> pattern <strong>of</strong>transport dem<strong>and</strong> <strong>and</strong> hence <strong>the</strong> nature <strong>and</strong> extent <strong>of</strong> dem<strong>and</strong> variations.Finally, given <strong>the</strong> increasing use <strong>of</strong> “just-in-time” production methods, it is likely that transport network reliabilitywill continue to increase in importance. There is a wide range <strong>of</strong> threats to <strong>the</strong> reliability <strong>of</strong> urban <strong>and</strong> ruralnetworks, <strong>and</strong> a range <strong>of</strong> analysis methods are required to assess <strong>the</strong> effects on network reliability. Researchinto organizations using road networks <strong>and</strong> what <strong>the</strong>y can do to increase <strong>the</strong>ir resilience, by changing <strong>the</strong> way<strong>the</strong>y operate, will complement <strong>the</strong> research into how road controlling authorities can improve <strong>the</strong> reliability <strong>and</strong>resilience <strong>of</strong> road networks for users, <strong>and</strong> is a welcome development.
PSeptemberPEuroConferencePInternationalPREFERENCESAUSTROADS (1988), Guide to Traffic Engineering Practice (Part 5): Intersections at Grade, Austroads, Sydney,Australia.BERDICA, K., ANDJIC, Z. <strong>and</strong> NICHOLSON, A.J. (2003), “Simulating <strong>Road</strong> Traffic Interruptions: Does it MatterWhat Model we Use?”, in The <strong>Network</strong> Reliability <strong>of</strong> Transport (Eds. Bell, M.G.H. <strong>and</strong> Iida, Y.), Elsevier, Oxford,UK.CENTRE FOR ADVANCED ENGINEERING (1991), Lifelines in Earthquakes: Wellington Case Study, University<strong>of</strong> Canterbury, Christchurch, New Zeal<strong>and</strong>.CHANG, S.E. (2000), “Transportation Performance, Disaster Vulnerability, <strong>and</strong> Long-Term Effects <strong>of</strong>ndEarthquakes”, in Proceedings <strong>of</strong> 2Pon Global Change <strong>and</strong> Catastrophic Risk Management,Laxenburg, Austria.CHANG,S.E., SHINOZUKA, M. <strong>and</strong> MOORE, J.E. (2000), “Probabilistic Earthquake Scenarios: Extending RiskAnalysis Methodologies to Spatially Distributed Systems”, Earthquake Spectra, 16(3), pp. 557-572.DALZIELL, E.P. (1998), Risk Assessment Methods in <strong>Road</strong> <strong>Network</strong> Evaluation, PhD Thesis, Department <strong>of</strong>Civil Engineering, University <strong>of</strong> Canterbury, Christchurch, New Zeal<strong>and</strong>.DALZIELL, E.P. <strong>and</strong> NICHOLSON, A.J. (2001), “Risk <strong>and</strong> Impact <strong>of</strong> Natural Hazards on a <strong>Road</strong> <strong>Network</strong>”, ASCEJournal <strong>of</strong> Transportation Engineering, 127(2), pp. 159-166.DALZIELL, E.P. <strong>and</strong> METCALFE, J.A. (2004), “<strong>Assessing</strong> Natural Hazard Risks Across a GeographicallyndDispersed <strong>Road</strong> <strong>Network</strong>”, in Proceedings <strong>of</strong> 2PSymposium on Transport <strong>Network</strong> Reliability (Eds.Nicholson, A.J. <strong>and</strong> Dantas, A.S.), Christchurch, New Zeal<strong>and</strong>, pp.175-181.DU, Z.P. <strong>and</strong> NICHOLSON, A.J. (1997), “Degradable Transportation Systems: Sensitivity <strong>and</strong> ReliabilityAnalysis”, Transportation Research B, 31(3), pp. 225-<strong>23</strong>7.FOSTER, H. (1993), “Resilience Theory <strong>and</strong> System Evaluation”, in Verification <strong>and</strong> Validation <strong>of</strong> ComplexSystems: Human Factor Issues (Eds. Wise, J.A., Hopkin, V.D., <strong>and</strong> Stager, P.), NATO Advanced SciencesInstitute, Series F: Computer <strong>and</strong> Systems Sciences, 110, Springer Verlag, New York, USA, pp. 35-60.GERLOUGH, D.L <strong>and</strong> HUBER, M.J. (1975), Traffic Flow Theory: A Monograph, Special Report 165,Transportation Research Board, Washington, USA.GOODWIN, P.B. (1992), “A Quality Margin in Transport”, Traffic Engineering <strong>and</strong> Control, 33(12), pp. 661-665.HOPKINS, D.C., LUMSDEN, J.L. <strong>and</strong> NORTON, J.A. (1991), “Wellington's lifeline in earthquakes project: anoutline <strong>of</strong> a major review”, in Proceedings <strong>of</strong> Third US Conference on Lifeline Earthquake Engineering, LosAngeles, American Society <strong>of</strong> Civil Engineers, pp. 774-804.thMÜNCHENER RÜCK (2001), 11P2001, Münchener Rückversicherungs-Gesellschaft, Munich,Germany.thNICHOLSON, A.J. <strong>and</strong> DU, Z.P. (1994), ”Improving network reliability: a framework”, in Proceedings <strong>of</strong> 17PAustralian <strong>Road</strong> Research Board Conference, 17(6), pp. 1-17.NICHOLSON, A.J. <strong>and</strong> DU, Z.P. (1997), “Degradable Transportation Systems: an Integrated Equilibrium Model”.Transportation Research B, 31(3), pp. 209-2<strong>23</strong>.PARKHURST, G., KENNY, F. <strong>and</strong> GOODWIN, P.B. (1992), Quality Attributes <strong>of</strong> a Journey: Their Identification<strong>and</strong> Impact on Travellers, Transport Studies Unit, Oxford University, Oxford, UK.TAYLOR, C.E., WERNER, S.D., <strong>and</strong> JAKUBOWSKI, S. (2001), “Walkthrough Method for Catastrophe DecisionMaking”, Natural Hazards Review, 2(4), pp.193-202.TRANSFUND NZ (2004), Project Evaluation Manual, Transfund NZ, Wellington, New Zeal<strong>and</strong>.WOLFF, R.W. (1989), Stochastic Modeling <strong>and</strong> <strong>the</strong> Theory <strong>of</strong> Queues, Prentice-Hall, New Jersey, U.S.A.WORKS CONSULTANCY SERVICES (1990), Wairoa Bridge Failure: Assessment <strong>of</strong> Total Costs, Report forTransit NZ, Wellington, New Zeal<strong>and</strong>.YEE, A., LEUNG, S.K. <strong>and</strong> WESEMANN, L. (1996), “The 1994 Northridge earthquake: a transportation impactoverview”, Transportation Research Circular 462: pp. 7-19.