South Florida Water, Wastewater and Stormwater Facilities Study ...
South Florida Water, Wastewater and Stormwater Facilities Study ...
South Florida Water, Wastewater and Stormwater Facilities Study ...

You also want an ePaper? Increase the reach of your titles
YUMPU automatically turns print PDFs into web optimized ePapers that Google loves.
<strong>South</strong> <strong>Florida</strong> <strong>Water</strong>, <strong>Wastewater</strong>, <strong>and</strong><strong>Stormwater</strong> <strong>Facilities</strong> <strong>Study</strong>FINAL REPORTDATA DISPLAYSA. TablesTask 11-1 Broward County <strong>Water</strong> Treatment Plant (WTP) Locations1-2 Miami-Dade County WTP Locations1-3 Monroe County WTP Locations1-4 Broward County <strong>Wastewater</strong> Treatment Plant (WWTP) Locations1-5 Miami-Dade County WWTP Locations1-6 Five largest WWTP’s in Monroe County, excluding those in Key West<strong>and</strong> Key Colony Beach1-7 Breakdown of existing <strong>Wastewater</strong> <strong>Facilities</strong> on Islamorada1-8 <strong>Wastewater</strong> Package Treatment Plants on Islamorada1-9 Breakdown of existing <strong>Wastewater</strong> <strong>Facilities</strong> in Marathon1-10 <strong>Wastewater</strong> Package Treatment Plants in Marathon1-11 CERP Population Projections1-12 BEBR Population Projections1-13 County Population Projections1-14 2004 BEBR County PopulationsTask 44-1 Regional WTP Capacity4-2 Broward County WTP Capacities4-3 Miami-Dade County WTP Capacities4-4 Monroe County WTP Capacity4-5 Regional WWTP Capacity4-6 Broward County WWTP Capacities4-7 Miami-Dade County WWTP Capacities4-8 Hillsboro Canal Basin Structures Design Criteria4-9 C-14 Basin Structures Design Criteria4-10 Pompano Canal Basin Structures Design Criteria4-11 C-13 Basin Structures Design Criteria4-12 C-12 Basin Structures Design Criteria4-13 North New River Canal Basin Structures Design Criteria4-14 C-11 Basin Structures Design Criteria4-15 C-9 Basin Structures Design Criteria4-16 C-9 Basin Structures Design Criteria4-17 C-8 Basin Structure Design Criteria4-18 C-7 Basin Structures Design Criteria4-19 C-6 Basin Structures Design Criteria4-20 C-4 Basin Structures Design Criteria4-21 C-5 Basin Structures Design Criteria4-22 C-3 Basin Structure Design Criteria4-23 C-2 Basin Structures Design Criteria4-24 C-100 Basin Structures Design Criteria4-25 C-1 Basin Structures Design Criteria4-26 C-102 Basin Structures Design Criteria4-27 C-103 Basin Structures Design Criteria4-28 North Canal <strong>and</strong> <strong>Florida</strong> City Basin Structures Design Criteriaiii
<strong>South</strong> <strong>Florida</strong> <strong>Water</strong>, <strong>Wastewater</strong>, <strong>and</strong><strong>Stormwater</strong> <strong>Facilities</strong> <strong>Study</strong>FINAL REPORT4-29 Model L<strong>and</strong> Canal Basin Structures Design Criteria4-30 Homestead Basin Structure Design Criteria4-31 C-111 Basin Structures Design CriteriaTask 55-1 Regional operating rates at current design capacity <strong>and</strong> future capacity after re-rating5-2 Planned Capacity Increases in the Region5-3 Broward County WTP maximum-day Dem<strong>and</strong> Operating Rates5-4 WTPs in Broward County operating at over 75% during average annual daily dem<strong>and</strong>5-5 WTPs in Broward County whose permitted capacities are less than their design capacities5-6 WTPs in Broward County whose operating rates would drop below 75% if permittedcapacity equaled design capacity5-7 WTPs in Broward County with planned capacity increases5-8 Miami-Dade County WTP maximum-day dem<strong>and</strong> Operating Rates5-9 Miami-Dade County WTPs average annual daily dem<strong>and</strong> Operating Rates5-10 WTPs in Miami-Dade County whose permitted capacities are less than their designcapacities5-11 WTPs in Miami-Dade County whose operating rates would drop below 75% if permittedcapacity equaled design capacity5-12 WTPs in Miami-Dade County with planned capacity increases5-13 J. Robert Dean <strong>Water</strong> Treatment Plant Operating Rates5-14 Operating rates of the J. Robert Dean <strong>Water</strong> Treatment Plant at current design capacity<strong>and</strong> at current permitted capacity5-15 Planned WWTP capacity increases in the Region5-16 Broward County WWTP average annual daily dem<strong>and</strong> Operating Rates5-17 WWTPs in Broward County with permitted capacity less than design capacity5-18 WWTPs in Broward County with planned capacity increases5-19 Miami-Dade County WWTP average annual daily dem<strong>and</strong> Operating Rates5-20 Miami-Dade County WWTPs with planned capacity increases5-21 Time it takes for the C-11 East Basin to drain5-22 Time it takes for the C-11 West Basin to drain5-23 Time it takes for the C-12 Basin to drain5-24 Time it takes for the C-13 East <strong>and</strong> West Basins to drain5-25 Time it takes for the C-14 East <strong>and</strong> West Basins to drain5-26 Time it takes for the Hillsboro Canal Basin to drain5-27 Time it takes for the North New River East <strong>and</strong> West Basins to drain5-28 Time it takes for the Pompano Canal Basin to drain5-29 Time it takes for the C-1 Basin to drain5-30 Time it takes for the C-100 Basin to drain5-31 Time it takes for the C-102 Basin to drain5-32 Time it takes for the C-103 Basin to drain5-33 Time it takes for the C-111 Basin to drain5-34 Time it takes for the C-2 Basin to drain5-35 Time it takes for the C-4 Basin to drain5-36 Time it takes for the C-5 Basin to drain5-37 Time it takes for the C-6 Basin to drain5-38 Time it takes for the C-7 Basin to drain5-39 Time it takes for the C-8 Basin to drain5-40 Time it takes for the C-9 East <strong>and</strong> West Basins to drain5-41 Time it takes for the Coral Gables Basin to drainiv
<strong>South</strong> <strong>Florida</strong> <strong>Water</strong>, <strong>Wastewater</strong>, <strong>and</strong><strong>Stormwater</strong> <strong>Facilities</strong> <strong>Study</strong>FINAL REPORT5-42 Time it takes for the <strong>Florida</strong> City Basin to drain5-43 Time it takes for the Homestead Basin to drain5-44 Time it takes for the Model L<strong>and</strong> Basin to drainTask 66-1 Regional Population Projections, 2005-20306-2 Broward County Population Projections, 2005-20306-3 Miami-Dade County Population Projections, 2005-20306-4 Monroe County Population Projections, 2005-20306-5 Regional Population Projections, excluding Monroe County, 2005-2030Task 77-1 Region-wide <strong>Water</strong> capacity needs, 2010-20307-2 Cost Estimates, based on Estimates #1 <strong>and</strong> #2, to eliminate current water backlog7-3 <strong>Water</strong> Cost Estimates 2010-2030, based on Estimates #1 <strong>and</strong> #27-4 Cost Estimates, based on Estimate #3, to eliminate current water backlog7-5 <strong>Water</strong> Cost Estimates 2010-2030, based on Estimate #37-6 Cost Estimates, based on Estimate #4, to eliminate current water backlog7-7 <strong>Water</strong> Cost Estimates 2010-2030, based on Estimate #47-8 Cost Estimates, based on Estimate #5, to eliminate current water backlog7-9 <strong>Water</strong> Cost Estimates 2010-2030, based on Estimate #57-10 Cost Comparison between 5 estimates7-11 Region-wide <strong>Wastewater</strong> capacity needs, 2010-20307-12 <strong>Wastewater</strong> Cost Estimates 2010-2030, based on SEMCOG project costs7-13 <strong>Wastewater</strong> Cost Estimates 2010-2030, based on the Empire WWTP project costs7-14 <strong>Wastewater</strong> Cost Estimates 2010-2030, based on the Michigan Road WWTP project costsv
<strong>South</strong> <strong>Florida</strong> <strong>Water</strong>, <strong>Wastewater</strong>, <strong>and</strong><strong>Stormwater</strong> <strong>Facilities</strong> <strong>Study</strong>FINAL REPORTB. FiguresTask 44-1 Breakdown in Region-wide <strong>Water</strong> Capacity, by County4-2 Breakdown in Region-wide <strong>Wastewater</strong> Capacity, by CountyTask 55-1 Region-wide Operating Rates of <strong>Water</strong> Treatment Plants5-2 <strong>Water</strong> Dem<strong>and</strong> in the Region5-3 <strong>Water</strong> Treatment Plant Operating Rates in the Region5-4 Operating Rates of Broward County <strong>Water</strong> Treatment Plants5-5 Operating Rates of Miami-Dade County <strong>Water</strong> Treatment Plants5-6 Comparison of Regional <strong>Wastewater</strong> Capacity, Dem<strong>and</strong>, <strong>and</strong> Operating Rates5-7 Operating Rates of Broward County <strong>Wastewater</strong> Treatment PlantsTask 66-1 Projected Regional <strong>Water</strong> Dem<strong>and</strong> <strong>and</strong> Capacity, 2005-20306-2 Projected Regional <strong>Water</strong> Dem<strong>and</strong>, 20106-3 Projected Regional <strong>Water</strong> Dem<strong>and</strong>, 20206-4 Projected Regional <strong>Water</strong> Dem<strong>and</strong>, 20306-5 Broward County Projected <strong>Water</strong> Dem<strong>and</strong> <strong>and</strong> Capacity, 2005-20306-6 Broward County Projected <strong>Water</strong> Dem<strong>and</strong>, 20106-7 Broward County Projected <strong>Water</strong> Dem<strong>and</strong>, 20206-8 Broward County Projected <strong>Water</strong> Dem<strong>and</strong>, 20306-9 Miami-Dade County Projected <strong>Water</strong> Dem<strong>and</strong>, 2005-20306-10 Miami-Dade County Projected <strong>Water</strong> Dem<strong>and</strong>, 20106-11 Miami-Dade County Projected <strong>Water</strong> Dem<strong>and</strong>, 20206-12 Miami-Dade County Projected <strong>Water</strong> Dem<strong>and</strong>, 20306-13 Monroe County <strong>Water</strong> Projected Dem<strong>and</strong> <strong>and</strong> Capacity, 2005-20306-14 Monroe County Projected <strong>Water</strong> Dem<strong>and</strong>, 20106-15 Monroe County Projected <strong>Water</strong> Dem<strong>and</strong>, 20206-16 Monroe County Projected <strong>Water</strong> Dem<strong>and</strong>, 20306-17 Projected Regional <strong>Wastewater</strong> Dem<strong>and</strong>, 20106-18 Projected Regional <strong>Wastewater</strong> Dem<strong>and</strong>, 20206-19 Projected Regional <strong>Wastewater</strong> Dem<strong>and</strong>, 20306-20 Broward County Projected <strong>Wastewater</strong> Dem<strong>and</strong>, 20106-21 Broward County Projected <strong>Wastewater</strong> Dem<strong>and</strong>, 20206-22 Broward County Projected <strong>Wastewater</strong> Dem<strong>and</strong>, 20306-23 Miami-Dade County Projected <strong>Wastewater</strong> Dem<strong>and</strong>, 20106-24 Miami-Dade County Projected <strong>Wastewater</strong> Dem<strong>and</strong>, 20206-25 Miami-Dade County Projected <strong>Wastewater</strong> Dem<strong>and</strong>, 2030C. MapsTask 11-1 Broward County Potable <strong>Water</strong> Service Areas <strong>and</strong> Treatment <strong>Facilities</strong>1-2 Miami-Dade Potable <strong>Water</strong> Service Areas <strong>and</strong> Treatment <strong>Facilities</strong>1-3 Monroe County FDEP Potable <strong>Water</strong> Treatment <strong>Facilities</strong>1-4 <strong>Florida</strong> Keys Aqueduct Authority Service Areas1-5 Broward County <strong>Wastewater</strong> <strong>Facilities</strong>vi
<strong>South</strong> <strong>Florida</strong> <strong>Water</strong>, <strong>Wastewater</strong>, <strong>and</strong><strong>Stormwater</strong> <strong>Facilities</strong> <strong>Study</strong>FINAL REPORT1-6 Broward County Sewer Service Area1-7 City of Pembroke Pines Sewer Service Area 20051-8 City of Fort Lauderdale Sewer Service Area1-9 City of Sunrise <strong>Water</strong> <strong>and</strong> Sewer Utilities System, Service Area Base Map1-10 City of Plantation Utilities Service Area Map1-11 Ferncrest Utilities <strong>Wastewater</strong> Service Area1-12 Coral Springs Improvement District <strong>Wastewater</strong> Service Area1-13 City of Margate <strong>Wastewater</strong> Service Area1-14 Town of Davie <strong>Wastewater</strong> Service Area1-15 Cooper City Utilities <strong>Wastewater</strong> Service Area1-16 City of Hollywood <strong>Wastewater</strong> Service Area1-17 Miami-Dade <strong>Wastewater</strong> Treatment <strong>Facilities</strong>1-18 Miami-Dade <strong>Water</strong> <strong>and</strong> Sewer Department <strong>Wastewater</strong> Treatment Plants ApproximateService Area Boundaries1-19 Marathon Area Existing <strong>Wastewater</strong> Treatment Plants (In Appendix C)1-20 Broward County Primary <strong>and</strong> Secondary Canals1-21 Broward County Drainage Basins1-22 Broward County Drainage Districts <strong>and</strong> Municipal Boundaries1-23 Miami-Dade County Primary <strong>and</strong> Secondary Canals1-24 Miami-Dade County Drainage BasinsTask 55-1 Broward County <strong>Water</strong> Service Area Operating Rates5-2 Miami-Dade County <strong>Water</strong> Service Area Operating Ratesvii
<strong>South</strong> <strong>Florida</strong> <strong>Water</strong>, <strong>Wastewater</strong>, <strong>and</strong><strong>Stormwater</strong> <strong>Facilities</strong> <strong>Study</strong>FINAL REPORTSOURCESThe <strong>South</strong> <strong>Florida</strong> <strong>Water</strong> Management District<strong>Florida</strong> Department of Environmental ProtectionMiami-Dade County <strong>Water</strong> <strong>and</strong> Sewer DepartmentBroward County Office of <strong>Water</strong> Management, <strong>Water</strong> Resource DivisionMonroe County Division of Growth Management, Office of Marine ResourcesCity of Coral SpringsCity of Cooper CityCity of Dania BeachTown of DavieCity of Deerfield BeachCity of Fort LauderdaleCity of Hall<strong>and</strong>ale BeachCity of Hillsboro BeachCity of HollywoodCity of LauderhillCity of MargateCity of MiramarCity of Pembroke PinesCity of PlantationCity of Pompano BeachCity of SunriseCity of TamaracCoral Springs Improvement DistrictNorth Springs Improvement DistrictFerncrest UtilitiesCity of <strong>Florida</strong> CityCity of HomesteadCity of North MiamiCity of North Miami Beach<strong>Florida</strong> Keys Aqueduct Authority (FKAA)Lee County, <strong>Florida</strong>City of San Diego, CaliforniaDakota County, MinnesotaClay Township, IndianaMiami-Dade County <strong>Water</strong> <strong>and</strong> Sewer Department, <strong>Wastewater</strong> <strong>Facilities</strong> Master Plan, October2003.Miami-Dade County <strong>Water</strong> <strong>and</strong> Sewer Department, <strong>Water</strong> <strong>Facilities</strong> Master Plan, Volume I,September 2003.<strong>Wastewater</strong> <strong>Facilities</strong> Plan With Phased Implementation for the Marathon Area of the <strong>Florida</strong> Keys.Prepared for Monroe County by CH2MHILL, June 1998.Local Government Financial Information H<strong>and</strong>book, 2004 Edition, prepared by the <strong>Florida</strong> LegislativeCommittee on Intergovernmental Relations (LCIR) with the assistance of the <strong>Florida</strong> Departmentof Revenue’s Office of Research <strong>and</strong> Analysis, May 2005.viii
<strong>South</strong> <strong>Florida</strong> <strong>Water</strong>, <strong>Wastewater</strong>, <strong>and</strong><strong>Stormwater</strong> <strong>Facilities</strong> <strong>Study</strong>FINAL REPORTSOURCES (Cont.)Capital Project Financing Mechanisms, Prepared by Michael Richardson & Associates, December 1,2000.<strong>South</strong>east Michigan Council of Governments, “Investing in <strong>South</strong>east Michigan’s Quality of Life:Infrastructure Needs.” April 2001.<strong>South</strong> <strong>Florida</strong> <strong>Water</strong> Management District, Surface <strong>Water</strong> Management Design Aids.An Atlas of Eastern Broward County Surface <strong>Water</strong> Management Basins, <strong>South</strong> <strong>Florida</strong> <strong>Water</strong>Management District. November 1987.An Atlas of Eastern Dade County Surface <strong>Water</strong> Management Basins, <strong>South</strong> <strong>Florida</strong> <strong>Water</strong>Management District. October 1987..ix
I. OVERVIEW OF PROJECTThe objective of this study is to create a database of water, wastewater, <strong>and</strong> stormwater facilitiesin Broward, Miami-Dade, <strong>and</strong> Monroe counties that will provide local governments, the <strong>Water</strong>Management District, utilities, <strong>and</strong> others with consistent data on the availability of theseresources. It will also allow them to better coordinate service areas <strong>and</strong> capacity with current <strong>and</strong>future dem<strong>and</strong> due to future growth in the Region. Local governments <strong>and</strong> others will be able touse this database to answer questions they may have regarding the utilities <strong>and</strong> services theymust provide in order to address the needs of their community given future development goals.Existing data was collected from multiple sources to create a region-wide picture of the availablecapacity of facilities in <strong>South</strong> <strong>Florida</strong>. All the data that was collected was compiled into onesource. From this, local governments <strong>and</strong> agencies can make better decisions regarding growth<strong>and</strong> the provision of future facilities within the Region.There are many uses for the Capital <strong>Facilities</strong> database within the Regional Planning Council.Some of these uses include:• Evaluation of development proposals• Evaluation <strong>and</strong> Appraisal Reports (EAR)• Annual Capital <strong>Facilities</strong> update• Comprehensive Plan amendmentsII. OVERVIEW OF TASKSTask 1a – Identification of existing water, wastewater, <strong>and</strong> stormwater facilities in Miami-Dade,Broward, <strong>and</strong> Monroe Counties.Task 1b – Establish project baselines for regional population <strong>and</strong> growth.Task 2 – GIS Mapping of identified water, wastewater, <strong>and</strong> stormwater facilities in Miami-Dade,Broward, <strong>and</strong> Monroe Counties.Task 3 - GIS mapping of water, wastewater, <strong>and</strong> stormwater facility service areas in Miami-Dade,Broward, <strong>and</strong> Monroe Counties.Task 4 – Identification of existing <strong>and</strong> planned capacity for water, wastewater, <strong>and</strong> stormwaterfacilities in Miami-Dade, Broward, <strong>and</strong> Monroe Counties.Task 5 – Identification of existing backlog <strong>and</strong> service deficiencies for water <strong>and</strong> sewer facility,<strong>and</strong> stormwater capacity within the Region.Task 6 – Estimation of future dem<strong>and</strong> for <strong>Water</strong>, Sewer, <strong>and</strong> <strong>Stormwater</strong> treatment in Miami-Dade, Broward, <strong>and</strong> Monroe Counties.Task 7 – Estimation of future costs for needed expansions in <strong>Water</strong>, Sewer, <strong>and</strong> <strong>Stormwater</strong>Treatment facilities in Miami-Dade, Broward, <strong>and</strong> Monroe Counties.Task 8 – Evaluate the data collected in tasks 1 – 7 to recommend funding options <strong>and</strong> strategies toachieve <strong>and</strong> maintain the resources needed to sustain the future needs.
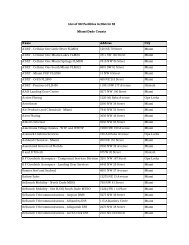
III.TASK 1 - INVENTORY OF EXISTING FACILITIES AND BASELINE DATAA. Identification of <strong>Water</strong>, <strong>Wastewater</strong>, <strong>and</strong> <strong>Stormwater</strong> <strong>Facilities</strong> in Broward, Miami-Dade, <strong>and</strong> Monroe CountiesPrior to this study, no complete inventory of water, wastewater, <strong>and</strong> stormwater facilities existedfor the <strong>South</strong> <strong>Florida</strong> region. Various agencies had portions of the data, but differences existedbetween the various sources.The purpose of this study was to compile a comprehensive list <strong>and</strong> identify the locations of allwater, wastewater, <strong>and</strong> stormwater facilities in the three county Region. In order to identify allthe water <strong>and</strong> wastewater facilities in the Region, those facilities listed in the CountyComprehensive plans were compared to a list of <strong>Florida</strong> Department of EnvironmentalProtection (DEP) permitted facilities <strong>and</strong> with local governments. Once these were identified, asurvey was sent to each facility to verify that they were still active or that new facilities had notbeen missed from existing data sources.1. WATER TREATMENT PLANTSa. Broward CountyThere are twenty-seven regional water treatment plants identified in Broward County. They are:Broward County 1A <strong>Water</strong> Treatment Plant, Broward County 2A <strong>Water</strong> Treatment Plant, the Cityof Coral Springs, the City of Dania Beach <strong>Water</strong> Treatment Plant, the City of Hall<strong>and</strong>ale Beach,Cooper City Utilities, Hollywood <strong>Water</strong> Treatment Plant, Sawgrass <strong>Water</strong> Treatment Plant(Sunrise #3), Springtree <strong>Water</strong> Treatment Plant (Sunrise #1), <strong>South</strong>west (S. Broward) <strong>Water</strong>Treatment Plant, Park City <strong>Water</strong> Treatment Plant (Sunrise #2), Fiveash <strong>Water</strong> Plant (FortLauderdale), City of Margate <strong>Water</strong> Treatment Plant, Ferncrest Utilities, Pompano Beach <strong>Water</strong>Treatment Plant, City of Tamarac Utilities West, Deerfield Beach East <strong>and</strong> West <strong>Water</strong> Plants,Miramar West <strong>Water</strong> Plant, Coral Springs Improvement District, North Springs ImprovementDistrict, Davie <strong>Water</strong> Treatment Plants I <strong>and</strong> III, the City of Lauderhill, Pembroke Pines <strong>Water</strong>Treatment Plant #2, <strong>and</strong> Plantation East <strong>and</strong> Central <strong>Water</strong> Treatment Plants.Table 1-1 identifies the water treatment plants by their plant permit number <strong>and</strong> their <strong>Florida</strong>Department of Environmental Protection facility ID, <strong>and</strong> gives the address of each water facilityplant. Map 1-1 shows the location of each water treatment plant as well as the service areaboundary of each utility.2
Table 1-1: Broward County <strong>Water</strong> Treatment Plant (WTP) LocationsPlant Permit # DEP Facility ID Plant Name Address City06-58-00009 4060167 Broward County 1A <strong>Water</strong> Treatment Plant 3701 North State Road 7 Lauderdale Lakes06-58-00010 4060163 Broward County 2A <strong>Water</strong> Treatment Plant 1390 N.E. 50 th Street Pompano Beach4060209 4060209 City of Coral Springs 3800 N.W. 85 th Ave. Coral Springs4060253 4060253 City of Dania Beach <strong>Water</strong> Treatment Plant 1201 Stirling Road Dania BeachFL4060573 4060573 City of Hall<strong>and</strong>ale Beach 215 N.W. 6 th Ave. Hall<strong>and</strong>ale BeachFL4060787 4060787 City of Lauderhill 2101 N.W. 49 th Ave. Lauderhill06-58-00059 4060845 City of Margate <strong>Water</strong> Treatment Plant 1001 West River Drive Margate4061429 4061429 City of Tamarac Utilities West 7805 N.W. 61 st Street Tamarac4060282 4060282 Cooper City Utilities 11791 S.W. 49 th Street Cooper City4060291 4060291 Coral Springs Improvement District 10300 N.W. 11 th Manor Coral Springs06-58-00027 4060344 Davie <strong>Water</strong> Treatment Plant System I 3790 S.W. 64 th Ave. Davie06-58-00028 4060344 Davie <strong>Water</strong> Treatment Plant System III 3500 N.W. 76 th Ave. Hollywood4060254 4060254 Deerfield Beach East <strong>Water</strong> Plant 101 N.W. 2 nd Ave. Deerfield Beach4060254 4060254 Deerfield Beach West <strong>Water</strong> Plant 290 Goolsby Deerfield Beach4060419 4060419 Ferncrest Utilities 3015 S.W. 54 th Ave. Fort LauderdaleFL40604861-01 4060486 Fiveash <strong>Water</strong> Plant – Fort Lauderdale 1500 S. State Road 7/4321 NW 9 th Fort LauderdaleAve4060615 4060615 Hillsboro Beach <strong>Water</strong> Plant 925 N.E. 36 th Street Pompano Beach4060642 4060642 Hollywood <strong>Water</strong> Treatment Plant 3441 Hollywood Blvd. HollywoodW11035 4060925 Miramar West <strong>Water</strong> Plant 2600 S.W. 66 th Terrace Miramar4064390 4064390 North Springs Improvement District 9700 N.W. 53 rd Court Coral Springs4061407 4061407 Park City <strong>Water</strong> Treatment Plant – Sunrise #2 8700 S.W. 19 th Place Fort Lauderdale4061083 4061083 Pembroke Pines <strong>Water</strong> Treatment Plant #2 7960 Johnson St. Pembroke Pines4061121-01 4061121 Plantation Central <strong>Water</strong> Treatment Plant 400 N.W. 73 rd Ave. Plantation4061121-02 N/A Plantation East <strong>Water</strong> Treatment Plant N/A N/A06-58-00078 4061129 Pompano Beach <strong>Water</strong> Treatment Plant 301 N.E. 12 th Street Pompano Beach4061408 4061408 Sawgrass <strong>Water</strong> Treatment Plant – Sunrise #3 777 Sawgrass Corporate Parkway Sunrise4064326 4064326 <strong>South</strong>west (S. Broward) <strong>Water</strong> Treatment Plant 15450 Stirling Road Davie4061410 4061410 Springtree <strong>Water</strong> Treatment Plant – Sunrise #1 4350 Springtree Drive SunriseSource: DEP, SFWMD, Broward County, SFRPC3
Leave blank for Map 1-1: Broward County Potable <strong>Water</strong> Service Areas <strong>and</strong> Treatment<strong>Facilities</strong>4
. Miami-Dade CountySeven of the eight regional water treatment facilities identified in Miami-Dade County providewater to citizens of the county. They are: <strong>Florida</strong> City, the City of Homestead, the City of NorthMiami Winson <strong>Water</strong> Plant 1 , the Norwood <strong>Water</strong> Plant (North Miami Beach) 2 , <strong>and</strong> the threewater plants that are operated by the Miami-Dade <strong>Water</strong> <strong>and</strong> Sewer Department (MD WASD),Alex<strong>and</strong>er Orr, Hialeah-Preston <strong>and</strong> <strong>South</strong> Miami-Dade 3 .Table 1-2 identifies the water treatment plants by their plant permit number <strong>and</strong> their DEPFacility ID, <strong>and</strong> gives the address of each water treatment plant. Map 1-2 shows the location ofeach water treatment plant as well as the service area boundary of each utility.Table 1-2: Miami-Dade County WTP LocationsPlant Permit # DEP Facility ID Plant Name Plant Address City13-00017-W Alex<strong>and</strong>er Orr 6800 S.W. 87 th Ave. Miami13-00046-W 4130645 City of Homestead 505 N.W. 9 th St. Homestead13-00059-W PWO-000017 City of N. Miami Winson 12100 N.W. 11 th Ave. North Miami<strong>Water</strong> Plant13-00029-W 4130255 <strong>Florida</strong> City 461 N.W. 6 th Ave. <strong>Florida</strong> City13-00037-W Hialeah-Preston 1100 West 2 nd Ave. Hialeah13-00060-W 4131618 Norwood <strong>Water</strong> Plant – N. 19150 N.W. 8 th Ave. Miami GardensMiami Beach13-00040-W <strong>South</strong> Miami-Dade WTP 4 11800 S.W. 208 th St. MiamiSource: DEP, SFWMD, Miami-Dade County, SFRPC1 City of North Miami receives 50% of its water service from WASD, while the Winson Plant provides the other50%. The Winson Plant also provides water service to Biscayne Park <strong>and</strong> parts of Unincorporated Miami-DadeCounty.2 The City of North Miami Beach receives 50% of its water service from WASD, while the Norwood <strong>Water</strong> Plantprovides water to the other 50%. The Norwood Plant also provides water service to Sunny Isles Beach, MiamiGardens, Golden Beach, <strong>and</strong> Aventura.3 The <strong>South</strong> Miami-Dade <strong>Water</strong> Treatment Plant is currently under construction. The data provided is thecumulative total of five small plants that the County uses. These plants are: Leisure City WTP, Everglades LaborCamp WTP, Newton WTP, Elevated Tank WTP, <strong>and</strong> Naranja Lakes WTP. These plants will be non-operationalonce the <strong>South</strong> Miami-Dade WTP is completed.4 This plant is currently under construction. Five small plants are being used by the county to provide waterto residents in <strong>South</strong> Miami-Dade County until the construction of the plant is complete.5
Placeholder for Miami-Dade County Potable <strong>Water</strong> Service Areas & Treatment <strong>Facilities</strong> Map6
c. Monroe CountyMonroe County residents receive their water from the J. Robert Dean <strong>Water</strong> Treatment Plant,which is located in <strong>Florida</strong> City. The <strong>Florida</strong> Keys Aqueduct Authority (FKAA) operates thewater treatment plant. Though the water treatment plant is located in Miami-Dade County, itonly serves those residents living in Monroe County <strong>and</strong> the <strong>Florida</strong> Keys.Table 1-3 identifies the water treatment plant by its plant permit number <strong>and</strong> the DEP Facility ID,<strong>and</strong> gives the address of the plant. Map 1-3 shows the location of the plant <strong>and</strong> Map 1-4 showsthe service areas for FKAA.Table 1-3: Monroe County WTP LocationsPlant Permit # DEP Facility ID Plant Name Plant Address City13-00005-W 4134357 J. Robert Dean <strong>Water</strong> S.W 192 nd Ave. & <strong>Florida</strong> CityTreatment Plant - FKAA 354 th StreetSource: <strong>Florida</strong> Keys Aqueduct Authority7
Placeholder for Monroe County FDEP Potable water treatment facilities map (1-3)8
Placeholder for FKAA service areas map (Map 1-4)9
2. WASTEWATER TREATMENT PLANTSa. Broward CountyEach of the fourteen wastewater treatment plants in Broward County operates independently.While Broward County does operate <strong>and</strong> provide sewer service to many areas, severalmunicipalities operate their own plants. The fourteen wastewater facilities operating in BrowardCounty are: the Town of Davie WWTP, Cooper City Utilities, Hollywood <strong>South</strong>ern RegionalWWTP, Sawgrass Regional WWTF (Sunrise #3), Springtree Regional WWTF (Sunrise #1), <strong>South</strong>Broward (<strong>South</strong>west) WWTF, Broward County North Regional WWTF, Plantation RegionalWWTP, the G.T. Lohmeyer Plant (City of Fort Lauderdale), Coral Springs Improvement District,City of Margate East <strong>and</strong> West WWTP’s, Ferncrest Utilities, <strong>and</strong> the City of Pembroke PinesWWTF.Table 1-4 identifies the wastewater treatment plants by their plant permit number, <strong>and</strong> gives thephysical address of each plant. Map 1-5 shows the location of each wastewater treatment plant.Maps 1-6 to 1-16 show the service area boundaries for each facility listed below. There is not aservice area map for the entire county that shows the boundaries for each plant.Table 1-4: Broward County <strong>Wastewater</strong> Treatment Plant (WWTP) LocatonsPlant Permit # Plant Name Address CityFL0031771 Broward County N. Regional WWTF 2401 N. PowerlineRoadPompanoBeachFLA169617 City of Margate East WWTP 1001 West River Drive MargateFL0041289 City of Margate West WWTP 6630 N.W. 9 th St. MargateFL0040398 Cooper City Utilities 11791 S.W. 49 th St. Cooper CityFLA041301 Coral Springs Improvement District 10300 N.W. 11 th Manor Coral SpringsFLA013583 Ferncrest Utilities, Inc. 3015 S.W. 54 th Ave. FortLauderdaleFLA041378 G.T. Lohmeyer Plant – Fort Lauderdale 1765 S.E. 18 th St. FortLauderdaleFL0026255 Hollywood <strong>South</strong>ern Regional WWTP 1621 N. 14 th Ave. HollywoodFLA13575 Pembroke Pines WWTF 13955 Pines Blvd. PembrokePinesFLA040401 Plantation Regional WWTP 6500 N.W. 11 th Place PlantationFLA042641 Sawgrass Regional WWTF #3 (Sunrise #3) 14150 N.W. 8 th St. SunriseFLA013580 <strong>South</strong> Broward (<strong>South</strong>west) WWTF 15400 <strong>Water</strong>mill Road DavieFLA041947 Springtree Regional WWTF – Sunrise #1 4350 Springtree Drive SunriseFL0040541 Town of Davie WWTP 3591 N.W. 76 th Ave. DavieSource: DEP, Broward County, SFRPC10
Hold for map 1-5: Broward County <strong>Wastewater</strong> facilities11
Hold for map 1-6: Broward County Sewer Service Areas & City boundaries map12
Hold for map 1-7: City of Pembroke Pines Sewer Service Area 200513
Hold for map 1-8: City of Fort Lauderdale Sewer Service Area14
Hold for map 1-9: City of Sunrise <strong>Water</strong> <strong>and</strong> <strong>Wastewater</strong> Utilities System15
Hold for map 1-10: City of Plantation Utilities Service Area Map16
Hold for map 1-11: Ferncrest Utilities <strong>Wastewater</strong> Service area map17
Hold for map 1-12: Coral Springs Improvement District <strong>Wastewater</strong> Service area18
Hold for map 1-13: City of Margate wastewater service area19
Hold for map 1-14: Town of Davie <strong>Wastewater</strong> Service area20
Hold for map 1-15: Cooper City Utilities, <strong>Wastewater</strong> Service Area21
Hold for map 1-16: City of Hollywood <strong>Wastewater</strong> Service area22
. Miami-Dade CountyThere are four wastewater treatment facilities located in Miami-Dade County. They are the Cityof Homestead <strong>Wastewater</strong> Treatment Facility, the Miami-Dade North District <strong>Wastewater</strong>Treatment Plant, the Miami-Dade Central <strong>Wastewater</strong> Treatment Plant <strong>and</strong> the <strong>South</strong> District<strong>Wastewater</strong> Treatment Plant. Table 1-5 identifies the wastewater plants by their plant permitnumber, <strong>and</strong> gives the physical address of each plant. Map 1-17 shows the location of each plant.Map 1-18 shows the approximate service area boundaries for the three Miami-Dade <strong>Water</strong> <strong>and</strong>Sewer Department (WASD) plants.The City of Homestead <strong>Wastewater</strong> Treatment Facility provides wastewater service to 10,100residential <strong>and</strong> non-residential customers. The three Miami-Dade <strong>Water</strong> <strong>and</strong> Sewer Department(WASD) wastewater facilities provide direct sewer service to approximately 315,000 retailcustomers <strong>and</strong> thirteen wholesale customers.Table 1-5: Miami-Dade County WWTP LocationsPlant Permit # Plant Name Plant Address CityFLA 013609 City of Homestead 551 S.E. 8 th Street HomesteadFLA024805 WASD Central District Virginia KeyMiamiWWTPFL0032182 WASD North District N.E. 151 st St. <strong>and</strong> Biscayne Blvd. MiamiWWTPFL0042137 WASD <strong>South</strong> District 8950 S.W. 232 nd Street MiamiWWTPSource: DEP, Miami-Dade County, City of Homestead, SFRPC23
hold for map 1-17: Miami-Dade <strong>Wastewater</strong> Treatment <strong>Facilities</strong>24
Hold for Map 1-18: Miami-Dade <strong>Water</strong> <strong>and</strong> Sewer Department District WWTP Locations <strong>and</strong>Approximate Service Area Boundaries25
c. Monroe CountyMonroe County does not have a countywide wastewater treatment system. The residents rely ona variety of different treatment systems. Because there is not a countywide system in place, eachdeveloper or homeowner has had to construct private onsite or small package treatment facilitiesto serve the development or home. The result of this is that there are approximately 23,000 onsitewastewater systems <strong>and</strong> 246 small wastewater treatment plants throughout the study area 5 . Onlytwo cities, Key West <strong>and</strong> Key Colony Beach, have large wastewater treatment facilities.Sources used to gather information on Monroe County wastewater treatment facilities includedthe comprehensive plans for the Cities of Key West, Islamorada, <strong>and</strong> Marathon, as well as theMonroe County Sanitary <strong>Wastewater</strong> Master Plan <strong>and</strong> the <strong>Wastewater</strong> <strong>Facilities</strong> Plan With PhasedImplementation for the Marathon Area of the <strong>Florida</strong> Keys.The below information is supplemental to the regional wastewater discussion. This informationwas not used in the analysis of the wastewater facilities in the Region, nor was it used todetermine projected regional wastewater dem<strong>and</strong>.The five largest treatment plants in the study area, not including the City of Key West (Richard A.Heyman WWTP) <strong>and</strong> the City of Key Colony Beach, have a combined capacity of 1.75 milliongallons per day (mgd) <strong>and</strong> comprise 35 percent of the total permitted treatment capacity. Theseplants are identified in Table 1-6.Table 1-6: Five Largest WWTP’s in Monroe County, Excluding Key West <strong>and</strong> Key ColonyBeachFacility ID <strong>Wastewater</strong> Treatment Plant PermittedCapacity (mgd)FLA014867 Key Haven Utility 0.200FLA014705 Monroe County Detention Center 0.105FLA014951 Key West Resort Utilities 0.499N/A U.S. Naval Air Station 0.400N/A Ocean Reef Club 0.550TOTAL 1.754Source: Monroe County Sanitary <strong>Wastewater</strong> Master Plan, pg. 3-3The predominant method of wastewater treatment in the Keys is Onsite <strong>Wastewater</strong> TreatmentSystems (OWTS). There are approximately 23,000 of these currently in operation. There are avariety of different types of OWTS’s, including cesspools, conventional OWTS, which includeseptic tanks <strong>and</strong> drainfields, aerobic treatment units (ATU’s), <strong>and</strong> nutrient reduction systems.Approximately 2,800 cesspools are still in operation throughout the Keys, as well as 640permitted ATU systems.An analysis of the wastewater treatment situation in the City of Key West, City of Key ColonyBeach, Islamorada, <strong>and</strong> the City of Marathon is given in Appendix C.5 The study area for the Monroe County Sanitary <strong>Wastewater</strong> Master Plan includes the entire developed area of the<strong>Florida</strong> Keys with the exception of the cities of Key West <strong>and</strong> Key Colony Beach.26
3. STORMWATER MANAGEMENT SYSTEMa. Broward CountyThe <strong>Stormwater</strong> management system in Broward County is a three-tiered system, the primarycanals, the secondary canals <strong>and</strong> the tertiary systems. The tertiary systems are made up ofcommunity lakes/on-site ponds, street <strong>and</strong> yard grates, swales, ditches, <strong>and</strong> canals. These aremaintained by the neighborhood in which they are located. The secondary system is usually anetwork of canals, structures, pumping stations <strong>and</strong> storages areas. These drainage systems cancover large areas <strong>and</strong> encompass several neighborhoods <strong>and</strong> communities. Local DrainageDistricts, other special taxing districts, or the County/City are responsible for the maintenance<strong>and</strong> operation of these systems. The Primary Drainage System is a combination of <strong>South</strong> <strong>Florida</strong><strong>Water</strong> Management District canals, natural rivers, <strong>and</strong> other waterways, serving nine basins.PRIMARY CANALS AND BASINSThe independent <strong>and</strong> dependent districts throughout Broward County operate <strong>and</strong> control thesecondary canal system. These bodies of water flow into what is known as the primary canalsystem. The primary system is controlled <strong>and</strong> operated by the <strong>South</strong> <strong>Florida</strong> <strong>Water</strong> ManagementDistrict. The following information on the primary canals <strong>and</strong> basin is the from the <strong>South</strong> <strong>Florida</strong><strong>Water</strong> Management District’s An Atlas of Eastern Broward County Surface <strong>Water</strong> Management Basins(November 1987).The identified primary canals in Broward County are shown on Map 1-20 <strong>and</strong> a map showing theboundaries of each basin is shown on Map 1-21.Hillsboro Canal BasinThe Hillsboro Canal basin has an area of approximately 102 square miles <strong>and</strong> is located innortheastern Broward County (40 square miles) <strong>and</strong> southeastern Palm Beach County (62 squaremiles).C-14 (Cypress Creek Canal) BasinThe C-14 basin has an area of approximately 59 square miles <strong>and</strong> is located in northeasternBroward County. The C-14 basin is divided into an eastern basin (34 square miles) <strong>and</strong> a westernbasin (25 square miles).Pompano Canal BasinThe Pompano Canal basin has an area of approximately 7.2 square miles <strong>and</strong> is located innortheastern Broward County.C-13 (Middle River Canal) BasinThe C-13 basin has an area of approximately 39 square miles <strong>and</strong> is located in eastern BrowardCounty. The C-13 basin in divided into an eastern basin (9 square miles) <strong>and</strong> a western basin (30square miles). The boundary between the basins runs approximately north-south through S-36.A five square mile area north of the eastern C-13 basin drains to the North Fork of the MiddleRiver <strong>and</strong> is known as the North Fork of the Middle River basin.C-12 (Plantation Canal) BasinThe C-12 basin has an area of approximately 19 square miles <strong>and</strong> is located in eastern BrowardCounty.27
North New River Canal BasinThe North New River Canal (NNRC) basin has an area of approximately 30 square miles <strong>and</strong> islocated in eastern Broward County. The NNRC basin is divided into an eastern basin (7 squaremiles) <strong>and</strong> a western basin (23 square miles).C-11 (<strong>South</strong> New River Canal) BasinThe C-11 basin has an area of approximately 104 square miles <strong>and</strong> is located in south centralBroward County. The C-11 basin is divided into a western basin (81 square miles) <strong>and</strong> an easternbasin (23 square miles).C-10 (Hollywood Canal) BasinThe C-10 basin has an area of approximately 15 square miles <strong>and</strong> is located in southeast BrowardCounty. The Project canals in the C-10 basin provide flood protection <strong>and</strong> drainage for the C-10basin.C-9 (Snake Creek Canal) BasinThe C-9 basin has an area of approximately 98 square miles <strong>and</strong> is located in northeastern Miami-Dade County (39 square miles) <strong>and</strong> southeastern Broward County (59 square miles). The basin iscomprised of two sub-basins, C-9 east (45 square miles) <strong>and</strong> C-9 west (53 square miles). Theboundary between the sub-basins is Flamingo Road in Broward County <strong>and</strong> N.W. 67 th Avenue inMiami-Dade County.SPECIAL TAXING DISTRICTSWithin Broward County there are seventeen special taxing districts, eleven independent <strong>and</strong> sixdependent, that deal exclusively with water control. There are also two CommunityDevelopment Districts that were identified by Broward County as having some water controlresponsibilities. The districts are responsible for operating <strong>and</strong> maintaining drainage systemswithin their boundaries. The Broward County Office of Environmental Services, <strong>Water</strong>Management Division is responsible for the six dependent districts <strong>and</strong> the unincorporatedneighborhoods in the county, which are not within an independent district.Permitting is done by the independent drainage districts within their boundaries <strong>and</strong> by BrowardCounty Department of Environmental Protection for areas outside of the independent districts.The <strong>South</strong> <strong>Florida</strong> <strong>Water</strong> Management District (SFWMD) permits larger developmentsthroughout the County.The boundaries of the following districts are shown on Map 1-22. The Broward County Office ofEnvironmental Services, <strong>Water</strong> Management Division, provides this map. The lists below arecurrent as of December 2004, while the map is current as of July 1999. Some of the districts thatare shown on the map are no longer active, or have been dissolved.Broward County Independent Districts 6Central Broward <strong>Water</strong> Control DistrictCoral Springs Improvement DistrictHillsboro Inlet DistrictNorth Lauderdale <strong>Water</strong> Control DistrictNorth Springs Improvement District6 Broward County Office of Environmental Services, <strong>Water</strong> Management Division; State of <strong>Florida</strong> Department of CommunityAffairs, Special District Information Program28
Old Plantation <strong>Water</strong> Control DistrictPine Tree <strong>Water</strong> Control DistrictPlantation Acres Improvement District<strong>South</strong> Broward Drainage DistrictSunshine <strong>Water</strong> Control DistrictTindall Hammock Irrigation <strong>and</strong> Soil Conservation DistrictIndian Trace Community Development DistrictTurtle Run Community Development DistrictBroward County Dependent DistrictsCocomar <strong>Water</strong> Control DistrictLauderdale Isles <strong>Water</strong> Management DistrictTwin Lakes <strong>Water</strong> Control District<strong>Water</strong> Control District #2<strong>Water</strong> Control District #3<strong>Water</strong> Control District #429
Hold for map 1-20:Broward County Primary <strong>and</strong> Secondary Canals30
Hold for Map 1-21: Broward County Drainage Basins31
Hold for map 1-22: Broward County Drainage Districts32
. Miami-Dade CountyPrimary Canal SystemThere are seventeen primary canals that serve as the water management or stormwatermanagement system for Miami-Dade County. Information on the primary canals <strong>and</strong> basin inMiami-Dade County is from the <strong>South</strong> <strong>Florida</strong> <strong>Water</strong> Management District’s An Atlas of EasternDade County Surface <strong>Water</strong> Management Basins (October, 1987).The primary canals <strong>and</strong> the basins in Miami-Dade County are shown on Map 1-23 <strong>and</strong> a mapshowing the boundaries of each basin is shown on Map 1-24.C-9 (Snake Creek Canal) BasinThe C-9 basin has an area of approximately 98 square miles <strong>and</strong> is located in northeastern Miami-Dade County (39 square miles) <strong>and</strong> southeastern Broward County (59 square miles). The basin iscomprised of two sub-basins, C-9 East (52 square miles) <strong>and</strong> C-9 West (45 square miles). Theboundary between the sub-basins is Flamingo Road in Broward County <strong>and</strong> N.W. 67 th Ave. inMiami-Dade County.C-8 (Biscayne Canal) BasinThe C-8 basin has an area of approximately 31.5 square miles <strong>and</strong> is located in northeasternMiami-Dade County. C-8 begins in the east borrow of the Palmetto Expressway at the northwestcorner of the Miami Lakes subdivision. Flow in the canal is to the east with discharge via S-28 toBiscayne Bay just south of the municipal boundary between Miami Shores <strong>and</strong> Biscayne Park.C-7 (Little River Canal) BasinThe C-7 basin has an area of approximately 35 square miles <strong>and</strong> is located in northeastern Miami-Dade County.C-6 (Miami Canal) BasinThe C-6 basin has an area of approximately 69 square miles <strong>and</strong> is located in eastern Miami-DadeCounty. The C-6 begins at S-31 at the intersection of L-30 <strong>and</strong> L-33 just west of State Road 27.Flow in the canal is to the southeast with discharge via S-26 to Biscayne Bay just north of U.S.Highway 41.C-4 (Tamiami Canal) BasinThe C-4 basin has an area of approximately 60.9 square miles <strong>and</strong> is located in eastern Miami-Dade County.C-5 (Comfort Canal) BasinThe C-5 basin has an area of 2.3 square miles <strong>and</strong> is located in eastern Miami-Dade County.C-3 (Coral Gables Canal) BasinThe C-3 basin has an area of approximately 18 square miles <strong>and</strong> is located in eastern Miami-DadeCounty.C-2 (Snapper Creek Canal) BasinThe C-2 basin has an area of approximately 53 square miles <strong>and</strong> is located in eastern Miami-DadeCounty.33
C-100 BasinThe C-100 basin has an area of approximately 40.6 square miles <strong>and</strong> is located in eastern Miami-Dade County. The basin is also known as the Cutler Drainage Basin.C-1 (Black Creek Canal) BasinThe C-1 basin has an area of approximately 56.9 square miles <strong>and</strong> is located in southeasternMiami-Dade County.C-102 BasinThe C-102 basin has an area of approximately 25.4 square miles <strong>and</strong> is located in southeasternMiami-Dade County.C-103 BasinThe C-103 basin has an area of approximately 40.6 square miles <strong>and</strong> is located in southeastMiami-Dade County.North Canal, <strong>Florida</strong> City Canal, Model L<strong>and</strong>, <strong>and</strong> Homestead Air Force Base BasinThe area occupied by the Homestead Air Force Base, <strong>and</strong> the area south of the C-103 basin, eastof Old Dixie Highway, <strong>and</strong> Card Sound Road, <strong>and</strong> west <strong>and</strong> north of L-31E is drained by fiveexisting Miami-Dade County canals: The five canals are:1. The Military Canal which drains the 4.7 square miles of the Homestead Air Force Base2. The North Canal which drains 7.8 square miles3. The <strong>Florida</strong> City Canal which drains 12.5 square miles4. The North Model L<strong>and</strong> Canal, <strong>and</strong>5. The <strong>South</strong> Model L<strong>and</strong> Canal, which together drain 28.1 square miles.C-111 BasinThe C-111 basin has an area of approximately 100 square miles <strong>and</strong> is located in southern Miami-Dade County.34
Hold for Map 1-23: Miami-Dade County Primary <strong>and</strong> Secondary Canals35
Hold for Map 1-24: Miami-Dade County Drainage Basins36
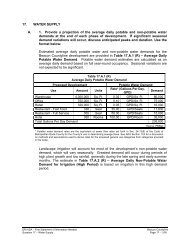
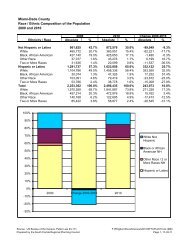
B. BASELINE DATAProject baselines for regional population <strong>and</strong> growth were established in 5-year increments, from2005 to 2030. Population projections from three different sources were used in the study. Theyare: USACE, Municipal <strong>and</strong> Industrial (M&I) <strong>Water</strong> Use Forecast, Initial CERP Update (August2003), University of <strong>Florida</strong>, Bureau of Economic <strong>and</strong> Business Research (BEBR) (February 2004) –Medium Projection, <strong>and</strong> population projections by each of the three counties. Table 1-11 showsthe CERP projections, Table 1-12 shows the BEBR projections, <strong>and</strong> Table 1-13 shows eachcounty’s projections.Table 1-11: CERP Population Projections2005 2010 2015 2020 2025 2030Broward 1,772,800 1,931,600 2,092,300 2,257,100 2,416,900 2,562,900Miami-Dade 2,403,200 2,554,300 2,706,500 2,862,000 3,011,900 3,148,100Monroe 81,300 82,200 83,100 84,100 85,000 85,800Regional Total 4,257,300 4,568,100 4,881,900 5,203,200 5,513,800 5,796,800Source: CERP, 08/03Table 1-12: BEBR Population Projections2005 2010 2015 2020 2025 2030Broward 1,785,700 1,949,400 2,117,300 2,289,900 2,458,200 2,612,700Miami-Dade 2,405,100 2,557,100 2,712,100 2,870,600 3,024,200 3,164,300Monroe 80,300 81,100 81,800 82,600 83,300 84,000Regional Total 4,271,100 4,587,600 4,911,200 5,243,100 5,565,700 5,861,000Source: BEBR, 02/04Table 1-13: County Population Projections2005 2010 2015 2020 2025 2030Broward (June 2002) 1,789,916 1,954,572 2,117,038 2,273,287 2,418,641 2,548,303Miami-Dade (July 2004) 2,402,117 2,551,284 2,703,117 2,858,184 3,019,787 3,187,776Monroe (1999) 88,305 90,236 90,654 N/A N/A N/ARegional Total 4,280,338 4,596,092 4,910,809 5,131,471 5,438,428 5,736,079Source: Broward County, Miami-Dade County, <strong>and</strong> Monroe CountyTable 1-14 shows the 2004 populations that were used in the study. The source for these numbersis the University of <strong>Florida</strong>, Bureau of Economic <strong>and</strong> Business Research (BEBR).Table 1-14: 2004 BEBR County Populations2004 PopulationBroward 1,723,131Miami-Dade 2,379,818Monroe 81,236Regional Total 4,184,185Source: BEBR, 200437
IV.TASK 4 – CAPACITY ANALYSISTo verify the existing capacity of all identified water <strong>and</strong> sewer treatment plants <strong>and</strong> stormwaterfacilities, a survey was sent out to all identified water <strong>and</strong> wastewater treatment plants. Pleasesee Appendix B for the survey <strong>and</strong> additional survey information for each identified facility.A. WATER TREATMENT PLANTS1. The RegionThere are thirty-five water treatment facilities in Broward, Miami-Dade, <strong>and</strong> Monroe Counties.Together, these facilities provide clean, potable water to nearly 4 million people throughout theRegion. Of the thirty-five facilities, twenty-seven are located in Broward County, <strong>and</strong> eight arelocated in Miami-Dade County, including the <strong>Florida</strong> Keys Aqueduct Authority, which providespotable water to Monroe County residents.The design capacity of the thirty-five facilities is 1013.146 million gallons a day (mgd), while thetotal permitted capacity is 889.634 mgd. During times of maximum day dem<strong>and</strong>, 755.209 mgdare being distributed throughout the Region. This dem<strong>and</strong> represents 84.9% of the totalpermitted capacity of the facilities. The annual average dem<strong>and</strong> for water at the Region’sfacilities totals 639.896 mgd, which represents 71.9% of the total permitted capacity.Based on the information gathered from the Infrastructure Survey, an additional 158.26 mgd ofcapacity will be added to these facilities by 2025. This will bring the total capacity in the Region to1171.406 7 mgd. <strong>Water</strong> capacity, by county, is shown in Table 4-1.Table 4-1: Regional WTP CapacityPLANT NAMEDESIGNCAPACITY(MGD)PERMITTEDCAPACITY(MGD)PEAKFLOW(MGD)AVG.ANNUALDAILY FLOW(MGD)ADDITIONALCAPACITY(MGD)Broward County 490.646 415.944 319.005 241.984 37.0Miami-Dade County 500.50 453.76 412.404 380.312 111.26Monroe County 22.0 19.93 23.8 17.6 10.0Region Total 1013.146 889.634 755.209 639.896 158.260Source: SFRPC, Broward County, Miami-Dade County, FKAAThe twenty-seven facilities in Broward County account for 48.4% of the total design capacity in theRegion, while they account for 46.8% of the total permitted capacity in the Region. Miami-DadeCounty accounts for 49.4% of the Region’s design capacity, <strong>and</strong> 51.0% of the permitted capacity,while Monroe County accounts for 2.2% of both the design <strong>and</strong> permitted capacities.Broward County accounts for 42.2% of the maximum day dem<strong>and</strong> in the Region, while Miami-Dade County accounts for 54.6% <strong>and</strong> Monroe County 3.2% of the maximum day dem<strong>and</strong>. Thebreakdown of average annual daily dem<strong>and</strong> is: Broward County, 37.8%; Miami-Dade County,59.4%; <strong>and</strong> Monroe County, 2.8%.7 The total capacity is the current design capacity plus the known capacity increases in each county.38
Of the 158.26 mgd of additional capacity that will be added in the Region in the next 25 years,23.4% of it will be added in Broward County, 70.3% in Miami-Dade County, <strong>and</strong> 6.3% in MonroeCounty. Figure 4-1 shows this information graphically.Figure 4-1: Region-wide <strong>Water</strong> Capacity, by CountyCounty Percentages100%90%80%70%60%50%40%30%20%10%0%Design Cap. Permitted Capacity Peak Flow Avg. Annual DailyFlowBroward Miami-Dade MonroeProposed AdditionalCapacitySource: SFRPC39
2. Broward CountyThere are twenty-seven water treatment facilities located in Broward County. They are: BrowardCounty 1A <strong>Water</strong> Treatment Plant, Broward County 2A <strong>Water</strong> Treatment Plant, the City of CoralSprings, the City of Dania Beach <strong>Water</strong> Treatment Plant, the City of Hall<strong>and</strong>ale Beach, CooperCity Utilities, Hollywood <strong>Water</strong> Treatment Plant, Sawgrass <strong>Water</strong> Treatment Plant (Sunrise #3),Springtree <strong>Water</strong> Treatment Plant (Sunrise #1), <strong>South</strong>west (S. Broward) <strong>Water</strong> Treatment Plant,Park City <strong>Water</strong> Treatment Plant (Sunrise #2), Fiveash <strong>Water</strong> Plant (Fort Lauderdale), City ofMargate <strong>Water</strong> Treatment Plant, Ferncrest Utilities, Pompano Beach <strong>Water</strong> Treatment Plant, Cityof Tamarac Utilities West, Deerfield Beach East <strong>and</strong> West <strong>Water</strong> Plants, Miramar West <strong>Water</strong>Plant, Coral Springs Improvement District, North Springs Improvement District, Davie <strong>Water</strong>Treatment Plants I <strong>and</strong> III, the City of Lauderhill, Pembroke Pines <strong>Water</strong> Treatment Plant #2, <strong>and</strong>Plantation East <strong>and</strong> Central <strong>Water</strong> Treatment Plants. The locations of these facilities are shown inthe Broward County Potable <strong>Water</strong> Service Areas <strong>and</strong> Treatment <strong>Facilities</strong> Map (Map 1-1) as wellas in Table 1-1.The total permitted capacity for the facilities located in Broward County totals 415.944 mgd, whilethe design capacity totals 490.646 mgd. During maximum day dem<strong>and</strong>, 319.005 mgd are beingused, representing 76.7% of permitted capacity. The annual average dem<strong>and</strong> for treated water inBroward County is 241.984 mgd, which is 58.2% of permitted capacity.Eight of the twenty-seven facilities reported that additional capacity will be added. Theseadditions will add 37.0 mgd of capacity to the County, bringing the permitted capacity up to452.944 mgd. It is expected that these expansion projects will be completed by 2008. See Table 4-2 for information on each individual plant.These twenty-seven facilities provide water service to more than 1.3 million people per day. Thelargest providers in the county are Broward County, the City of Hollywood, Sunrise <strong>Water</strong>Treatment Plants, <strong>and</strong> the Fiveash <strong>Water</strong> Plant in Fort Lauderdale.40
Table 4-2: Broward County WTP CapacitiesPLANT NAMEDESIGNCAPACITY(MGD)PERMITTEDCAPACITY(MGD)PEAKFLOW(MGD)AVG.ANNUALDAILY FLOW(MGD)ADDITIONALCAPACITY(MGD) & YearBroward County 1A WTP 16.0 16.0 9.0 8.3 None ReportedBroward County 2A WTP 40.0 30.0 17.4 15.4 None ReportedCity of Coral Springs 16.0 16.0 10.3 8.4 None ReportedCity of Dania Beach WTP 3.0 4.0 3.394 2.789 4.5 – 2007City of Hall<strong>and</strong>ale Beach 10.0 10.0 7.0 5.8 6.0 - 2006Cooper City Utilities 7.0 7.0 5.7 2.89 None ReportedHollywood WTP 61.0 57.5 32.8 26.0 None ReportedSawgrass WTP – Sunrise #3 18.0 18.0 12.2 8.79 6.0 – 2006Springtree WTP – Sunrise 24.0 24.0 22.7 17.92 4.0 – 2006#1<strong>South</strong>west WTP (S.2.0 2.0 1.88 0.54 None ReportedBroward)Park City WTP (Sunrise #2) 6.0 6.0 5.53 2.9 None ReportedFiveash <strong>Water</strong> Plant 75.0 67.3 57.1 42.5 None ReportedHillsboro Beach <strong>Water</strong> 2.016 1.0 1.3 1.09 None ReportedPlantCity of Margate WTP 18.0 13.51 9.077 6.991 None ReportedFerncrest Utilities 1.0 1.0 0.874 0.768 None ReportedPompano Beach WTP 50.0 24.0 21.9 17.2 None ReportedCity of Tamarac Utilities 20.0 8.3 13.07 6.441 None ReportedWestDeerfield Beach West WP 18.0 18.0 14.9 12.6 3.5 – 2008Deerfield Beach East WP 16.8 16.8 7.9 2.0Miramar West <strong>Water</strong> Plant 7.5 7.5 6.5 5.8 3.0 – 2007Coral Springs Improvement 7.12 5.75 5.45 4.226 None ReportedDistrictNorth Springs6.81 6.5474 5.41 4.11 None ReportedImprovement DistrictDavie WTP System I 3.4 3.4 1.193 0.951 None ReportedDavie WTP System III 4.0 4.0 3.57 3.41 4.0 – 2006City of Lauderhill 16.0 8.137 8.581 6.859 None ReportedPembroke Pines WTP #2 18.0 16.2 15.5 13.5 6.0 – 2005-2007Plantation Central WTP 12.0 12.0 10.564 7.041 None ReportedPlantation East WTP 12.0 12.0 8.212 6.768 None ReportedCounty Total 490.646 415.944 319.005 241.984 37.0 by 2008Sources: Broward County, City of Coral Springs, Dania Beach WTP, City of Hall<strong>and</strong>ale Beach, Cooper City Utilities, HollywoodWTP, City of Sunrise, City of Fort Lauderdale, Hillsboro Beach <strong>Water</strong> Plant, City of Margate, Ferncrest Utilities, Pompano BeachWTP, City of Tamarac Utilities, Deerfield Beach, Miramar, Coral Springs Improvement District, North Springs ImprovementDistrict, Town of Davie, City of Lauderhill, Pembroke Pines, <strong>and</strong> City of Plantation41
3. Miami-Dade CountySeven of the eight water treatment facilities located in Miami-Dade County provide water tocitizens of the county. They are: <strong>Florida</strong> City, the City of Homestead, the City of North MiamiWinson <strong>Water</strong> Plant 8 , the Norwood <strong>Water</strong> Plant (North Miami Beach) 9 , <strong>and</strong> the three waterplants that are operated by the Miami-Dade <strong>Water</strong> <strong>and</strong> Sewer Department (MD WASD):Alex<strong>and</strong>er Orr, Hialeah-Preston <strong>and</strong> <strong>South</strong> Miami-Dade 10 . The locations of these facilities areshown in the Miami-Dade County Potable <strong>Water</strong> Service Areas <strong>and</strong> Treatment <strong>Facilities</strong> Map(Map 1-2) as well as in Table 1-2.The total design capacity of the seven facilities that serve Miami-Dade County is 500.50 milliongallons per day (mgd), while the total permitted capacity is 453.76 mgd. The peak dem<strong>and</strong> forwater in Miami-Dade is 412.404 mgd, which represents 90.9% of the total permitted capacity. Theannual average dem<strong>and</strong> for water is 380.312 mgd, which represents 83.8% of the permittedcapacity. Five of the seven facilities report that additional capacity will be added to theirfacilities. These additions will add 111.26 mgd of water capacity. This will bring the totalpermitted capacity in Miami-Dade County to 565.02 mgd. See Table 4-3 for details on eachindividual plant.The seven facilities provide water to the entire population of Miami-Dade County through474,042 service connections. The largest provider in the County is the Miami-Dade <strong>Water</strong> <strong>and</strong>Sewer Department, which provides service to 410,000 retail customers <strong>and</strong> fifteen wholesalecustomers. 118 City of North Miami receives 50% of its water service from WASD, while the Winson Plant provides the other50%. The Winson Plant also provides water service to Biscayne Park <strong>and</strong> parts of Unincorporated Miami-DadeCounty.9 The City of North Miami Beach receives 50% of its water service from WASD, while the Norwood <strong>Water</strong> Plantprovides water to the other 50%. The Norwood Plant also provides water service to Sunny Isles Beach, MiamiGardens, Golden Beach, <strong>and</strong> Aventura.10 The <strong>South</strong> Miami-Dade <strong>Water</strong> Treatment Plant is currently under construction. The data provided is thecumulative total of five small plants that the County uses. These plants are: Leisure City WTP, Everglades LaborCamp WTP, Newton WTP, Elevated Tank WTP, <strong>and</strong> Naranja Lakes WTP. These plants will be non-operationalonce the <strong>South</strong> Miami-Dade WTP is completed.11 The fifteen wholesale customers are: Hialeah, Miami Beach, North Miami Beach, North Miami, Opa-Locka,Miami Springs, Hialeah Gardens, Bal Harbour, North Bay Village, Medley, Bay Harbor Isl<strong>and</strong>s, Surfside, WestMiami, Indian Creek Village, <strong>and</strong> Virginia Gardens.42
Table 4-3: Miami-Dade County WTP CapacitiesPLANT NAME DESIGN PERMITTED PEAK AVG. ANNUAL ADDITIONALCAPACITY CAPACITY FLOW DAILY FLOW CAPACITY(MGD) (MGD) (MGD) (MGD)(MGD) & Year<strong>Florida</strong> City 4.03 3.51 3.604 2.983 None ReportedCity of Homestead 16.7 11.7 10.9 8.499 5.0 – 2008North Miami Beach 16.0 16.0 16.0 15.5 16.0 – 2006Norwood <strong>Water</strong> PlantNorth Miami Winson 9.0 9.3 10.0 8.5 None Reported<strong>Water</strong> Plant<strong>South</strong> Miami Dade 12.03 10.95 8.8 6.8 20.0 – 2006Alex<strong>and</strong>er Orr 217.74 203.11 185.5 171.93 60.26 – 2013Hialeah-Preston 225.0 199.19 177.6 166.1 10.0 – 2005County Total 500.50 453.76 412.404 380.312 111.26 by 2013Sources: FL DEP, City of <strong>Florida</strong> City, City of Homestead, City of North Miami Beach, City of North Miami, <strong>and</strong> MD WASD.43
4. Monroe CountyMonroe County residents receive their water from the J. Robert Dean <strong>Water</strong> Treatment Plant thatis operated by the <strong>Florida</strong> Keys Aqueduct Authority. Though the plant is located in Miami-DadeCounty, it only serves those residents living in Monroe County <strong>and</strong> the <strong>Florida</strong> Keys. Thelocation of the facility is shown on the Monroe County FDEP Potable <strong>Water</strong> Treatment FacilityMap (Map 1-3) as well as in Table 1-3. Table 4-4 shows capacity information for the plant.The permitted capacity for this facility is 19.93 mgd, while the design capacity is 22.0 mgd.During times of peak dem<strong>and</strong>, the plant is running above capacity, at 23.8 mgd, which is 119.4%of the permitted capacity. The annual average daily dem<strong>and</strong> for water is 17.6 mgd, which is88.3% of the permitted capacity. The facility reports that an additional 10.0 mgd of capacity willbe added to the plant by 2025. This will bring the total permitted capacity to 29.93 mgd.The J. Robert Dean <strong>Water</strong> Treatment Plant reports having 40,000 residential connections <strong>and</strong>5,000 non-residential connections.Table 4-4: Monroe County WTP CapacityPLANT NAMEDESIGNCAPACITY(MGD)PERMITTEDCAPACITY(MGD)PEAKFLOW(MGD)AVG.ANNUALDAILY FLOW(MGD)ADDITIONALCAPACITY(MGD) & YearJ. Robert Dean <strong>Water</strong> 22.0 19.93 23.8 17.6 10.0 - 2025Treatment PlantSource: <strong>Florida</strong> Keys Aqueduct Authority (FKAA)44
B. WASTEWATER TREATMENT PLANTS1. The RegionSeventeen wastewater facilities have been identified in the Region. Of these, four are in Miami-Dade County <strong>and</strong> thirteen are in Broward County. The total wastewater design capacity in theRegion is 649.62 million gallons per day (mgd). The total permitted capacity is slightly less, at645.16 mgd. The peak dem<strong>and</strong> in the region is 750.493 mgd. Currently, during peak dem<strong>and</strong>,116.3% of the permitted capacity in the Region is being used. The average annual daily flow inthe Region is 484.323 mgd, which represents 75.1% of the permitted capacity.An additional 89.5 mgd of capacity is scheduled to be added to the Region by 2009. This willbring the total capacity in the Region to 739.12 mgd. Table 4-5 provides a breakdown of the databy county.Table 4-5: Regional WWTP CapacitiesPLANT NAMEDESIGNCAPACITY(MGD)PERMITTEDCAPACITY(MGD)PEAKFLOW(MGD)AVG.ANNUALDAILYFLOW(MGD)Miami-Dade County 374.0 374.0 364.52 275.0 13.5Broward County 275.62 271.16 385.973 209.3233 76.0Region Total 649.62 645.16 750.493 484.323 89.5Source: SFRPC, Broward County, Miami-Dade CountyADDITIONALCAPACITY(MGD)The thirteen-wastewater treatment plants in Broward County account for 42.4% of the totalRegional design capacity <strong>and</strong> 42.0% of the total Regional permitted capacity. The four facilities inMiami-Dade County account for the remainder of the capacity in the Region. Figure 4-2 showsthe breakdown by county for each of the categories in Table 4-5.Figure 4-2: Regional-wide <strong>Wastewater</strong> Capacity, by County100%90%80%70%60%50%40%30%20%10%0%Design Cap.Broward CountyCounty PercentagesPermittedCapacityMiami-Dade CountyPeak FlowAvg. AnnualDaily FlowProposedAdditionalCapacitySource: SFRPC45
2. Broward CountyThere is no centralized wastewater system in Broward County. While Broward County doesoperate <strong>and</strong> provide sewer service to many areas, several municipalities operate their own plants.The wastewater facilities operating in Broward County are: the Town of Davie WWTP, CooperCity Utilities, Hollywood <strong>South</strong>ern Regional WWTP, Sawgrass Regional WWTF (Sunrise #3),Springtree Regional WWTF (Sunrise #1), <strong>South</strong> Broward (<strong>South</strong>west) WWTF, Broward CountyNorth Regional WWTF, Plantation Regional WWTP, the G.T. Lohmeyer Plant (City of FortLauderdale), Coral Springs Improvement District, City of Margate East <strong>and</strong> West WWTP’s,Ferncrest Utilities, Pompano Beach Treated <strong>Wastewater</strong> Effluent Irrigation Facility, <strong>and</strong> the Cityof Pembroke Pines WWTF. The locations of these facilities are shown in the Broward County<strong>Wastewater</strong> Treatment <strong>Facilities</strong> Map (Map 1-5) as well as in Table 1-4.The total wastewater permitted capacity in Broward County is 275.62 mgd. The average annualdaily dem<strong>and</strong>, 209.323 mgd, represents 77.2% of the permitted capacity, while the peak dem<strong>and</strong>,385.973 mgd, represents 142.3% of the capacity. The breakdown for each facility is shown inTable 4-6. Additional facility information is shown in Appendix B.A total of 76.0 mgd of additional capacity will be added to four facilities by 2007. The BrowardCounty N. Regional WWTF reports it will be adding 20.0 MGD by 2006. An additional 2.0 mgdwill be added to the Davie WWTP by 2007 <strong>and</strong> the Hollywood <strong>South</strong>ern Regional WWTP will beadding 54.0 mgd by 2006. These additions will bring the total permitted capacity in BrowardCounty to 351.62 mgd.Table 4-6: Broward County WWTP CapacitiesPLANT NAMEDESIGNCAPACITY(MGD)PERMITTEDCAPACITY(MGD)PEAKFLOW(MGD)AVG. ANNUALDAILY FLOW(MGD)ADDITIONALCAPACITY(MGD) &YearBroward County N. 84.0 80.0 144.78 69.83 20.0 – 2006Regional WWTFCooper City Utilities 3.75 3.44 4.27 2.7 None ReportedCoral Springs 8.33 8.33 7.06 5.01 None ReportedImprovement DistrictDavie WWTP 5.0 4.85 3.83 3.2 2.0 – 2007Ferncrest Utilities 0.6 0.6 0.95 0.48 None ReportedG.T. Lohmeyer Plant 55.7 55.7 85.312 34.493 None ReportedHollywood <strong>South</strong>ern 48.75 48.75 49.9 42.5 54.0 – 2006Regional WWTPMargate East & West 10.1 10.1 11.8 6.42 None ReportedWWTPPembroke Pines WWTF 9.5 9.5 8.811 6.5503 None ReportedPlantation Regional 18.9 18.9 30.0 17.5 None ReportedWWTF<strong>South</strong> Broward WWTF 0.99 0.99 1.66 0.47 None ReportedSunrise #1 (Springtree) 10.0 10.0 15.0 8.2 None ReportedSunrise #3 (Sawgrass) 20.0 20.0 22.6 11.97 None ReportedCounty Total 275.62 271.16 385.973 209.323 76.0 b y 2006Sources: Broward County, City of Cooper City, Coral Springs Improvement District, Town of Davie, Ferncrest Utilities, Cityof Fort Lauderdale, City of Hollywood, City of Margate, City of Pembroke Pines, City of Plantation, City of Sunrise.46
3. Miami-Dade CountyThe four facilities located in Miami-Dade County are the City of Homestead <strong>Wastewater</strong>Treatment Facility, the Miami-Dade North District <strong>Wastewater</strong> Treatment Plant, the Miami-DadeCentral <strong>Wastewater</strong> Treatment Plant <strong>and</strong> the <strong>South</strong> District <strong>Wastewater</strong> Treatment Plant. Thelocations of these facilities are shown in the Miami-Dade County <strong>Wastewater</strong> Treatment <strong>Facilities</strong>Map (Map 1-17) as well as in Table 1-5.The City of Homestead <strong>Wastewater</strong> Treatment Facility provides wastewater service to 10,100residential <strong>and</strong> non-residential customers. The three Miami-Dade <strong>Water</strong> <strong>and</strong> Sewer Department(WASD) wastewater facilities provide sewer service to approximately 315,000 retail customers<strong>and</strong> thirteen wholesale customers.The total wastewater permitted capacity in Miami-Dade County is 374.0 mgd. The averageannual daily dem<strong>and</strong>, 275.0 mgd, represents 73.5% of the permitted capacity in the county, whilethe peak dem<strong>and</strong>, 364.52 mgd represents 97.5% of the capacity. Information for each facility isshown below in Table 5-7. Additional facility data is shown Appendix B.Two of the four facilities report that additional capacity will be added. The City of Homestead<strong>Wastewater</strong> Treatment Facility is adding an additional 6.0 mgd by 2009. The Miami-Dade NorthDistrict <strong>Wastewater</strong> Treatment Plant will be adding an additional 7.5 mgd of capacity to theirfacility by 2005. These additions will bring the total capacity in Miami-Dade County to 387.5mgd by 2009.Table 4-7: Miami-Dade County WWTP CapacitiesPLANT NAMEDESIGNCAPACITY(MGD)PERMITTEDCAPACITY(MGD)PEAKFLOW(MGD)AVG.ANNUALDAILY FLOW(MGD)ADDITIONALCAPACITY(MGD) & YearHomestead 6.0 6.0 12.0 4.73 6.0 - 2009M-D North District 112.5 112.5 98.94 84.99 7.5 - 2005M-D Central District 143.0 143.0 138.2 101.01 0.0M-D <strong>South</strong> District 112.5 112.5 115.38 84.27 0.0County Total 374.0 374.0 364.52 275.0 13.5 by 2009Sources: City of Homestead <strong>and</strong> Miami-Dade <strong>Water</strong> <strong>and</strong> Sewer Department4. Monroe CountyInformation on the wastewater treatment plants located throughout Monroe County can be foundon page 26, as well as in Appendix C.47
C. STORMWATER MANAGEMENT SYSTEMThe surface water management basins of eastern Broward <strong>and</strong> Miami-Dade Counties were firstdelineated in the 1950’s by the U.S. Army Corps of Engineers (COE) in their General DesignMemor<strong>and</strong>um (GDM) for the Central <strong>and</strong> <strong>South</strong>ern <strong>Florida</strong> Flood Control Project (Project). Basedon the hydrology of the basins, the COE designed <strong>and</strong> constructed a system of canals, levees, <strong>and</strong>control structures to provide flood protection for southern <strong>and</strong> central <strong>Florida</strong>.The Project canals serve a variety of functions. The primary function of the canals is to provideflood protection for the basins in which they occur. Secondary uses of the canals include l<strong>and</strong>drainage for agriculture <strong>and</strong> urban or residential development, <strong>and</strong> regulation of groundwatertable elevations to prevent saltwater intrusion into local groundwater. Many of the canals are usedto supply water for irrigation <strong>and</strong> to recharge the wellfields of local municipalities.The Project control structures regulate the flow of water in the canals. In general they are used todischarge excess water from the basins during flooding <strong>and</strong> to maintain minimum water levels inthe canal during drought periods. Some structures are usually closed to prevent water frompassing from one basin to another, but can be opened to supply water from one basin or canal toanother as necessary. The coastal structures have the additional function of preventing saltwaterfrom a tidal or storm surge from entering those canals discharging to tidewater.1. Broward CountyThe information on the primary canals <strong>and</strong> basins in Broward County is from the <strong>South</strong> <strong>Florida</strong><strong>Water</strong> Management District’s An Atlas of Eastern Broward County Surface <strong>Water</strong> Management Basins(November 1987).There are nine basins in eastern Broward County. They are: the Hillsboro Canal, C-14, Pompano,C-13, C-12, North New River Canal, C-11, C-10, <strong>and</strong> C-9. A map depicting the boundaries of eachbasin in Broward County is shown on Map 1-21.Hillsboro Canal BasinThere are two Project canals in the Hillsboro Canal basin: the Hillsboro Canal <strong>and</strong> the section ofthe L-36 borrow canal between the Hillsboro Canal <strong>and</strong> S-38B. There are four Project structuresregulating flow in the Hillsboro Canal Basin: S-38B, S-39, S-39A, <strong>and</strong> Deerfield Lock (G-56).Design criteria for these structures are given in Table 4-8.The Project canals <strong>and</strong> control structure in the Hillsboro Canal basin have five functions: 1) toprovide flood protection <strong>and</strong> drainage for the basin; 2) to supply water to the basin duringperiods of low natural flow; 3) to convey excess water from <strong>Water</strong> Conservation Area (WCA) 1 totidewater; 4) to intercept <strong>and</strong> control seepage from WCA 2A; <strong>and</strong> 5) to maintain a groundwatersurface elevation west of Deerfield Lock adequate to prevent saltwater intrusion into localgroundwater.There is no design storm for the Hillsboro Canal. It was built prior to the Project.The Canal above Deerfield Lock will pass approximately 1600 cubic feet per second (cfs) withoutany flooding occurring in the basin. This provides flood protection of around three-quarters ofan inch of runoff per day; however, allowable runoff into the canal above Deerfield Lock is 1.3inches of runoff per day (35 cfs per square mile). The total allowable inflow to the canalupstream of the Deerfield Lock varies from 2500 to 2700 cfs depending on the drainage areaassumed. A hydraulic analysis made in 1974 indicated that if all culverts <strong>and</strong> pumps discharging48
into the canal were operated at the allowable runoff discharge, the tailwater state at S-39 wouldbe approximately 11ft NGVD. Stages above 9ft NGVD cause flooding in pasturel<strong>and</strong>s in thesouthwestern portion of the basin. To pass the allowable discharge at a stage no higher than 9ftNGVD, the Hillsboro Canal would have to be enlarged from Powerline Road to the west end at S-39. It would also require a new structure (to replace the spillway at Deerfield Lock) capable ofpassing approximately 3000 cfs at a difference between headwater <strong>and</strong> tailwater stages of 0.5ft.49
Table 4-8: Hillsboro Canal Basin Structures Design CriteriaStructureDeerfield Lock(G-56) Stage DivideS-39<strong>Water</strong> supply, regulatoryreleases to HillsboroCanal from WCA-1S-39AStage divideS-38BDivide C-14 <strong>and</strong>Hillsboro basinsTypeDesign HW(ft NGVD)Design TW(ft NGVD)Optimum State(ft NGVD)Design Q (cfs)Weir with flashboards5-bays, 12ft eachCrest lgth = 60ftCrest elev = 1.0ft NGVDGated spillwayCrest lgth = 25ftCrest elev = -4.5ft NGVD 4.0 3.5 HW = 7.7 1600SpillwayTaintor Gate 16ft x 9.2ftWeir lgth = 15ftCrest elev = 2.5ft NGVD 11.0 9TW = 9.0 max HW= WCA 1 regulationschedule 800Culvertwith riser <strong>and</strong> stop logs 3.72inx 54ft CMP HW = 7.0 - 7.5Gated Culvert1.66in x 72ft CMPInvert elev = 0ft NGVD 9.0 7.65Source: An Atlas of Eastern Broward County Surface <strong>Water</strong> Management Basins, November 1987. Pg. 10Peak Stage (ftNGVD) <strong>and</strong> Q (cfs)HW = 10.86TW = 9.2Q = 3700TW = 12.3950
C-14 (Cypress Creek Canal) BasinThere are seven project structures regulating flow in the C-14 basin: S-37A, S-37B, S-38, S-38A, S-38B, S-38C, <strong>and</strong> G-65. Design criteria for these structures are given in Table 4-9. The Projectcanals <strong>and</strong> control structures in the C-14 basin have five functions: 1) to provide flood protection<strong>and</strong> drainage for the basin; 2) to supply water to the C-14, Pompano Canal, <strong>and</strong> the C-13 basinsduring periods of low natural flow; 3) to convey excess water in <strong>Water</strong> Conservation Area (WCA)2A to tidewater; 4) to intercept <strong>and</strong> control seepage from WCA 2A; <strong>and</strong> 5) to maintain agroundwater surface elevation west of S-37A adequate to prevent saltwater intrusion into localgroundwater.The C-14 basin is divided into two regions with regard to design flood protection: an easternbasin <strong>and</strong> a western basin. The eastern basin was designed for a 1 – 30 year flood protection <strong>and</strong>the western basin was designed for a 1 – 10 year flood protection.51
Table 4-9: C-14 (Cypress Creek Canal) Basin Structures Design CriteriaStructureS-37AStage DivideS-37bStage DivideG-65Divide C-14 <strong>and</strong>Pompano CanalS-38CStage Divide, C-13<strong>and</strong> C-14; watersupply C-13TypeDesign HW (ftNGVD)Design TW (ftNGVD)Optimum State (ftNGVD)Design Q (cfs)Peak Stage (ftNGVD) <strong>and</strong> Q (cfs)HW = 5.19TW = 4.28Q = 3800Spillway, 2 gates25ft x 12.8ftCrest lgth = 50ftCrest elev = -7.7ft NGVD 3.0 2 HW = 3.5 3890 Q = 3060 (measured)Spillway, 2 gates25ft x 6.6ftCrest lgth = 50ftHW = 8.99TW = 6.14Q = 3108Crest elev = 0ft NGVD 7.2 4.7 HW = 7.5 3390 (measured)Gated Culvert1.54in x 1500ft RCPInvert elev = 0ft NGVDCulvert with riser<strong>and</strong> stop logs2.72in x 35ft CMPInvert elev = 1.55ft NGVDTW = 4.5(at G-57)50-55(water supply)CulvertS-38AStage Divide, L-36with riser <strong>and</strong> stop logs2.60in x 70ft CMPstage <strong>and</strong> C-14 stage Invert elev = 2.0ft NGVD 9.0 8.0 HW = 7.65 190S-38<strong>Water</strong> supply, C-13<strong>and</strong> C-14S-38BDivide C-14 <strong>and</strong>Hillsboro basinsGated Culvert2.72in x 52ft CMPInvert elev = 2.0 to 3.0ft NGVD 9.8 7.0Gated Culvert1.65in x 72ft CMPInvert elev = 0ft NGVD 9.0 7.7Source: An Atlas of Eastern Broward County Surface <strong>Water</strong> Management Basins, November 1987. Pg. 18HW = 15.47TW = 8.2 maxTW = 10.47(not to exceed 8.2) 500 Q = 58652
Pompano Canal BasinThere are two Project structures regulating flow in the Pompano Canal basin: G-57 <strong>and</strong> G-65.Design criteria for the structures are given in Table 4-10. The Project canal <strong>and</strong> control structuresin the Pompano Canal basin have three functions: 1) to provide flood protection <strong>and</strong> drainage forthe Pompano Canal Basin; 2) to supply water to the basin during periods of low natural flow; <strong>and</strong>3) to maintain a groundwater table elevation west of G-57 adequate to prevent intrusion ofsaltwater into local groundwater.The present Pompano Canal is the remnant of the longer, original Pompano Canal. It has a 1 – 25year flood protection.53
Table 4-10: Pompano Canal Basin Structures Design CriteriaStructureG-57Stage DivideTypeSteel sheet-pile dam with 6-bay,flashboard controlled weirNet lgth = 31.5ftCrest elev = -2.5ft NGVDDesign HW(ft NGVD)Design TW(ft NGVD)Optimum State(ft NGVD)Design Q (cfs)HW = 4.5 (dry season)HW = 2.5 (floodconditions) 375Peak Stage (ftNGVD) <strong>and</strong> Q (cfs)HW = ~5.5G-65Divide C-14 <strong>and</strong>Pompano CanalGated Culvert1.54in x 1500ft RCPInvert elev = 0.0ft NGVDSource: An Atlas of Eastern Broward County Surface <strong>Water</strong> Management Basins, November 1987. Pg. 23TW = 4.5(at G-57)50-55(water supply)54
C-13 (Middle River Canal) BasinThere are three Project canals in the C-13 basin: C-13, the section of the L-36 borrow canalbetween C-14 <strong>and</strong> L-35A, <strong>and</strong> the section of C-42 between S-125 <strong>and</strong> L-35A. There are fourProject structures regulating flow in the C-13 basin: S-36, S-38C, S-125, <strong>and</strong> S-124. Design criteriafor these structures are given in Table 4-11.The Project canals <strong>and</strong> control structures in the C-13 basin have five functions: 1) to provide floodprotection <strong>and</strong> drainage for the basin; 2) to supply water to the C-13 basin during periods of lownatural flow; 3) to intercept <strong>and</strong> control seepage from <strong>Water</strong> Conservation Area (WCA) 2B; 4) tosupply water to the City of Plantation in the North New River Canal (NNRC) basin; <strong>and</strong> 5) tomaintain a groundwater table elevation west of S-36 adequate to prevent intrusion of saltwaterinto local groundwater.C-13 was design to provide 1 – 25 year flood protection. The original Army Corps of Engineersdesign called for a discharge of 1090 cfs at S-36; however, by 1972, the basin had been enlarged bysome 43 percent. In a study conducted by the District in 1972, it was reported that the dischargeat S-36 for a 1 – 25 year storm for the enlarged basin would be 1560 cfs. The new canal sectionsare large enough to pass 100 percent of the St<strong>and</strong>ard Project Flood (SPF) in most cases, <strong>and</strong> 200percent of the SPF for the reach of C-13 just west of the <strong>Florida</strong> Turnpike.55
Table 4-11: C-13 (Middle River Canal) Basin Structures Design CriteriaStructureS-36C-13S-125Divide C-13 & N.New River Canal(<strong>Water</strong> supply toPlantation)TypeDesign HW (ftNGVD)Design TW (ftNGVD)Optimum State (ftNGVD)Design Q (cfs)Spillway, 1 gate25ft x 14ftCrest lgth = 25ftCrest elev = -7.0ft NGVD 5.6 5.0 HW = 4.5 1560Gated Culvert1.48in x 40ft CMPInvert elev = 2.0ft NGVD 6.5 6.0HW = 6.0TW = 3.5 - 4.5(at Sewell Lock)40(Regulatoryreleases)Peak Stage (ftNGVD) <strong>and</strong> Q (cfs)HW = 7.38TW = 5.71Q = 2390HW = 8+S-38CStage divide, C-13<strong>and</strong> C-14; watersupply C-13S-38<strong>Water</strong> supply C-13<strong>and</strong> C-14S-124Normal flow-closedFlood conditionsopenCulvertwith risers <strong>and</strong> stop logs2.72in x 35ft CMPInvert elev = 1.55ft NGVDGated Culvert2.72in x 52ft CMPInvert elev = 2ft to 3ft NGVD 9.8 7.0TW = 8.2Maximum 500HW = 15.47TW = 10.47Q = 586*HW = 7.8+TW = 6.86Gated Culvert5.72in x 48ft CMPInvert elev = -1.0ft NGVD 7.0 6.6 HW = 5.0 - 5.5 490 above 8.0)Source: An Atlas of Eastern Broward County Surface <strong>Water</strong> Management Basins, November 1987. Pg. 33(*HW may have been56
C-12 (Plantation Canal) BasinC-12 is the only Project canal in the C-12 basin. S-33 is the only Project control structureregulating flow in the C-12 basin. Design criteria for S-33 are given in Table 4-12.The Project canal <strong>and</strong> control structure in the C-12 basin have two functions: 1) to provide floodprotection <strong>and</strong> drainage for the basin; <strong>and</strong> 2) to maintain a groundwater table elevation west of S-33 adequate to prevent intrusion of saltwater into local groundwater.C-12 was designed to provide 1 – 25 year flood protection. The design call for S-33 to pass 620 cfswith a headwater stage of 5.11ft NGVD <strong>and</strong> a tailwater stage 4.61ft NGVD.57
Table 4-12: C-12 (Plantation Canal) Basin Structure Design CriteriaStructureTypeDesign HW (ftNGVD)Design TW (ftNGVD)Optimum State (ftNGVD)Design Q (cfs)Spillway, 1 gate20ft x 9ftS-33Stage divideCrest lgth = 20ftCrest elev = -2.0ft NGVD 5.9 4.9 HW = 3.5 920Source: An Atlas of Eastern Broward County Surface <strong>Water</strong> Management Basins, November 1987. Pg. 38Peak Stage (ftNGVD) <strong>and</strong> Q (cfs)HW = 6.13TW = 5.89Q = 61458
North New River Canal (NNRC)BasinThere are three Project canals in the NNRC basin: the NNRC, the L-35A borrow canal, <strong>and</strong> the C-42. There are eight Project control structures regulating flow in the NNRC basin: S-34, S-124, S-125, S-141, S142, S-143, Sewell Lock (G-54), <strong>and</strong> G-123. Design Criteria for the Project Structuresare given in Table 4-13.The Project canals <strong>and</strong> canal structures have four functions: 1) to provide flood protection <strong>and</strong>drainage for the NNRC basin; 2) to supply water to the basin during periods of low natural flow;3) to convey excess water from <strong>Water</strong> Conservation Areas (WCAs) 2A, 2B, <strong>and</strong> 3A to tidewater;<strong>and</strong> 4) to intercept <strong>and</strong> control seepage from WCA 2B.The North New River Canal was excavated <strong>and</strong> extended to drain the Everglades, <strong>and</strong> to serve asa transportation route between Lake Okeechobee <strong>and</strong> the east coast. After the District tookl overmanagement of the canal from the Everglades Drainage District, a study was performed todetermine the flood protection provided by the canal. The results of the study indicated that theexisting hydraulic cross-section of the NNRC <strong>and</strong> the capacity of Sewell Lock were adequate for 1– 25 year protection, <strong>and</strong> that a 1 – 50 year storm would cause some flooding in the westernreaches. This was deemed to be adequate protection <strong>and</strong> the canal has not been enlarged underDistrict management.59
Table 4-13: North New River Canal Basin Structures Design CriteriaStructure Type DesignHW (ftNGVD)Sewell Lock (G-54)Stage DivideS-124Normal Flow – closedFlood conditions - openS-34<strong>Water</strong> supply to NNRCanalS-125Divide C-13 & NNRCanal (regulatory release toNNRC from C-13)G-123Pumps from NNRC toWCA-3AS-141Stage DivideS-142Stage Divide<strong>Water</strong> SupplyS-143Stage Divide<strong>Water</strong> SupplyFlash board spillway8-baysNet length ~ 45ftWeir elev = -3.6ft NGVDGated Culvert2.72in x 48ft CMPInvert elev = -3.0 - -4.0 ft NGVDGated Culvert2.72in x 133ft CMPInvert elev = -3.0 - -4.0ft NGVDGated Culvert1.48in x 40ft CMPInvert elev = 2.0ft NGVDPumping Station4 units: 100 cfs eachSheet-pile overflow weir in L-38EFlashboard controlCrest lgth = 30.0 ftCrest elev = 2.0 ft NGVDGated Culvert2.72in x 42ft CMPInvert elev = 2.0ft NGVDGated Culvert2.72in x 70ft CMPInvert elev = 2.0ft NGVDSource: An Atlas of Eastern Broward County Surface <strong>Water</strong> Management Basins, November 1987. Pg. 47Design TW(ft NGVDOptimum Stage(ft NGVD)Design Q(cfs)Peak Stage (ftNGVD) <strong>and</strong> Q(cfs)3.5 3.0 HW = 3.5-4.5 1300 HW = 5.97TW = 4.66Q = 20407.0 6.6 HW = 5.0 – 5.5 490 *HW = 7.8+TW = 6.89*HW may have beenabove 8.016.9 6.0 HW = ~ 11 – 11.5TW = 3.5 – 4.5TW = 6.0 max6.5 6.0 HW = 6.0TW = 3.5 – 4.5 (atSewell Lock)2.0 12.0 HW = 3.5HW = 11.010.0 8.0 Regulationschedule inWCA 2B11.0 9.0 Regulationschedule inWCA 3A13.0 10.0 Regulationschedule inWCA 2A350 HW = 13.08TW = 7.05Q = 72840 HW = 8.0+(RegulatoryRelease)40043550050060
C-11 (<strong>South</strong> New River Canal) BasinThere are four Project canals in the C-11 basin: C-11, C-11S, the section of the L-33 borrow canalbetween C-11 <strong>and</strong> Hollywood Boulevard, <strong>and</strong> the L-37 borrow canal. There are eight Projectcontrol structures regulating flow in the C-11 basin: S-9, S-9XN, S-9XS, S-13, S-13A, G-86N, G-86N, <strong>and</strong> G-87. Design Criteria for the Project Structures are given in Table 4-14.The Project canals <strong>and</strong> control structures in the C-11 basin have four functions: 1) to provideflood protection <strong>and</strong> drainage for the basin; 2) to supply water to the basin during periods of lownatural flow; 3) to intercept <strong>and</strong> control seepage from <strong>Water</strong> Conservation Area (WCA) 3A; <strong>and</strong>4) to maintain a groundwater table elevation west of S-13 adequate to prevent saltwater intrusiononto local groundwater.The C-11 system was designed to provide flood protection of up to three-quarters of an inch ofrunoff per day from the western basin. The S-9 pump station was designed with a capacity of2870 cfs. 1650 cfs was for flood protection (adequate to h<strong>and</strong>le the design runoff) <strong>and</strong> 1220 cfswas for seepage removal (seepage to the borrow canals of L-33 <strong>and</strong> L-37 from <strong>Water</strong>Conservation Area 3A).The pumping station at S-13 was designed to provide the eastern basin with flood protection ofup to three-quarters of an inch of runoff per day. Depending on the headwater <strong>and</strong> tailwaterstages at the S-13 spillway, gravity flow from the eastern C-11 basin to the east may provideadditional flood protection of up to three-quarters of an inch of runoff per day.61
Table 4-14: C-11 (<strong>South</strong> New River Canal) Basin Structures Design CriteriaStructure Type DesignHW (ftNGVD)S-13Stage DivideS-13ADivide Structure duringfloodingPump <strong>and</strong> Spillway3 units – 180 cfs each1.16in x 11.3 ft gateWeir lgth = 16.0 ftWeir crest lgth = 8.0ft NGVDGated Culvert2.72in x 66ft CMP2.54in x 60ft CMPS-9 Pump, 3 units960 cfs eachS-9XSCulverts with risers <strong>and</strong> stop logsStage Divide2.72in x 42ft CMPInvert elev = -1.0ft NGVDS-9XNStage DivideG-86SStage DivideG-86NStage DivideG-87(presently used as a drainagedivide between C-11 <strong>and</strong> C-9basins)Culvert with risers <strong>and</strong> stop logs2.72in x 84ft CMPInvert elev = -4.8ft NGVDCulvert with risers <strong>and</strong> stop logs1.60in x 135ft CMPInvert elev = -1.14ft NGVDCulvert with risers <strong>and</strong> stop logs1.60in x 135ft CMPInvert elev = -1.0ft NGVDGated Culvert1.84in x 75ft CMPInvert elev = -5.0ft NGVD1.2(gravity)2.2 – 2.5(pump)Source: An Atlas of Eastern Broward County Surface <strong>Water</strong> Management Basins, November 1987. Pg. 55Design TW(ft NGVD1.0 (gravity)6.2 – 6.5(pump)Optimum Stage (ftNGVD)HW = 1.6 (gravity)HW = 2.2 (gravity)Design Q(cfs)540(gravity)540(pumped)Peak Stage (ftNGVD) <strong>and</strong> Q(cfs)HW = 4.02TW = 4.85Q = 10502.5 2.0 3.0 to west 120 HW (west) = 6.27TW (east) = 4.794.0 14.4 HW = 3.0 – 3.5 2880 Intake = 6.1Q = 2060HW = 6.8HW = 6.0HW = 5.5HW = 5.5DivideStructure62
C-10 (Hollywood Canal) BasinThere are two Project canals in the C-10 basin, the C-10 <strong>and</strong> the C-10 Spur Canal. There are noProject control structures in the C-10 basin.The Project canals in the C-10 basin provide flood protection <strong>and</strong> drainage for the C-10 basin.There is no regulation of water surface elevations <strong>and</strong> discharge from the basin is not controlled.<strong>Water</strong> supply to the basin is from local rainfall.C-10 was designed to pass the St<strong>and</strong>ard Project Flood (SPF). The SPF design stage at theconfluence of C-10 with the Dania Cut-off Canal is 4.7ft NGVD. The maximum SPF design stagein C-10 is 5.6ft NGVD near the Johnson Street Bridge.C-10 was constructed without a control structure to maintain the water surface elevation in thecanal high enough to prevent saltwater intrusion into local groundwater. Since there is no watersupply to C-10 from outside the basin, it would be impossible to maintain the required watersurface elevation in the canal during periods of low flow even if the structure was in place.C-9 (Snake Creek Canal) BasinThere are two Project canals in the C-9 basin, the C-9 <strong>and</strong> the L-33 borrow canal. There are alsothree Project control structures in the basin, the S-29, S-30, <strong>and</strong> S-32. Design Criteria for theProject Structures are given in Table 4-15.The Project canals <strong>and</strong> control structures in the C-9 basin have four functions: 1) to provide floodprotection <strong>and</strong> drainage for the basin; 2) to supply water to the C-9 basin for irrigation <strong>and</strong>municipal water supply during periods of low natural flow; 3) to intercept <strong>and</strong> control seepagefrom <strong>Water</strong> Conservation Area (WCA) 3B; <strong>and</strong> 4) to maintain a groundwater table elevation westof S-29 adequate to prevent saltwater intrusion into local groundwater.C-9 in the eastern sub-basin was design to pass 100 percent of the St<strong>and</strong>ard Project Flood. Thisprovides for essentially unlimited inflows to C-9 from the eastern sub-basin. The western sub-basinis very prone to flooding because of low ground surface elevations relative to the eastern sub-basin.Major storms can reverse flow in C-9 from east to west because of rapid runoff into the easternreaches of C-9. Allowable pumped inflow to C-9 in the western sub-basin is limited to 0.75 inchesof runoff per day. Unlimited gravity inflow to C-9 is allowed in the western basin if developmentlimitations are met.63
Table 4-15: C-9 (Snake Creek Canal) Basin Structures Design CriteriaStructureS-29Stage divideTypeDesign HW (ftNGVD)Design TW (ftNGVD)Optimum State (ftNGVD)Design Q (cfs)Spillway, 4 gates22ft x 15ftCrest lgth = 88ftCrest elev = -11.0ft NGVD 3.0 2.5 HW = ~2.0 4780Peak Stage (ftNGVD) <strong>and</strong> Q (cfs)HW = 3.88Q = 4100S-30Controls waterstored between L-30<strong>and</strong> SR-27Gated Culvert3.84in x 172ft CMPInvert elev = -3.0ft NGVD HW = 6.0 560Gated CulvertS-322.72in x 40ft CMP<strong>Water</strong> supply to C-9 Invert elev = -2.0ft NGVD 2.0 ~1.60Source: An Atlas of Eastern Broward County Surface <strong>Water</strong> Management Basins, November 1987. Pg. 65TW = 2.0HW = 6.0 2HW = 6.5964
2. Miami-Dade CountyThe information on the primary canals <strong>and</strong> basins in Broward County is from the <strong>South</strong> <strong>Florida</strong><strong>Water</strong> Management District’s An Atlas of Eastern Dade County Surface <strong>Water</strong> Management Basins(October 1987).There are seventeen basins in Miami-Dade County. They are: the C-1, C-2, C-3, C-4, C-5, C-6, C-7,C-8, C-9, C-100, C-102, C-103, C-111, North Canal, <strong>Florida</strong> City Canal, Model L<strong>and</strong>, <strong>and</strong> HomesteadAir Force Base basins. A county map showing the boundaries of each basin in on Map 1-24.Area A <strong>and</strong> Area BArea A is an area of relatively good drainage. It includes all l<strong>and</strong> areas excluding Area B,Everglades National Park, <strong>and</strong> the <strong>Water</strong> Conservation Areas. Restrictions on l<strong>and</strong> use <strong>and</strong>development are less severe in Area A. Area B is bounded on the north by the Miami-Dade-Broward County Line, on the south by Kendall Drive, on the west by L-31N <strong>and</strong> L-30, <strong>and</strong> on theeast by the Palmetto Expressway. L<strong>and</strong> elevations in this area are low relative to the coastal ridgein eastern Miami-Dade County. Consequently, drainage from this area is poor <strong>and</strong> the area isprone to flooding. Severe limitations are placed on l<strong>and</strong> use <strong>and</strong> development in Area B. Severalof the basins in Miami-Dade County include portions of Area B.C-9 (Snake Creek Canal) BasinThere are two Project canals in the C-9 basin: C-9 <strong>and</strong> the L-33 borrow canal. These canals havethree functions: 1) to provide flood protection <strong>and</strong> drainage for the C-9 basin; 2) to supply waterto the basin for irrigation <strong>and</strong> municipal water supply; <strong>and</strong> 3) to maintain a groundwater tableelevation near the lower reach of C-9 adequate to prevent saltwater intrusion into localgroundwater.There are also three Project structures in the C-9 basin. They are: S-29, S-30, <strong>and</strong> S-32. The designcriterion for the structures is given in Table 4-16.When drainage to C-9 is more than adequate to maintain the optimum stage in the canal, excesswater from rainfall <strong>and</strong> seepage can be stored in the area between L-33 <strong>and</strong> U.S Highway 27.This water can be released to C-9 through S-30 as needed for water supply.C-9 in the eastern sub-basin was designed to pass 100 percent of the St<strong>and</strong>ard Project Flood. Thewestern sub-basin, however, is very prone to flooding because of low ground surface elevationsrelative to the eastern sub-basin. Major storms can reverse flow in C-9 from east to west becauseof rapid runoff into the eastern reaches of C-9. Allowable pumped inflow in C-9 in the westernsub-basin is limited to three-quarters of an inch of runoff per day. Unlimited gravity inflow to C-9 is allowable in the western basin if development limitations are met.The C-9 West sub-basin is in Area B. As stated above, Area B is poorly drained, <strong>and</strong> is subject tosevere limitations on development.65
Table 4-16: C-9 (Snake Creek Canal) Basin Structures Design CriteriaStructureS-29Stage divideTypeDesign HW (ftNGVD)Design TW (ftNGVD)Optimum State (ftNGVD)Design Q (cfs)Spillway, 4 gates22ft x 15 ft;HW = 3.88Crest length = 88ft;Crest Elev. = 11ft MGVD 3 2.5 ~2.0 4780 Q = 4100Peak Stage (ft NGVD)<strong>and</strong> Q (cfs)S-31Controls outflowfrom CA-3B to C-6S-30Controls <strong>Water</strong> storedbetween L-30 <strong>and</strong> USHwy 27Gated Culvert3.84in x 172ft CMPInvert Elev = -3.0ft NGVDGated Culvert3.84in x 288ft CMPInvert Elev = -5.0ft NGVDCulvertS-321.72" x 40ft CMP<strong>Water</strong> supply to C-9 Invert Elev = -2.0ft NGVDSource: An Atlas of Eastern Dade County Surface <strong>Water</strong> Management Basins, November 1987. Pg. 116.04.0(not fixed; used for (not fixed; used forregulatory or water regulatory or watersupply discharges supply dischargesfrom CA-3B to C-6) from CA-3B to C-6) 7006.8(L-30 borrow canal) 560TW = 6.59Q = 10906.8(L-30 borrow canal) HW = 6.5966
Table 4-17: C-8 (Biscayne Canal) Basin Structures Design CriteriaStructureTypeDesign HW (ftNGVD)S-28Stage divideSource: An Atlas of Eastern Dade County Surface <strong>Water</strong> Management Basins, November 1987. Pg. 15Design TW (ftNGVD)Optimum State(ft NGVD)Design Q (cfs)Peak Stage (ft NGVD)<strong>and</strong> Q (cfs)HW = 4.24Q = 1640 downstreamSpillway, 2 gates27ft x 17.5ft;Crest length = 54ft;Crest Elev. = 13.5ft MGVD 2.3 1.8 1.8 3220 Q = 835 upstream68
C-7 (Little River Canal) BasinC-7 is the only project canal in the C-7 basin. The canal has two functions: 1) to provide floodprotection <strong>and</strong> drainage for the C-7 basin <strong>and</strong> 2) to maintain a groundwater table elevationadequate to prevent saltwater intrusion into local groundwater. During periods of low naturalflow, water is supplied in the basin from C-6. There are also two Project structures in the C-7basin, S-27 <strong>and</strong> G-72. Design criteria for these structures are given in Table 4-18.If the stage in C-6 is high enough, up to 50 cfs will flow from C-6 to C-7 by way of the borrowcanal along the Palmetto Expressway. The portion of the basin west of the Palmetto is in Area B,<strong>and</strong> is subject to severe limitations on development.C-7 was designed to pass the runoff from a 1 – 100 year storm. However, much of this basin(west of Red Road) was in agricultural production at the time the canal was designed <strong>and</strong>constructed. Subsequent development of the area to residential <strong>and</strong> commercial properties mayhave significantly increased the runoff <strong>and</strong> decreased the flood protection provided by the canal.69
Table 4-18: C-7 (Little River Canal) Basin Structures Design CriteriaStructureS-27Stage divideTypeDesign HW(ft NGVD)Design TW(ft NGVD)Optimum State(ft NGVD)Design Q (cfs)Spillway, 2 gates27ft x 15ft;Crest length = 54ft;Crest Elev. = 11.0ft MGVD 3.2 2.7 ~1.7 2800 Q = 892Culvert4.72in x 75ft CMP FlashboardsG-72VariableDivide C-7 <strong>and</strong> C-6 Invert elevs = -2.44 to -1.97ftbasinsNGVDSource: An Atlas of Eastern Dade County Surface <strong>Water</strong> Management Basins, November 1987. Pg. 20(Dividestructure -water supply)Peak Stage (ftNGVD) <strong>and</strong> Q (cfs)HW = 4.49Q = 1100HW = 3.8170
C-6 (Miami Canal) BasinThe C-6 is the only project canal in the C-6 basin. The canal has four functions: 1) to provideflood protection <strong>and</strong> drainage for the C-6 basin; 2) to supply water to the C-6, C-7, <strong>and</strong> C-9 basinsfor irrigation <strong>and</strong> municipal water supply; 3) to maintain a groundwater table elevation near thelower reach of the C-6 adequate to prevent intrusion of saltwater into local groundwater <strong>and</strong> 4) toaccept flows from the C-5 <strong>and</strong> C-4 canals <strong>and</strong> to convey these discharges to Biscayne Bay. Thereare five structures controlling flow in the C-6 basin: S-26, S-31, G-72, S-32, <strong>and</strong> S-32A. The designcriteria for these structures are given in Table 4-19.The C-6 begins at S-31 at the intersection of L-30 <strong>and</strong> L-33 just west of State Road 27. Flow in thecanal is to the southeast with discharge via S-26 to Biscayne Bay just north of U.U. Highway 41.If the stage in C-6 is high enough, up to 50 cfs of water flows from C-6 to C-7 by way of theborrow canal along the Palmetto Expressway.C-6 was designed to pass 100 percent of the St<strong>and</strong>ard Project Flood from Area A (downstream ofthe <strong>Florida</strong> East Coast Railroad). The design flow for the canal is 3470 cfs. Of this flow, 1240 cfs iffor runoff from the 11.6 square miles of Area A <strong>and</strong> 2230 cfs is for runoff from the 40 square milesof Area B.71
Table 4-19: C6 (Miami Canal) Basin Structures Design CriteriaStructureS-26Stage divideTypeDesign HW(ft NGVD)Design TW(ft NGVD)Optimum State(ft NGVD)Design Q (cfs)Spillway, 2 gates26ft x 14ft;Crest length = 52ft;Crest Elev. = -11.1ft NGVD 4.4 3.9 ~2.5 3470Peak Stage (ft NGVD)<strong>and</strong> Q (cfs)HW = 5.14Qds = 1900Qups = 515S-25BStage divideG-72Divide C-7 <strong>and</strong> C-6basinsS-31 Controls outflowsfrom CA-3B to C-6S-32<strong>Water</strong> supply to C-9S-337<strong>Water</strong> supply, <strong>South</strong>Dade ConveyanceSystemSpillway, 2 gates22ft x 11.9ft;Crest length = 44ft;Crest Elev. = -7.9ft NGVD 4.4 4.1 2.8 2000Culvert4.72in x 75ft CMPFlashboards Variable Invertelevs = -2.44 to -1.97ftNGVDGated Culvert 3.84in x 75ftCMPInvert elev = 3.0ft NGVD6.0(not fixed. Usedfor regulatory ofwater supplydischarges fromCA-3B to C-6.)(Divide structure- water supply)4.0(not fixed. Used forregulatory of watersupply dischargesfrom CA-3B to C-6.) 700HW = 3.19 ftQ = 1668TW = 6.59Q = 1090Culvert2.72in x 40ft CMPInvert elev = -2.0ft NGVD HW = 6.59Culvert6.84in x 164ft CMPInvert elev = -3.0 to -4.0ftNGVD 5.5 5.2 605Source: An Atlas of Eastern Dade County Surface <strong>Water</strong> Management Basins, November 1987. Pg. 2572
C-4 (Tamiami Canal) BasinThere are two project canals in the C-4 basin: the C-4 <strong>and</strong> the L-30 borrow canal. The canals havethree functions: 1) to provide flood protection <strong>and</strong> drainage for the C-4 basin; 2) to supply waterto the C-2, C-3, C-4, <strong>and</strong> C-5 basins; <strong>and</strong> 3) to maintain a groundwater table elevation near thelower reach of C-4 adequate to prevent intrusion of saltwater into local groundwater. There arealso four Project structures controlling flow in the C-4 basin: S-25B, S-25A, S-336, <strong>and</strong> G-199. Thedesign criteria for these structures are given in Table 4-20.C-4 was designed to pass 100 percent of the St<strong>and</strong>ard Project Flood from the area east of S.W. 87 thAve. (Area A). That portion of the C-4 basin in Area B (west of S.W. 87 th Ave.) is poorly drained.A stage of 5.5ft NGVD will cause flooding in Sweetwater east of S.W. 117 th Avenue.Several changes have been made in the basin (to C-4 <strong>and</strong> to its control structures) that haveprobably changed the hydraulic profiles in C-4 from that reported in the Army Corps ofEngineers General Design Memor<strong>and</strong>um. The channel between Flagler Street <strong>and</strong> Blue Lagoonhas been excavated. The sheet pile weir at the <strong>Florida</strong> East Coast Railway crossing has beenremoved, <strong>and</strong> a control structure (S-25B) has been built at LeJeune Road. The hydraulic profilesfor C-4 need to be restructured.73
Table 4-20: C-4 (Tamiami Canal) Basin Structures Design CriteriaStructure Type DesignHW (ftNGVD)S-25Stage DivideS-25BStage DivideS-25ADivide structure betweenC-4 <strong>and</strong> C-5S-32<strong>Water</strong> supply to C-9S-336<strong>Water</strong> supply, <strong>South</strong> DadeConveyance SystemG-119<strong>Water</strong> Supply to C-4S-334<strong>Water</strong> Supply, <strong>South</strong> DadeConveyance SystemS-335<strong>Water</strong> Supply, <strong>South</strong> DadeConveyance SystemCulvert1.96in x 60ft CMPInvert elev = -4.0ft NGVD withautomated slide gateSpillway, 2 gates22ft x 11.9ftCrest lgth = 44ftCrest elev = -7.9ft NGVDGated Culvert1.60in x 73ft CMP(Upstream 13ft is 54in)Invert elev = -1.7ft NGVDCulvert2.72in x 40ft CMPInvert elev = -2.0ft NGVDGated Culvert3.54in x 85ft CMPInvert elev = -1.8ft NGVDGated Culvert2.72in x 64ft CMPInvert elev = -3.5ft NGVDSpillway, 1 gate29ft x 14.6ftCrest lgth = 29ftCrest elev = -6.9ft NGVDSpillway, 1 gate20ft x 11.2ftCrest lgth = 20ftCrest elev = -4.2ft NGVDSource: An Atlas of Eastern Dade County Surface <strong>Water</strong> Management Basins, November 1987. Pg. 31Design TW(ft NGVDOptimum Stage (ftNGVD)Design Q(cfs)Peak Stage (ftNGVD) <strong>and</strong>Q (cfs)2.5 1.60 2.0 260 HW = 3.60Q = 2584.4 4.1 2.8 2000 HW = 3.19 ftQ = 16684.7 4.2 (TW stage rise to–6.5ft during wetseason)1455.0 4.7 12305.0 4.8 525HW = 6.5974
C-5 (Comfort Canal) BasinC-5 is the only Project canal in the C-5 basin. It provides drainage <strong>and</strong> flood protection for thebasin. C-5 begins as a bifurcation of C-4 at Blue Lagoon northwest of Coral Gables. Flow in thecanal is to the east to the canal’s confluence with C-6, three-quarters of a mile downstream of S-26. There are two Project control structures in the C-5 basin: S-25A <strong>and</strong> S-25. The design criteriafor these structures are given in Table 4-21.Design flow for C-5 is 260 cfs with a design stage of 2.5 ft NGVD. This basin is very small with ahigh percentage of impervious surface, the result of urban development. As a consequence, floodstages peak rapidly. Telemetry control of the gate at S-25 makes it easier to control the height offlood stages.C-5 drains an old section of Miami with natural ground surface elevation as low as 2.5ft NGVD.Some homes in the area are subject to flooding during severe storms.75
Table 4-21: C-5 (Comfort Canal) Basin Structures Design CriteriaStructureS-25Stage divideTypeDesign HW(ft NGVD)Design TW(ft NGVD)Optimum State(ft NGVD)Design Q (cfs)Culvert1.96in x 60ft CMPInvert elev = -4.0ft NGVDwith automated slide gate 2.5 ~1.60 2.0 260CulvertS-25A1.60in x 73ft CMPDivide structure (Upstream 13ft is 54in)between C-4 <strong>and</strong> C-5 Invert elev = -1.7ft NGVDSource: An Atlas of Eastern Dade County Surface <strong>Water</strong> Management Basins, November 1987. Pg. 35Peak Stage (ftNGVD) <strong>and</strong> Q (cfs)HW = 3.60Q = 25876
C-3 (Coral Gables Canal) BasinC-3 is the only Project canal in the C-3 basin. It provides drainage <strong>and</strong> flood protection to thebasin, <strong>and</strong> it maintains a groundwater table elevation adequate to prevent intrusion of saltwaterinto local groundwater. There is one Project Structure located in the C-3 basin, G-97. The designcriterion for this structure is given in Table 4-22.C-3 is designed to provide 1 - 25 year flood protection. Design discharge at G-97 is 640cfs, whichconsists of 540 cfs from the Coral Gables Canal basin <strong>and</strong> 100 cfs from C-4. Urban developmentof the area has probably increased runoff to C-3 <strong>and</strong> decreased the flood protection although thishas not yet been documented. There are some older urban areas with low-lying streets <strong>and</strong> lowfloor elevations, which flood during heavy rainfalls.77
Table 4-22: C-3 (Coral Gables Canal) Basin Structures Design CriteriaStructureTypeDesign HW(ft NGVD)Design TW(ft NGVD)Sheet Pile Weir8 Removable pilesG-97Coral Gables CanalCrest lgth = 47ftCrest elev = 3.0ft NGVD 4.5 3.0Source: An Atlas of Eastern Dade County Surface <strong>Water</strong> Management Basins, November 1987. Pg. 39Optimum State(ft NGVD)2.5 to 3.0(Controlled by S-25Bin C-4)Peak Stage (ft NGVD)Design Q (cfs) <strong>and</strong> Q (cfs)HW = 6.58640 Qus = 613(540 from C.G.Basin, 100 from HW = 5.73C-4Basin) Qds = 93378
C-2 (Snapper Creek Canal) BasinThe western portion of the C-2 basin is in Area B, which has limited drainage capabilities. C-2 isthe only Project canal in the C-2 basin. It has three functions: 1) to provide drainage <strong>and</strong> floodprotection for the basin; 2) to supply water to the C-2 <strong>and</strong> C-100 basins for irrigation; <strong>and</strong> 3) tomaintain a groundwater table elevation near the lower reach of C-2 that is adequate to preventsaltwater intrusion into local groundwater. There are also two Project structures in the C-2 basin:S-22 <strong>and</strong> S-121. The design criteria for these structures are given in Table 4-23.C-2 was an existing Miami-Dade Canal as the time of the Project. It was enlarged by the Projectto pass 100 percent of the St<strong>and</strong>ard Project Flood for the Area A portion of the C-2 basin.A new hydrologic analysis of the C-2 basin is needed. There are three reasons for this: 1) at thetime of its construction, C-2 upstream of S-22 to Sunset Drive was over-excavated 150 to 300percent; 2) the canal has been enlarged from Sunset Drive to U.S. Highway 41 in order to providefill for the Homestead Extension of the <strong>Florida</strong> Turnpike; <strong>and</strong> 3) the basin has experiencedconsiderable urban development with an increase in the impervious surface in the basin. Theenlargement of the canal has reduced the stage that will occur in the canal for a given discharge.79
Table 4-23: C-2 (Snapper Creek Canal) Basin Structures Design CriteriaStructureS-22Stage divideTypeDesign HW(ft NGVD)Design TW(ft NGVD)Optimum State(ft NGVD)Design Q (cfs)Spillway, 2 gates17ft x 15ftCrest lgth = 34ftCrest elev = 11.0ft NGVD 3.5 2.7 2.9 1915 HW = 6.02CulvertS-121 Divide structure 8ft x 8ft box x 128ftC-2 <strong>and</strong> C-100C. <strong>Water</strong> 8ft x 8ft gate2.92.8supply C-2 to C-100C Invert elev = -4.5ft NGVD (water supply) (water supply)Source: An Atlas of Eastern Dade County Surface <strong>Water</strong> Management Basins, November 1987. Pg. 44100(water supply)Peak Stage (ft NGVD)<strong>and</strong> Q (cfs)HW = 3.60Q = 2110 dsQ = 1220 ups80
C-100 BasinThere are four Project canals in the C-100 basin: the C-100, C-100A, C-100B, <strong>and</strong> C-100C. Thesecanals have three functions: 1) to provide drainage <strong>and</strong> flood protection for the C-100 basin; 2) tosupply water to the basin for irrigation; <strong>and</strong> 3) to maintain a groundwater table elevation near thelower reach of C-100 adequate to prevent saltwater intrusion to local groundwater. There arealso six Project structures in the C-100 Basin: S-118, S-119, S-120, S-121, S-122, <strong>and</strong> S-123. Thedesign criteria for these structures are given in Table 4-24.C-100 was designed for 1 – 10 year flood protection. The design discharge is 2300 cfs.81
Table 4-24: C-100 Basin Structures Design CriteriaStructureS-123Stage divideS-118Stage divideS-119Stage divideS-120Stage divideTypeDesign HW(ft NGVD)Design TW(ft NGVD)Spillway, 2 gates25ft x 12.7ftCrest lgth = 50ftCrest elev = -7.3ft NGVD 2.0 1.5Optimum State(ft NGVD)Design Q (cfs)2.0 Wet season3.5 dry season 2300Spillway, 1 gate20ft x 10ftCrest lgth = 20ftCrest elev = -5.0ft NGVD 3.6 3.1 3.7 860Spillway, 1 gate12ft x 7.3ftCrest lgth = 12ftCrest elev = -2.4ft NGVD 4.4 3.9 4.7 400Culvert9ft x 9ft box x 104ft6ft x 6ft gateInvert elev = -3.0ft NGVD 4.8 4.3 5.0 150Peak Stage (ft NGVD)<strong>and</strong> Q (cfs)HW = 3.87TW = 2.90Q = 3000HW = 4.94S-121<strong>Water</strong> supply, C-2 to C-100CCulvert8ft x 8ft box x 128ft8ft x 8ft gateInvert elev = -4.5ft NGVD2.9(water supply)2.8(water supply)100(water supply)S-122<strong>Water</strong> supply, C-1 to C-Gated Culvert3.72in x 60ft RCP2.52.0100BInvert elev = -4.0ft NGVD (water supply) (water supply)Source: An Atlas of Eastern Dade County Surface <strong>Water</strong> Management Basins, November 1987. Pg. 49200(water supply)82
C-1 (Black Creek Canal) BasinThere are four Project canals in the C-1 basin: C-1, C-1W, C-1N, <strong>and</strong> the L-31N. The canals havethree functions: 1) to provide drainage <strong>and</strong> flood protection for the C-1 basin; 2) to supply waterto the C-1 <strong>and</strong> C-100 basins for irrigation; <strong>and</strong> 3) to maintain a groundwater table elevation nearthe lower reach of C-1 adequate to prevent saltwater intrusion to local groundwater. A portion ofthe C-1 basin is located in Area B.There are also ten Project structures in the C-1 basin. Five of these (S-21, S-148, S-338, S-149, <strong>and</strong>S-122) are directly related to the operation of C-1/C-1W <strong>and</strong> C-1N. The other five structures (S-173, S-331, S-334, S-335, <strong>and</strong> S-336) along with the L-31N borrow canal are part of the <strong>South</strong> DadeConveyance System (SDCS) which supplies water to basins in south Miami-Dade County. Thedesign criteria for the structures are given in Table 4-25.C-1 (in Area A) was designed to pass 40 percent of the St<strong>and</strong>ard Project Flood (SPF), however,right-of-way was purchased for a canal large enough to pass 60 percent of the SPF. Actual stagesin the canal are probably lower than the design stages tabulated in the Army Corps of Engineer’sGeneral Design Memor<strong>and</strong>um due to over-excavation <strong>and</strong> free digging in the lower reaches ofthe canal. Downstream of the West Dade Expressway, the channel has been excavated from a 60percent to a 100 percent SPF hydraulic section. The western reaches have been enlarged toh<strong>and</strong>le over design flows when the <strong>South</strong> Dade Conveyance System is supplying water todownstream reaches during drought conditions.The optimum stage upstream of S-148 <strong>and</strong> S-149 is 5.5ft NGVD; however, this is rarely achieveddue to large amounts of seepage past the structures. Flows of 40 – 50 cfs have been measuredwith the structures closed.83
Table 4-25: C-1 (Black Creek Canal) Basin Structures Design CriteriaStructure Type DesignHW (ftNGVD)S-21Stage DivideS-148Stage DivideS-149Stage divideS-122Divide structure C-1 <strong>and</strong> C-100B<strong>Water</strong> supply C-1 to C-100BS-338<strong>Water</strong> supply, C-1S-334<strong>Water</strong> Supply to S. DadeConveyance SystemS-335<strong>Water</strong> Supply, <strong>South</strong> DadeConveyance SystemSpillway, 3 gates27ft x 10.7ftCrest lgth = 81ftCrest elev = -6.5ft NGVDSpillway, 2 gates20ft x 12ftCrest lgth = 40ftCrest elev = -7.0ft NGVDGated Culvert2.84 x 63ft CMPInvert elev = -4.5ft NGVDGated Culvert3.72in x 60ft CMPInvert elev = -4.0ft NGVDGated Culvert2.84in x 85ft CMPInvert elev = -4.5ft NGVDSpillway, 1 gate29ft x 14.6ftCrest lgth = 29ftCrest elev = -6.9ft NGVDSpillway, 1 gate20ft x 11.2ftCrest lgth = 20ftCrest elev = -4.2ft NGVDDesign TW(ft NGVDOptimumStage (ftNGVD)1.9 1.4 1.2 Wet Season2.0 dry seasonDesign Q(cfs)Peak Stage (ftNGVD) <strong>and</strong>Q (cfs)2560 HW = 3.87TW = 2.90Q = 30003.9 3.7 4.5 1500 HW = 4.945.0 3.8 5.5 4002.5(watersupply)2.0(watersupply)200(watersupply)6.5 6.0 3055.0 4.7 12305.0 4.8 52584
Table 4-25: C-1 (Black Creek Canal) Basin Structures Design Criteria (Cont.)Structure Type DesignHW (ftNGVD)S-336<strong>Water</strong> Supply, <strong>South</strong> DadeConveyance SystemGated Culvert3.54in x 85ft CMPInvert elev = -1.8ft NGVDDesign TW(ft NGVDOptimumStage (ftNGVD)4.7 4.2 (TW stage rise to –6.5ft during wetseason)Design Q(cfs)145Peak Stage (ftNGVD) <strong>and</strong>Q (cfs)S-331<strong>Water</strong> Supply to C-111S-173Divide StructurePump3 unitsCulvert1.72in x 70ft RCInvert elev = -2.5ft NGVD3.0 (watersupply)5.0(dividestructurewhenpumpsoperate)Source: An Atlas of Eastern Dade County Surface <strong>Water</strong> Management Basins, November 1987. Pg. 556.0 (watersupply)4.5 (dividestructurewhen pumpsoperate)4.5 to 5.0HW (dependingon stage atgroundwater wellAngel)4.5 to 5.5(depending onconditions in E.Everglades)116015085
C-102 BasinThere are two Project canals in the C-102 basin, C-102 <strong>and</strong> C-102N. The canals have threefunctions: 1) to provide drainage <strong>and</strong> flood protection for the C-102 basin; 2) to supply water tothe basin for irrigation; <strong>and</strong> 3) to maintain a groundwater table adequate to prevent saltwaterintrusion into local groundwater. <strong>Water</strong> is supplied to the C-102 basin from the <strong>South</strong> DadeConveyance System (SDCS) during periods of low natural flow. There are also four Projectstructures located in the C-102 basin: S-21A, S-165, S-195, <strong>and</strong> S-194. The design criteria for thesestructures are given in Table 4-26.During normal operating, the 9.4 square mile area adjacent to C-102 west of Krome Avenuedrains to the east via C-102 to Biscayne Bay. During flood conditions S-194 is closed <strong>and</strong> this areadrains to the west to the L-31N borrow canal <strong>and</strong> the C-111 basin.C-102 was designed for a 1 – 10 year flood protection (40 percent SPF), but there is sufficientright-of-way for a canal that provides 1 – 30 year flood protection (60 percent SPF).86
Table 4-26: C-102 Basin Structures Design CriteriaStructureS-21AStage divideS-195Divide StructureS-194Divide structureTypeDesign HW(ft NGVD)Design TW(ft NGVD)Spillway, 2 gates20ft x 11.8ftCrest lgth = 40ftCrest elev = -7.8ft NGVD 1.9 1.4Optimum State(ft NGVD)Design Q (cfs)1.2 Wet season2.0 dry season 1330Gated culvert2.84in x 152in x 90ft CMPArchInvert elev = -1.8ft NGVD 5.6 4.8 5.5 180Culvert2.84in x 90ft RCP, gatedInvert elev = -2.5 to -3.5ftNGVD3.9(water supply)S-165Stage divideSource: An Atlas of Eastern Dade County Surface <strong>Water</strong> Management Basins, November 1987. Pg. 603.7(waterPeak Stage (ftNGVD) <strong>and</strong> Q (cfs)HW = 2.87TW = 2.37Q = 2454 cfsHW = 7.1TW = 6.4Q = 400HW = 9.23TW = 9.15supply) 5.5 (to west) ~ 190 (storm Dennis)HW = 7.55TW = 6.28Spillway, 1 gate12ft x 7ftCrest lgth = 12ftCrest elev = -0.5ft NGVD 5.6 4.6 5.5 450Q = 66687
C-103 BasinThere are three Project canals in the C-103 basin: C-103, C-103S, <strong>and</strong> C-103N. These canals havethree primary functions: 1) to provide drainage <strong>and</strong> flood protection for the C-103 basin; 2) tosupply water to the basin for irrigation; <strong>and</strong> 3) to maintain a groundwater table elevationadequate to prevent saltwater intrusion to local groundwater. <strong>Water</strong> is supplied to the C-102basin from the <strong>South</strong> Dade Conveyance System (SDCS) during periods of low natural flow.There are also five Project structures in the C-103 basin: S-20F, S-179, S-167, S-166, <strong>and</strong> S-194. Thedesign criteria for these structures are given in Table 4-27.5.2 square miles of the C-103 basin the Homestead <strong>and</strong> <strong>Florida</strong> City area, are not drained. At thetime C-103S was constructed, the city commissioners of Homestead <strong>and</strong> <strong>Florida</strong> City declined tohave the canal constructed within their respective city limits.88
Table 4-27: C-103 Basin Structures Design CriteriaStructureS-20FStage divideS-179Stage DivideTypeDesign HW(ft NGVD)Design TW(ft NGVD)Spillway, 3 gates25ft x 13ftCrest lgth = 75ftCrest elev = -9.0ft NGVD 1.9 1.4Spillway, 2 gates25ft x 12ftCrest lgth = 50ftCrest elev = -7.5ft NGVD 3.8 3.2Optimum State(ft NGVD)Design Q(cfs)Peak Stage (ftNGVD) <strong>and</strong> Q (cfs)HW = 3.05TW = -0.5Q = 57801.4 Wet season2.2 dry season 2900 (storm Dennis)HW = 4.942.5 to 3.5 (Dryseason dependingTW = 3.82on rainfall)Q = 26803.5 (Wet season) 1920 (storm Dennis)Spillway, 1 gateS-16712ft x 7ftCrest lgth = 12ftHW = 7.68TW = 5.5Stage Divide Crest elev = -0.5ft NGVD 5.6 4.8 5.5 330 Q = 410HW = 8.75200 at 1ftCulvertTW = (under water)(divide structureS-1961.84in x 58ft RCP gatedclosed during(storm Dennis)Divide Structure Invert elev = -2.5 to -3.5ft NGVD 6.5 5.5 5.5 (to west) storms)Source: An Atlas of Eastern Dade County Surface <strong>Water</strong> Management Basins, November 1987. Pg. 6589
North Canal, <strong>Florida</strong> City Canal, Model L<strong>and</strong>, <strong>and</strong> Homestead Air Force Base BasinThe area occupied by the Homestead Air Force Base, <strong>and</strong> the area south of the C-103 basin, eastof Old Dixie Highway <strong>and</strong> Card Sound Road, <strong>and</strong> west <strong>and</strong> north of L-31E is drained by fiveexisting Miami-Dade County canals: The five canals are:• The Military Canal which drains the 4.7 square miles of the Homestead Air Force Base• The North Canal which drains 7.8 square miles• The <strong>Florida</strong> City Canal which drains 12.5 square miles• The North Model L<strong>and</strong> Canal <strong>and</strong>• The <strong>South</strong> Model L<strong>and</strong> Canal, which together drain 28.1 square miles.All of the operational Project control structures (S-20G, S-20F, <strong>and</strong> S-20) in these basins providewater surface elevation control upstream of their locations in the canals in which they occur.Design criteria for S-20G is given in Table 4-30. Design criteria for S-20 <strong>and</strong> S-20A are given inTable 4-29, <strong>and</strong> design criteria for S-20F is given in Table 4-28.90
Table 4-28: North Canal <strong>and</strong> <strong>Florida</strong> City Basin Structure Design CriteriaStructureTypeDesign HW(ft NGVD)Design TW(ft NGVD)Spillway, 3 gates25ft x 13ftS-20FStage DivideCrest lgth = 75ftCrest elev = -9.0ft NGVD 1.9 1.4Source: An Atlas of Eastern Dade County Surface <strong>Water</strong> Management Basins, November 1987. Pg. 76Optimum State(ft NGVD)Design Q (cfs)1.4 (Dry season)2.2 (Wet season) 2900Peak Stage (ft NGVD)<strong>and</strong> Q (cfs)HW = 3.05TW = -0.5Q = 5780(storm Dennis)Table 4-29: Model L<strong>and</strong> Canal Basin Structures Design CriteriaStructureS-20Stage DivideTypeDesign HW(ft NGVD)Design TW(ft NGVD)Spillway, 1 gate16ft x 11.4ftCrest lgth = 16ftCrest elev = -7.4ft NGVD 1.5 1.0S-20AStage DivideSpillway, 1 gate16ft x 13.3ftCrest lgth = 16ftCrest elev = -9.3ft NGVD---NEVEROPENED---Source: An Atlas of Eastern Dade County Surface <strong>Water</strong> Management Basins, November 1987. Pg. 76Table 4-30: Homestead Basin Structure Design CriteriaOptimum State(ft NGVD)Design Q (cfs)1.2 (Dry season)1.5 (Wet season) 450Peak Stage (ft NGVD)<strong>and</strong> Q (cfs)HW = 2.78TW = 2.31Q = 740StructureTypeDesign HW(ft NGVD)Design TW(ft NGVD)Spillway, 1 gate25ft x 12.3ftS-20GStage DivideCrest lgth = 25ftCrest elev = -8.3ft NGVD 2.0 1.5Source: An Atlas of Eastern Dade County Surface <strong>Water</strong> Management Basins, November 1987. Pg. 69Optimum State(ft NGVD)Design Q (cfs)1.0 (Dry season)2.0 (Wet season) 900Peak Stage (ft NGVD)<strong>and</strong> Q (cfs)HW = 3.89TW = 2.47Q = 103091
C-111 BasinThere are five operational canals in the C-111 basin: C-111, C-111E, C-113, the L-31N borrowcanal, <strong>and</strong> the L-31W borrow canal. These canals have three functions: 1) to provide drainage<strong>and</strong> flood protection for the C-111 basin; 2) to supply water to the C-111, C-102, <strong>and</strong> C-103 basins,<strong>and</strong> to Everglades National Park (i.e., to Taylor Slough <strong>and</strong> the Panh<strong>and</strong>le Park); <strong>and</strong> 3) tomaintain a groundwater table elevation near the lower reach of C-111 adequate to preventsaltwater intrusion to local groundwater. <strong>Water</strong> is supplied to the C-111 basin from the <strong>South</strong>Dade Conveyance System (SDCS) by way of the L-31N borrow canal.There are twelve Project control structures in the C-111 basin. They are: S-331, S-173, S-194, S-196,S-176, S-174, S-332, S-175, S-177, S-178, S-18C, <strong>and</strong> S-197. The design criteria for these structuresare given in Table 4-31.C-111 is designed to give flood protection from a 1 – 10 year storm. The system h<strong>and</strong>led theApril 25, 1979 storm, a 1 – 15 year event, with 11 to 12 inches of rain. However, Tropical StormDennis, a 1 – 100 year event with up to 25 inches of rain, caused extensive flooding in the basin.92
Table 4-31: C-111 Basin Structure Design CriteriaStructureS-177Stage divideS-176Stage divideS-174Stage divideS-175Stage divideS-332<strong>Water</strong> supply to TaylorSlough for ENPS-196Divide StructureTypeDesign HW(ft NGVD)Design TW(ft NGVD)Spillway, 1 gate22ft x 12ftCrest lgth = 22ftCrest elev = -7.1ft NGVD 4.7 4.2Optimum State (ftNGVD)2.8 - 3.3 (October)Peak Stage (ft NGVD)Design Q (cfs) <strong>and</strong> Q (cfs)HW = 4.943.0 - 3.7 (afterTW = 4.30planning toQ = 1695harvest)3.6 - 4.2 (rest of yr) 1400 (storm Dennis)Spillway, 1 gate20ft x 8ftCrest lgth = 16ftHW = 7.53TW = 7.15Q = 888Crest elev = -1.0ft NGVD 6.3 5.9 5.5 630 (storm Dennis)Spillway, 1 gate16ft x 8ftCrest lgth = 16ftCrest elev = -1.5ft NGVD 6.0 5.5Culvert3.84in x 56ft RCP gateInvert elev = -5.0ft NGVD 5.0 4.5HW = 7.56TW = 3.5TW = 7.18(Oct to Feb or Mar)HW = 4.5 500 Q = 550HW = 3.5(Oct to end ofharvest)HW = 4.5 (rest ofHW = 5.85TW = 5.16Q = 534yr) 500 (storm Dennis)Pump6 units 2.0
Table 4-31: C-111 Basin Structure Design Criteria (Cont.)StructureS-194Divide StructureS-173Divide StructureS- 178Stage DivideS-197Flood DischargesS-18CStage divideTypeCulvert2.84in x 90ft RCP gatedInvert elev = -2.5 to -3.5ftNGVDCulvert1.72in x 70ft RCP gatedInvert elev = -2.5ft NGVDDesign HW(ft NGVD)3.9(watersupply)5.0(Dividesstructure whenpumpsoperate)Design TW(ft NGVD)3.7(watersupply)4.5(Dividesstructure whenpumps operate)Optimum State (ftNGVD)5.5 (to west)Design Q (cfs)~190(water supplydividesstructureduring storm)4.5 to 5.5(depending onconditions in EEverglades) 150Box Culvert12ft x 10ft controlled2.8ft x 8ft gates, top gateclosed at 5.0ft 4.6 3.9 4.5 300Gated Culvert3.84in x 66ft CMPInvert elev = -8.0ft NGVD 1.4 0.6Nomally Closed(open when S-180 TW =1.9, closed when HW =1.6) 550Spillway, 2 gates22ft x 11ftCrest lgth = 44ftCrest elev = -7.0ft NGVD 3.3 2.8 HW = 2.3ft NGVD 2100S-331<strong>Water</strong> supply to C-111Pump3 units3.0(watersupply)6.0(watersupply)Source: An Atlas of Eastern Dade County Surface <strong>Water</strong> Management Basins, November 1987. Pg. 82HW = 4.5 - 5.0(depending on Stage atgroundwater wellAngel) 1160Peak Stage (ft NGVD)<strong>and</strong> Q (cfs)HW = 9.23TW = 9.15(storm Dennis)HW = 8.02TW = 8.25(storm Dennis)HW =2.74Q = 343094
V. TASK 5 - ANALYSIS OF EXISTING BACKLOG AND SERVICE DEFICIENCIESA. POTABLE WATERData collected on potable water in previous tasks was used to determine the existing backlog <strong>and</strong>service deficiencies in the Region. For the purpose of this study there are two levels of backlog:1) any facility whose maximum-day dem<strong>and</strong> is currently operating at over 100% of its permittedcapacity; <strong>and</strong> 2) any facility whose maximum-day dem<strong>and</strong> is 75% or more of the facility’spermitted capacity. Pursuant to the <strong>Florida</strong> Department of Environmental ProtectionAdministrative Code 62-555.348, suppliers of water shall routinely compare the total net quantityof finished drinking water produced each day by their treatment plants(s) with the totalpermitted maximum-day operating capacity of their plant(s). When the total maximum-dayquantity of finished water produced exceeds 75% of the total permitted maximum-day operatingcapacity of the plant, the supplier of water shall submit source/treatment/storage capacityanalysis reports to the Department. Each initial or updated report shall evaluate the capacity ofall source, treatment, or storage facilities connected to a water system <strong>and</strong> shall contain thefollowing information:a) The capacity of each water treatment plant’s source water facilities <strong>and</strong> treatmentfacilities; the permitted maximum-day operating capacity <strong>and</strong>, if applicable,permitted peak operating capacity of each plant; <strong>and</strong> the useful capacity of eachfinished-water storage facility;b) The maximum-day <strong>and</strong> average annual daily quantities of finished water producedby each plant during each of the past ten years or during each of the years the planthas been in operation, whichever is less;c) Projected total water dem<strong>and</strong>s – total annual average annual daily dem<strong>and</strong> <strong>and</strong>total maximum-day dem<strong>and</strong> (including fire-flow dem<strong>and</strong> if fire protection is beingprovided) – for at least the next ten years <strong>and</strong> projected total finished-water storageneed (including fire storage if fire protection is being provided) for at least the nextten years;d) An estimate of the time required for maximum-day water dem<strong>and</strong> (including fireflowdem<strong>and</strong> if fire protection if being provided) to exceed the total permittedmaximum-day operating capacity of the plant(s) <strong>and</strong> an estimate of the timerequired for finished-water storage need (including fire storage if fire protection isprovided) to exceed the existing total useful finished-water storage capacity;e) Recommendations for new or exp<strong>and</strong>ed source, treatment, or storage facilities; <strong>and</strong>f) A recommendation schedule showing dates for design, permitting, <strong>and</strong>construction of recommended new or exp<strong>and</strong>ed source, treatment, or storagefacilities.Further analysis was done to determine at what level the Region is operating using averageannual daily dem<strong>and</strong> 12 .12 For the purpose of this study the average annual daily flow is taken to mean the total volume of water received in ayear divided by 365 days.95
1. Remaining <strong>and</strong> Additional CapacityEach water plant has two different capacities, design capacity <strong>and</strong> permitted capacity. Thedesign capacity of a plant, sometimes called the “physical” capacity, is the production capacity ofthe plant. This is the amount per day that a plant can physically treat or hold, irrespective ofregulatory constraints. The permitted capacity is the capacity that is established by a regulatingor permitting agency. In almost all cases the permitted capacity of a plant will be the mostconstraining, which is why it is used to determine the operating rate of the plants.In certain cases, the permitted capacity of a plant is less than the design capacity. There are manyreasons for this, most of which are unique to a particular plant. When the permitted capacity isless than the design capacity, there is “surplus” capacity in the plant. In certain cases when thereis surplus capacity, plant operators may have the ability to re-rate their facility to get an increasein permitted capacity. The constraints under which a facility may re-rate are those that wereapplied to the plant when it was first permitted.A re-rate to increase the permitted capacity so it equals the design capacity of the plant wouldinvolve only a new permit; there would be no capital costs associated with a change of thisnature. Conversely, those plants that do not have the ability to re-rate would have to increase thedesign capacity of the facility, which would require additional capital costs. Several plantswithin the Region currently have expansion plans in place.96
2. The RegionAs a whole, the Region (Broward, Miami-Dade, <strong>and</strong> Monroe Counties) has a total of thirty-sixwater treatment plants with a combined permitted capacity of 889.634 mgd. Of the thirty-sixplants, ten are currently operating at below 75% of the permitted capacity during maximum-daydem<strong>and</strong>, nineteen are operating at between 75% <strong>and</strong> 100%, <strong>and</strong> 7 plants have operating ratesabove 100%. Figure 5-1 illustrates this.Figure 5-1: Regional Operating RatesRegion-Wide <strong>Water</strong> Treatment Plants1019# of Plants operating below 75%# of Plants operating over 100%# of Plants operating over 75%Source: SFRPCWhen using peak dem<strong>and</strong> or maximum day dem<strong>and</strong> to determine the operating rate in theRegion, it was found that the Region is operating at 84.9% of the permitted capacity. Whenaverage annual daily dem<strong>and</strong> is used, the Region is operating at 71.9% of the total permittedcapacity. This means that during the maximum day dem<strong>and</strong>, the Region as a whole is operatingabove the 75% threshold we have set for determining backlog. Overall, there is a backlog of117.31 mgd of capacity during maximum day dem<strong>and</strong>. The Region is also approaching the 75%point during average annual daily dem<strong>and</strong>. Figure 5-2 illustrates each County’s dem<strong>and</strong>s, whileFigure 5-3 shows the operating rates of each County during times of both dem<strong>and</strong>s.797
Figure 5-2: <strong>Water</strong> Dem<strong>and</strong> in the Region800700600500MGD4003002001000Broward County Miami-Dade County Monroe County RegionMaximum-day Dem<strong>and</strong> (mgd)Avg. Annual Daily Dem<strong>and</strong> (mgd)Source: SFRPCFigure 5-3: WTP Operating Rates in the Region140.00%120.00%% of Permited Capacity100.00%80.00%60.00%40.00%20.00%0.00%Broward County Miami-Dade County Monroe County RegionMaximum-day Operating RateAverage Annual Daily Dem<strong>and</strong> Operating RateSource: SFRPCThere are a total of seventeen plants in the Region that have the possibility to re-rate <strong>and</strong> gainadditional “surplus” capacity. This could result in an additional 123.512 mgd of capacity to theRegion with no capital costs. Currently each county is operating over the 75% threshold duringmaximum day dem<strong>and</strong>. With the additional capacity that re-rating would bring, the Region aswhole would drop just below the 75% mark. Of the three counties, Broward County would bethe only one whose operating rate during maximum day dem<strong>and</strong> would drop below 75%. Pleasesee Table 5-1 below.98
Table 5-1: Regional Operating RatesDesignCapacityPermittedCapacityAvailableCapacityCurrentOperatingRateBroward County 490.646 415.944 74.7 76.7% 65.0%Miami-Dade County 500.50 453.76 46.74 90.9% 82.4%Monroe County 22.0 19.93 2.07 119.4% 108.2%Region 1013.146 889.634 123.512 84.9% 74.5%Source: SFRPC, Broward County, Miami-Dade County, FKAAOperating Rateafter Re-rating ofPlantsAs a whole, the expansion plans that are in place around the Region would provide for anadditional 158.26 mgd of design capacity. This would bring the total design capacity in theRegion to 1171.406 mgd. Each county is summarized in Table 5-2 below along with the totals forthe Region.Table 5-2: Planned Capacity IncreasesCapacityIncrease (mgd)Current DesignCapacityFutureDesignCapacityBroward County 37.0 490.646 527.646Miami-Dade County 111.26 500.50 611.76Monroe County 10.0 22.0 32.0Region 158.26 1013.146 1171.406Source: SFRPC, Broward County, Miami-Dade County, FKAA99
3. Broward CountyWithin Broward County there are twenty-eight water treatment plants. Based on the datagathered in the survey (Task 4) it was determined that the total permitted capacity within theCounty is 415.944 million gallons per day (mgd), with a peak flow of 319.005 mgd <strong>and</strong> an averageannual daily dem<strong>and</strong> of 241.984 mgd. During times of peak dem<strong>and</strong>, the County as a wholecould be operating at as much as 76.7% of the permitted capacity. At average annual dailydem<strong>and</strong>, the county is operating at 58.2% of its permitted capacity. During maximum-daydem<strong>and</strong> there is a current backlog of 9.4 mgd of capacity. Given the criteria we have establishedfor defining backlog, Broward County is currently operating above the points at which concern israised.When each individual plant is examined, a wide range of operating rates is found. Of the 28plants in Broward County, eighteen are currently operating at over 75% of their permittedcapacity during maximum-day dem<strong>and</strong>. Of these eighteen plants, three are currently operatingover their permitted capacity during maximum-day dem<strong>and</strong>, <strong>and</strong> ten are operating below 75%.Table 5-3 lists all plants in Broward County with their operating rates. Figure 5-4 shows thebreakdown of plants within the County. Map 5-1 shows the service areas of the facilities <strong>and</strong> theoperating rate of each.Table 5-3: WTP’s in Broward County Operating at over 75% during Average Annual DailyDem<strong>and</strong>Plantpermit #Plant NamePermittedCapacityPeakDem<strong>and</strong>OperatingRate4060167 Broward County 1A WTP 16.0 9.0 56.3%4060163 Broward County 2A WTP 30.0 17.4 58.0%4060209 City of Coral Springs 16.0 10.0 64.4%4060253 City of Dania Beach WTP 4.0 3.394 84.9%FL4060573 City of Hall<strong>and</strong>ale Beach 10.0 7.0 70.0%FL4060787 City of Lauderhill 8.137 8.581 105.5%06-58-00059 City of Margate WTP 13.51 9.077 67.2%4061429 City of Tamarac Utilities West 8.3 13.07 157.5%4060282 Cooper City Utilities 7.0 5.7 81.4%4060291 Coral Springs Improvement District 5.75 5.45 94.8%06-58-00027 Davie WTP System I 3.4 1.193 35.1%06-58-00028 Davie WTP System III 4.0 3.57 89.3%4060254 Deerfield Beach East <strong>Water</strong> Plant 16.8 14.9 47.0%4060254 Deerfield Beach West <strong>Water</strong> Plant 18.0 14.9 82.8%4060419 Ferncrest Utilities 1.0 0.874 87.4%40604864 Fiveash <strong>Water</strong> Plant (Ft. Lauderdale) 67.3 57.1 84.8%4060614 Hillsboro Beach <strong>Water</strong> Plant 1.0 1.3 130.0%4060642 Hollywood <strong>Water</strong> Treatment Plant 57.5 32.8 57.0%W11035 Miramar West <strong>Water</strong> Plant 7.5 6.5 86.7%4064390 N. Springs Improvement District 6.547 5.41 82.6%4061407 Park City WTP (Sunrise # 2) 6.0 5.53 92.2%4061083 Pembroke Pines WTP #2 16.2 15.5 95.7%4061121-01 Plantation Central WTP 12.0 10.564 88.0%4061121-02 Plantation East WTP 12.0 8.212 68.4%06-58-00079 Pompano Beach WTP 24.0 21.9 91.3%4061408 Sawgrass WTP (Sunrise #3) 18.0 12.2 67.8%100
Table 5-3: WTP’s in Broward County Operating at over 75% during Average Annual DailyDem<strong>and</strong> (Cont.)Plantpermit #Plant NamePermittedCapacityPeakDem<strong>and</strong>OperatingRate4034326 <strong>South</strong>west (S. Broward) WTP 2.0 1.88 94.0%4061410 Springtree WTP (Sunrise #1) 24.0 22.7 94.6%Broward County 415.944 319.005 76.7%Sources: Broward County, city of Coral Springs, Dania Beach WTP, City of Hall<strong>and</strong>ale Beach, Cooper City Utilities,Hollywood WTP, City of Sunrise, City of Fort Lauderdale, Hillsboro Beach <strong>Water</strong> Plant, City of Margate, FerncrestUtilities, Pompano Beach WTP, City of Tamarac Utilities, Deerfield Beach, Miramar, Coral Springs Improvement District,North Springs Improvement District, Town of Davie, City of Lauderhill, Pembroke Pines, <strong>and</strong> City of PlantationFigure 5-4: Operating Rates of Broward County <strong>Water</strong> Treatment PlantsBroward County <strong>Water</strong> Treatment Plants1015# of Plants operating below 75%3# of Plants operating over 100%# of Plants operating over 75%Source: SFRPC101
Hold for map 5-1: Broward County <strong>Water</strong> Service Area Operating Rates102
The picture changes slightly when analysis is done using average annual daily dem<strong>and</strong> todetermine operating rates instead of maximum day dem<strong>and</strong>. Using the same criteria it wasfound that seven plants are operating at over 75% of their permitted capacities during averageannual daily dem<strong>and</strong>, with one plant, the Hillsboro Beach <strong>Water</strong> Plant, operating at more than100% of its permitted capacity. Table 5-4 lists these plants.Table 5-4: WTP’s in Broward County Operating at over 75% During Average Annual DailyDem<strong>and</strong>Plant permit # Plant Name PermittedCapacityAvg. AnnualDailyDem<strong>and</strong>OperatingRateFL4060787 City of Lauderhill 8.137 6.859 84.3%4061429 City of Tamarac Utilities West 8.3 6.441 77.6%06-58-00028 Davie WTP System III 4.0 3.41 85.3%4060419 Ferncrest Utilities 1.0 0.768 76.8%4060614 Hillsboro Beach <strong>Water</strong> Plant 1.0 1.09 109.0%W11035 Miramar West <strong>Water</strong> Plant 7.5 5.8 77.3%4061083 Pembroke Pines WTP #2 16.2 13.5 83.3%Source: SFRPC, City of Lauderhill, City of Tamarac, Town of Davie, Ferncrest Utilities, Hillsboro Beach, City of Miramar,City of Pembroke PinesCurrently, eleven facilities in Broward County may have the ability to re-rate in order for thepermitted capacity to equal the design capacity of the plant. This could result in an additional74.7 mgd of capacity in Broward County. Of those eleven plants, eight are currently operating atmore than 75% of their permitted capacity during maximum day dem<strong>and</strong>. These eight plantsare: Fiveash <strong>Water</strong> Plant, Hillsboro Beach <strong>Water</strong> Plant, Pompano Beach WTP, City of TamaracUtilities West, Coral Springs Improvement District, North Springs Improvement District, City ofLauderhill, <strong>and</strong> Pembroke Pines WTP #2. Table 5-5 lists all eleven plants.Table 5-5: WTP’s in Broward County Whose Permitted Capacities Are Less Than TheirDesigned CapacitiesPlant NameDesignCapacityPermittedCapacityAvailableCapacityCurrentOperatingRateBroward County 2A WTP 40.0 30.0 10.0 58.0%City of Lauderhill 16.0 8.137 7.863 105.5%City of Margate WTP 18.0 13.51 4.49 67.2%City of Tamarac Utilities West 20.0 8.3 11.7 157.5%Coral Springs Improvement District 7.12 5.75 1.37 94.8%Fiveash <strong>Water</strong> Plant (Ft. Lauderdale) 75.0 67.3 7.7 84.8%Hillsboro Beach <strong>Water</strong> Plant 2.016 1.0 1.016 130.0%Hollywood WTP 61.0 57.5 3.5 57.0%North Springs Improvement District 6.81 6.5474 .2626 82.6%Pembroke Pines WTP #2 18.0 16.2 1.8 95.7%Pompano Beach WTP 50.0 24.0 26.0 91.3%Source: SFRPC, Broward County, City of Lauderhill, City of Margate, City of Tamarac, Coral Springs ImprovementDistrict, City of Fort Lauderdale, Hillsboro Beach, City of Hollywood, North Springs Improvement District, City ofPembroke Pines, City of Pompano Beach103
The operating rate of four of the eleven plants listed above would drop below the 75% level withthe additional permitted capacity. Table 5-6 lists these four plants.Table 5-6: WTP’s in Broward County Whose Operating Rates Would Drop Below 75% IfPermitted Capacity Equaled Designed CapacityPlant NameAvailableCapacityCurrentOperating RateCity of Lauderhill 7.863 105.5% 53.6%City of Tamarac Utilities West 11.7 157.5% 65.4%Hillsboro Beach <strong>Water</strong> Plant 1.016 130.0% 64.5%Pompano Beach WTP 26.0 91.3% 43.8%Source: SFRPC, City of Lauderhill, City of Tamarac, Hillsboro Beach, City of Pompano BeachOperating Rate(with additional“surplus” capacity)In addition to the capacity that could be gained through a re-rating, several plants in BrowardCounty have expansion plans in place. According to data collected in the survey (Task 4), eightplants have plans to increase their capacity. Table 5-7 lists those plants.Table 5-7: WTP’s in Broward County With Planned Capacity IncreasesPlant NameCapacityIncrease(mgd)ExpansionCompletion Yr.CurrentDesignCapacityFutureDesignCapacityCity of Dania Beach WTP 4.5 2007 3.0 7.5City of Hall<strong>and</strong>ale Beach 6.0 2006 10.0 16.0Davie WTP System III 4.0 2006 4.0 8.0Deerfield Beach West <strong>Water</strong> Plant 3.5 2008 18.0 21.5Miramar West <strong>Water</strong> Plant 3.0 2007 7.5 10.5Pembroke Pines WTP #2 6.0 2005-2007 18.0 24.0Sawgrass WTP (Sunrise #3) 6.0 2006 18.0 24.0Springtree WTP (Sunrise #1) 4.0 2006 24.0 28.0Source: SFRPC, City of Dania Beach, City of Hall<strong>and</strong>ale Beach, Town of Davie, City of Deerfield Beach, City of Miramar,City of Pembroke Pines, City of SunriseThese additions would bring the total design capacity in Broward County to 527.646 mgd, upfrom the current capacity of 415.944 mgd.104
4. Miami-Dade CountyThere are seven water treatment plants in Miami-Dade County. The combined permittedcapacity of these plants is 453.76 mgd, with a maximum-day dem<strong>and</strong> of 412.40 mgd <strong>and</strong> anaverage annual daily dem<strong>and</strong> of 380.31 mgd. During times of maximum-day dem<strong>and</strong> theCounty could be operating at as much as 90.9% of the total permitted capacity. This puts theCounty as a whole over the 75% threshold that has been established to determine backlog. Thecurrent backlog in the County, using maximum day dem<strong>and</strong>, is 96.11 mgd. Using averageannual daily dem<strong>and</strong>, the County is operating at 83.8% of permitted capacity, also over the 75%threshold.Analysis of each plant reveals that all seven plants are currently operating at over 75% of theirpermitted capacities during peak dem<strong>and</strong>. Three of the plants are operating at more than 100%of their permitted capacity during peak dem<strong>and</strong>, they are: <strong>Florida</strong> City, Winson <strong>Water</strong> Plant inNorth Miami, <strong>and</strong> the Norwood <strong>Water</strong> Plant in North Miami Beach. Table 5-8 lists the plants inMiami-Dade County <strong>and</strong> their operating rates. Figure 5-5 shows the breakdown of the plants inthe County. Map 5-2, on the following page, shows the operating rates of each service area.Table 5-8: Miami-Dade County WTP maximum-day Dem<strong>and</strong> Operating RatesPlant permit # Plant Name PermittedCapacityPeakDem<strong>and</strong>CurrentOperatingRate13-00017-W Alex<strong>and</strong>er Orr 203.11 185.5 91.3%4130645 City of Homestead 11.7 10.9 93.2%PWO-000017 City of N. Miami Winson <strong>Water</strong> 9.3 10.0 107.5%Plant4130255 <strong>Florida</strong> City 3.51 3.604 102.7%13-00037-W Hialeah-Preston 199.19 177.6 89.2%4131618 Norwood <strong>Water</strong> Plant – N. Miami 16.0 16.0 100.0%Beach13-00040-W <strong>South</strong> Miami Dade 10.95 8.8 80.4%Miami-Dade County 453.76 380.31 90.9%Source: SFRPC, Miami-Dade County, City of Homestead, City of North Miami, City of North Miami Beach, City of<strong>Florida</strong> CityFigure 5-5: Operating Rates of Miami-Dade County <strong>Water</strong> Treatment PlantsMiami-Dade County <strong>Water</strong> TreatmentPlants34# of Plants operating over 100%# of Plants operating over 75%Source: SFRPC105
Hold for map 5-2: Miami-Dade County <strong>Water</strong> Service Area Operating Rates106
As with Broward County, the picture changes when average annual daily dem<strong>and</strong> is used todetermine operating rates rather than maximum-day dem<strong>and</strong>. Five plants were found to beoperating at more than 75% of their permitted capacity during average annual daily dem<strong>and</strong>,with one additional plant, the City of Homestead plant, approaching the 75% threshold. Theplants are listed in Table 5-9 along with their operating rates at average annual daily dem<strong>and</strong>.Table 5-9: Miami-Dade County WTP’s Average Annual Daily Dem<strong>and</strong> Operating RatesPlant permit # Plant Name PermittedCapacityAvg. AnnualDailyDem<strong>and</strong>OperatingRate13-00017-W Alex<strong>and</strong>er Orr 203.11 171.93 84.6%4130645 City of Homestead 11.7 8.499 72.6%PWO-000017 City of N. Miami Winson <strong>Water</strong> 9.3 8.5 91.4%Plant4130255 <strong>Florida</strong> City 3.51 2.983 85.0%13-00037-W Hialeah-Preston 199.19 166.1 83.4%4131618 Norwood <strong>Water</strong> Plant – N. Miami 16.0 15.5 96.9%Beach13-00040-W <strong>South</strong> Miami Dade 10.95 6.8 62.1%Source: SFRPC, Miami-Dade County, City of Homestead, City of North Miami, City of North Miami Beach, City of<strong>Florida</strong> CityCurrently, five facilities in Miami-Dade County are eligible for re-rating to increase theirpermitted capacity. This could result in an additional 46.74 mgd of capacity to Miami-DadeCounty with no capital costs. Currently all five of these plants are operating at more than 75% oftheir permitted capacity during maximum day dem<strong>and</strong>. Those plants that have “surplus”capacity <strong>and</strong> are currently operating at more than 75% of their permitted capacity duringmaximum day dem<strong>and</strong> are highlighted in Table 5-10 below.Table 5-10:WTP’s in Miami-Dade County whose Permitted Capacities Are Less Than TheirDesign CapacitiesPlant NameDesignCapacityPermittedCapacityAvailableCapacityCurrentOperating RateAlex<strong>and</strong>er Orr 217.74 203.11 14.63 91.3%City of Homestead 16.7 11.7 5.0 93.2%<strong>Florida</strong> City 4.03 3.51 0.52 102.7%Hialeah Preston 225.0 199.19 25.81 89.2%<strong>South</strong> Miami Dade 12.03 10.95 1.08 80.4%Source: SFRPC, Miami-Dade County, <strong>Florida</strong> City, City of HomesteadOf the five plants that have the ability to re-rate <strong>and</strong> are currently operating at over 75% of thepermitted capacity during maximum day dem<strong>and</strong>, two would drop below the 75% point with theadditional permitted capacity. See Table 5-11.107
Table 5-11: WTP’s in Miami-Dade County Whose Operating Rates Would Drop Below 75%If Permitted Capacity Equaled Design CapacityPlant NameAvailableCapacityOperating Rate (atcurrent PermittedCapacity)City of Homestead 5.0 93.2% 65.3%<strong>South</strong> Miami Dade 1.08 80.4% 73.2%Source: SFRPC, City of Homestead, Miami-Dade CountyOperating Rate (atcurrent designCapacity)Five plants in Miami-Dade County have expansion plans in place to add capacity. Theseadditions would add 111.26 mgd of capacity to the County. These expansions would bring thetotal design capacity in Miami-Dade County to 611.76 mgd. See Table 5-12 below for informationon each of the plants.Table 5-12:WTP’s in Miami-Dade County with Planned Capacity IncreasesPlant NameCapacityIncrease (mgd)ExpansionCompletion Yr.Current DesignCapacityFutureDesignCapacityAlex<strong>and</strong>er Orr 60.26 2013 217.74 278.0City of Homestead 5.0 2008 16.7 21.7Hialeah-Preston 10.0 2005 225.0 235.0Norwood <strong>Water</strong> Plant 16.0 2006 16.0 32.0(N. Miami Beach)<strong>South</strong> Miami Dade 20.0 2006 12.03 32.03Source: SFRPC, Miami-Dade County, City of Homestead, City of North Miami Beach108
5. Monroe CountyThe J. Robert Dean <strong>Water</strong> Treatment Plant that is operated by the <strong>Florida</strong> Keys AqueductAuthority serves Monroe County <strong>and</strong> the <strong>Florida</strong> Keys. This plant in located in <strong>Florida</strong> City. Attimes of peak dem<strong>and</strong>, the plant is operating at 119.4% of its permitted capacity, <strong>and</strong> at 88.3% atits average annual daily dem<strong>and</strong>. During Maximum day dem<strong>and</strong>, there is a backlog of 11.8 mgdof capacity. The plant is operating over the threshold of 75% during times of both operatingcriteria.Table 5-13:J. Robert Dean <strong>Water</strong> Treatment Plant Operating RatesPlant NamePermittedCapacityPeakDem<strong>and</strong>OperatingRateAvg.AnnualDailyDem<strong>and</strong>OperatingRateJ. Robert Dean WTP 19.93 23.8 119.4% 17.6 88.3%Source: SFRPC, FKAAThe J. Robert Dean Plant has the ability to re-rate to increase the permitted capacity. This wouldresult in the possibility of an additional 2.07 mgd of capacity at the plant. Currently this plant isoperating over the 75% threshold at the maximum day dem<strong>and</strong> <strong>and</strong> the additional capacitygained through re-rating would not drop the plant below 75%. See Table 5-14 below.Table 5-14: Operating Rates of J. Robert Dean <strong>Water</strong> Treatment Plant at Current DesignCapacityDesignCapacityPermittedCapacityAvailableCapacityOperating Rate (at currentPermitted Capacity)Operating Rate (atcurrent design Capacity)22.0 19.93 2.07 119.4% 108.2%Source: SFRPC, FKAAThe J. Robert Dean WTP is currently planning an expansion that would increase its capacity by10.0 mgd in 2025. This will bring the design capacity of the plant to 32.0 mgd.109
B. WASTEWATERTask 5 utilizes the data collected on wastewater in previous tasks to determine the existingbacklog <strong>and</strong> service deficiencies in the Region. It has been determined that there are two levels ofbacklog: 1) any facility whose average annual daily dem<strong>and</strong> is 75% or more of the facility’spermitted capacity; <strong>and</strong> 2) any facility whose average annual daily dem<strong>and</strong> is over 50% of thepermitted capacity. Pursuant to the <strong>Florida</strong> Department of Environmental ProtectionAdministrative Code 62-600.405, when the three-month average daily flow for the most recentthree consecutive months exceeds 50% of the permitted capacity of the treatment plant or reuse<strong>and</strong> disposal systems, the permittee shall submit to the DEP a capacity analysis report.The capacity analysis report or an update of the capacity analysis report shall evaluate thecapacity of the plant <strong>and</strong> contain data showing the permitted capacity; monthly average dailyflows; three-month average daily flows; <strong>and</strong> annual average daily flows for the past 10 years orfor the length of time the facility has been in operation, whichever is less; seasonal variations inflow; flow projections based on local population growth rates <strong>and</strong> water usage rates for at leastthe next 10 years; an estimate of the time required for the three-month average daily flow to reachthe permitted capacity; recommendations for expansions; <strong>and</strong> a detailed schedule showing datesfor planning, design, permit application submittal, start of construction, <strong>and</strong> placing new orexp<strong>and</strong>ed facilities into operation.While the data collected during the survey does not include the three-month average daily flow,average annual daily flows were collected. These are the flows that are used to determine theoperating rates of the facilities, the counties, <strong>and</strong> the Region. While the DEP st<strong>and</strong>ards are strict,analysis of the Region is done at 50% operating rate level.Unlike water treatment plants, wastewater plants generally have design <strong>and</strong> permitted capacitiesthat are equal. There are three plants within Broward County that do have surplus capacity, <strong>and</strong>those three plants will be analyzed with the additional capacity. Plant expansion plans are alsoanalyzed within each County <strong>and</strong> in the Region as a whole.110
1. The RegionThere are seventeen wastewater treatment facilities in the Region. This analysis does not includeinformation on the small systems that provide treatment to residents of Monroe County, onlythose large systems in Broward <strong>and</strong> Miami-Dade Counties. Of the seventeen, eight haveoperating rate between 50% <strong>and</strong> 75% of the permitted capacity, while an additional eight plantsare operating at over 75% of their permitted capacities. There is currently only one facility in theRegion that operating below the 50% threshold.The total permitted capacity in the Region is 645.16 mgd, with the annual average daily dem<strong>and</strong>being 484.32 mgd. The Region as a whole is operating at 75.1%. This puts the Region past the75% threshold by which backlog has been defined. When the region is analyzed using the 75%operating rate as the backlog point, there is a current backlog of 0.60 mgd of capacity in theRegion’s wastewater treatment plants. When 50% is used, there is a current backlog of 323.49mgd of capacity in the Region. Figure 5-6 below provides information on each county <strong>and</strong> on theRegion.Figure 5-6: Comparison of Regional <strong>Wastewater</strong> Capacity, Dem<strong>and</strong>, <strong>and</strong> Operating Rates70060078.00%77.00%50040030020076.00%75.00%74.00%73.00%1000Broward County Miami-Dade County Region72.00%71.00%Source: SFRPCPermitted Capacity Avg. Annual Daily Flow Operating RateThe three plants in Broward County that have the ability to re-rate would bring an additional4.46 mgd of capacity to the Region. This would bring the total capacity to 649.62 mgd. The fiveplants that have expansion plans in place would also increase the available capacity in theRegion. The expansion plans would add an additional 89.5 mgd of capacity, bringing the totalcapacity to 739.12 mgd. Please refer to Table 5-15 for a breakdown of each county <strong>and</strong> theRegional totals.Table 5-15: Planned WWTP Capacity Increases in the RegionCapacity Increase (mgd)(Expansion Plans)Current DesignCapacityFuture DesignCapacityBroward County 76.0 275.62 351.62Miami-Dade County 13.5 374.0 387.5Region 89.5 649.62 739.12Source: SFRPC, Broward County, Miami-Dade County111
2. Broward CountyThere are thirteen wastewater treatment plants in Broward County. The total permitted capacityin the County is 275.62 million gallons per day (mgd) <strong>and</strong> the average annual daily flow is 209.32mgd. The County as a whole is operating at 77.2% of its permitted capacity during averageannual daily flow. Using 75% as the backlog point, there is a current backlog of 7.94 mgd ofcapacity during average annual daily dem<strong>and</strong>. Using 50% as the backlog st<strong>and</strong>ard, there is acurrent backlog of 147.49 mgd of capacity in Broward County.Six of the thirteen plants have operation rates between 50% <strong>and</strong> 75% of their permitted capacity,<strong>and</strong> another six plants have operating rates greater than 75% of their permitted capacity. Oneplant, the <strong>South</strong> Broward (<strong>South</strong>west) WWTP, has not yet reached the 50% threshold, but isapproaching that mark. Figure 5-7 illustrates this information. Table 5-16 lists the wastewatertreatment plants in Broward County with their operating rates.Figure 5-7: Operating Rates of Broward County <strong>Wastewater</strong> Treatment PlantsBroward County <strong>Wastewater</strong> TreatmentPlants166# of Plants operating below 50%# of Plants operating between 50% & 75%# of Plants operating over 75%Source: SFRPCTable 5-16: Broward County WWTP Average Annual Dailey Dem<strong>and</strong> Operating RatesPermit # Plant Name PermittedCapacityAvg. AnnualDaily FlowOperatingRateFL0031771 Broward County N. Regional 80.0 69.83 87.3%WWTFFL0041289-001 City of Margate East & West 10.1 6.42 63.6%FL00169617-001 WWTPFLA013575 City of Pembroke Pines WWTF 9.5 6.5503 69.0%FL0040398 Cooper City Utilities 3.44 2.7 78.5%FLA041301 Coral Springs Improvement District 8.33 5.01 60.1%FLA013583 Ferncrest Utilities 0.6 0.48 80.0%FLA041378 G.T. Lohmeyer Plant (Ft.55.7 34.493 61.9%Lauderdale)FL0026255 Hollywood <strong>South</strong>ern Regional 48.75 42.5 87.2%WWTPFLA040401 Plantation Regional WWTP 18.9 17.5 92.6%112
Table 5-16: Broward County WWTP Average Annual Dailey Dem<strong>and</strong> Operating Rates (Cont.)Permit # Plant Name PermittedCapacityAvg. AnnualDaily FlowOperatingRateFLA013580 S. Broward (<strong>South</strong>west) WWTF 0.99 0.47 47.5%FLA042641 Sawgrass Regional WWTF #3 20.0 11.97 59.9%(Sunrise #3)FLA041947 Springtree Regional WWTF 10.0 8.2 82.0%(Sunrise #1)FL0040541 Town of Davie WWTP 4.85 3.2 66.0%Broward County 271.16 209.32 77.2%Source: SFRPC, Broward County, City of Margate, City of Pembroke Pines, City of Cooper City, Coral SpringsImprovement District, Ferncrest Utilities, City of Fort Lauderdale, City of Hollywood, City of Plantation, City of SunriseThere are three plants in Broward County that have surplus capacity, <strong>and</strong> thus the ability to rerate.The re-rating of the three plants would equal 4.46 mgd. This would bring the totalpermitted capacity in Broward County up to 275.62 mgd, <strong>and</strong> bring the operating rate down to75.9%. Table 5-17 shows the plants that are eligible for re-rating.Table 5-17: WWTP’s in Broward County with Permitted Capacity Less Than Design CapacityPlant NameDesignCapacityPermittedCapacitySurplusCapacityCurrentOperatingRateOperatingRate with reratingBroward County N. 84.0 80.0 4.0 87.3% 83.1%Regional WWTFCooper City Utilities 3.75 3.44 0.31 78.5% 72.0%Town of Davie WWTP 5.0 4.85 0.15 66.0% 64.0%Source: SFRPC, Broward County, City of Cooper City, Town of DavieThere are also three facilities that have expansion plans in place to increase their capacity. Theexpansions would increase the wastewater capacity in the County by 76.0 mgd. This wouldbring the total capacity in the County to 351.62 mgd. Please see Table 5-18 for information oneach of these plants.Table 5-18: WWTP’s in Broward County with Planned Capacity IncreasesPlant NameCapacityIncrease (mgd)Current DesignCapacityFuture DesignCapacityBroward County N. Regional WWTF 20.0 84.0 104.0Hollywood <strong>South</strong>ern Regional WWTP 54.0 48.75 102.75Town of Davie WWTP 2.0 5.0 7.0Source: SFRPC, Broward County, City of Hollywood, Town of Davie113
3. Miami-Dade CountyFour wastewater treatment plants are located in Miami-Dade County, with three of the plantsoperated by Miami-Dade County <strong>Water</strong> <strong>and</strong> Sewer Department (WASD). The total permittedcapacity of the plants is 374.0 mgd, with an annual average daily flow of 275.0 mgd. The overalloperating rate of the County is 73.5%. There is currently excess capacity in the amount of 7.3mgd, in the County when using the 75% operating rate at the backlog point. When the 50%operating rate is used, there is a current backlog of 176.00 mgd of capacity in Miami-DadeCounty.Two of the four plants have current operating rates between 50% <strong>and</strong> 75%, with the other twoplants operating above 75%. Each plant <strong>and</strong> their operating rates are shown in Table 5-19.Table 5-19: Miami-Dade County WWTP Average Annual Daily Dem<strong>and</strong> Operating RatesPermit # Plant Name PermittedCapacityAvg. AnnualDaily FlowOperatingRateDO13241707 Central District WWTP (WASD 143.0 101.01 70.6%FLA03609 City of Homestead WWTF 6.0 4.73 78.8%FL0032182-001 N. District WWTP (WASD) 112.5 84.99 75.5%FLA042137-002 <strong>South</strong> District WWTP (WADS) 112.5 84.27 74.9%Miami-Dade County 374.0 275.0 73.5%Source: SFRPC, Miami-Dade County, City of HomesteadThere are no plants in Miami-Dade County that have the ability to re-rate. Two of the four plantswithin Miami-Dade County have expansion plans in place to increase their capacity. The total ofthe expansions is 13.5 mgd. This would bring the total capacity in the County to 387.5 mgd. SeeTable 5-20 for information on each of these plants.Table 5-20: Miami-Dade County WWTPs with Planned Capacity IncreasesPlant NameCapacityIncrease (mgd)Current DesignCapacityFuture DesignCapacityCity of Homestead WWTF 6.0 6.0 12.0N. District WWTP (WASD) 7.5 112.5 120.0Source: SFRPC, Miami-Dade County, City of Homestead114
4. Monroe CountyThere is no countywide wastewater treatment system in place within Monroe County. There areseveral small package plants <strong>and</strong> on-site treatment systems. These systems were not analyzeddue to their small size <strong>and</strong> site-specific use. Please refer to page 26 <strong>and</strong> Appendix C foradditional information on the wastewater systems in Monroe County.115
C. STORMWATERTwenty-six surface water management basins exist in Broward <strong>and</strong> Miami-Dade Counties. Todetermine the existing backlog or service deficiency for each of the basins, the runoff for threerain events was calculated <strong>and</strong> compared to the capacity of the last drainage structure in theprimary canal before the canal empties into the either the Biscayne Bay or the ocean. The endresult was the time, in days, it would take for that water to drain through the drainage structure.The first step in calculating the runoff was to determine the amount of impervious surface in eachbasin. The amount of l<strong>and</strong> area (in acres) in each l<strong>and</strong> use category was calculated utilizingexisting l<strong>and</strong> use coverage provided by the <strong>South</strong> <strong>Florida</strong> <strong>Water</strong> Management District in aGeographic Information System. Using the Miami-Dade County Department of EnvironmentalResource Management’s (DERM) XP-SWMM (Surface <strong>Water</strong> Management Model), a value wasassigned to each l<strong>and</strong> use category in the basin in order to determine the amount of impervioussurface. This was then converted into the percent of each basin that was impervious. For acomplete list of l<strong>and</strong> use categories <strong>and</strong> the amount of impervious surface in each basin, pleasesee Appendix D.The next step taken was to determine which storm events to use when calculating the runoff.Three were chosen, the worst-case scenario, a 3-day, 100-year event, the best-case scenario, a 1-day, 3-year event; the third event was in between those two, a 3-day, 1-year event. Based on theDistrict’s rainfall maps, an average amount of rainfall per each event was chosen for each basin.See Appendix D for further information on the rainfall amounts per storm event.The final piece of information needed before the calculations could be run, was the depth towater table information for each basin. The total amount of water, which can be stored in acertain soil profile, is expressed as a function of the depth to the water table. It was assumed thata basin with predominately s<strong>and</strong>y soil on higher ground has a wet season depth to the watertable of 4 feet; that basins predominated by low, mucky soil had a depth to the water table of 2feet; <strong>and</strong> basins with a mixture of the two had an average wet season depth to the water table of 3feet. Based on the table below, conversions were made.Depth toCumulative<strong>Water</strong> Table <strong>Water</strong> Storage 13(Feet)(Inches)1 0.602 2.503 6.604 10.90The following information on calculating runoff is from the District’s Surface <strong>Water</strong> ManagementDesign Aids manual, pg. D-1 to D-2. A method for estimation of runoff from rainfall informationhas been developed by the United States Department of Agriculture’s Soil Conservation Service(SCS).13 Source: <strong>South</strong> <strong>Florida</strong> <strong>Water</strong> Management District, Surface <strong>Water</strong> Management Design Aid, Pg. E-1116
The runoff equation used by the SCS is presented in the U.S. Soil Conservation Service’s NationalEngineering H<strong>and</strong>book, Section 4, “Hydrology.” The relationship between accumulated rainfall<strong>and</strong> accumulated runoff was derived from experimental data for numerous soils, vegetativecover, <strong>and</strong> treatment measures.The equation is:Q = (P - Ia) 2(P – Ia) + SwhereQ = Accumulated direct runoff (inches)P = Accumulated rainfall (inches)Ia = Initial abstraction including surface storage, interception, <strong>and</strong> infiltration prior torunoff (inches)S = Potential maximum retention (inches)For the purpose of developing project-specific runoff generation relationships, District staffapplied this formula using a weighted soil moisture storage value for the maximum retentionparameter, S. For example, if a project had the ability to store 6.0 inches of rainfall in the soilprofile <strong>and</strong> it was 50% impervious, then for purposes of calculating the cumulative runoffvolumes, use an S value of:6.0 inches x (1 – 0.50) = 3.0 inchesThe relationship between Ia <strong>and</strong> S was developed from experimental watershed data. Theempirical relationship used in the SCS runoff equation is:Ia = 0.2SThe above equations were run for each of the 26 basins in Broward <strong>and</strong> Miami-Dade Counties.Please see Appendix D for calculations.Once the equations were utilized to determine runoff for each basin, Q was first converted intoacre feet, then into cubic feet. This number was then divided by the design Q for the drainagestructure (expressed as a capacity of cubic feet per second) <strong>and</strong> finally divided by the number ofseconds in a day (86,400) to determine the number of days it would take for water from aparticular storm event to drain through the drainage structure. The sections below show, intables, the time it would take for runoff from each of the chosen rain events to drain through thedrainage structure.1. Broward CountyThe 14 canals <strong>and</strong> their corresponding basins in Broward County are: C-10, C-11 East, C-11 West,C-12, C-13 East, C-13 West, C-14 East, C-14 West, Coral Reef, Hillsboro Canal, North Fork NewRiver, North New River Canal East, North New River Canal West, <strong>and</strong> Pompano Canal. Two ofthe canal basins, C-10 <strong>and</strong> Coral Reef, do not have control structures. Because of this, there wasno basin design capacity with which to compare the calculations. For those canal basins that aredivided into East/West basins, for the purpose of the calculations, they were added together to117
get one final calculation, with the exception of the C-11, which has been designed to backpumpinto <strong>Water</strong> Conservation Area 3B to the west.C-11 East BasinThe S-13 stage divide structure is the final structure that the water must pass through in the C-11east basin before it drains. The design discharge, in cubic feet per second (cfs), for the S-13 is 540cfs. Table 5-21 below shows the time it takes for the runoff from each storm event to drainthrough the S-13 <strong>and</strong> into the <strong>South</strong> Fork of the New River <strong>and</strong> the Dania Cut-off Canal.Table 5-21: Time It Takes For The C-11 East Basin To DrainStorm EventTime it takes, in days, to drain1-day, 3-year 4.693-day, 10-year 9.493-day, 100 year 18.28Source: SFRPC, SFWMDC-11 West BasinThe S-9 stage divide structure is the final structure that the water must pass through in the C-11west basin before it drains. The design discharge for the S-9 is 2880 cfs. Table 5-22 below showsthe time it takes for the runoff from each storm event to drain through the S-9 <strong>and</strong> into <strong>Water</strong>Conservation Area 3B.Table 5-22: Time It Takes For The C-11 West Basin To DrainStorm EventTime it takes, in days, to drain1-day, 3-year 2.493-day, 10-year 5.713-day, 100 year 9.63Source: SFRPC, SFWMDC-12 BasinThe S-33 stage divide structure is the final structure that the water must pass through in the C-12basin before it drains. The design discharge for the S-33 is 920 cfs. Table 5-23 below shows thetime it takes for the runoff from each storm event to drain through the S-33 <strong>and</strong> into the NorthFork of the New River.Table 5-23: Time It Takes For The C-12 Basin To DrainStorm EventTime it takes, in days, to drain1-day, 3-year 1.353-day, 10-year 3.343-day, 100 year 6.36Source: SFRPC, SFWMD118
C-13 East <strong>and</strong> West BasinsThe S-36 stage divide structure is the final structure that the water must pass through in the C-13basin before it drains. The design discharge for the S-36 is 1560 cfs. Table 5-24 below shows thetime it takes for the runoff from each storm event to drain through the S-36 <strong>and</strong> into the MiddleRiver System.Table 5-24: Time It Takes For The C-13 East <strong>and</strong> West Basins To DrainStorm EventTime it takes, in days, to drain1-day, 3-year 2.223-day, 10-year 4.793-day, 100 year 8.12Source: SFRPC, SFWMDC-14 East <strong>and</strong> West BasinsThe S-37A stage divide structure is the final structure that the water must pass through in the C-14 basins before it drains. The design discharge for the S-37A is 3890 cfs. Table 5-25 below showsthe time it takes for the runoff from each storm event to drain through the S-37A <strong>and</strong> intoCypress Creek.Table 5-25: Time It Takes For The C-14 East <strong>and</strong> West Basins To DrainStorm EventTime it takes, in days, to drain1-day, 3-year 1.773-day, 10-year 3.973-day, 100 year 6.81Source: SFRPC, SFWMDHillsboro Canal BasinThe Deerfield Lock (G-56) stage divide structure is the final structure that the water must passthrough in the Hillsboro basin before it drains. The design discharge for the G-56 is 1600 cfs.Table 5-26 below shows the time it takes for the runoff from each storm event to drain throughthe G-56 <strong>and</strong> into the Intracoastal <strong>Water</strong>way.Table 5-26: Time It Takes For The Hillsboro Canal Basin To DrainStorm EventTime it takes, in days, to drain1-day, 3-year 5.563-day, 10-year 16.353-day, 100 year 30.91Source: SFRPC, SFWMD119
North New River Canal East <strong>and</strong> West BasinsThe Sewell Lock (G-54) stage divide structure is the final structure that the water must passthrough in the North New River basin before it drains. The design discharge for the G-54 is 1300cfs. Table 5-27 below shows the time it takes for the runoff from each storm event to drainthrough the G-54 <strong>and</strong> into the <strong>South</strong> Fork of the New River.Table 5-27: Time It Takes For The North New River East And West Basins To DrainStorm EventTime it takes, in days, to drain1-day, 3-year 3.193-day, 10-year 5.813-day, 100 year 10.24Source: SFRPC, SFWMDPompano Canal BasinThe G-57 stage divide structure is the final structure that the water must pass through in thePompano Canal basin before it drains. The design discharge for the G-57 is 375 cfs. Table 5-28below shows the time it takes for the runoff from each storm event to drain through the G-57 <strong>and</strong>into the Intracoastal <strong>Water</strong>way.Table 5-28: Time It Takes For The Pompano Canal Basin To DrainStorm EventTime it takes, in days, to drain1-day, 3-year 1.523-day, 10-year 4.773-day, 100 year 8.25Source: SFRPC, SFWMD2. Miami-Dade CountyThe 17 canals <strong>and</strong> their corresponding basins in Miami-Dade County are: C-1, C-100, C-102, C-103, C-111, C-2, C-4, C-5, C-6, C-7, C-8, C-9 East, C-9 West, Coral Gables, <strong>Florida</strong> City,Homestead, <strong>and</strong> Model L<strong>and</strong>. The C-9 basin, divided into East/West basins, for the purpose ofthe calculations were added together to get one final calculation.C-1 Canal BasinThe S-21 stage divide structure is the final structure that the water must pass through in the C-1canal basin before it drains. The design discharge for the S-21 is 2560 cfs. Table 5-29 belowshows the time it takes for the runoff from each storm event to drain through the S-21 <strong>and</strong> intoBiscayne Bay.Table 5-29: Time It Takes For The C-1 Basin To DrainStorm EventTime it takes, in days, to drain1-day, 3-year 1.253-day, 10-year 3.803-day, 100 year 7.21Source: SFRPC, SFWMD120
C-100 Canal BasinThe S-123 stage divide structure is the final structure that the water must pass through in the C-100 canal basin before it drains. The design discharge for the S-123 is 2300 cfs. Table 5-30 belowshows the time it takes for the runoff from each storm event to drain through the S-123 <strong>and</strong> intoBiscayne Bay.Table 5-30: Time It Takes For The C-100 Basin To DrainStorm EventTime it takes, in days, to drain1-day, 3-year 0.983-day, 10-year 3.393-day, 100 year 5.59Source: SFRPC, SFWMDC-102 Canal BasinThe S-21A stage divide structure is the final structure that the water must pass through in the C-102 canal basin before it drains. The design discharge for the S-21A is 1330 cfs. Table 5-31 belowshows the time it takes for the runoff from each storm event to drain through the S-21A <strong>and</strong> intoBiscayne Bay.Table 5-31: Time It Takes For The C-102 Basin To DrainStorm EventTime it takes, in days, to drain1-day, 3-year 1.063-day, 10-year 3.633-day, 100 year 7.21Source: SFRPC, SFWMDC-103 Canal BasinThe S-20F stage divide structure is the final structure that the water must pass through in the C-103 canal basin before it drains. The design discharge for the S-20F is 2900 cfs. Table 5-32 belowshows the time it takes for the runoff from each storm event to drain through the S-20F <strong>and</strong> intoBiscayne Bay.Table 5-32: Time It Takes For The C-103 Basin To DrainStorm EventTime it takes, in days, to drain1-day, 3-year 0.503-day, 10-year 2.553-day, 100 year 4.54Source: SFRPC, SFWMD121
C-111 Canal BasinThe S-332 <strong>and</strong> S-197 stage divide structures are the final structures that the water must passthrough in the C-111 canal basin before it drains. The design discharge for the S-332 is 165 cfs<strong>and</strong> the design discharge for the S-197 is 550 cfs, for a total of 715 cfs.. Table 5-33 below showsthe time it takes for the runoff from each storm event to drain through the S-332 <strong>and</strong> S-197 <strong>and</strong>into Taylor Slough <strong>and</strong> Manatee Bay respectively.Table 5-33: Time It Takes For The C-111 Basin To DrainStorm EventTime it takes, in days, to drain1-day, 3-year 11.733-day, 10-year 42.103-day, 100 year 68.80Source: SFRPC, SFWMDC-2 Canal BasinThe S-22 stage divide structure is the final structure that the water must pass through in the C-2canal basin before it drains. The design discharge for the S-22 is 1915 cfs. Table 5-34 belowshows the time it takes for the runoff from each storm event to drain through the S-22 <strong>and</strong> intoBiscayne Bay.Table 5-34: Time It Takes For The C-2 Basin To DrainStorm EventTime it takes, in days, to drain1-day, 3-year 1.963-day, 10-year 6.173-day, 100 year 11.42Source: SFRPC, SFWMDC-4 Canal BasinThe S-25 <strong>and</strong> S-25B stage divide structures are the final structures that the water must passthrough in the C-4 canal basin before it drains. Because of frequent flood episodes, a stormwaterstorage area with a backpumping facility has been installed in the western part of this basin toincrease its capacity. The design discharge for the S-25 is 260 cfs <strong>and</strong> the design discharge for theS-25B is 2000 cfs, for a total of 2260 cfs. Table 5-35 below shows the time it takes for the runofffrom each storm event to drain through S-25 <strong>and</strong> S-25B <strong>and</strong> into the Comfort Canal <strong>and</strong> MiamiRiver respectively.Table 5-35: Time It Takes For The C-4 Basin To DrainStorm EventTime it takes, in days, to drain1-day, 3-year 3.263-day, 10-year 8.713-day, 100 year 15.21Source: SFRPC, SFWMD122
C-5 Canal BasinThe S-25 stage divide structure is the final structure that the water must pass through in the C-5canal basin before it drains. The design discharge for the S-25 is 260 cfs. Table 5-36 below showsthe time it takes for the runoff from each storm event to drain through S-25 <strong>and</strong> into the MiamiRiver.Table 5-36: Time It Takes For The C-5 Basin To DrainStorm EventTime it takes, in days, to drain1-day, 3-year 0.523-day, 10-year 1.753-day, 100 year 3.32Source: SFRPC, SFWMDC-6 Canal BasinThe S-26 stage divide structure is the final structure that the water must pass through in the C-6canal basin before it drains. The design discharge for the S-26 is 3470 cfs. Table 5-37 belowshows the time it takes for the runoff from each storm event to drain through S-26 <strong>and</strong> into theMiami River.Table 5-37: Time It Takes For The C-6 Basin To DrainStorm EventTime it takes, in days, to drain1-day, 3-year 1.833-day, 10-year 3.773-day, 100 year 7.33Source: SFRPC, SFWMDC-7 Canal BasinThe S-27 stage divide structure is the final structure that the water must pass through in the C-7canal basin before it drains. The design discharge for the S-27 is 2800 cfs. Table 5-38 belowshows the time it takes for the runoff from each storm event to drain through S-27 <strong>and</strong> into theLittle River <strong>and</strong> Biscayne Bay.Table 5-38: Time It Takes For The C-7 Basin To DrainStorm EventTime it takes, in days, to drain1-day, 3-year 0.953-day, 10-year 2.033-day, 100 year 4.07Source: SFRPC, SFWMD123
C-8 Canal BasinThe S-28 stage divide structure is the final structure that the water must pass through in the C-8canal basin before it drains. The design discharge for the S-28 is 3220 cfs. Table 5-39 belowshows the time it takes for the runoff from each storm event to drain through S-28 <strong>and</strong> intoBiscayne Bay.Table 5-39: Time It Takes For The C-8 Basin To DrainStorm EventTime it takes, in days, to drain1-day, 3-year 0.663-day, 10-year 1.453-day, 100 year 2.95Source: SFRPC, SFWMDC-9 East <strong>and</strong> West BasinsThe S-29 stage divide structure is the final structure that the water must pass through in the C-9east <strong>and</strong> west canal basins before it drains. The design discharge for the S-29 is 4780 cfs. Table 5-40 below shows the time it takes for the runoff from each storm event to drain through S-29 <strong>and</strong>into the Maule Lake/Oleta River System.Table 5-40: Time It Takes For The C-9 East And West Basin To DrainStorm EventTime it takes, in days, to drain1-day, 3-year 2.183-day, 10-year 4.293-day, 100 year 7.89Source: SFRPC, SFWMDCoral Gables Canal BasinThe G-97 stage divide structure is the final structure that the water must pass through in theCoral Gables canal basin before it drains. The design discharge for the G-97 is 640 cfs. Table 5-41below shows the time it takes for the runoff from each storm event to drain through G-97 <strong>and</strong>into Biscayne Bay.Table 5-41: Time It Takes For The Coral Gables Basin To DrainStorm EventTime it takes, in days, to drain1-day, 3-year 1.513-day, 10-year 5.073-day, 100 year 8.93Source: SFRPC, SFWMD124
<strong>Florida</strong> City Canal BasinThe S-20F stage divide structure is the final structure that the water must pass through in the<strong>Florida</strong> City canal basin before it drains. The design discharge for the S-20F is 2900 cfs. Table 5-42 below shows the time it takes for the runoff from each storm event to drain through S-20F <strong>and</strong>into Biscayne Bay.Table 5-42: Time It Takes For The <strong>Florida</strong> City Basin To DrainStorm EventTime it takes, in days, to drain1-day, 3-year 0.373-day, 10-year 1.323-day, 100 year 1.97Source: SFRPC, SFWMDHomestead Canal BasinThe S-20G stage divide structure is the final structure that the water must pass through in theHomestead canal basin before it drains. The design discharge for the S-20G is 900 cfs. Table 5-43below shows the time it takes for the runoff from each storm event to drain through S-20G <strong>and</strong>into Biscayne Bay.Table 5-43: Time It Takes For The Homestead Basin To DrainStorm EventTime it takes, in days, to drain1-day, 3-year 0.153-day, 10-year 0.763-day, 100 year 1.22Source: SFRPC, SFWMDModel L<strong>and</strong> Canal BasinThe S-20 stage divide structure is the final structure that the water must pass through in theModel L<strong>and</strong> canal basin before it drains. The design discharge for the S-20 is 450 cfs. Table 5-44below shows the time it takes for the runoff from each storm event to drain through S-20 <strong>and</strong> intoBiscayne Bay.Table 5-44: Time It Takes For The Modal L<strong>and</strong> Basin To DrainStorm EventTime it takes, in days, to drain1-day, 3-year 3.483-day, 10-year 12.733-day, 100 year 19.26Source: SFRPC, SFWMD125
VI.TASK 6 - DEMAND ANALYSISTask 6 utilizes the data gathered in previous tasks to identify the future dem<strong>and</strong> for water <strong>and</strong>wastewater services in the Region. The data collected was extrapolated out to 2030 in 5-yearincrements, starting with 2005. In order to best provide local governments, the District, <strong>and</strong> theRegional Planning Council, with long range planning data, a per capita dem<strong>and</strong> approach wasused to determine future dem<strong>and</strong>. Three different population projections were used in allcalculations, USACE, CERP Update, 2003, University of <strong>Florida</strong> BEBR, 02/2004, <strong>and</strong> projectionsprovided by each County.Based on conversations with SFWMD staff, stormwater dem<strong>and</strong> analysis was not performed,because dem<strong>and</strong> for stormwater management is a condition of each individual project that isundertaken.A. MethodologyIn order to determine the dem<strong>and</strong> for water <strong>and</strong> wastewater in the future, the data collected wasconverted into a per capita number for both maximum day dem<strong>and</strong> <strong>and</strong> average annual dailydem<strong>and</strong>. This was done by dividing the total maximum day dem<strong>and</strong> <strong>and</strong> average annual dailydem<strong>and</strong> for each county by the 2004 population for that county. The same was done for theRegion as a whole. The result is a series of per capita numbers that allows the future dem<strong>and</strong> tobe calculated based on the future population projections.When extrapolating the future water dem<strong>and</strong> for the County, two scenarios are used, the dem<strong>and</strong>using the per capita maximum day dem<strong>and</strong> <strong>and</strong> the dem<strong>and</strong> given the per capita average annualdaily dem<strong>and</strong>.126
B. WATER DEMAND1. The RegionThe Three County Region is expecting tremendous growth in the next 25 years. Based onprojections, the population could grow to as many as 5,796,800 people, an increase of 1,612,615over the current population. Table 6-1 shows the three population projections for the Region.Table 6-1: Regional Population Projections, 2005-2030Population Projection 2005 2010 2015 2020 2025 2030USACE, CERP (2003) 4,257,300 4,568,100 4,881,900 5,203,200 5,513,800 5,796,800UF BEBR (02/04) 4,261,500 4,585,300 4,900,400 5,213,200 5,511,700 5,784,600County Totals 4,280,338 4,596,092 4,910,809 5,131,471 5,438,428 5,736,079Source: CERP, BEBR, Broward County, Miami-Dade County, Monroe CountyThe current dem<strong>and</strong> of water in the Region is 752.579 mgd at maximum day dem<strong>and</strong>, <strong>and</strong>642.526 mgd at average annual daily dem<strong>and</strong>. Using this data <strong>and</strong> the 2004 population of theRegion (4,184,185), the per capita maximum day dem<strong>and</strong> is 180.49 gallons per day, <strong>and</strong> the percapita average annual daily dem<strong>and</strong> is 152.93 gallons per day.Using the calculated per capita numbers for water dem<strong>and</strong>, by 2030, the total regional dem<strong>and</strong>for water could be as high as 1044.07 mgd, an increase of as much as 38.7% over current dem<strong>and</strong>.This could pose serious problems for the Region. At this time, there are capacity increases slatedfor facilities across the Region that total 158.26 mgd of additional capacity. When this additionalcapacity is added to the current design capacity, there would be a total capacity in the Region of1171.406 mgd. With no further additions beyond what is known, the Region would be operatingat 89.3% of its capacity in 2030. Figure 6-1 compares the known capacity in the Region out to2030 with the capacity needed to operate at 75% of permitted capacity at maximum-day dem<strong>and</strong><strong>and</strong> the calculated dem<strong>and</strong>.Figure 6-1: Projected Regional <strong>Water</strong> Dem<strong>and</strong> And Capacity, 2005-20301600140012001000Regional Projected <strong>Water</strong> Dem<strong>and</strong> <strong>and</strong> CapacityMGD80060040020002005 2010 2015 2020 2025 2030Capacity Capacity need to operate at 75% Dem<strong>and</strong>Source: SFRPC127
By 2010 an as many as 411,907 additional residents could be living in the Region. This increase inpopulation in the next 5 years would result in an increase in water dem<strong>and</strong> of as much as 74.35mgd at maximum day dem<strong>and</strong>, <strong>and</strong> 62.99 mgd at average annual daily dem<strong>and</strong>. This couldbring the total maximum day dem<strong>and</strong> to as much as 829.55 mgd, <strong>and</strong> the average annual dailydem<strong>and</strong> to as much as 751.02 mgd. This is an increase in dem<strong>and</strong> of as much as 9.9% overcurrent dem<strong>and</strong>. Please refer to figure 6-2 for the range of dem<strong>and</strong>s given for the threepopulation projections that are being used in this analysis.Figure 6-2: Projected Regional <strong>Water</strong> Dem<strong>and</strong>, 2010Region-Wide Projected <strong>Water</strong> Dem<strong>and</strong> - 20101200.001050.00Average Daily Dem<strong>and</strong>Maximum Day Dem<strong>and</strong>900.00824.50827.43829.55MGD750.00600.00698.61 701.09702.89450.00300.00150.000.00CERP BEBR CountySource: SFRPC, CERP, BEBR, Broward County, Miami-Dade County, Monroe CountyAccording to the information received from the water treatment facilities in Task 4, an additional88.0 mgd of capacity will be added to the Region by 2010. This would bring the total designcapacity to 1085.146 mgd, with operating rates of 75.3% during maximum day dem<strong>and</strong>, <strong>and</strong>63.8% at average annual daily dem<strong>and</strong>. The maximum day rate would put the Region right atthe point of concern in 2010 during maximum day dem<strong>and</strong>.In order for the Region to operate at 75% in 2010, additional capacity, beyond what is currentlyplanned, would have to be added. As much as 4.92 mgd of additional capacity would have to beadded, putting the total capacity in the Region at 1106.07 mgd.By 2020, the population of the Region could be as high as 5,213,200, an increase of more than onemillion people from current population, <strong>and</strong> an increase of as many as 635,100 people from 2010.These additional people will require as much as an additional 114.63 mgd of water at maximumday dem<strong>and</strong>, <strong>and</strong> 97.13 mgd at average annual daily dem<strong>and</strong>. This is an increase in dem<strong>and</strong> ofas much as 24.2% over current dem<strong>and</strong>. The additional water dem<strong>and</strong> would bring the totalmaximum day dem<strong>and</strong> to as much as 940.94 mgd, <strong>and</strong> the total average annual daily dem<strong>and</strong> toas high as 797.27 mgd. Figure 6-3 shows the range of dem<strong>and</strong>s projected for 2020.128
Figure 6-3: Projected Regional <strong>Water</strong> Dem<strong>and</strong>, 2020Region-Wide Projected <strong>Water</strong> Dem<strong>and</strong> - 2020MGD1200.001050.00900.00750.00600.00450.00Average Daily Dem<strong>and</strong>Maximum Day Dem<strong>and</strong>939.13 940.94 926.19795.74797.27784.77300.00150.000.00CERP BEBR CountySource: SFRPC, CERP, BEBR, Broward County, Miami-Dade County, Monroe CountyAccording to the information received from the water treatment facilities in Task 4, an additional60.26 mgd of capacity will be added to the Region between 2010 <strong>and</strong> 2020. This would bring thetotal design capacity to 1161.406 mgd, with operating rates of 81.0% during maximum daydem<strong>and</strong>, <strong>and</strong> 68.6% at average annual daily dem<strong>and</strong>. The maximum day rate would put theRegion over the point of concern (operating at more than 75% at maximum day dem<strong>and</strong>) in 2020during maximum day dem<strong>and</strong>.In order for the Region to be operating at 75% of the total capacity at maximum day dem<strong>and</strong> in2020, an additional 88.26 mgd of capacity would need to be added to the facilities. Thisadditional capacity would put the total capacity in the Region at 1254.59 mgd.Between 2020 <strong>and</strong> 2030 the Region is expected to grow by as many as 604,608 people, giving theRegion a total population of as many as 5,796,800. The additional population will generate asmuch as 109.13 mgd of water at maximum day dem<strong>and</strong>, <strong>and</strong> 92.46 mgd at average annual dailydem<strong>and</strong>. As mentioned before, this is an increase of as much 38.7% over current dem<strong>and</strong>. Theadditional dem<strong>and</strong> could bring the total maximum day dem<strong>and</strong> to as high as 1046.27 mgd atmaximum day dem<strong>and</strong>, <strong>and</strong> 886.52 mgd at average annual daily dem<strong>and</strong>. See Figure 6-4 for therange of dem<strong>and</strong>s projected for 2030.129
Figure 6-4: Projected Regional <strong>Water</strong> Dem<strong>and</strong>, 2030Region-Wide Projected <strong>Water</strong> Dem<strong>and</strong> - 2030Average Daily Dem<strong>and</strong>1200.00Maximum Day Dem<strong>and</strong>1050.001046.271044.071035.31900.00886.52 884.65 877.23MGD750.00600.00450.00300.00150.000.00CERP BEBR CountySource: SFRPC, CERP, BEBR, Broward County, Miami-Dade County, Monroe CountyThe data indicates that an additional 10.0 mgd of capacity is planned for the years between 2020<strong>and</strong> 2030. This would bring the total capacity in the Region in 2030 to 1171.406 mgd. The Regionwould be operating at as much as 89.3% of total capacity during maximum day dem<strong>and</strong>, <strong>and</strong> atas much as 75.7% during average annual daily dem<strong>and</strong>. The operating rates at both maximumday dem<strong>and</strong> <strong>and</strong> average annual daily dem<strong>and</strong> would be over the 75% threshold.In order for the Region to operate at 75% of total capacity during maximum day dem<strong>and</strong> in 2030,an additional 130.44 mgd capacity would need to be added. This would bring the total capacityneeded in 2030 to 1395.03 mgd.In the next 25 years, we are looking at the need for 292.39 mgd of additional capacity in theRegion in order to operate at 75% of total capacity during maximum day dem<strong>and</strong>. This willinvolve cooperation throughout the Region, in terms of both funding <strong>and</strong> planning. In the nexttwo sections of this report, Tasks 7 <strong>and</strong> 8, the cost of this undertaking will be discussed as well asnew funding approaches.130
2. Broward CountyIt is anticipated that by 2030 the population of Broward County will grow to more than 2.5million people. This is an increase of more than 800,000 people over the next 25 years. Thedem<strong>and</strong> that the new residents will create will be extremely taxing on the already backloggedsystem. Table 6-2 shows the three population projections for the County in five-year increments.The three projections give us high, medium, <strong>and</strong> low estimates that will be used to determinedem<strong>and</strong>.Table 6-2: Broward County Population Projections, 2005-2030Population Projection 2005 2010 2015 2020 2025 2030Broward County (06/02) 1,789,916 1,954,572 2,117,038 2,273,287 2,418,641 2,548,303USACE, CERP (2003) 1,772,800 1,931,600 2,092,300 2,257,100 2,416,900 2,562,900UF BEBR (02/04) 1,766,500 1,928,800 2,087,500 2,244,600 2,394,600 2,531,800Source: SFRPC, CERP, BEBR, Broward County,In the next twenty-five years, the dem<strong>and</strong> for water in Broward County could increase by asmuch as 48.7%. This would put the total dem<strong>and</strong> at 474.47 mgd during maximum day dem<strong>and</strong>,<strong>and</strong> 359.92 mgd during average annual daily flow. With no additional capacity increases beyondwhat is currently known, the County could be operating at as much as 90.0% of capacity duringmaximum day dem<strong>and</strong> by 2030. Figure 6-5 shows the known capacity in the County out to 2030,as well as what capacity it will take to operate at 75% of permitted capacity at maximum-daydem<strong>and</strong> <strong>and</strong> the calculated dem<strong>and</strong>.Figure 6-5: Broward County Projected <strong>Water</strong> Dem<strong>and</strong> And Capacity, 2005-2030700Broward County <strong>Water</strong> Dem<strong>and</strong> <strong>and</strong> Capacity600500MGD40030020010002005 2010 2015 2020 2025 2030Capacity Capacity need to operate at 75% Dem<strong>and</strong>Source: SFRPC131
The current dem<strong>and</strong> for water in Broward County is 319.005 million gallons per day (mgd)during maximum day dem<strong>and</strong>, <strong>and</strong> 241.984 mgd during average annual daily dem<strong>and</strong> 14 .Twenty-eight (28) water treatment plants located throughout the County are currently meetingthis dem<strong>and</strong> with a total permitted capacity of 415.944 mgd. Using the methodology establishedabove, the per capita maximum day flow for the County is 185.13 gallons per day <strong>and</strong> the percapita annual average daily flow is 140.43 gallons per day 15 .The above dem<strong>and</strong> analysis is the end result of twenty-five years of growth. When takenincrementally, the growth in population, <strong>and</strong> therefore the dem<strong>and</strong> for water, is less severe, butstill problematic.By 2010 the population of Broward County is projected to be in the range of 1,928,800 to1,954,572 people. This is an increase of more than 200,000 people from 2004. This increase inpopulation would result in an increase of water use <strong>and</strong> dem<strong>and</strong>. Using per capita maximumday dem<strong>and</strong>, the total dem<strong>and</strong> in Broward County in 2010 could be as high as 361.85 mgd, anadditional 42.85 mgd over current dem<strong>and</strong>. When per capita average annual daily dem<strong>and</strong> isused, the total dem<strong>and</strong> could be as high as 274.49 mgd, an increase of as much as 32.5 mgd. Theadditional dem<strong>and</strong> represents an increase of as much as 13.4% over current dem<strong>and</strong>. Figure 6-6shows the range of projected dem<strong>and</strong>s in 2010.Figure 6-6: Broward County Projected <strong>Water</strong> Dem<strong>and</strong>, 2010Broward County Projected <strong>Water</strong> Dem<strong>and</strong> - 2010MGD500.00450.00400.00350.00300.00250.00200.00150.00100.0050.000.00Average Daily Dem<strong>and</strong>Maximum Day Dem<strong>and</strong>357.60 357.08 361.85271.26 270.87274.49CERP BEBR CountySource: SFRPC, CERP, BEBR, Broward CountyBetween 2010 <strong>and</strong> 2020 the population of Broward County is projected to increase by as much325,500 people, giving the County a population of as many as 2,273,287 people in 2020. Using percapita maximum day dem<strong>and</strong>, the resulting additional water dem<strong>and</strong> could be as much as 60.26mgd. This additional water dem<strong>and</strong> would bring the total water dem<strong>and</strong> in 2020 to as much as14 For the purpose of this study, average annual daily dem<strong>and</strong> refers to the total volume of water used in a year dividedby 365 days.15 2004 population used to calculate per capita numbers was 1,723,131.132
420.86 mgd. When per capita average annual daily dem<strong>and</strong> is used in the calculations, theadditional dem<strong>and</strong> for water could be as high as 45.71 mgd, which would bring the potentialtotal dem<strong>and</strong> in 2020 to as much as 319.24 mgd. Figure 6-7 shows the range of projecteddem<strong>and</strong>s in 2020.Figure 6-7: Broward County Projected <strong>Water</strong> Dem<strong>and</strong>, 2020600.00500.00400.00Projected Broward County <strong>Water</strong> Dem<strong>and</strong> - 2020Average Daily Dem<strong>and</strong>Maximum Day Dem<strong>and</strong>417.86 415.55 420.86MGD300.00316.97315.22319.24200.00100.000.00CERP BEBR CountySource: SFRPC, CERP, BEBR, Broward CountyIn the 10 years between 2020 <strong>and</strong> 2030 the population is expected to increase by as many as305,800 people. This increase would bring the total population in the County to as many as2,562,900. The additional dem<strong>and</strong> for water created by the increase in population would be asmuch as 56.61 mgd during maximum day dem<strong>and</strong> <strong>and</strong> as much as 42.94 mgd during averageannual daily dem<strong>and</strong>. This would bring the total maximum day dem<strong>and</strong> in 2030 to as much as474.47 mgd <strong>and</strong> the total average annual daily dem<strong>and</strong> to as much as 359.93 mgd. Figure 6-8shows the range of projected water dem<strong>and</strong> for Broward County in 2030.Figure 6-8: Broward County Projected <strong>Water</strong> Dem<strong>and</strong>, 2030Projected Broward County <strong>Water</strong> Dem<strong>and</strong> - 2030600.00Average Daily Dem<strong>and</strong>Maximum Day Dem<strong>and</strong>500.00474.47468.71 471.77400.00359.92355.55357.87MGD300.00200.00100.000.00CERP BEBR CountySource: SFRPC, CERP, BEBR, Broward County133
3. Miami-Dade CountyMiami-Dade County is also expecting a tremendous amount of growth in the next twenty-fiveyears. By 2030, the population of the County could be as high as 3,187,776 16 , an increase of morethan 800,000 people from the current population. Table 6-3 shows the three different populationprojections for the County.Table 6-3: Miami-Dade County Population Projections, 2005-2030Population Projection 2005 2010 2015 2020 2025 2030Miami-Dade County 2,402,117 2,551,284 2,703,117 2,858,184 3,019,787 3,187,776(07/04)USACE, CERP (2003) 2,403,200 2,554,300 2,706,500 2,862,000 3,011,900 3,148,100UF BEBR (02/04) 2,414,200 2,574,000 2,730,800 2,885,900 3,033,800 3,168,900Source: Miami-Dade County, CERP, BEBRThe current dem<strong>and</strong> for water in Miami-Dade County is 412.404 mgd during maximum daydem<strong>and</strong> <strong>and</strong> 380.312 mgd during average annual daily dem<strong>and</strong>. Using these figures <strong>and</strong> the2004 population for the County (2,379,818), the per capita dem<strong>and</strong> was calculated. Themaximum day per capita dem<strong>and</strong> is 173.29 gallons per day <strong>and</strong> the per capita average annualday dem<strong>and</strong> is 159.81 gallons per day.It is projected that the dem<strong>and</strong> for water in Miami-Dade County could be as much 552.42 mgd by2030. This is an increase of almost 34% over current dem<strong>and</strong>. While the projected increase is notas large as Broward Counties, it still warrants attention. Figure 6-9 compares the known capacityin the County out to 2030 with the capacity needed to operate at 75% of permitted capacity atmaximum-day dem<strong>and</strong> <strong>and</strong> the calculated dem<strong>and</strong>.Figure 6-9: Miami-Dade County Projected <strong>Water</strong> Dem<strong>and</strong>, 2005-2030800700600500Miami-Dade County <strong>Water</strong> Dem<strong>and</strong> <strong>and</strong> CapacityMGD40030020010002005 2010 2015 2020 2025 2030Capacity Capacity need to operate at 75% Dem<strong>and</strong>Source: SFRPC16 Miami-Dade County, 07/04 projection134
By 2010 the population of Miami-Dade County is projected to increase by as many as 194,182people, to just over two <strong>and</strong> a half million people. The additional water these new residents willdem<strong>and</strong> could be as high as 33.65 mgd. This would bring the total projected maximum daydem<strong>and</strong> to as much as 446.05 mgd. During average annual daily dem<strong>and</strong>, the dem<strong>and</strong> could beas high as 411.34, an increase of as much as 31.03 mgd. This additional dem<strong>and</strong> represents anincrease of as much as 8.2%. Figure 6-10 illustrates the range of dem<strong>and</strong>s projected in the Countyfor 2010.Figure 6-10: Miami-Dade County Projected <strong>Water</strong> Dem<strong>and</strong>, 2010Miami-Dade County Projected <strong>Water</strong> Dem<strong>and</strong> - 2010600.00Average Daily Dem<strong>and</strong>Maximum Day Dem<strong>and</strong>500.00400.00408.20442.64 446.05411.34407.71442.12MGD300.00200.00100.000.00CERP BEBR CountySource: SFRPC, CERP, BEBR, Miami-Dade CountyBetween 2010 <strong>and</strong> 2020, it is projected that as many as 311,900 additional people will reside inMiami-Dade County. This would bring the total population in 2020 to between 2,858,184 <strong>and</strong>2,885,900. Using the per capita maximum day dem<strong>and</strong>, this increase in population would resultin an additional dem<strong>and</strong> of as much as 54.05 mgd. This would bring the total maximum daydem<strong>and</strong> to as high as 500.10 mgd. When per capita average annual daily dem<strong>and</strong> is used, theadditional dem<strong>and</strong> could be as much as 49.84 mgd, bringing the total average annual dailydem<strong>and</strong> to as high as 461.19 mgd. By 2020, the dem<strong>and</strong> could be as much as 21.3% higher thancurrent dem<strong>and</strong>. Figure 6-11 shows the range of dem<strong>and</strong>s that are projected for 2020.135
Figure 6-11: Miami-Dade County Projected <strong>Water</strong> Dem<strong>and</strong>, 2020Miami-Dade County Projected <strong>Water</strong> Dem<strong>and</strong> - 2020600.00500.00Average Daily Dem<strong>and</strong>Maximum Day Dem<strong>and</strong>495.96 500.10495.30457.37 461.19 456.76MGD400.00300.00200.00100.000.00CERP BEBR CountySource: SFRPC, CERP, BEBR, Miami-Dade CountyIt is projected that as many as 329,592 new residents will move to Miami-Dade County between2020 <strong>and</strong> 2030. This increase could bring the total population to as many as 3,187,776 in 2030.With this increase in population, the maximum day dem<strong>and</strong> could increase by as much 57.11mgd, to 552.42 mgd. Using per capita average annual daily dem<strong>and</strong>, the increase could be asmuch as 52.67 mgd, bringing the total to as much as 509.43 mgd. By 2030, the increase in dem<strong>and</strong>could be as much as 33.9% over current dem<strong>and</strong>. Figure 6-12 shows the range of dem<strong>and</strong>sprojected for 2030.Figure 6-12: Miami-Dade County Projected <strong>Water</strong> Dem<strong>and</strong>, 2030Miami-Dade County Projected <strong>Water</strong> Dem<strong>and</strong> - 2030700.00Average Daily Dem<strong>and</strong>Maximum Day Dem<strong>and</strong>600.00500.00503.09545.54 549.15506.41509.43552.42MGD400.00300.00200.00100.000.00CERP BEBR CountySource: SFRPC, CERP, BEBR, Miami-Dade County136
4. Monroe CountyMonroe County is in a different position than either Broward or Miami-Dade Counties. Becauseof the sensitive environmental condition of the County, especially the <strong>Florida</strong> Keys, <strong>and</strong> themoratorium on building in the County in the past, it has not experienced, nor is it expected toexperience, the growth rates that the other counties are expecting.Monroe County is expected to grow by 2,664 17 to 4,564 18 people between now <strong>and</strong> 2030. Theexpected population in 2030 ranges from 83,900 to 85,800 people. Table 6-4 shows the variouspopulation projections for Monroe County out to 2030.Table 6-4: Monroe County Population Projections, 2005-2030Population Projection 2005 2010 2015 2020 2025 2030Monroe County (1999) 88,305 90,236 90,654 N/A N/A N/AUSACE, CERP (2003) 81,300 82,200 83,100 84,100 85,000 85,800UF BEBR (02/04) 80,800 81,500 82,100 82,700 83,300 83,900Source: Monroe County, CERP, BEBRThe current dem<strong>and</strong> for water in Monroe County is 23.8 mgd during maximum day dem<strong>and</strong>, <strong>and</strong>17.6 mgd at average annual daily dem<strong>and</strong>. Given the 2004 population of the County (81,236), theper capita maximum day dem<strong>and</strong> is 292.97 gallons per person per day, <strong>and</strong> 216.65 gallons perperson per day at per capita average annual daily dem<strong>and</strong>. Using these calculations, it isprojected that water dem<strong>and</strong> in Monroe County could be as high as 25.137 mgd at maximum daydem<strong>and</strong> <strong>and</strong> 18.589 mgd at average annual daily dem<strong>and</strong> in 2030. This is an increase of 5.6%over current dem<strong>and</strong>. Figure 6-13 compares the known capacity in the County out to 2030 withthe capacity needed to operate at 75% of permitted capacity at maximum-day dem<strong>and</strong> <strong>and</strong> thecalculated dem<strong>and</strong>.Figure 6-13: Monroe County <strong>Water</strong> Projected Dem<strong>and</strong> And Capacity, 2005-203040.035.030.025.0Monroe County <strong>Water</strong> Dem<strong>and</strong> <strong>and</strong> CapacityMGD20.015.010.05.00.02005 2010 2015 2020 2025 2030Capacity Capacity need to operate at 75% Dem<strong>and</strong>Source: SFRPC17 This increase is based on the UF BEBR projections that were done in 02/2004.18 This increase is based on the USACE, CERP Update projections that were done in 2003.137
By 2010 the population in Monroe County could increase by as many as 964 19 people, bringingthe total population to as high as 82,200. The additional residents will increase the total dem<strong>and</strong>by 0.28 mgd at maximum day dem<strong>and</strong>, <strong>and</strong> by 0.21 mgd at average annual daily dem<strong>and</strong>. Thetotal maximum day dem<strong>and</strong> for 2010 would increase to as much as 24.082 mgd, <strong>and</strong> the totalaverage annual daily dem<strong>and</strong> to as much as 17.809 mgd. Figure 6-14 shows the range ofdem<strong>and</strong>s for Monroe County in 2010.Figure 6-14: Monroe County Projected <strong>Water</strong> Dem<strong>and</strong>, 2010Monroe County Projected <strong>Water</strong> Dem<strong>and</strong> - 201035.0030.0025.00Average Daily Dem<strong>and</strong>Maximum Day Dem<strong>and</strong>24.0823.88MGD20.0015.0017.8117.6610.005.000.00Source: SFRPC, CERP, BEBRCERPBEBRBy 2020 the population of Monroe County is expected to increase by as many as 1,900 people,bring the total population to as high as 84,100. The additional residents will increase the dem<strong>and</strong>for water by as much as 0.56 mgd at maximum day dem<strong>and</strong>, <strong>and</strong> 0.41 mgd at average annualdaily dem<strong>and</strong>. This would bring the total maximum day dem<strong>and</strong> in the County to as much as24.639 mgd, <strong>and</strong> the total average annual daily dem<strong>and</strong> to 17.971 mgd. This is an increase of asmuch as 3.5% over current dem<strong>and</strong>. Figure 6-15 shows the range of dem<strong>and</strong>s in 2020.19 Monroe County projections are not used in the calculation due to their being so different than the other twoprojections. They are in Table 6-9 for information only.138
Figure 6-15: Monroe County Projected <strong>Water</strong> Dem<strong>and</strong>, 2020Monroe County Projected <strong>Water</strong> Dem<strong>and</strong> - 2020MGD35.0030.0025.0020.0015.0010.005.00Average Daily Dem<strong>and</strong>Maximum Day Dem<strong>and</strong>24.64 24.2318.22 17.920.00Source: SFRPC, CERP, BEBRCERPBEBRAs many as 85,800 people could be living in Monroe County by 2030, an increase of as many as1,700 people from 2020. This is an increase of as much as 5.6% over the current population.These additional residents will dem<strong>and</strong> as much as 0.50 mgd in additional capacity at maximumday dem<strong>and</strong>, <strong>and</strong> as much as 0.37 mgd at average annual daily dem<strong>and</strong>. The 2030 dem<strong>and</strong> couldbe as much as 5.6% higher than the current dem<strong>and</strong> in Monroe County. Figure 6-16 shows therange of dem<strong>and</strong>s for the County in 2030.Figure 6-16: Monroe County Projected <strong>Water</strong> Dem<strong>and</strong>, 2030Monroe County Projected <strong>Water</strong> Dem<strong>and</strong> - 203035.0030.0025.00Average Daily Dem<strong>and</strong>Maximum Day Dem<strong>and</strong>25.1424.58MGD20.0015.0018.5918.1810.005.000.00Source: SFRPC, CERP, BEBRCERPBEBR139
C. WASTEWATER DEMAND<strong>Wastewater</strong> treatment plants are permitted based on their average annual daily dem<strong>and</strong>. This isthe total volume of water received in a year divided by 365 days. The level of service st<strong>and</strong>ardfor wastewater plants is average day, so average day flows, or average annual daily flows, arecompared to the operative constraint of the plant. While analysis is provided for both averageannual daily dem<strong>and</strong> <strong>and</strong> maximum-day dem<strong>and</strong>, it is the former that is the st<strong>and</strong>ard criteria touse when analyzing wastewater treatment plants.The same two scenarios were used to determine future wastewater dem<strong>and</strong> as were used todetermine future water dem<strong>and</strong>. A per capita average annual daily dem<strong>and</strong> <strong>and</strong> a per capitamaximum-day dem<strong>and</strong> were calculated, <strong>and</strong> dem<strong>and</strong> was extrapolated using the threepopulation projections.1. The RegionThe analysis of the Region’s future wastewater dem<strong>and</strong> does not include Monroe County.Because the population growth in Monroe County is so small, there is a negligible difference inthe overall dem<strong>and</strong> projections. Therefore, the Regional analysis only includes Broward <strong>and</strong>Miami-Dade Counties.By 2030 the total population of the Region could be as high as 5,736,079, <strong>and</strong> increase of morethan 1.5 million people from the current population. Please see Table 6-5 for populationprojections to 2030 for the Region. The dem<strong>and</strong> for wastewater services in the Region could be ashigh as 677.10 mgd during average annual daily flow <strong>and</strong> 1049.22 mgd during maximum dayflow. This is an increase of 37.8% over the current dem<strong>and</strong>. This increased dem<strong>and</strong> will putadditional pressure on an already taxed Regional wastewater system.Table 6-5: Regional Population Projections, Excluding Monroe County, 2005-2030Population Projection 2005 2010 2015 2020 2025 2030USACE, CERP Update (2003) 4,176,000 4,485,900 4,798,800 5,119,100 5,428,800 5,711,000UF BEBR (02/04) 4,180,700 4,502,800 4,818,300 5,130,500 5,428,400 5,700,700County Totals 20 4,192,033 4,505,856 4,820,155 5,131,471 5,438,428 5,736,079Source: CERP, BEBR, Broward County, Miami-Dade CountyThe current dem<strong>and</strong> for wastewater services in the Region is 484.23 mgd during average annualdaily flow, <strong>and</strong> 750.49 mgd during maximum day dem<strong>and</strong>. The per capita use in the Region is118.04 gallons per day during average annual flow <strong>and</strong> 182.92 gallons per day during maximumday dem<strong>and</strong>. The current operating rate during average annual daily flow is 75.1% of permittedcapacity, <strong>and</strong> 116.3% of permitted capacity during maximum day flow.By 2010 the population in the Region could be as high as 4,492,033, an increase of as many as321,671 people over the current population. The resulting increase in wastewater dem<strong>and</strong> wouldbe as much as 37.97 mgd during average annual daily flow, <strong>and</strong> 58.84 mgd during maximum dayflow. The total dem<strong>and</strong> in 2010 could be as high as 531.88 mgd during average annual dailyflow, <strong>and</strong> 824.19 mgd during maximum day flow. This is an increase of as much as 7.8% over thecurrent Regional dem<strong>and</strong>. Figure 6-17 shows the range of dem<strong>and</strong>s projected for the Region in2010.20 Includes only Broward <strong>and</strong> Miami-Dade Counties140
Figure 6-17: Projected Regional <strong>Wastewater</strong> Dem<strong>and</strong>, 2010Region-Wide Projected <strong>Wastewater</strong> Dem<strong>and</strong> - 20101400.001200.00Average Daily Dem<strong>and</strong>Maximum Day Dem<strong>and</strong>1000.00MGD800.00600.00820.54823.63529.52 531.52 531.88824.19400.00200.000.00CERP BEBR CountySource: SFRPC, CERP, BEBR, Broward County, Miami-Dade CountyAccording to data obtained in previous tasks, an additional 89.5 mgd of capacity will be added tothe Region’s wastewater facilities between now <strong>and</strong> 2010. These additions will bring the totalcapacity in the Region to 739.12 mgd. The additions would result in a decrease in operating ratesfor the Region as a whole. During average annual daily dem<strong>and</strong>, the Region would be operatingat 72.0% of capacity. While this is under the backlog threshold that has been determined, it is stillvery close to that mark <strong>and</strong> should be carefully monitored.By 2020 the population in the Region could be as high as 5,131,471, an increase of as many as633,200 people over the 2010 population, <strong>and</strong> 947,286 people over the current population. Theincrease in wastewater dem<strong>and</strong> from 2010 to 2020 could be as much as 74.74 mgd at averageannual daily flow <strong>and</strong> as much as 115.82 mgd at maximum day flow. This is an increase of asmuch as 14.1% over 2010 dem<strong>and</strong>. The increase in dem<strong>and</strong> from the current dem<strong>and</strong> could be ashigh as 111.82 mgd at average annual daily flow <strong>and</strong> 173.28 mgd at maximum day flow. The2020 dem<strong>and</strong> could be as much as 23.1% over current dem<strong>and</strong>. The total dem<strong>and</strong> in 2020 couldbe as high as 605.73 mgd during average annual daily flow <strong>and</strong> 938.63 mgd during maximumday dem<strong>and</strong>. Figure 6-18 shows the range of dem<strong>and</strong>s projected for 2020141
Figure 6-18: Projected Regional <strong>Wastewater</strong> Dem<strong>and</strong>, 2020Region-Wide Projected <strong>Wastewater</strong> Dem<strong>and</strong> - 20201400.001200.00Average Daily Dem<strong>and</strong>Maximum Day Dem<strong>and</strong>1000.00936.36938.45938.63MGD800.00600.00400.00604.27 605.61 605.73200.000.00CERP BEBR CountySource: SFRPC, CERP, BEBR, Broward County, Miami-Dade CountyAccording to the data, there is no additional capacity planned for the Region’s wastewaterfacilities between 2010 <strong>and</strong> 2020. The total Regional capacity in 2020 would remain at 739.12mgd. With the additional dem<strong>and</strong> that will be put on the Regional system, the operating rate in2020 could be as high as 82.0% of permitted capacity during annual average daily flow. This isover the 75% threshold that has been established as point at which backlog begins. In order tooperate at75%, 68.52 mgd of capacity would be needed in the Region. This would bring the totalcapacity to 807.64 mgd.By 2030 the Region’s population could be as high as 5,736,079. This is an increase of as many as604,608 people over the 2020 population, <strong>and</strong> 1,551,894 people over the current population. Theincrease in wastewater dem<strong>and</strong> generated by the population increase from 2020 to 2030 could beas much as 71.37 mgd during average annual daily flow, <strong>and</strong> 110.59 mgd during maximum dayflow. This is an increase of 11.8% over the 2020 dem<strong>and</strong>. The increase from current dem<strong>and</strong>could be as much as 183.19 mgd during average annual daily flow, <strong>and</strong> 283.87 mgd duringmaximum day flow. This is an increase of 37.8% over the current dem<strong>and</strong>. The total dem<strong>and</strong> in2030 could be as high as 677.10 mgd during average annual daily flow <strong>and</strong> 1049.22 mgd duringmaximum day flow. Figure 6-19 shows the range of dem<strong>and</strong>s projected for 2030.142
Figure 6-19: Projected Regional <strong>Wastewater</strong> Dem<strong>and</strong>, 2030Region-Wide Projected <strong>Wastewater</strong> Dem<strong>and</strong> - 20301400.001200.001000.00Average Daily Dem<strong>and</strong>Maximum Day Dem<strong>and</strong>1044.631042.751049.22MGD800.00600.00400.00200.000.00674.14 672.92 677.10CERP BEBR CountySource: SFRPC, CERP, BEBR, Broward County, Miami-Dade CountyAccording to the data collected, there is no additional capacity planned for the Region’swastewater facilities between 2020 <strong>and</strong> 2030. The total Regional capacity in 2030 would remain at739.12 mgd. With the additional dem<strong>and</strong> generated, the operating rate in 2030 could be as highas 91.6% of permitted capacity during average annual daily flow. This is well above theestablished backlog threshold that has been established. In order to operate at 75%, 163.68 mgdof capacity would need to be added to the Region. This would bring the total capacity in theRegion to 902.80 mgd.143
2. Broward CountyBy 2030 there could potentially be more than 2.5 million people in Broward County. This is anincrease of more than 800,000 people over the current population. As with water, these newresidents will dem<strong>and</strong> additional wastewater services. Please refer to Table 6-1 on page 127 forBroward County population projections to 2030.The current dem<strong>and</strong> for wastewater treatment in Broward County is 209.32 mgd during averageannual daily dem<strong>and</strong> <strong>and</strong> 385.973 mgd during maximum-day dem<strong>and</strong>. The per capitawastewater use in Broward County at average annual daily dem<strong>and</strong> is 121.48 gallons per day<strong>and</strong> 224.0 gallons per day at maximum day dem<strong>and</strong>. As was discussed in Task 5, the currentoperating rates in the County are 77.2% of permitted capacity during average annual dailydem<strong>and</strong> <strong>and</strong> 142.3% of permitted capacity during maximum-day dem<strong>and</strong>. With the addition ofup to 800,000 people in the next 25 years, the already strained wastewater system will onlybecome more backlogged.The dem<strong>and</strong> for wastewater in Broward County could potentially increase by as much as 48.7%by 2030. This would mean an increase in dem<strong>and</strong> of as much as 102.02 mgd during averageannual daily dem<strong>and</strong> <strong>and</strong> 188.11 mgd during maximum-day dem<strong>and</strong>. This could bring the totaldem<strong>and</strong> to more than 311.33 mgd during average annual daily dem<strong>and</strong> <strong>and</strong> 574.08 mgd duringmaximum-day dem<strong>and</strong>.Taken incrementally, the projected wastewater dem<strong>and</strong> in Broward County is less daunting thanwhen 25 years of population growth are taken all at once.By 2010 the total population of Broward County could be as high as 1,954,572, an increase of over200,000 people from the current population. The increase in population would result in anincrease in wastewater dem<strong>and</strong> by as much as 24.98 mgd at average annual daily dem<strong>and</strong> <strong>and</strong>46.07 mgd at peak or maximum day dem<strong>and</strong>. This would bring the total maximum day dem<strong>and</strong>to as high as 437.81 mgd <strong>and</strong> the total average annual daily dem<strong>and</strong> to as much as 237.43 mgd.The increase in total wastewater dem<strong>and</strong> from the current dem<strong>and</strong> to 2010 could be as high as12.1%. Figure 6-20 shows the range of projected wastewater dem<strong>and</strong>s in 2010.Figure 6-20: Broward County Projected <strong>Wastewater</strong> Dem<strong>and</strong>, 2010Broward County Projected <strong>Wastewater</strong> Dem<strong>and</strong> - 2010600.00500.00Average Daily Dem<strong>and</strong>Maximum Day Dem<strong>and</strong>MGD400.00300.00200.00432.67432.04234.64 234.30 237.43437.81100.000.00CERP BEBR CountySource: SFRPC, CERP, BEBR, Broward County144
By 2020 the total population of Broward County could be as high as 2,273,287, an increase of asmany as 325,500 people over the 2010-projected population <strong>and</strong> as many as 550,156 people overthe current population. The increase in population will increase the dem<strong>and</strong> for wastewater. Theincrease in dem<strong>and</strong> from 2010 to 2020 could be as much as 39.54 mgd at average annual dailydem<strong>and</strong>, <strong>and</strong> 72.91 mgd at maximum day dem<strong>and</strong>, an increase of 16.7% over 2010 dem<strong>and</strong>. Theincrease in dem<strong>and</strong> could be as much as 66.83 mgd over current dem<strong>and</strong> at average annual dailydem<strong>and</strong> <strong>and</strong> 123.24 mgd at maximum day dem<strong>and</strong>, an increase of 31.0%. The total dem<strong>and</strong> forwastewater in 2020 could be as high as 276.15 mgd during average annual daily dem<strong>and</strong> <strong>and</strong>509.21 mgd at maximum day dem<strong>and</strong>. Figure 6-21 shows the range of dem<strong>and</strong>s in 2020.Figure 6-21: Broward County Projected <strong>Wastewater</strong> Dem<strong>and</strong>, 2020Broward County Projected <strong>Wastewater</strong> Dem<strong>and</strong> - 2020700.00600.00500.00Average Daily Dem<strong>and</strong>Maximum Day Dem<strong>and</strong>505.58 502.78 509.21MGD400.00300.00274.18272.67276.15200.00100.000.00CERP BEBR CountySource: SFRPC, CERP, BEBR, Broward CountyBy 2030 the population of the County could be as high as 2,562,900. This is an increase of asmany as 305,800 people from 2020, <strong>and</strong> 839,769 over the current population. The increase inwastewater dem<strong>and</strong> from 2020 to 2030 could be as much as 37.15 mgd at average annual dailydem<strong>and</strong> <strong>and</strong> 68.50 mgd at maximum day dem<strong>and</strong>. This is an increase of 13.5% over 2020dem<strong>and</strong>. The increase in dem<strong>and</strong> from the current dem<strong>and</strong> could be as much as 102.02 mgd ataverage annual daily dem<strong>and</strong> <strong>and</strong> 188.11 mgd at maximum day dem<strong>and</strong>, an increase of 48.7%.The total dem<strong>and</strong> for wastewater in 2030 could be as high as 311.33 mgd during average annualdaily dem<strong>and</strong> <strong>and</strong> 574.08 mgd at maximum day dem<strong>and</strong>. Figure 6-22 shows the range ofwastewater dem<strong>and</strong>s in 2030.145
Figure 6-22: Broward County Projected <strong>Wastewater</strong> Dem<strong>and</strong>, 2030Broward County Projected <strong>Wastewater</strong> Dem<strong>and</strong> - 2030Average Daily Dem<strong>and</strong>700.00Maximum Day Dem<strong>and</strong>600.00574.08567.11570.81500.00MGD400.00300.00200.00100.000.00311.33 307.55 309.56CERP BEBR CountySource: SFRPC, CERP, BEBR, Broward County146
3. Miami-Dade CountyBy 2030 the population of Miami-Dade County could be as high as 3,187,776. This is an increaseof more than 800,000 over the current population. These new residents will require as much as123.75 mgd of additional wastewater service, a 34% increase over current dem<strong>and</strong>. Please seeTable 6-3 for population projections to 2030 for Miami-Dade County.The current dem<strong>and</strong> for wastewater treatment in Miami-Dade County is 275.0 mgd duringaverage annual daily dem<strong>and</strong> <strong>and</strong> 364.52 mgd during maximum-day dem<strong>and</strong>. The per capitawastewater use in the County at average annual daily dem<strong>and</strong> is 115.56 gallons per day <strong>and</strong>153.17 gallons per day at maximum day dem<strong>and</strong>. As was discussed in Task 5, the currentoperating rates in the County are 73.5% of permitted capacity during average annual dailydem<strong>and</strong> <strong>and</strong> 97.5% of permitted capacity during maximum-day dem<strong>and</strong>. While the County isnot operating at levels as high as Broward County, it is still above the backlog threshold, <strong>and</strong> theadditional dem<strong>and</strong> will only compound the problem.By 2010 the total population in Miami-Dade County could be as high as 2,574,000. This is anincrease of as many as 194,182 people over the current population. The increase in populationwould result in an increase of wastewater services by as much as 22.44 mgd during averageannual daily flow, <strong>and</strong> 29.74 mgd during maximum day flow. The increase would bring the totalmaximum day dem<strong>and</strong> to as high as 394.26 mgd, <strong>and</strong> the total average annual daily dem<strong>and</strong> toas high as 297.44. The projected 2010 total dem<strong>and</strong> could be as much 8.2% over current dem<strong>and</strong>.Figure 6-23 shows the range of projected dem<strong>and</strong>s for 2010.Figure 6-23: Miami-Dade County Projected <strong>Wastewater</strong> Dem<strong>and</strong>, 2010600.00500.00Miami-Dade County Projected <strong>Wastewater</strong> Dem<strong>and</strong> -2010Average Daily Dem<strong>and</strong>Maximum Day Dem<strong>and</strong>MGD400.00300.00391.25394.26295.16 297.44 294.81390.78200.00100.000.00CERP BEBR CountySource: SFRPC, CERP, BEBR, Miami-Dade CountyBy 2020 the total population of Miami-Dade County could be as high as 2,885,900. This is anincrease of as many as 311,900 people from 2010 <strong>and</strong> 506,082 people from the current population.The result of the population increase is an increase of as much as 36.04 mgd of wastewaterdem<strong>and</strong> during average annual daily flow from 2010, <strong>and</strong> 58.48 mgd from the current dem<strong>and</strong>.When maximum day dem<strong>and</strong> is analyzed, we find that the increase could be as much as 47.77mgd from the 2010 dem<strong>and</strong>, <strong>and</strong> 77.52 mgd from the current dem<strong>and</strong>. The increase over 2010dem<strong>and</strong> is as much as 12.1%, <strong>and</strong> the increase over current dem<strong>and</strong> is as much as 21.3%. The147
total dem<strong>and</strong> in 2020 may be as high as 333.48 mgd during average annual daily flow <strong>and</strong> 442.04mgd during maximum day flow. Figure 6-24 shows the range of wastewater dem<strong>and</strong>s projectedfor 2020.Figure 6-24: Miami-Dade County Projected <strong>Wastewater</strong> Dem<strong>and</strong>, 2020Miami-Dade County Projected <strong>Wastewater</strong> Dem<strong>and</strong> - 2020700.00600.00Average Daily Dem<strong>and</strong>Maximum Day Dem<strong>and</strong>MGD500.00400.00300.00330.72438.38 442.04 437.79333.48330.28200.00100.000.00CERP BEBR CountySource: SFRPC, CERP, BEBR, Miami-Dade CountyThe increase in population from 2020 to 2030 could be as many as 329,592 people, <strong>and</strong> theincrease from the current population could be as many as 807,958 people. This would put the2030 population as high as 3,187,776. The additional dem<strong>and</strong> created from 2020 to 2030 could beas much as 38.09 mgd during average annual daily flow <strong>and</strong> 50.48 mgd during maximum dayflow. This is an increase of 11.4% over 2020 dem<strong>and</strong>. The increase over current dem<strong>and</strong> could beas much as 93.37 mgd during average annual daily flow <strong>and</strong> 123.75 mgd during maximum dayflow. This is an increase of as much as 34.0% over the current dem<strong>and</strong>. The total dem<strong>and</strong> in 2030could be as high as 368.36 mgd during average annual daily flow, <strong>and</strong> 488.28 mgd duringmaximum day flow. Figure 6-25 shows the range of projected wastewater dem<strong>and</strong>s for 2030.Figure 6-25: Miami-Dade County Projected <strong>Wastewater</strong> Dem<strong>and</strong>, 2030700.00600.00500.00Miami-Dade County Projected <strong>Wastewater</strong> Dem<strong>and</strong> -2030Average Daily Dem<strong>and</strong>Maximum Day Dem<strong>and</strong>482.20485.38488.28MGD400.00300.00200.00100.000.00363.78 366.18 368.36CERP BEBR CountySource: SFRPC, CERP, BEBR, Miami-Dade County148
D. Case <strong>Study</strong>: State Road 7 RedevelopmentThe State Road 7 Master Plan is one of the most ambitious <strong>and</strong> comprehensive redevelopmentplans within the region. Initial projections provided by the Urban L<strong>and</strong> Institute (ULI) indicatethat the Broward County portion of the corridor could accommodate nearly 20 percent of theCounty’s growth by the year 2020, including over 29,000 residential units; 10 million square feetof office; 7 million square feet of flex space; 3 million square feet of retail; <strong>and</strong> 4 thous<strong>and</strong> hotelrooms.This potential development scenario could generate a dem<strong>and</strong> of over 11 mgd of water <strong>and</strong>wastewater by the year 2020. This development would occur over a 25-mile area that is servedby twelve water treatment service providers <strong>and</strong> seven wastewater treatment providers.Collectively, the water treatment facilities have a permit capacity of 244 mgd <strong>and</strong> a peak flow of178 mgd <strong>and</strong> appear to have sufficient capacity to accommodate the projected growth <strong>and</strong>dem<strong>and</strong> at each facility.<strong>Wastewater</strong> facilities have a collective permit capacity of 218 mgd <strong>and</strong> an average flow of 174mgd <strong>and</strong> peak flows exceed current permit capacities. Expansions to facility treatment capacitywill be necessary where capacity is limited. For example, the Town of Davie <strong>and</strong> the City ofHollywood will need to ensure that planned expansions occur in order facilitate the level ofredevelopment that could occur in these portions of the corridor.Additional refinements in the amounts, geographic distribution, <strong>and</strong> timing of the developmentalong the State Road 7 corridor is underway <strong>and</strong> will be calibrated to specific service areas inorder to determine impacts upon individual facilities. This information collected in this studywill be vital in conducting this assessment.149
VII.TASK 7 - COST ANALYSISTask 7 utilizes the estimates derived in Tasks 5 <strong>and</strong> 6 to estimate the future costs to provideservices needed to sustain future growth in <strong>South</strong> <strong>Florida</strong>. Examples of water <strong>and</strong> wastewaterexpansion projects from around the county were used to estimate the cost of expansion in theRegion. Cost estimates were determined by finding what capacity would be needed in order forthe Region’s water system to operate at 75% <strong>and</strong> for the Region’s wastewater system to operate at75% <strong>and</strong> 50% of permitted capacity.Different factors are used to determine the operating rates of water <strong>and</strong> wastewater plants.<strong>Water</strong> Treatment plants use maximum day dem<strong>and</strong> to determine the plants permitted capacity,while wastewater treatment plants use average annual daily dem<strong>and</strong>.The estimates of back <strong>and</strong> future dem<strong>and</strong>, found in Tasks 5 <strong>and</strong> 6, were used to calculate theestimated cost of future needs. A cost per million gallons of capacity increase was determined foreach project that was found.There is a range of improvements that can be made to increase a plant’s capacity <strong>and</strong>/orefficiency. To estimate this, a survey of plants from around the county was conducted to get acost estimate for plant capacity increases. Each plant will need detailed engineering studies todetermine the best methods to increase plant capacity.In accordance with conversations with SFWMD staff, a cost analysis for stormwater managementsystems was not performed. Each stormwater management project has many localized factorsthat make it nearly impossible to perform a cost analysis on a Region-Wide basis.A. <strong>Water</strong> Treatment PlantsFour examples of water treatment plant expansion projects from around the country were found<strong>and</strong> used to estimate the cost to provide the needed water capacity for future growth in theRegion. Three examples from <strong>Florida</strong> are used. The first cost estimates used are based on datafrom the Miami-Dade Department of <strong>Water</strong> <strong>and</strong> Sewer Department’s <strong>Water</strong> <strong>Facilities</strong> Master Plan,September 2003 report. The second cost estimate is based on the most recent expansion at theHollywood <strong>Water</strong> Treatment Plant. The third estimate is based on a project by the City of SanDiego 21 , <strong>and</strong> the forth-cost estimate is based on the Lee County <strong>Florida</strong> Corkscrew WTPexpansion project 22 .Currently, there is an estimated backlog of 117.31 mgd in the Region. This represents thecapacity that is needed for the Region to operate at 75% of permitted capacity during maximumday dem<strong>and</strong>. The total capacity needed in the Region, in order to operated at 75% would be1006.95 mgd. By 2010 4.92 mgd of additional capacity will be needed to operate at 75% of totalcapacity 23 during maximum day dem<strong>and</strong>. By 2020 an additional 88.26 mgd capacity will beneeded, <strong>and</strong> by 2030, 130.44 mgd of additional capacity will be needed in the Region in order tooperate at 75% of total capacity during maximum day dem<strong>and</strong>. Table 7-1 illustrates the aboveinformation in greater detail.21 Source: City of San Diego, http://www.s<strong>and</strong>iego.gov/water/cip/miramar.shtml22 Source: Lee County, <strong>Florida</strong>23 Total capacity includes the surplus capacity in the Region, as defined in Task 5, as well as the knowncapacity increases that plants are planning for.150
Table 7-1: Region-wide <strong>Water</strong> Capacity Needs, 2010-2030Capacity(mgd)PeakOperatingRateTotal Capacity Needed toOperate at 75% duringPeak (mgd)AdditionalCapacity needed(mgd)Current Capacity 889.634 84.9% 1006.95 117.312010 Capacity 1101.146 75.3% 1106.07 4.922020 Capacity 1161.406 81.0% 1254.59 93.182030 Capacity 1171.406 89.3% 1395.03 223.62Source: SFRPCAccording to the <strong>Water</strong> <strong>Facilities</strong> Master Plan, Miami-Dade County is proposing to re-rate two oftheir water treatment plants. At the Hialeah-Preston Plant, the Department is proposing a re-rateto 235 mgd (an increase of 10 mgd) <strong>and</strong> water quality treatment improvements at Hialeah <strong>and</strong>Preston. The total cost of this is estimated to be $91 million. The cost per million gallons ofcapacity added is $9.1 million.The second project the County is proposing is the re-rate <strong>and</strong> expansion of the Alex<strong>and</strong>er OrrTreatment Plant. The re-rate will increase the total capacity at the plant by 60.26 mgd, to 278mgd. The total cost of this project is estimated to be $25 million. The cost per million gallons ofcapacity added is $0.42 million.According to the Master Plan, opinions of cost developed for these capital improvements areexpressed as “order-of-magnitude”, meaning they are made without detailed engineeringdrawings <strong>and</strong> are expected to be accurate within a range of 30 percent below <strong>and</strong> 50 percentabove actual costs. The opinions of costs shown are prepared for guidance in project evaluation<strong>and</strong> implementation from the information available at the time of the estimate. The final cost ofthe project will depend of multiple conditions, including actual labor <strong>and</strong> material costs,comparative market conditions, final project costs, implementation schedule, <strong>and</strong> other variablefactors. 24Using the costs from the two Miami-Dade County projects, estimates of the total price toeliminate the current backlog were calculated. As stated above, an additional 117.31 mgd ofcapacity is needed in the Region in order to operate at 75% of permitted capacity duringmaximum-day dem<strong>and</strong>. Based on the cost estimates for the first Miami-Dade County project(Estimate #1), $9.1 million per million gallons of capacity added, the estimated cost would be$1,067,521,000. The low estimate, 30% below cost, would be $747,264,700 <strong>and</strong> the high estimate,50% above cost, would be $1,601,281,500.The cost for the second Miami-Dade County project, expansion plans at the Alex<strong>and</strong>er Orr Plant(Estimate #2), is $0.42 million per million gallons of added capacity. The cost estimate for thecurrent backlog would be $49,270,200. The low estimate would be $34,489,140 <strong>and</strong> the highestimate is $73,905,300. Table 7-2 shows the cost estimates for the needed capacity to eliminatethe current backlog.24 Miami-Dade <strong>Water</strong> <strong>and</strong> Sewer Department, <strong>Water</strong> <strong>Facilities</strong> Master Plan, pg. 12-1.151
Table 7-2: Cost Estimates, Based On Estimates #1 And #2, To Eliminate Current <strong>Water</strong>BacklogYear Needed Capacity toOperate at 75% duringMaximum Day Dem<strong>and</strong>Cost based on expansionplans at Hialeah-PrestonPlantCost based onexpansion plans at theAlex<strong>and</strong>er Orr PlantCurrent Backlog 117.31 $1,067,521,000 $49,270,20030% below Cost $747,264,700 $34,489,14050% above Cost $1,601,281,500 $73,905,300Source: SFRPC, Miami-Dade <strong>Water</strong> <strong>and</strong> Sewer Department, <strong>Water</strong> <strong>Facilities</strong> Master Plan, Pg. 12-2Using the same costs as above, the cost estimates were calculated for the future capacity neededin the Region. By 2010, 4.92 mgd of additional capacity will be needed in order to operate at 75%of capacity during maximum day dem<strong>and</strong>. Using Estimate #1, the cost for this is $44,772,000,with a low estimate of $31,340,400 <strong>and</strong> a high estimate of $67,158,000. Using Estimate #2, the costis $2,066,400 with a low estimate of $1,446,480 <strong>and</strong> a high estimate of $3,099,600.By 2020 an additional 88.26 mgd of capacity will need to be added in the Region. Using Estimate#1, the cost of adding this capacity will be $803,166,000. The low estimate, 30% below cost, is$562,216,200, <strong>and</strong> the high estimate is $1,204,749,000. Using Estimate #2 the cost would be$37,069,200. The low estimate is $25,948,440 <strong>and</strong> the high estimate is $55,603,800.By 2030, an additional 130.44 mgd of capacity will need to be added in the Region. UsingEstimate #1, the cost estimate is $1,187,004. The low estimate is $830,902,800 <strong>and</strong> the highestimate is $1,780,506,000. Using Estimate #2, the cost estimate equals $54,784,800. The low costestimate is $38,349,360 <strong>and</strong> the high cost estimate is $82,177,200.Overall, in the next 25 years, a total of 223.62 mgd of capacity will need to be added in the Regionin order to operate at 75% of capacity during maximum day dem<strong>and</strong>. The cost of this usingEstimate #1 would be $3,102,463,000, with a low cost estimate of $2,171,724,100 <strong>and</strong> a highestimate of $4,653,694,500. Using Estimate #2, the cost would be $143,191,600. The low estimatewould be $100,233,420 <strong>and</strong> the high estimate would be $214,785,900.Table 7-3: <strong>Water</strong> Cost Estimates 2010-2030, Based On Estimates #1 And #2YearNeeded Capacity to Operateat 75% during MaximumDay Dem<strong>and</strong>Cost based on expansionplans at Hialeah-PrestonPlant (#1)Cost based on expansionplans at the Alex<strong>and</strong>er OrrPlant (#2)2010 4.92 $44,772,000 $2,066,4002020 88.26 $803,166,000 $37,069,2002030 130.44 $1,187,004,000 $54,784,800TOTAL 223.62 $3,102,463,000 $143,190,600Source: SFRPC, Miami-Dade <strong>Water</strong> <strong>and</strong> Sewer Department, <strong>Water</strong> <strong>Facilities</strong> Master Plan, Pg. 12-2The other local project used to estimate future costs was the expansion of the Hollywood <strong>Water</strong>Treatment Plant (Estimate #3). This was an 18-month, $27 million expansion that was completedin 1996. The project entailed the addition of a Membrane/Reverse Osmosis Plant. This plantworks in t<strong>and</strong>em with the existing lime-softening plant. The Membrane treatment may produceup to 14 mgd of finished water <strong>and</strong> the up to 4 mgd of finished water may be produced by the152
Reverse Osmosis treatment, for a total of 18 mgd of additional treatment capability. The cost permillion gallons of additional capacity is $1.5 million. Using this example, the estimated cost toeliminate the current backlog of 117.31 mgd would be $175,965,000. The high estimate is$228,754,500 <strong>and</strong> the low estimate is $123,175,500.Table 7-4: Cost Estimates, Based On Estimate #3, To Eliminate Current <strong>Water</strong> BacklogYear Needed Capacity to Operate at 75% Cost based on Estimate #3during Maximum Day Dem<strong>and</strong>Current Backlog 117.31 $175,965,00030% below Cost $123,175,50030% above Cost $228,754,500Source: SFRPC, City of HollywoodBetween 2010 <strong>and</strong> 2030, 223.62 mgd of additional capacity will be needed in the Region in orderto operate at 75% of permitted capacity during maximum-day dem<strong>and</strong>. Based on the cost of theHollywood <strong>Water</strong> Treatment Plant expansion project, the estimated cost for the needed capacitywould be $511,395,000. The low estimate of the cost, 30% below cost, is $136,962,000, <strong>and</strong> thehigh cost estimate, 30% above cost, is $254,358,000. Table 7-5 shows the cost based on the 10-yearneeds.Table 7-5: <strong>Water</strong> Cost Estimates 2010-2030, Based On Estimate #3Year Needed Capacity to Operate at 75% Cost based on Estimate #3during Maximum Day Dem<strong>and</strong>2010 4.92 $7,380,0002020 88.26 $132,390,0002030 130.44 $195,660,000TOTAL 223.62 $511,395,000Source: SFRPC, City of HollywoodA comparison of <strong>Water</strong> Treatment Plant expansion costs for the region also consideredexpenditures in other rapidly growing areas. The Miramar <strong>Water</strong> Treatment Plant Upgrade <strong>and</strong>Expansion project in San Diego, California, is the first of these projects used to estimate futureexpansion cost. According to the City, the benefits of this project are: increased capacity <strong>and</strong>reliability to meet current <strong>and</strong> future water needs. The capacity of the plant will be increased to215 mgd from 140 mgd, <strong>and</strong> increase of 75 mgd. The project will also allow the plant to meet orexceed new, stricter drinking water st<strong>and</strong>ards, <strong>and</strong> utilize state-of-the-art equipment <strong>and</strong>technology to increase the longevity of the plant. The total cost of this project is estimated to be$135 million. The cost per million gallons of capacity added is $1.8 million.Using the cost estimate from the Miramar WTP in San Diego (Estimate #4), the cost to eliminatethe current backlog (117.31 mgd) would be $211,158,000. The low estimate, 30% below cost,would be $147,810,600. The high estimate, 30% above cost, would be $316.737.000.Table 7-6: Cost Estimates, Based On Estimate #4, To Eliminate Current <strong>Water</strong> BacklogYear Needed Capacity to Operate at 75% Cost based on Estimate #4during Maximum Day Dem<strong>and</strong>Current Backlog 117.31 $211,158,00030% below Cost $147,810,60030% above Cost $316,737,000Source: SFRPC, City of San Diego <strong>Water</strong> Department153
Using Estimate #4, the cost to add the additional 4.92 mgd of capacity that will be needed by 2010would be $8,856,000. The low estimate would be $6,199,200, <strong>and</strong> the high estimate would be$13,284,000.By 2020, an additional 88.26 mgd of capacity will be needed throughout the Region in order tooperate at 75% of capacity during maximum day dem<strong>and</strong>. The cost of this using Estimate#34would be $158,868,000. The low cost estimate is $111,207,600 <strong>and</strong> the high cost estimate is$238,302,000.An additional 130.44 mgd of capacity will be needed by 2030 in order to keep up with populationgrowth in the Region. The cost of this additional capacity-using Estimate #4 is $234,792,000. Thelow estimate is $164,354,400 <strong>and</strong> the high estimate is $352,188,000.A total of 223.62 mgd of capacity will need to be added in the Region in order to keep pace withgrowth <strong>and</strong> maintain an operating rate of 75% of total capacity during maximum day dem<strong>and</strong>.Using Estimate #4 the cost of this is $402,516,000. The low estimate is $281,761,200 <strong>and</strong> the highestimate is $523,270,800.Table 7-7: <strong>Water</strong> Cost Estimates 2010-2030, Based On Estimate #4Year Needed Capacity to Operate at 75% Cost based Estimate #4during Maximum Day Dem<strong>and</strong>2010 4.92 $8,856,0002020 88.26 $158,868,0002030 130.44 $234,792,000TOTAL 223.62 $402,516,000Source: SFRPC, City of San Diego <strong>Water</strong> DepartmentThe third project used to estimate future costs was the Lee County, <strong>Florida</strong> Corkscrew <strong>Water</strong>Treatment Plant Expansion (Estimate #5). The project consists of the expansion of the existingplant from 10.038 mgd to 15.058 mgd, an increase of 5.02 mgd of capacity. The project is expectedto cost $13 million. The primary intent of the project is to improve the county’s water supplycapacity <strong>and</strong> provide the system with greater operational flexibility. The cost per million gallonsis $2.59 million.Using Estimate #5, the cost to eliminate the current backlog of 117.31 mgd in the Region wouldbe $303,832,900. The low estimate would be $212,683,030 <strong>and</strong> the high estimate would be$455,749,350.Table 7-8: Cost Estimates, Based On Estimate #5, To Eliminate Current <strong>Water</strong> BacklogYear Needed Capacity to Operate at 75% Cost based on Estimate #5during Maximum Day Dem<strong>and</strong>Current Backlog 117.31 $303,832,90030% below Cost $212,683,03030% above Cost $455,749,350Source: SFRPC, Lee County, FLA total of 223.62 mgd of additional capacity will be needed in the Region by 2030, not includingthe additional capacity that is needed to eliminate the current backlog. The cost of this, usingEstimate #4 is $579,175,800. The low cost estimate is $405,423,060 <strong>and</strong> the high estimate is$752,928,540. Table 7-9 shows the breakdown in cost per 10-year period.154
Table 7-9: <strong>Water</strong> Cost Estimates 2010-2030, Based On Estimate #5Year Needed Capacity to Operate at 75% Cost based Estimate #5during Maximum Day Dem<strong>and</strong>2010 4.92 $12,742,8002020 88.26 $228,593,4002030 130.44 $337,839,600TOTAL 223.62 $579,175,800Source: SFRPC, Lee County, FLBased on the projects described above, the estimated cost of adding the needed 223.62 mgd ofcapacity in the Region by 2030 could range from a high of $3,102,463,000 to a low of $143,190,600.These are both from the Miami-Dade County projects. Table 7-10 shows the five cost estimatesfor the cost of providing the 223.62 mgd of capacity.Table 7-10: Cost Comparison Between 5 EstimatesEstimate #1 Estimate #2 Estimate #3 Estimate #4 Estimate #5TOTAL COST $3,102,463,000 $143,190,600 $511,395,000 $402,516,000 $579,175,800Source: Miami-Dade County, City of Hollywood (FL), City of San Diego (CA), Lee County (FL)155
B. <strong>Wastewater</strong> Treatment PlantsThree wastewater treatment plant expansion projects were found from across the country.Unfortunately, no local projects could be found. The estimated costs of these projects were usedto calculate a cost estimate for providing the needed capacity within the Region to accommodatefuture growth. The first cost estimate is based on the <strong>South</strong>east Michigan Council ofGovernment’s (SEMCOG) report, “Investing in <strong>South</strong>east Michigan’s Quality of Life:Infrastructure Needs.” The second cost estimate is based on the expansion project at the Empire<strong>Wastewater</strong> Treatment Plant in Dakota County, MN. The third project used to estimateexpansion costs was the Michigan Road <strong>Wastewater</strong> Treatment Plant expansion, in ClayTownship, IN.Currently, there is an estimated backlog in the Region of 0.60 mgd. This represents the capacitythat is needed for the Region to operate at 75% of permitted capacity during annual average dailydem<strong>and</strong>. With this additional capacity, the total capacity in the Region would be 645.76 mgd. By2010 there will be an excess of capacity in the Region of 29.95 mgd. But by 2020 that excesscapacity will be gone, <strong>and</strong> an additional 38.57 mgd of capacity will be needed. By 2030, anadditional 95.16 mgd of capacity will be needed in the Region in order to operate at 75% of totalcapacity during average annual daily dem<strong>and</strong>. Table 7-11 shows the above information ingreater detail.Table 7-11: Region-wide <strong>Wastewater</strong> Capacity Needs, 2010-2030Capacity(mgd)PeakOperatingRateTotal Capacity Needed toOperate at 75% duringAADD (mgd)Capacity needed(mgd)Current Capacity 645.16 75.1% 645.76 0.602010 Capacity 739.12 72.0% 709.17 -29.952020 Capacity 739.12 82.0% 807.64 68.522030 Capacity 739.12 91.6% 902.80 163.68Source: SFRPCThe first of the three projects used to determine cost estimates for the elimination of currentbacklog, as well as the future dem<strong>and</strong>, is the report “Investing in <strong>South</strong>east Michigan’s Quality ofLife: Infrastructure Needs.” The <strong>South</strong>east Michigan Council of Governments did this study inApril 2001. The purpose of this study was to describe the need for continued <strong>and</strong> additionalinvestment in <strong>South</strong>east Michigan’s sewer infrastructure. The sewer needs between 2001 <strong>and</strong>2030 were identified, as well as the estimated cost of meeting these needs. Cost estimates forproviding the needed capacity were developed for three ranges, based on information providedby engineering consulting firms that design <strong>and</strong> construct wastewater treatment plants inMichigan. The high estimate is $13.1 million per million gallons of capacity added, the midestimate is $9.2 million per million gallons, <strong>and</strong> the low estimate is $5.9 million per milliongallons.Based on the current backlog in the Region’s wastewater treatment plants, 0.60 mgd, the cost toeliminate this, using SEMCOG’s estimates, would range from $4 million at the low end to a highof $7.86 million. The mid-range estimate is $5.5 million.By 2010, the dem<strong>and</strong> in the Region for wastewater service will increase, but there is currentlyplans in place to provide enough additional capacity so that Region will be operating under 75%of total capacity during average annual daily dem<strong>and</strong>. In fact, there will be a “surplus” of156
capacity totaling 29.95 mgd. This means that no additional cost beyond what is anticipated byindividual plants <strong>and</strong> municipalities will be needed, except for routine maintenance costs.At this time, there are no planned wastewater treatment plant expansion plans beyond 2010 inthe Region. This means that the total capacity, at this time, would remain the same, even thoughthe dem<strong>and</strong> will be increasing. A total of 38.57 mgd of capacity will need to be added to theRegion’s facilities between 2010 <strong>and</strong> 2020 in order for the Region as a whole to operate at 75% oftotal capacity during average annual daily dem<strong>and</strong>. Using SEMCOG’s cost amounts, theestimates range from a low of $227 million to a high of $505.06 million. The mid range estimate is$353.56 million.By 2030, an additional 95.16 mgd of capacity will be needed in the Region. Using the costamounts from the SEMCOG report, the low estimate is $560 million, the mid-range estimate is$872.3 million <strong>and</strong> the high estimate is $1.246 billion.Overall, an additional 134.33 mgd of capacity will need to be added to the Region, starting withthe 0.60 mgd of capacity that is needed just to address the current backlog. The total cost to dothis, based on the cost amounts in the SEMCOG report, range from a low of $790 million to a highof $1.759 billion. The mid range estimate is $1.231 billion.Table 7-12: <strong>Wastewater</strong> Cost Estimates 2010-2030, Based On SEMCOG Project CostsYear Additional Capacityneeded to operate at75% of AADDLow Estimate(in millions)Mid Estimate(in millions)High Estimate(in millions)Current Backlog 0.60 mgd $4.0 $5.5 $7.86By 2010 0 mgd $0 $0 $0Between 2010 <strong>and</strong>38.57 mgd $227 $353.56 $505.082020Between 2020 <strong>and</strong>95.16 mgd $560 $872.3 $1,246.142030TOTAL 134.33 mgd $790 $1,231 $1,759Source: SFRPC, <strong>South</strong>east Michigan Council of Governments (SEMCOG)The second project used to determine cost estimates for the Region’s wastewater needs was theexpansion at the Empire <strong>Wastewater</strong> Treatment Plant in Dakota County, Minnesota. Currentlythe plant serves 100,000 residents, but its service area is expected to nearly double in populationby 2030, prompting the need for expansion. The current capacity of the plant is 12 mgd; theexpansion project will increase the capacity to 24 mgd. The final disinfection of the wastewaterwill be upgraded as well as an upgrade to the biological phosphorus removal process. Theexpected cost of the project is $71 million, which is approximately $5.9 million per million gallonsof capacity added. A range of 30 percent above <strong>and</strong> below the cost was also calculated.Using the cost amounts from the Empire WWTP, the cost estimate to eliminate the currentbacklog in the Region is $3.6 million. The low estimate, 30 percent below the cost, is $2.5 million<strong>and</strong> the high estimate is $4.6 million.Because there is expected to be a “surplus” of capacity by 2010, there are no additional costsbeyond what are currently being planned for the facilities in the Region. But by 2020, thatsurplus will be gone, <strong>and</strong> an additional 38.57 mgd of capacity will be needed in the Region inorder to operate at 75% of capacity during average annual daily dem<strong>and</strong>. The cost of theadditional capacity would be $228.2 million using the Empire expansion project, with a lowestimate of $159.7 million <strong>and</strong> a high estimate of $296.7 million.157
The additional 95.16 mgd of capacity that will be needed by 2030 will cost an estimated $563million based on the cost estimates for the expansion of the Empire WWTP. The low estimate is$394.1 million <strong>and</strong> the high estimate is $731.9 million.Based on the cost estimates for the expansion project at the Empire WWTP, it will cost $794.8million to add the additional 134.33 mgd of capacity that will be needed in the Region by 2030.The low estimate is $556.4 million <strong>and</strong> the high estimate is $1,033.2 million.Table 7-13: <strong>Wastewater</strong> Cost Estimates 2010-2030, Based On The Empire WWTP Project CostYear Additional Capacityneeded to operate at75% of AADDCost(in millions)Low Estimate(in millions)High Estimate(in millions)Current Backlog 0.60 mgd $3.6 $5.5 $7.86By 2010 0 mgd $0 $0 $0Between 2010 <strong>and</strong>38.57 mgd $227 $353.56 $505.082020Between 2020 <strong>and</strong>95.16 mgd $560 $872.3 $1,246.142030TOTAL 134.33 mgd $790 $1,231 $1,759Source: SFRPC, Dakota County (MN)The third project used to determine cost estimates for the Region’s wastewater needs was theMichigan Road <strong>Wastewater</strong> Treatment Plant expansion project, in Clay Township, IN. Theproject will increase the capacity of the plant by 1.5 mgd, from 1.05 mgd to 2.55 mgd. It alsoinvolves a new headworks screening facility, a Vertical Loop Reactor (VLR) oxidation basin, newultraviolet disinfection, <strong>and</strong> improvements to the existing wastewater treatment plant process.The total cost of the project is estimated to be $10 million. This is $6.67 million per million gallonsof increased capacity. A range of 30 percent above <strong>and</strong> 30% below cost are also given.Using the cost estimate from the Michigan Road expansion project, the cost to eliminate thecurrent backlog in the Region is $4.0 million, with a low estimate of $2.8 million <strong>and</strong> a highestimate of $5.2 million.Because of the expected “surplus” in capacity between now <strong>and</strong> 2010, there is no cost for thattime period. By 2020, the “surplus” will be eliminated, <strong>and</strong> an additional 38.57 mgd of capacitywill be needed. The cost for this, based on the Michigan Road project, is $257.3 million. The lowestimate is $180.1 million <strong>and</strong> the high estimate is $334.4 million.Using the same cost estimate, it would cost $634.7 million to add the 95.16 mgd of capacity thatwill need to be added in the Region between 2020 <strong>and</strong> 2030. The low estimate for this increase is$444.3 million <strong>and</strong> the high estimate is $825.1 million.The total cost of providing the needed capacity in order to keep the Region’s wastewatertreatment plants operating at 75% of capacity during average annual daily dem<strong>and</strong> is $895.9million. The low estimate for the increase is $627.2 million <strong>and</strong> the high estimate is $1,164.8million.158
Table 7-14:<strong>Wastewater</strong> Cost Estimates 2010-2030, Based On The Michigan Road WWTPProject CostsYear Additional Capacityneeded to operate at75% of AADDCost(in millions)Low Estimate(in millions)High Estimate(in millions)Current Backlog 0.60 mgd $4.0 $2.8 $5.2By 2010 0 mgd $0 $0 $0Between 2010 <strong>and</strong>38.57 mgd $257.3 $180.1 $334.42020Between 2020 <strong>and</strong>95.16 mgd $634.7 $444.3 $825.12030TOTAL 134.33 mgd $895.9 $627.2 $1,164.8Source: Clay Township (IN)159
VIII.Task 8 – Financing OptionsSeveral options exist as financing strategies to fund water <strong>and</strong> domestic wastewater facilitiesprojects as provided for in the <strong>Florida</strong> Statutes. For a comprehensive list of statutory citations,please refer to Appendix E. The following section provides examples of commonly employedfinancing strategies that are available to local governments in order to provide the necessaryinfrastructure to sustain infill <strong>and</strong> promote redevelopment.A. Funding For <strong>Water</strong> <strong>Facilities</strong> Projects1. Drinking <strong>Water</strong> State Revolving FundThe <strong>Florida</strong> Department of Environmental Protection (DEP) helps to fund water facilities throughthe Drinking <strong>Water</strong> State Revolving Fund (SRF) Program 25 . The SRF Program is the primaryvehicle for funding drinking water facilities in the State. The Drinking <strong>Water</strong> SRF provides lowinterestloans for planning, designing, <strong>and</strong> constructing public water facilities. Projects eligiblefor SRF loans include new construction <strong>and</strong> improvements of public water systems, includingstorage, transmission, treatment, disinfection, <strong>and</strong> distribution facilities.Federal <strong>and</strong> State appropriations have funded the SRF. It is a "revolving" fund because loanrepayments are used to make additional loans. By federal law, the SRF is to be operated inperpetuity. DEP solicits project information each year, typically from January 1 to February 15.The information is used to establish the project priority list for the following annual cycle. Fundsare made available for Pre-construction Loans to rate-based public water systems, ConstructionLoans of $75,000 minimum or more, <strong>and</strong> Pre-construction Grants <strong>and</strong> Construction Grants tofinancially disadvantaged communities. The Loan Terms include a 20-year (30-year forfinancially disadvantaged communities) amortization <strong>and</strong> low-interest rates. Small communityassistance is available for communities having populations less than 10,000. Each year 15% of thefunds is reserved exclusively for their use. In addition, small communities may qualify for loansfrom the unreserved 85% of the funds.Cities, counties, authorities, special districts <strong>and</strong> other entities (representing privately owned,investor-owned, or cooperatively held public water systems) legally responsible for public waterservices are eligible for loans. Loan funding is based on a priority system, which takes intoaccount public health considerations, compliance with the Federal Safe Drinking <strong>Water</strong> Act orother enforceable requirements relating to drinking water systems, <strong>and</strong> affordability.Affordability includes the evaluation of median household income, population affected, <strong>and</strong>consolidation of very small public water systems, which serve a population of 500 people orfewer. Only project sponsors owning community water systems or non-profit water systems areeligible to receive financial assistance. Projects for which the total cost is less than $75,000 are noteligible. A project sponsored by a for-profit private owner or investor-owner of a communitywater system that regularly serves 1,500 service connections or more within a single certified orfranchised area is not eligible unless the project will result in the consolidation of two or morepublic water systems.For the purposes of the SRF, community water system is a public water system which serves atleast 15 service connections used by year-round residents or regularly serves at least 25 yearroundresidents. The systems include cities, towns, subdivisions, <strong>and</strong> mobile home communities.25 Source: <strong>Florida</strong> Department of Environmental Protection, http://www.dep.state.fl.us/160
A non-profit non-community system is a water system that is owned by a non-profit <strong>Florida</strong>corporation qualifying for such status under Chapter 617, F.S., the <strong>Florida</strong> Not For ProfitCorporation Act. The system must provide water to at least 15 service connections or serves atleast 25 individuals at least 60 days out of the year. The systems typically are systems that serveBoy Scout <strong>and</strong> Girl Scout camps, church camps, homeless shelters, or halfway houses. A nonprofitnon-transient non-community system is a public water system that is not a communitywater system <strong>and</strong> that regularly serves at least 25 of the same persons over six (6) months peryear. These systems include businesses, schools, <strong>and</strong> similar establishments that meet therequirements of the Chapter 617, F.S.Pre-construction loans are available for rate-based public water systems that have a public healthrisk priority issue. A project sponsor must qualify as a small community unless the projectpriority is based, in part, on consolidation or rationalization. Pre-construction loans for theplanning, engineering, <strong>and</strong> administrative allowances provide rate-based community watersystems funds to complete the planning <strong>and</strong> engineering work necessary to proceed with projectconstruction. Pre-construction loans are limited by a maximum project cost of $2 million.Construction loans, available to almost all public water systems regardless of size, providefunding for construction after the planning <strong>and</strong> design activities are completed. Disbursementsare made to the entity after costs are incurred, generally on a monthly basis. Construction loansmust meet the following requirements:1. Submit a construction plan that is cost-effective, environmentally <strong>and</strong> financiallysound, <strong>and</strong> consistent with the local comprehensive plan.2. Insure public participation in the planning process.3. Establish how the loan will be repaid.4. Have acquired the necessary project sites.5. The construction design must be consistent with the planning recommendations.6. Have obtained the necessary permit(s) to enable construction.7. Complete a value engineering report for projects valued at more than $5,000,000.Pre-construction grants are available to economically disadvantaged communities. A projectsponsor must qualify as a financially disadvantaged community <strong>and</strong> must qualify as a smallcommunity. Grants are limited to rate based community water systems only. A project includesthe planning, engineering, <strong>and</strong> administrative activities necessary to qualify for funding of aconstruction project. Pre-construction grants at 85% of allowances are provided, as long as themedian household income in the community is less than the statewide average <strong>and</strong> thecommunity has an associated public health risk component associated with the project. Preconstructiongrants are limited by a maximum project cost of $2 million.Construction grants are also available to project sponsors that qualify as financiallydisadvantaged communities. Grants are awarded only for projects for which a public health riskcomponent is assigned. Projects must meet the user charge (or equivalent) financial burden,benefit limitation, <strong>and</strong> priority criteria as defined in the drinking water rule. Grant funding forqualifying project sponsors is limited to 65% or 85% of the estimated post-allowance costs for thepublic health component. Construction grants are limited to 25% of available funds or $750,000in any single year, whichever is less. Projects qualifying for grants in excess of the amountavailable from DEP in a single fiscal year will be segmented for deferred funding in subsequentyears. The minimum segmented grant amount available in any one year will be the lesser of theestimated adjusted post-allowance project costs or $375,000 subject to the 25% limitationreferenced above. Grantees are required to meet the following requirements:161
1. Submit a construction plan that is cost-effective, environmentally <strong>and</strong> financiallysound, <strong>and</strong> consistent with the local comprehensive plan.2. Insure public participation in the planning process.3. Establish how the loan will be repaid.4. Have acquired the necessary project sites.5. The construction design must be consistent with the planning recommendations.6. Have obtained the necessary permit(s) to enable construction.7. Complete a value engineering report for projects valued at more than $5,000,000.The repayment period for loans is typically for 20 years. However, loans to financiallydisadvantaged communities may be for 30 years. The interest rate is 60% of the market rate asestablished using the "Bond Buyer 20 - Bond General Obligation Bond Index". The rate is a fixedrate <strong>and</strong> repayment begins six months after project work is scheduled to be completed. Paybackconsists of equal semiannual repayments <strong>and</strong> the revenue source to be used to repay the loanmust be identified. St<strong>and</strong>ard loan agreements are set up for a pledge of water <strong>and</strong> sewer utilityrevenues. These are commonly used but other types of revenues can be considered. Generally,pledged revenues resulting from the operation of water systems or water <strong>and</strong> sewer systemsshall be as follows:1. Pledged revenue shall be not less than 1.15 times the amount required to make eachsemiannual loan repayment.2. For project sponsors who have not demonstrated the ability to service long term debt,special loan security provisions shall be negotiated that provide assurance that debtservice requirements will be fulfilled. These provisions include:a) Additional escrowed reserve funds (equivalent to not less than five semiannualloan repayments) <strong>and</strong> a lien on the assets of the project sponsor.b) A letter of credit from a bank or trust company <strong>and</strong> a lien on the assets of theproject sponsor.c) A personal or corporate, as applicable, obligation ensuring that all semiannualrepayments can be made.d) Other security features equivalent to those described above.162
2. <strong>Water</strong> Supply Restoration ProgramThe <strong>Water</strong> Supply Restoration Program (WSRP) 26 was created in the mid-1980's to restore orreplace drinking water wells contaminated with Ethylene Di-Bromide (EDB). Throughagreement of a multi-agency task force, the Department of Agriculture <strong>and</strong> Consumer Servicesperformed early restoration <strong>and</strong> replacement of EDB-contaminated wells. In 1990, theseresponsibilities were transferred to the Department of Environmental Protection. Specifically,Chapter 376.30(3)(c), F.S. directed the Department to "establish a program to provide forexpeditious restoration or replacement of potable water systems or potable private wells ofaffected persons where health hazards exist due to contamination from pollutants." This includesa provision for bottled water on a temporary basis, after which a more stable <strong>and</strong> convenientsource of potable water shall be provided through the use of filters or connection to public watersystems. Funding for this program is provided by <strong>Water</strong> Quality Assurance Trust Fund(WQATF) <strong>and</strong> the Inl<strong>and</strong> Protection Trust Fund (IPTF). The WQATF is used for restoration orreplacement of potable water supplies contaminated with non-petroleum substances <strong>and</strong> theIPTF is used strictly for the restoration or replacement of potable water supplies contaminatedwith petroleum related substances.To qualify for WQATF or IPTF funding, water-sampling results must show that the contaminantsin the potable water supply exceed a Maximum Contaminant Level (MCL), or Health AdvisoryLevel (HAL), or be determined by the Department of Health (DOH) to be a health hazard.Approximately $300,000 to $500,000 is spent annually on IPTF sites <strong>and</strong> $3,500,000 is spentannually on WQATF sites. Restoration/replacement work has been conducted in 45 countiesthroughout the State.B. Funding For Domestic <strong>Wastewater</strong> ProjectsThe <strong>Florida</strong> Department of Environmental Protection (DEP) helps to fund domestic wastewaterprojects through the State Revolving Loan Fund (SRF), the State Financially Disadvantaged SmallCommunity Grant, <strong>and</strong> the State Bond Loan programs. The SRF is administered by DEP throughthe Bureau of <strong>Water</strong> <strong>Facilities</strong> Funding. It makes low-interest loans available for construction,rehabilitation, <strong>and</strong> replacement of facilities needed to collect, treat, dispose of, or reuse municipalwastewater. It is a revolving fund because loan repayments are used to make additional loans.Over the past 10 years, domestic wastewater treatment facilities received over 0.9 billion dollarsthrough the state revolving loan fund. Many domestic wastewater projects throughout the statereceived a significant portion of these monies. The State Financially Disadvantaged SmallCommunity Grant program is administered by the DEP through the Bureau of <strong>Water</strong> <strong>Facilities</strong>Funding. It will make available 65 to 85 percent grants for wastewater improvements tocommunities with population of 7,500 or less in which the per capita income is below the stateaverage per capita income. The first grants were offered about July 2000. The State Bond Loanprogram is jointly administered by the DEP <strong>and</strong> the Division of Bond Finance of the State Boardof Administration. Cities, counties, districts, authorities, <strong>and</strong> other local agencies are eligible forreceipt of this loan. This fund can be used for the construction of domestic wastewater facilities.26 Source: <strong>Florida</strong> Department of Environmental Protection, http://www.dep.state.fl.us/163
1. <strong>Wastewater</strong> State Revolving Fund Loan ProgramThe Clean <strong>Water</strong> Act State Revolving Fund (SRF) Program, which provides low interest loans forwater pollution control activities <strong>and</strong> facilities is the primary vehicle for funding wastewaterfacilities in the State. <strong>Water</strong> pollution control can be divided into point source (such as a permitfor discharge in an urban area) <strong>and</strong> non-point source (such as stormwater runoff fromagricultural operations). The Clean <strong>Water</strong> SRF Program is distinct from the Safe Drinking <strong>Water</strong>Act SRF that provides funding for drinking water activities <strong>and</strong> facilities. The Clean <strong>Water</strong> SRFProgram began in 1989 <strong>and</strong> over a billion dollars in loans have been made by the <strong>Florida</strong>Department of Environmental Protection. The Program was exp<strong>and</strong>ed to make stormwatermanagement eligible for funding. The Program revolves in perpetuity using state <strong>and</strong> federalappropriations, loan repayments, investment earnings, <strong>and</strong> bond proceeds. Projects eligible forSRF loans include wastewater management facilities, reclaimed wastewater reuse facilities,stormwater management facilities, widely accepted pollution control practices (sometimes called"best management practices") associated with agricultural stormwater runoff pollution controlactivities, <strong>and</strong> estuary protection activities <strong>and</strong> facilities.The SRF Program provides low-interest loans for planning, designing, <strong>and</strong> constructingwastewater facilities. Federal <strong>and</strong> State appropriations have funded the SRF. It is a "revolving"fund because loan repayments are used to make additional loans. By federal law, the SRF is to beoperated in perpetuity. The Department solicits project information each year. The informationis used to establish project priorities for the following annual cycle. Funds are made available forPre-construction Loans <strong>and</strong> Construction Loans. The Loan Terms include a 20-year amortization<strong>and</strong> low-interest rates. Pre-construction loans are available to all communities <strong>and</strong> provide upfrontdisbursements for administrative services, project planning <strong>and</strong> project design. Eligibility isestablished in the federal Clean <strong>Water</strong> Act. Local governments (municipalities, counties,authorities, special districts, <strong>and</strong> agencies thereof) are eligible for loans to control wastewater <strong>and</strong>stormwater pollution. Non-governmental parties (basically any entity that can repay a loan) areeligible for loans to control stormwater pollution related to agricultural operations.The need for funds to address wastewater needs in <strong>Florida</strong> far exceeds the amount availableunder the SRF. The U.S. Environmental Protection Agency in its 1996 Clean <strong>Water</strong> Needs Surveyprovided estimates of funding need. The State of <strong>Florida</strong>’s estimated sewer needs were $5.4billion. From 1989 to 2000, DEP issued approximately $566 million in funds <strong>and</strong> the loanrepayment stream in 1999 was $47 million. The Clean <strong>Water</strong>sheds Needs Survey <strong>and</strong> Report toCongress (CWNS), a joint effort of the States <strong>and</strong> the Environmental Protection Agency isconducted every four years. The CWNS compiles estimates of capital costs for projects that treatwastewater, stormwater, non-point source pollution <strong>and</strong> programs designed to protect estuaries.The 2004 CWNS is not yet released.The SRF interest rate is a below-market rate. While the value of the subsidy varies with theindividual borrower's credit rating, an example may serve to illustrate the SRF savings. A localgovernment with a very good AA bond rating would pay 177% as much in total interest on a5.5%, 20-year marketplace loan as it would on a 3.3%, 20-year SRF loan. For a one million dollarloan, that is an extra $287,000 in interest that would have to be paid to the bondholders to getmarketplace financing. There are other less substantial financial advantages, such as a moreadvantageous SRF debt service reserve requirement. The savings available to communities thathave less favorable bond ratings (or none at all) would be greater than for the example given.The SRF Interest Rate for January- March 2005 is 2.70%.164
Pre-construction loans are available to all eligible applicants. The loan provides up-frontdisbursements for project planning, administrative services <strong>and</strong> project design. The loans alsoprovide a mechanism for continued funding for project costs, including construction. Planning<strong>and</strong> design do not need to be complete to qualify. Applications are required to identify <strong>and</strong>develop a schedule for project planning, engineering, <strong>and</strong> administrative activities; establish howthe loan funds disbursed for planning, design, <strong>and</strong> administrative services will be repaid; <strong>and</strong>develop a preliminary estimate for the project cost.Construction loans, available to all local governments regardless of size, provide moneys forconstruction after planning <strong>and</strong> facility design activities are complete. Disbursements are made tolocal governments after costs are incurred during construction <strong>and</strong> generally on a monthly basis.Construction loans must meet the following requirements:1. Construction plans must be cost-effective, environmentally <strong>and</strong> financially sound.2. <strong>Facilities</strong> must be consistent with local comprehensive plans.3. Provide for public participation in the planning process.4. Establish how the loan will be repaid.5. Have acquired the necessary project sites.6. The design facilities must be consistent with the planning recommendations <strong>and</strong>identified needs.7. Have obtained the necessary permit(s) to enable construction.At the beginning of each fiscal year, small communities having populations less than 20,000 areentitled to priority use of 15% of all loan funds. In addition, small communities qualify for loansfrom the unreserved 85% funds. All projects are prioritized for funding according to a systemthat favors small projects regardless of who the project sponsor is.Loans are to be repaid over the useful life of the project up to a maximum of 20 years. Loans toproject sponsors qualifying as financially disadvantaged communities may obtain loans for 30years. Pre-construction loans <strong>and</strong> loans for the costs associated with pollution control associatedwith agricultural runoff have shorter loan repayment periods, generally 10 years. The interestrate for loans is a fixed rate <strong>and</strong> is calculated at 60% of the market rate, as established using the"Bond Buyer 20 - Bond General Obligation Bond Index". Repayment typically begins six monthsafter project work is scheduled to be completed <strong>and</strong> is consists of equal semiannual repayments.The revenue source to be used to repay the loan must be identified <strong>and</strong> st<strong>and</strong>ard loan agreementsare set up for a pledge of water <strong>and</strong> sewer utility revenues. These are commonly used but othertypes of revenues can be considered. Generally, pledged revenues resulting from the operationof water systems or water <strong>and</strong> sewer systems are as follows:1. Pledged revenue shall be not less than 1.15 times the amount required to makeeach semiannual loan repayment.2. For project sponsors who have not demonstrated the ability to service long termdebt, special loan security provisions shall be negotiated that provide assurancethat debt service requirements will be fulfilled. The provisions can include:a) Additional escrowed reserve funds (equivalent to not less than fivesemiannual loan repayments) <strong>and</strong> a lien on the assets of the project sponsor.b) A letter of credit from a bank or trust company <strong>and</strong> a lien on the assets of theproject sponsor.c) A personal or corporate, as applicable, obligation ensuring that allsemiannual repayments can be made.d) Other security features equivalent to those described above.165
2. <strong>Wastewater</strong> Grants Program<strong>Wastewater</strong> grants for financially disadvantaged small communities are authorized by Chapter62-505, F.A.C. , for the Financially Disadvantaged Small Community Program. It will makeavailable 65 to 85 percent grants for wastewater improvements to communities of 7,500population or less in which the per capita income is below the state average per capita income.Funding for these grants began in year 2000, with <strong>Florida</strong> City is the only <strong>South</strong> <strong>Florida</strong>Community on the priority list. However, because the requests for wastewater grants greatlyexceeded the available funds, it is not anticipated grant funding for new projects to be availablein the near future. The funding is expected to grow from $2.5 million for the year beginning July1, 2000 to about $10 million per year by the end of 2010 using current projections. The programwill fund planning, designing, <strong>and</strong> constructing collection, transportation, treatment, disposal(<strong>and</strong> reuse) wastewater facilities. Grants will not fund operation <strong>and</strong> maintenance costs. The toppriority projects must address the elimination of a public health hazard. Projects that willachieve compliance with regulatory agency requirements are next in priority. The amount ofwastewater causing the problem is a significant criteria to determine funding. The grants cannotbe used to purchase existing facilities.To be eligible to participate in the Financially Disadvantaged Small Community Program, thefollowing criteria must be met:1. Municipalities only are eligible (no counties or special districts).2. Maximum 1990 population of 7,500.3. 1990 per capita income less than $19,107.4. A community cannot be a financially disadvantaged pocket within a municipality thatdoes not meet all the criteria above.C. Funding For <strong>Water</strong> And Domestic <strong>Wastewater</strong> <strong>Facilities</strong> Projects1. State of <strong>Florida</strong> Bond Loan ProgramThe State Bond Loan Program is jointly administered by the Department of EnvironmentalProtection <strong>and</strong> the Division of Bond Finance of the State Board of Administration. Anymunicipality, county, authority, or district, or sub agency of these entities, may obtain fundingfor projects. <strong>Water</strong> supply <strong>and</strong> distribution facilities, stormwater control <strong>and</strong> treatment projects,air <strong>and</strong> water pollution control, <strong>and</strong> solid waste disposal facilities are eligible. Up to $300 millionin State of <strong>Florida</strong>, tax exempt, full faith <strong>and</strong> credit, Pollution Control Bonds may be issuedannually at market rates. Applicants are served on a first come, first served basis. There arefinancial analysis, bond validation, <strong>and</strong> bond marketing activities that require in excess of sixmonths to complete.There is not an interest rate subsidy associated with these loans; the loans come from State of<strong>Florida</strong> full faith <strong>and</strong> credit revenue bonds. Bonds are sold on a competitive bid basis <strong>and</strong> reflectmarket conditions <strong>and</strong> are tax exempt. The advantage to getting a loan under this program isthat using the State’s credit rating, interest rates may be lower than what is available directly to alocal government. The cost to issue the debt is low using the bond counsel <strong>and</strong> underwritingservices available to the State. The pledged revenues usually are generated by the utility beingimproved by the project facilities. The program can provide $300 million per year. Loans lessthan $10 million probably would be packaged with other loans. Loans in the million-dollar range166
may not be practical. Projects involving numerous small contracts, work orders, purchase orders,etc. are not practical under this program.The Program dose not have planning, design, or permitting requirements, as required by the SRFProgram. However, there are construction time constraints related to the tax-exempt status of theState’s bonds. Basically, projects must be ready for bidding when the loan is requested. Loanproceeds are disbursed on a cost incurred basis, similar to the SRF program. The applicantprovides the following information to the Department of Environmental Protection before bondscan be validated <strong>and</strong> sold by the State Board of Administration (Division of Bond Finance):1. A resolution authorizing the application, loan amount, <strong>and</strong> pledge of revenues.2. An ordinance(s) authorizing the rates, charges, <strong>and</strong> fees to be collected as pledgedrevenues.3. A schedule for completing the project, loan disbursements, <strong>and</strong> loan repayments.4. Legal opinions as to the availability of pledged revenues <strong>and</strong> the right to increase rates.5. A description of the local economic situation <strong>and</strong> existing/anticipated debt affectingthe availability of pledged revenues.6. Audited financial statements <strong>and</strong> interlocal agreements, if applicable.7. An engineering report describing the history <strong>and</strong> organization of the utility, servicearea, planning period, existing facilities, capital improvement program, projectdescription, cost estimate, need for the project, number of customers, utility billing, <strong>and</strong>utility income <strong>and</strong> expenses.8. Plans <strong>and</strong> specifications, permit status, <strong>and</strong> confirmation of consistency with the localcomprehensive plan.2. Local Government BondsIn <strong>Florida</strong>, local governments may issue bonds, which are instruments of indebtedness, to financethe costs of public improvement projects, including water <strong>and</strong> wastewater projects. Generally,two types of bonds are utilized: general obligation bonds <strong>and</strong> revenue bonds. Typically, becauseof the constraints of general obligation bonds, revenue bonds are more commonly used to financewater <strong>and</strong> wastewater projects.General obligation bonds are backed by the “full faith, credit <strong>and</strong> taxing authority” of a localgovernment. The bonds are payable from the revenues from ad valorem taxes on real or tangiblepersonal property. The bonds must be only be issued after a voter referendum approving thebonds. Other security may be provided to back the bonds, such as special taxes, or any otherallowable revenue source as long as the ordinance that adopts the bonds specifies how the bondswill be repaid.Revenue bonds, on the other h<strong>and</strong>, are repaid by the revenues generated by the enterprise, suchas a water or wastewater system, for which the bonds are being generated. Revenue bonds arenot backed by the “full faith, credit <strong>and</strong> taxing authority” of a local government. The revenuebonds may be for any capital expenditure that a local government deems is a public purpose,including the refunding of any bonded indebtedness that may be outst<strong>and</strong>ing on an existingproject that is to be improved because of a new project. However, if the revenues from theenterprise being funded are not adequate to fund expenses, the local government issuing thebonds must use general revenue funds (or any other allowable funding) to meet the revenueshortfall to avoid defaulting on the bonds. A default could negatively affect the localgovernment’s overall credit rating.167
Allowable funding to back revenue bonds includes proceeds from certain non-ad valorem taxes<strong>and</strong> special assessments. A local government may pledge all or part of existing tax revenuesources other than ad valorem taxes to meet the debt service requirements of revenue bonds.Other tax sources that may be utilized include local sales taxes, public service taxes, <strong>and</strong> staterevenue sharing funds. However, once these funds are pledged to back the revenue bonds, theyare not available to be utilized for any other local government needs. Special assessments may belevied against the property receiving a direct benefit from the project being financed with aspecial assessment revenue bond. The proceeds from the assessment then can be used to back therevenue bonds.3. Community Redevelopment AreasThe Community Redevelopment Act of 1969, (Chapter 163, Part III, ss.163.330-163.462, F.S.),allows counties <strong>and</strong> municipalities establish Community Redevelopment Areas (CRAs) to helpfund needed improvements in a designated area that has been found to be experiencingeconomic <strong>and</strong> physical decline due to slum <strong>and</strong> blight conditions. CRAs allow the use of taxincrement financing (TIF), which is a method of generating the funds needed for capitalimprovements, including improvements to the water <strong>and</strong> wastewater systems. The TIF fundingis derived from the incremental tax revenue increase that would be generated by ad valoremtaxes in the CRA from the time of the creation of the CRA until a set period of time, but in caseshall be longer than 30 years. The funds are deposited into a separate trust fund account <strong>and</strong>may only be used for redevelopment activities in the CRA.In order to implement a CRA, a Community Redevelopment Plan must be adopted <strong>and</strong> mustspecially identify the publicly funded capital projects to be undertaken. The Plan must alsoinclude the projected costs of the redevelopment, including the amount to be expended onpublicly funded capital projects <strong>and</strong> any indebtedness of the community redevelopment agency,the county, or the municipality proposed to be incurred for such redevelopment if suchindebtedness is to be repaid with TIF funding.Once a redevelopment plan is adopted, the CRA may utilize the TIF funds. It is important tonote that the tax increment created by a CRA does not result in a significant amount of money inits early stages. However, a CRA can issue revenue bonds against the anticipated future TIFfunds. Please see the previous section on bonds for a discussion of revenue bonds.4. Community Development DistrictsAn option for private developers to create <strong>and</strong> fund water <strong>and</strong> wastewater districts is provided forin Chapter 190, F.S., which creates “Community Development Districts” (CDD). CDDs are localunits of special-purpose government that can be timely, efficient, effective, responsive, <strong>and</strong> providean economic way to deliver community development services, thereby providing a solution to thestate's planning, management, <strong>and</strong> financing needs for delivery of capital infrastructure in order toservice projected growth without overburdening other governments <strong>and</strong> their taxpayers. CDDs arecreated <strong>and</strong> limited to the performance of the specialized functions authorized by Chapter 190, F.S.<strong>and</strong> their creating ordinance. Other requirements for CDDs include that the boundaries for theCDD must be contained wholly within a single county; CDDs must create a governing bodycreated, organized, <strong>and</strong> constituted <strong>and</strong> authorized to function specifically for the delivery of urbancommunity development services; <strong>and</strong> provide for the formation, powers, governing body,operation, duration, accountability, requirements for disclosure, <strong>and</strong> termination of which are asrequired by general law.168
The establishment of an independent CDD as provided for in Chapter 190, F.S., is not adevelopment order within the meaning of chapter 380, F.S. All governmental planning,environmental, <strong>and</strong> l<strong>and</strong> development laws, regulations, <strong>and</strong> ordinances apply to alldevelopment of the l<strong>and</strong> within a CDD. CDDs do not have the power of a local government toadopt a comprehensive plan, building code, or l<strong>and</strong> development code, as those terms aredefined in Chapter 163, Part II, F.S., the Local Government Comprehensive Planning <strong>and</strong> L<strong>and</strong>Development Regulation Act. In addition, a CDD must be consistent with the applicablecomprehensive plan, ordinances, or regulations of the applicable local general-purposegovernment.The developers of a CDD typically issue revenue bonds to fund the needed capitalimprovements. The revenue bonds are then repaid by the revenues generated by the enterprise,in the same manner as revenue bonds issued by a local government. Security for the CDDs is anagreement from the applicable local government that all or a portion of the net benefit that thelocal government receives from the development in the CDD area is returned to the CDD. Thenet benefit is defined as new tax revenues minus new expenditure requirements. The resultingrevenues can be used by the CDD to defray infrastructure costs or to buy down the amount offunding needed to provide for the infrastructure.5. Other Local Government Initiated ProgramsA local government may adopt a fee to be paid by new users of wastewater <strong>and</strong> water serviceswithin their service area. The fee is typically set by type of use <strong>and</strong> the proposed impact. The feeis the estimated pro rata share of the cost of the facilities that will serve the new development.The need for the new facilities is based in whole or in part for the need of new facilities. Theimpact fees collected must be kept separate from other revenues <strong>and</strong> must be used exclusively toacquire, purchase, or construct new facilities. The local government must maintain adequaterecords to ensure that impact fees are expended only for permissible new facilities or equipment.A local government may levy an “Infrastructure Surtax,” with voter approval. The Surtax islimited in rate to either ½ % or 1% of the purchase price of an item subject to the state sales tax.The proceeds must be used to finance, plan, or construct infrastructure, <strong>and</strong> can be pledged topay general obligation or revenue bonds.A municipality may levy a tax on the purchase of water service. The tax can only be levied in themunicipality <strong>and</strong> cannot exceed 10% of the payments received. The proceeds of the tax can beused for any municipal purpose, including water <strong>and</strong> wastewater services.6. Community Development Block Grant ProgramThe Community Development Block Grant (CDBG) Program, administered by the U.S.Department of Housing And Development, provides eligible metropolitan cities <strong>and</strong> urbancounties (called "entitlement communities") with annual direct grants that they can use torevitalize neighborhoods, exp<strong>and</strong> affordable housing <strong>and</strong> economic opportunities, <strong>and</strong>/orimprove community facilities <strong>and</strong> services, principally to benefit low- <strong>and</strong> moderate-incomepersons. <strong>Water</strong> <strong>and</strong> wastewater facilities improvements are eligible for funding.Since 1974, the CDBG Program has been the backbone of improvement efforts in manycommunities, providing a flexible source of annual grant funds for local governments169
nationwide—funds that they, with the participation of local citizens, can devote to the activitiesthat best serve their own particular development priorities, provided that these projects meet oneof the following priorities:1. Benefit low- <strong>and</strong> moderate-income persons;2. Prevent or eliminate slums or blight; or3. Meet other urgent community development needs.The CDBG Entitlement Communities program provides this Federal assistance to almost 1000 ofthe largest localities in the country. As one of the Nation's largest Federal grant programs, theimpact of CDBG-funded projects can be seen in the housing stock, the business environment, thestreets <strong>and</strong> the public facilities of these entitlement communities. Each year, the grant fundsavailable for entitlement communities are allocated according to relative need on the basis of thehigher of two formulas. The first considers the presence of overcrowded housing in the locality,its population, <strong>and</strong> poverty rate. The second uses housing age, population growth lag, <strong>and</strong>poverty rate.Recipients of CDBG entitlement funds include local governments with 50,000 or more residents,other local governments designated as central cities of metropolitan areas, <strong>and</strong> urban countieswith populations of at least 200,000 (excluding the population of entitled cities). Localgovernments may carry out all activities themselves or award some or all of the funds to privateor public nonprofit organizations as well as for-profit entities. A separate component of CDBG—the Small Cities CDBG Program, provides program funds to the States, which they allocateamong localities that do not qualify as entitlement communities.Low- <strong>and</strong> moderate-income persons (generally defined as members of a family earning no morethan 80 percent of the area median income) benefit most directly <strong>and</strong> most often from CDBGfundedactivities. Grantees must use at least 70 percent of CDBG funds for activities thatprincipally benefit low- <strong>and</strong> moderate-income persons. This includes activities where either themajority of direct beneficiaries (from the jobs created, for example, or the housing unitsrehabilitated) are low- or moderate-income persons <strong>and</strong> activities that serve an area generally (anew community center, for example, or water or wastewater line installation or improvements)where the majority of the residents of that service area are low- <strong>and</strong> moderate-income persons.Grantees may use CDBG funds for activities that include (but are not limited to):1. Acquiring real property (primarily l<strong>and</strong>, buildings, <strong>and</strong> other permanentimprovements to the property) for public purposes.2. Reconstructing or rehabilitating housing <strong>and</strong> other property.3. Building public facilities <strong>and</strong> improvements, such as streets, sidewalks, sewers, watersystems, community <strong>and</strong> senior citizen centers <strong>and</strong> recreational facilities.4. Helping people prepare for <strong>and</strong> obtain employment through education <strong>and</strong> jobtraining, welfare-to-work activities, <strong>and</strong> other services.5. Assisting for-profit businesses for special economic development activities.6. Providing public services for youths, seniors, or the disabled. These might include daycare centers, youth services <strong>and</strong> meals on wheels for the elderly, health care facilities,transportation, or counseling.7. Carrying out crime reduction initiatives.8. Assisting low-income homebuyers.9. Enforcing local building codes to reverse housing deterioration <strong>and</strong> other signs ofblight.170
To receive its annual CDBG entitlement grant, a recipient must have an approved ConsolidatedPlan, which fulfills the application <strong>and</strong> reporting requirements for entitlement communities <strong>and</strong>contains an action plan describing how the jurisdiction will use its CDBG funds. If any of theCDBG funding is to be utilized for water or wastewater projects, the projects must be included inthe Consolidated Plan.7. EDA Public Works And Economic Development ProgramThe U.S. Department of Commerce, Economic Development Administration’s (EDA) PublicWorks <strong>and</strong> Economic Development Program assists distressed communities in economic declineto revitalize, exp<strong>and</strong>, <strong>and</strong> upgrade their physical infrastructure to attract new industry,encourage business expansion, diversify local economies, <strong>and</strong> generate or retain long term,private sector jobs <strong>and</strong> investment. The physical infrastructure includes water <strong>and</strong> wastewatersystems. Typically, the funded projects upgrade or exp<strong>and</strong> an area's existing economicinfrastructure to support the new or exp<strong>and</strong>ing industry or commerce. Whenever possible, theprogram attempts to redevelop existing facilities <strong>and</strong> industrial/commercial locations.Redevelopment projects are encouraged because they promote sustainable economicdevelopment by taking advantage of readily available infrastructure <strong>and</strong> markets.Eligible applicants include economic development districts; states, cities or other politicalsubdivisions of a state or a consortium of political subdivisions; Indian tribes or a consortium ofIndian Tribes, an institution of higher learning or a consortium of such institutions; or a public orprivate nonprofit organization or association acting in cooperation with officials of a politicalsubdivision of a State. EDA projects are evaluated competitively <strong>and</strong> must meet both generalcriteria applicable to all programs as well as special criteria that may vary by program. Projectsmust be located in an area exhibiting economic distress at the time of application. Projects locatedoutside these areas may be considered if they directly benefit a distressed area. All Public Worksprojects must be consistent with an EDA-approved Comprehensive Economic DevelopmentStrategy (CEDS). EDA usually funds 50% of project cost, however certain conditions of higheconomic distress or an applicant's inability to provide the matching share may permit a highergrant rate.D. Regional Approaches To <strong>Water</strong> And <strong>Wastewater</strong> <strong>Facilities</strong>In <strong>Florida</strong>, the responsibilities for water <strong>and</strong> wastewater are divided. Pursuant to the <strong>Florida</strong><strong>Water</strong> Resources Act (Chapter 373, F.S.), the responsibility for water resource planning <strong>and</strong> waterresource development has been delegated to the five water management districts in the State.While the <strong>Florida</strong> Legislature has not required local governments to provide water <strong>and</strong>wastewater facilities, enabling legislation has been passed to allow the provision of water <strong>and</strong>wastewater facilities <strong>and</strong> services <strong>and</strong> how to finance the facilities. In some cases, the Legislaturehas adopted statutes that encourage regional <strong>and</strong> multi-county systems.Chapter 153, F.S., <strong>Water</strong> <strong>and</strong> Sewer Systems, addresses how county governments may providefor facilities <strong>and</strong> services. Part I, County <strong>Water</strong> System <strong>and</strong> Sanitary Sewer Financing (ss. 153.01-153.20, F.S.) addresses how water <strong>and</strong> wastewater systems may be financed. The section alsoprovides for how one or more county may join together to form regional systems <strong>and</strong> how theymay be financed. Part II, County <strong>Water</strong> <strong>and</strong> Sewer Districts (ss.153.50-153.88, F.S.) addresses howa county may establish water <strong>and</strong> wastewater systems in unincorporated areas <strong>and</strong> withinincorporated areas of the county. Part III, <strong>Wastewater</strong> Facility Privatization Contracts, providesfor how a county may privatize their water <strong>and</strong> wastewater facilities.171
Chapter 166, F.S., Municipalities, addresses the responsibilities of a municipality in <strong>Florida</strong> <strong>and</strong>how to carry out those responsibilities. The responsibilities include the provision of water <strong>and</strong>wastewater facilities <strong>and</strong> services. The Chapter has four parts, each of which can impact how awater <strong>and</strong> wastewater facilities are provided for <strong>and</strong> funded. The parts of the Chapter are:1. Part One, General Provisions (ss.166.011-166.0497, F.S.)2. Part Two, Municipal Borrowing (ss. 166.201-166.251)3. Part Three, Municipal Finance <strong>and</strong> Taxation (ss.166.201-166.251, F.S.)4. Part Four, Eminent Domain (ss.166.401-166.411, F.S.)172
E. Recommendation For A Regional StrategyAn overview of traditional funding strategies for capital improvement development available tolocal governments, as well as a list of enabling legislation for capital improvement financing, hasbeen provided. In terms of a true regional funding strategy for capital improvements, a specialfunding mechanism must be crafted. A special regional district provides an example of apossible regional funding strategy for capital improvement development.Creation of a Special Regional DistrictTo maintain balanced infrastructure service distribution across the <strong>South</strong> <strong>Florida</strong> region, a multijurisdictionalspecial regional district (SRD) could be established. The district would be allowedto levy special assessments, to issue bonds <strong>and</strong> exercise eminent domain. Since SRDs areempowered to carry out their specific functions, the incorporated SRD could use its powers toengage in a series of activities to procure funding.The SRD could generate revenue through tax-increment financing <strong>and</strong> pursue federal, state, <strong>and</strong>foundation grants. These funds could be applied towards infrastructure development, publicimprovement <strong>and</strong> community needs. To justify the funding strategies <strong>and</strong> to assess existing <strong>and</strong>future need, the SRD would serve as a centralized clearinghouse by inventorying <strong>and</strong> monitoringthe entire district’s infrastructure performance. With this information, the SRD could focusenergy <strong>and</strong> resources in strategic areas with the greatest need. In this manner, the regionalapproach may lead to a more efficient use of resources. Where appropriate in the Region, localgovernments could collaborate to develop a proposed through legislation for the creation of anSRD.This section identifies a number of useful funding strategies, which based on local needs, couldbe utilized by local governments. Additional information can be found in Appendix E <strong>and</strong> in theLocal Government Financial Information H<strong>and</strong>book, 2004 Edition, prepared by the LegislativeCommittee on Intergovernmental Relations, May 2005.172
Appendix ATask 1 - Initial Findings
<strong>South</strong> <strong>Florida</strong><strong>Water</strong>, <strong>Wastewater</strong>, <strong>and</strong> <strong>Stormwater</strong><strong>Facilities</strong> <strong>Study</strong>Task 1 – Initial FindingsSFWMD Project #C-15798Prepared by the<strong>South</strong> <strong>Florida</strong> Regional Planning CouncilSeptember, 2003
Overview of Task 1The <strong>South</strong> <strong>Florida</strong> <strong>Water</strong>, <strong>Wastewater</strong>, <strong>and</strong> <strong>Stormwater</strong> <strong>Facilities</strong> <strong>Study</strong> is divided into eighttasks. It is the purpose of Task 1 to conduct an inventory of existing wastewater, potable water<strong>and</strong> drainage facilities within the <strong>South</strong> <strong>Florida</strong> Region. The inventory serves two purposes.One, to demonstrate the degree to which inventories of existing public facilities reported in localgovernment comprehensive plans are complete or consistent, <strong>and</strong> two, to establish a baselinepopulation projection to the year 2050 needed to proceed with the next step in this study.The initial findings in this portion of Task 1 are eye opening. As initially assumed, that nocomplete inventory of wastewater, potable water <strong>and</strong> drainage facilities is currently available forthe region from any one source, or rather, there are no consistent or st<strong>and</strong>ardized reportingpractices. An initial map series <strong>and</strong> database for water, wastewater <strong>and</strong> drainage facilities havebeen compiled <strong>and</strong> are included in Appendix A of this report. It is anticipated that this mapseries <strong>and</strong> database will be amended over time as this study progresses.Currently, there are databases complied by various state <strong>and</strong> local agencies. The informationincluded in these databases is generally relied upon to support in growth management <strong>and</strong>capital investment decisions within the region <strong>and</strong> state. Unfortunately, depending upon thedatabase cited, the results can vary. It is not the intent of this study to point fingers, but rather toprovide a complete <strong>and</strong> accurate picture of the public facilities currently available, <strong>and</strong> necessaryto sustain the needs of the region. With over 1.2 million new residents anticipated over the next20 years there a significant amount of capacity would need to be gained in order to accommodatethe projected growth <strong>and</strong> maintain the environmental efficiency of the existing systems.As revealed in the latest proposed comprehensive plan to be submitted for agency review, in July2003, the City of Marathon <strong>Wastewater</strong> Element cited two different totals for the number ofwastewater treatment facilities reported within the jurisdiction. Without an accurate inventory ofall facilities within the region, it is impossible to determine just how many facilities there actuallyare within the jurisdiction, the operating capacity, or levels of treatment. Depending on whomyou ask for verification, you may or may not receiving complete information.In particular, information related to drainage within existing comprehensive plans varies fromplan to plan. The information included within existing comprehensive plans is not sufficient forthis study. Chapter 163 <strong>and</strong> Rule 9J-5 establish broad requirements for comprehensive plans;however, each local government has interpreted these requirements separately <strong>and</strong> there is notalways consistent detail or sources of information, even for shared facilities.For example, in September 2003, Council received a request from the District to review astormwater permit application for a hotel, restaurant <strong>and</strong> gas station development project locatedon 13.5 acres in south Miami-Dade County. The project is located outside of the County’s UrbanDevelopment Boundary but it could not be adequately determined with existing data whether ornot the site is served with central services. Extensions of the sewer <strong>and</strong> water systems outside ofthe Urban Development Boundary are generally inconsistent with the goals <strong>and</strong> policies of theStrategic Regional Policy Plan for <strong>South</strong> <strong>Florida</strong>. Decisions to issue development permits in theregion must be based upon the best available data.As documented in this report, there are many gaps <strong>and</strong> questions in the various infrastructuredatabases that warrant further study <strong>and</strong> refinement. Upon completion of the study, the benefitsof this study may pay dividends many times over if the needs of the region can be addressed <strong>and</strong>functionally coordinated through the local government comprehensive planning process.1
As indicated above, without the ability to provide local governments with a consistent regionaldatabase of public facilities <strong>and</strong> available capacities, poorer decisions related to growthmanagement <strong>and</strong> capital investment decisions within the region can result. With the anticipationof a new round of Evaluation <strong>and</strong> Appraisal Reports (EAR’s), there is an opportunity to providelocal governments with a reliable <strong>and</strong> consistent source of information that can be utilized tomake better decisions.On August 19, 2003 the Council entered into an agreement with the Department of CommunityAffairs to delegate EAR sufficient review authorization to the Council. The Council is thereforein a unique position to provide local government technical assistance <strong>and</strong> promoteintergovernmental coordination. The results of this report can be immediately integrated into theupdate of the Strategic Regional Policy Plan for <strong>South</strong> <strong>Florida</strong> to be adopted by the Council in 2004,<strong>and</strong> utilized within the scope of the State Road 7/U.S. 441 Collaborative Strategic Master Plan. Thestudy will also be useful when reviewing local government comprehensive plan Future L<strong>and</strong> UsePlan amendments <strong>and</strong> Applications for Development Approvals (ADA’s) for Developments ofRegional Impact.Council Staff currently participates in the regular meetings of the Miami-Dade <strong>and</strong> BrowardCounty Planners Technical Advisory Committees. The findings of this study will be shared withlocal practitioners to be considered while updating each of the region’s 72 local governmentComprehensive Plans. The inventory to be created as a part of Task 1 will essentially become thefirst region-wide EAR of the <strong>Wastewater</strong>, Potable, <strong>and</strong> Drainage Comprehensive Plan Elementsthat could be annually updated <strong>and</strong> monitored for continued applicability. Other applicabilitycould be found when reviewing local government <strong>Water</strong> Supply Plans.Data from the District, Department of Environmental Protection (DEP), <strong>and</strong> existing datacontained within Future L<strong>and</strong> Use, Potable <strong>Water</strong>, Waste <strong>Water</strong>, Drainage, <strong>and</strong> Capital <strong>Facilities</strong>Elements of the Broward, Miami-Dade <strong>and</strong> Monroe County Comprehensive Plans <strong>and</strong>Evaluation <strong>and</strong> Appraisal reports was used to compile the initial inventory for Task 1. Data fromcomprehensive plans in the region were reviewed to evaluate the consistency between Countyplans <strong>and</strong> municipalities, such as, the City of Key West; City of Marathon; City of Miami Beach;City of Homestead; <strong>Florida</strong> City; City of North Miami; City of North Miami Beach; City ofSunrise; City of Pompano Beach; <strong>and</strong> the following cities along the State Road 7 corridor inBroward County: City of Hollywood; City of Plantation; City of Lauderdale Lakes; <strong>and</strong> the Cityof Margate.The data included within these comprehensive plans is historic to some degree because theComprehensive Plans for Miami-Dade <strong>and</strong> Broward were first adopted in 1988-1989 <strong>and</strong> therehas only been one EAR cycle since their initial adoption. However, the historic nature of thedata reflects the level <strong>and</strong> accuracy of information routinely provided to review agencies,including the District, Council, <strong>and</strong> Department of Community Affairs (DCA) when reviewinglocal government comprehensive plans. These plans, when adopted, will serve as the base fromwhich local l<strong>and</strong> development decisions <strong>and</strong> capital investments will be made for at least a 10 to20 year time horizon. When this study is completed, it will be the first time that data reportedfrom these local governments within the region have been effectively combined to create animage of the existing facilities.The District recently conducted a survey of utility providers in the region for use in the LowerEast Coast Waster Supply Plan <strong>and</strong> Comprehensive Everglades Restoration Plan. Theinformation from this survey will be incorporated into Task 1 when it becomes available from theDistrict <strong>and</strong> incorporated with the Task 2 deliverable that will identify the service areas for allfacilities.2
Task 1AIdentification of <strong>Water</strong>, <strong>Wastewater</strong> <strong>and</strong> <strong>Stormwater</strong> <strong>Facilities</strong> Reported in Adopted LocalGovernment Comprehensive Plans, EAR Reports, <strong>and</strong> other Public Information Sources.For public agencies, such as the Council, the adopted local government comprehensive plan is acritical source of information in which to base decisions related to growth management. Eachlocal is required to adopt a comprehensive plan that is to be based upon best availableinformation. Among other elements, the plan must contain a <strong>Water</strong>, <strong>Wastewater</strong> <strong>and</strong> <strong>Stormwater</strong>Element. The comprehensive plan must also provide for a 10 to 20 year planning horizon. Thefollowing analysis is a summary of the data reported by local governments in their adoptedcomprehensive plans.Miami-Dade CountyMiami-Dade County <strong>Water</strong> TreatmentIn the 2003 EAR, Miami-Dade County is reporting a system wide water treatment capacity of454.77 mgd <strong>and</strong> a peak water dem<strong>and</strong> of 391.3 mgd. To meet County Level of Service St<strong>and</strong>ardof operation, the rated capacity must be at least 2% above the maximum daily dem<strong>and</strong>, which forMiami-Dade County would be at least 399.13 mgd (Table 1). Reported capacities in the 1989comprehensive plan are included in Table 2.In the 2002, the Miami-Dade <strong>Water</strong> <strong>and</strong> Sewer Department (WASD) reported that it pumped121.3 billion gallons of water from its three water treatment plants <strong>and</strong> sold more than 96.1 billiongallons to its fifteen wholesale purchasers.The Miami-Dade WASD also provides service to 387,000 retail customers <strong>and</strong> fifteen wholesalecustomers from its three water treatment facilities, five auxiliary treatment facilities that serve thesouthernmost area of the County, although the 2003 EAR reports six auxiliary treatment facilities.The Miami-Dade WASD reports that it is designing a new 25 mgd water treatment plant to use amembrane treatment process that will replace the five smaller auxiliary facilities. The new watertreatment plant will have an expansion capacity to 60 mgd <strong>and</strong> is anticipated to be complete in2006. The Biscayne Aquifer is the primary source for raw water supply from the County’s sixmajor wellfields.In projections for future capacity <strong>and</strong> dem<strong>and</strong> to the year 2020, the County has identified a reratingof the Hialeah/Preston system by 10 mgd <strong>and</strong> a re-rate of the Alex<strong>and</strong>er Orr system by30.26 mgd by the year 2005. Additional improvements include a new <strong>South</strong> Dade membranesoftening <strong>Water</strong> Treatment Plant rated at 25 mgd by 2010. A new membrane softening <strong>Water</strong>Treatment Plant in the Northwest Wellfield area rated at 13 mgd <strong>and</strong> another re-rating of theAlex<strong>and</strong>er Orr system by 30 mgd by the year 2015 for a new combined maximum daily capacityof 563.03 mgd in 2020 (Table 3).3
Between the years of 1973 <strong>and</strong> 1985, WASD acquired the following utility systems forincorporation in the regional system.1973 Westwood Lake Inc.1974 <strong>South</strong> Miami Heights Public Utilities Corp.Holl<strong>and</strong> Gardens Co.<strong>South</strong>l<strong>and</strong> Utilities1975 Lake Shaw <strong>Water</strong> Co.City of SweetwaterRex Utilities: Perrine System1976 Miami Lakes UtilitiesPerrine Industrial Park (<strong>Florida</strong> <strong>Water</strong> & Utilities, Inc.City <strong>Water</strong> Co.National <strong>Water</strong> & Utilities Co.1977 Utility Co. of Sweetwater, Inc.Carol City Utilities, Inc.1978 Miami Utilities, Inc.<strong>Florida</strong> <strong>Water</strong> & Utilities, Inc.1979 General <strong>Water</strong>works of <strong>South</strong> <strong>Florida</strong>, Inc.Golden Isles Utilities, Inc1980 Sunshine Utilities Co.North Miami Shores <strong>Water</strong> Co.1995 Rex Utilities, Inc.1996 <strong>South</strong>ern Gulf Utilities, Inc.1997 Dade Utilities, Inc.1998 Broward <strong>Water</strong> ServiceN. Miami Beach Utilities Co.As of 1988 there were no private water or sewer utility companies operating in Miami-DadeCounty. The Miami-Dade WASD provided about 90 percent of the water supply <strong>and</strong> sewertreatment. However, nineteen municipalities operated water distribution systems <strong>and</strong> eighteenmunicipalities operated sewage collection systems. Service is either distributed, or franchised, toeither WASD or one of the municipal systems. Table 4 identifies wholesale users <strong>and</strong> waterdem<strong>and</strong>.Table 1Capacity of County <strong>and</strong> Municipal <strong>Water</strong> Treatment PlantsMiami-Dade County2002Rated Avg. Day Max. Day AvailableCapacity Production Production CapacityFacility (mgd) (mgd) (mgd) (mgd)Hialeah/Preston 225.000 160.6 189.9 35.1Alex<strong>and</strong>er Orr 217.74 169.44 197.5 20.24<strong>South</strong> Dade 12.03 6.7 8.8 3.25(6 Plants – Former Rex)454.77 336.74 396.2 58.57Source: Miami-Dade County4
The Miami-Dade WASD recognizes that County has implemented a number of initiatives topromote infill development <strong>and</strong> community revitalization, including Infill Housing Initiatives;Brownfields Program; Office of Community <strong>and</strong> Economic Development Program; FederalEmpowerment Zone <strong>and</strong> Enterprise Zones; <strong>and</strong> the Quality Neighborhood ImprovementsProgram. These initiatives have the potential to increase water <strong>and</strong> sewer services <strong>and</strong> thatinfrastructure improvements, including new additions <strong>and</strong> rehabilitation of existing deficienciesin the system will be necessary.To prepare the expected increase in dem<strong>and</strong> for its services, WASD completed awater/wastewater needs assessment study. The assessment study recommends 589improvement projects over a 20-year period with costs over $1.1 billion. The results of the WASDassessment will be considered in future work Tasks of this study.Table 2<strong>Water</strong> Dem<strong>and</strong> Projections for Regional <strong>Water</strong> Treatment PlantsMiami-Dade County1987Hialeah/PrestonAlex<strong>and</strong>er OrrAvg. Day Max. Day Avg. Day Max. Day(mgd) (mgd) (mgd) (mdg)1990 170.0 204.0 257.0 288.41995 178.9 214.7 186.8 224.22000 210.6 252.8 217.6 268.92010 219.1 263.0 228.4 292.1Source: Miami-Dade CountyTable 3WASD <strong>Water</strong> SystemCapacity <strong>and</strong> Dem<strong>and</strong> ComparisonMiami-Dade County1995-2020YearMaximum DayCapacity (mgd)1995 427.602000 454.772005 495.032010 520.032015 563.032020 563.03Source: Miami-Dade County5
Table 4Total Potable <strong>Water</strong> Sales in Miami-Dade CountyWholesale <strong>and</strong> Retail UsersIn Millions of Gallons (mgd)Ten-Year Period1993-2002<strong>Water</strong> SoldWholesale 2002 2001 2000 1999 1998 1997 1996 1995 1994 1993Hialeah 8,742 8,384 8,950 8,931 8,989 9,124 9,734 9,997 10,205 10,620Miami Beach 7,456 7,853 8,714 8,102 7,901 8,404 8,612 8,923 9,177 9,103N. Miami Beach 4,411 4,350 5,368 5,232 5,232 4,970 5,230 5,444 5,310 5,646North Miami 1,612 1,862 1,917 2,096 1,890 2,117 2,510 2,405 2,265 2,128Opa-Locka 1,001 1,030 1,206 1,214 1,253 1,276 1,359 1,377 1,447 1,397Miami Springs 918 852 918 953 882 863 943 981 1,129 1,138Hialeah Gardens 687 741 669 590 690 614 146 NA NA NABal Harbor 542 522 596 592 550 555 545 511 540 532North BayVillage 452 450 471 480 475 477 474 480 496 498Medley 434 441 528 630 430 399 492 472 467 463Bay HarborIsl<strong>and</strong>s 405 351 382 375 382 371 382 386 367 354Surfside 336 328 341 342 348 353 358 350 346 372West Miami 292 280 285 267 243 327 343 318 296 302Indian Creek 138 131 156 158 165 151 156 136 156 175Virginia Gardens 8 10 11 55 105 101 113 105 NA NATotal wholesale 27,434 27,585 30,512 30,017 29,535 30,102 31,397 31,885 32,201 32,728Retail 68,679 64,383 68,541 67,454 66,560 66,935 67,514 67,656 68,872 69,169Total water sold 96,113 91,968 99,053 97,471 96,095 97,037 98,911 99,541 101,073 101,897TotalCustomers 398,073 388,169 372,973 369,924 364,957 359,559 353,526 345,249 339,251 328,829Source: Miami-Dade <strong>Water</strong> <strong>and</strong> Sewer DepartmentMiami-Dade <strong>Wastewater</strong> TreatmentThe County’s Regional <strong>Wastewater</strong> Treatment system is divided into three districts, North,Central <strong>and</strong> <strong>South</strong>.The North District <strong>Wastewater</strong> Treatment Plant located at 2575 NE 151 Street, North Miami, <strong>and</strong>was built in 1970 to treat all sewage collected in northern Miami-Dade County. The plant wasoriginally constructed with a capacity of 60 mgd but was increased to 80 mgd in 1981. Effluent isdisposed to a deep-ocean outfall 2.5 miles offshore.The Central District is also known as the Virginia Key Plant, <strong>and</strong> has been in operation since1956. The plant was two facilities with a combined capacity of 121 mgd in 1988. The originalplant built in 1956 with 48 mgd with the second plant being built in 1975 with a capacity of 73mgd. Effluent was disposed of through an ocean outfall extending 18,800 feet into the AtlanticOcean.6
The <strong>South</strong> District <strong>Wastewater</strong> Treatment Plant, located at 8950 SW 232 nd Street, <strong>and</strong> wasoperational in 1983 with a capacity of 75 mgd. Effluent is discharged into nine deep injectionwells.The Miami-Dade WASD reports that it serves approximately 306,000 retail customers <strong>and</strong>thirteen wholesale customers from its three-wastewater treatment plants. The wastewatertransmission system also contains approximately 945 wastewater pump stations. Historic flows<strong>and</strong> treatment for each system is identified in Tables 5 <strong>and</strong> 6.Table 5<strong>Wastewater</strong> Plant Flows in Miami-Dade CountyIn Millions of Gallons (mgd)Ten-Year Period1993-2002Facility 2002 2001 2000 1999 1998 1997 1996 1995 1994 1993North District 35,970 36,463 34,988 36,468 35,042 37,594 35,679 35,693 32,549 31,856Central District 44,581 44,061 44,858 44,017 46,766 45,741 47,403 51,038 48,106 49,634<strong>South</strong> District 35,149 33,479 32,398 33,041 29,817 34,536 33,346 32,598 33,808 34,311Total Plant Flow 115,700 114,003 112,244 113,526 111,625 117,871 116,428 119,329 114,463 115,801Source: Miami-Dade <strong>Water</strong> <strong>and</strong> Sewer Department7
Table 6Total <strong>Wastewater</strong> Treatment in Miami-Dade CountyIn Millions of Gallons (mgd)Ten-Year Period1993-2002<strong>Wastewater</strong>TreatedWholesale 2002 2001 2000 1999 1998 1997 1996 1995 1994 1993Hialeah 10,328 10,825 11,074 11,430 13,438 15,988 13,906 13,954 11,562 11,970Miami Beach 9,301 8,942 9,361 9,675 9,196 10,076 9,697 10,465 9,845 10,245North Miami 4,116 4,032 4,071 4,057 3,608 4,184 3,521 4,007 4,019 4,293Opa-Locka 1,101 2,287 1,135 1,204 1,267 1,382 829 1,063 1,258 1,193Coral Gables 2,537 2,031 1,844 2,370 1,991 1,969 1,605 1,716 1,880 2,291Miami Springs 1,205 1,477 1,328 1,030 1,480 1,799 1,396 1,431 892 733N. Miami Beach 1,125 1,141 1,208 1,171 1,194 1,350 1,475 1,581 1,665 1,593Medley 628 469 514 536 469 418 541 529 450 414<strong>Florida</strong> City 367 317 255 216 173 115 113 112 145 159Homestead ARB* 197 280 241 188 - - 382 539 717 799West Miami 188 198 187 189 194 188 165 146 92 106Hialeah Gardens 197 94 137 166 147 154 123 79 118 111Homestead 97 5 1 237 440 600 689 842 1,112 1,316Dade Aviation** - - - - - - - - - 939Total wholesale 31,387 32,098 31,356 32,469 33,597 38,223 34,442 36,464 33,755 36,162Retail 50,619 45,862 47,862 50,445 51,440 51,071 51,209 51,155 52,329 50,590Unaccounted 33,694 36,043 33,026 30,612 26,588 28,577 30,777 31,710 28,379 29,049Total water treated 115,700 114,003 112,244 113,526 111,625 117,871 116,428 119,329 114,463 115,801TotalCustomers 306,061 294,000 283,656 280,594 273,576 270,639 263,649 255,724 250,007 241,308TotalRainfall (in.)*** 73.1 79.7 54.4 59.0 66.7 71.7 59.2 89.4 70.0 66.8* Classified as retail customer in years 1996 through 1999** Classified as retail customer as of 1994***Recorded at Miami International AirportSource: Miami-Dade <strong>Water</strong> <strong>and</strong> Sewer DepartmentThe County’s data <strong>and</strong> analysis for the Sanitary Sewer Element in the 1988 Comprehensive planidentifies the City of Homestead <strong>and</strong> <strong>Florida</strong> City with municipal wastewater plants <strong>and</strong> 33minor treatment plants serving private development. However, Table 7 identifies 37 activeplants. Additionally, the data <strong>and</strong> analysis also reports the City of Homestead <strong>Wastewater</strong>Treatment Plant to be approaching peak flow capacities <strong>and</strong> that the <strong>Florida</strong> Department ofEnvironmental Protection is considering to reduce the plant’s rating to 2 mgd In the SanitarySewer Element of 1988 Comprehensive Development Master Plan, the County utilizes a percapita flow of 100 gallons per day to estimate total flow needed to accommodate the 2,183,267residents projected for the year 2005. The County has divided the service area into 31 collectionzones.8
Table 7<strong>Wastewater</strong> Treatment Plants inMiami-Dade County1988AverageDesign Flow as % of EffluentFacility Flow Design Flow DisposalMiami-Dade Regional PlantsNorth District, 2575 NE 151 St. 80.0 94.4 Ocean OutfallCentral District, Virginia Key 121.0 102.0 Ocean Outfall(Capacity Re-rating pending) (133.0) (92.7)<strong>South</strong> District, 8950 SW 232 St. 75.0 82.0 Deep Well InjectionMunicipal Plants<strong>Florida</strong> City, 500 NW 5 St. 0.7 66.2 Soakage PitHomestead, 551 SE 8 St. 2.25 63.9 Ponds & TrenchesMinor Treatment PlantsAmerican Village MHP, 19800 SW 180 Ave. .200 26.5 Soakage PitAthena Apts., 6775 SW 44 St. .015 28.3 Soakage PitAtomic Sewage Plant, 6900 NW 58 th St. .030 57.8 FEC CanalAugust Minor Apts., 8951 NE 8 Ave. .016 70.3 Soakage PitBeefsteak Charlie, 13190 S. Dixie Hwy. .011 36.4 DrainfieldBoystown of Fla., 11400 SW 137 Ave. .350 6.1 DrainfieldCasa Gr<strong>and</strong>e Apts., 8701 SW 141 St. .020 58.8 Soakage PitChekika State Park, SW 237 Ave/168 St .025 40.8 DrainfieldCricket Club Condo, NE 114 St./Bisc. Blvd. .015 63.5 Soakage PitEl Escorial Townhouses, SW 69 Ct/42 Ter. .030 50.0 Soakage PitGlades Office Bldg., SW 354 St/179 Ave. .010 22.5 Soakage TrenchHamilton Group Bldg., 6850 Coral Way .005 20.0 Soakage TrenchHelman Court Apts., 15401 Biscayne Dr. Deactivated 10/2/87Howard Johnson’s, 7330 NW 36 St. .040 74.4 Soakage PitInscho Warehouse, NW 62 St/78 Ave .015 43.3 Soakage PitKOA of N. Miami Bch., 14075 Biscayne Blvd. .015 42.2 Soakage PitKOA, 20675 SW 167 Ave. .050 55.5 Soakage PitU.S. Immigration Ctr., Krome Ave/SW 12 St. .120 37.0 Open DrainLakeview Garden Apts., 7711 Miller Dr . .030 37.9 DrainfieldLudlam Plaza Apts., 1247 SW 67 Ave. .012 72.9 DrainfieldMiami Shores Condo, 9020 NE 8 Ave. .040 22.2 Soakage PitMiller Lakes Apts., 5500 SW 77 Ct. .040 98.4 Soakage PitNorthgate Townhouse, 1701 NE 115 St. .050 59.3 Soakage PitPine Lake MHP, SW 165 St/SW 137 Ave. .200 88.6 Soakage PitPantry Pride, NW 103 St/7 Ave. .015 53.3 DrainfieldQuail Roost MHP, 17101 SW 200 St. .186 63.4 DrainfieldRedl<strong>and</strong>s MHP, 17360 Silver Palms Dr. .015 72.5 Soakage PitScottish Inn, 1223 NW 1 Ave, Fla. City .004 60.0 Soakage Pit79 St. Farmers Market, 3070 NW 79 St. .040 21.0 Soakage PitThe Shores Villas, 8901 NE 4 Rd. .040 40.6 Soakage PitS. Miami High School, 6856 SW 53 St. .075 5.3 Soakage Pit<strong>South</strong> Shores Shop Ctr., SW 136 St/US 1 .040 30.9 Soakage PitSpanish Court Apts, 3995 SW Ave. .010 70.0 Soakage PitSpring Tree Apts, 3845 SW 103 Ave. .020 90.0 Soakage PitSunrise Point Condo, SW 128 St/82 Ave . .040 30.7 Soakage PitSunrise School, 22300 SW 162 Ave. .015 23.3 Soakage PitTurkey Point Power, Palm Dr/Biscayne Bay .018 40.3 Gravity WellVillage Professional Bldg, 9345 NE 6 Ave. .003 16.7 Soakage Pit9
The anticipated that upgrades to existing wastewater treatment plants would accommodate theprojected growth with the following plant capacities (Table 8).Table 8Projected Future <strong>Wastewater</strong> Plant CapacityMiami-Dade County1985-20051985 1995 2005Facility (mgd) (mgd) (mgd)North District 80 100 120Central District 121 133 133<strong>South</strong> District 75 112.5 131Source: Miami-Dade CountyMiami-Dade County <strong>Stormwater</strong> TreatmentAs described in the Drainage Element of the 1988 Comprehensive Development Master Plan, “thedrainage system is unknown; precise locations of some older portions of it are either not knownor buried among innumerable aged documents in public works departments”. The element goeson to say that flood protection has declined (to unknown levels in some basins) since canals weredug because of urbanization’s concomitant increase in impervious area, <strong>and</strong> a comprehensivebasin-by-basin drainage engineering study could do much to exp<strong>and</strong> the County’s knowledge ofits own drainage system.In Table 9 below, the Miami-Dade Comprehensive plan identifies the following major canals, butdoes not identify secondary canals such as the L-31E, C-1W, C1-N, C-100C, C-103 S, C-103N thatappear on the Primary <strong>and</strong> Secondary Canal Map Series.10
Table 9Miami-Dade County Drainage CanalsBasin Area <strong>and</strong> Design StormBasinCanal Canal Square DesignNumber Name Miles Year StormC-9E Snake Creek 21.8 100C-9W Snake Creek 17.2 -C-8 Biscayne 31.5 100C-7 Little River 35.0 100C-6 Miami 69.0 100C-4 Tamiami 60.9 100C-5 Comfort 2.3 -C-3 Coral Gables 18.0 25C-2 Snapper Creek 53.0 100C-100 Cutler 40.6 10C-1 Black Creek 56.9 100,30,10C-102 C-102 25.4 10C-103 C-103 40.6 -Military Homestead A.B. 4.7 -North North 7.8 -<strong>Florida</strong> City <strong>Florida</strong> City 12.5 -Model North <strong>and</strong> <strong>South</strong>Model L<strong>and</strong> 28.1 -C-111 C-111 100.0 10Source: Miami-Dade CountyMunicipal Systems in Miami-Dade CountyC. City of North MiamiCity of North Miami <strong>Water</strong> TreatmentThe City of North Miami reports on its website that the <strong>Water</strong> Treatment Plant <strong>and</strong> SunkistGrove to be capable of treating 9.3 mgd with an average treatment of 8.7 mgd or 60 percent of theCity’s total dem<strong>and</strong> of 13.5 mgd. Interconnections with Miami-Dade <strong>Water</strong> <strong>and</strong> Sewer supplythe other 40 percent.In the 1991 City of North Miami Comprehensive Plan the City identifies that groundwater istreated at the Norman Winson <strong>Water</strong> Plant. The City’s permit from the District allows for theremoval of 9.3 mgd with actual withdrawal rates averaging 8 mgd. Supplemental water isprovided through multiple connections to the WASD water transmission system. The Cityidentifies WASD water facility capacity as 383 mgd. The City’s service area is approximately 13square miles <strong>and</strong> serves an estimated population of 75,000 through 19,000 service connections.The City operates 255 miles of water mains.11
City of North Miami Sanitary Sewer TreatmentIn the 1991 City of North Miami Comprehensive Plan the City identifies that it operates a sewagecollection <strong>and</strong> transmission system with an irregular service area. The system consisted of 40City-owned wastewater lift stations, six of which are outside the City limits, 67 privately ownedwastewater lift stations, approximately 115 miles of gravity sewers, 110 miles of service laterals,<strong>and</strong> 15 miles of pressure sewers. The sewer system provides service to 12,000 accounts with anestimated population of 57,000. The City’s sewage is transmitted to the North Miami-DadeCounty District Regional Plant located at N.E. 154 Street operated by WASD. The plant wasreported to have a design capacity of 80 mgd with reported flows of 76.7 mgd. The City alsoreported that the County was preparing to exp<strong>and</strong> the system by 20 mgd by 1995, which wouldprovide capacity to at least the year 2000.D. City of North Miami BeachCity of North Miami Beach <strong>Water</strong> TreatmentIn the 1991 City of North Miami Beach Comprehensive Plan the City identifies that the entire Cityis served by public water lines. The City’s Utilities Department is responsible for some of thewater supply <strong>and</strong> treatment, <strong>and</strong> all of the distribution. About 25 percent of the City’s systemservice area is within the City limits. The City obtains about one-half of its water from WASD.The City identifies its water treatment plant rated capacity at 17.6 mgd with an average dailydem<strong>and</strong> of 25.5 mgd. The City reports that the WASD plants serving the Northern Miami-DadeCounty District will have a capacity of 245 mgd by 1998.The City identifies that is was preparing to replace its 10 existing wells with two new <strong>and</strong> moreefficient wells located near the Turnpike.City of North Miami <strong>Wastewater</strong> TreatmentIn the 1991 City of North Miami Beach Comprehensive Plan the City identifies that about onethirdof the City is served by sanitary sewers. The WASD is the service provider for collection<strong>and</strong> treatment. The City identifies that it generates approximately 3.3 mgd of waste withprojected increases in flow to 4.6 mgd by 1996 <strong>and</strong> 4.7 by 2006. The City reports that treatment isprovided by the WASD North District wastewater treatment plant located at N.E. 151 Street <strong>and</strong>that the plant is rated for 80 mgd. The City reports that this plant is undergoing an expansion to100 mgd by 1996 <strong>and</strong> 120 mgd by 2006 <strong>and</strong> has a current average flow of 75.5 mgd.Although the City of North Miami Beach <strong>and</strong> North Miami Comprehensive plans weresubmitted in 1991 <strong>and</strong> use the same WASD treatment facility, each plan reports differentcapacities for that facility.E. City of HomesteadCity of Homestead <strong>Water</strong> TreatmentIn the 1995 City of Homestead adopted Comprehensive Plan the City report current water serviceto over 7,200 metered customers. The Homestead <strong>Water</strong> Treatment <strong>Facilities</strong> are located atHarris Field <strong>and</strong> Wittkop Park. Two wells at Harris Field provide 2.16 mgd <strong>and</strong> four wells atWittkop Park produce 4.42 mgd. Treatment capacity is 17 mgd with a reported allocation of 9.9mgd <strong>and</strong> an average use of 5.3 mgd. By 2010, the City projected that it will need 11.9 mgd toserve the projected population. The City proposed to add two new 2.16 mgd well at Harris Field12
to meet the anticipated need by the 2010. If these projections remain accurate, there will be noavailable capacity after the 2010. Current trends indicate that the Homestead area is receivingsignificant amounts of residential development.City of Homestead <strong>Wastewater</strong> TreatmentIn the 1995 City of Homestead adopted Comprehensive Plan the City reports that in 1975, largelydue to the anticipated growth at the Villages of Homestead DRI, the City’s 750,000 gpdwastewater treatment plant was increased to 2.25 mgd. Through an agreement with Miami-DadeCounty, 800,000 gallons are diverted to the County’s pump station #691 daily. Thus, the capacityavailable in the City wastewater system is 3.05 mgd with an allocation of 3.175 mgd.Homestead reports approximately 80 miles of sewer lines with 37 pump stations owned by theCity <strong>and</strong> four privately owned. The system served 4,790 customers, some of which were locatedoutside of City limits. The City reports that it will reach capacity of the existing system by 1997<strong>and</strong> that the City is in the process of exp<strong>and</strong>ing the system to 6 mgd to meet the City’s needs forthe year 2010. It was unclear, whether or not the existing treatment facility was being exp<strong>and</strong>edor a new facility was considered for construction.F. City of <strong>Florida</strong> CityCity of <strong>Florida</strong> City <strong>Water</strong> TreatmentThe 1990 City of <strong>Florida</strong> City adopted Comprehensive Plan identifies that the City’s watertreatment plant draws from four wells <strong>and</strong> has a total design capacity of 4.1 mgd with apermitted capacity of 3.55 mgd. The City had a 1987 dem<strong>and</strong> of 1.34 mgd with a projecteddem<strong>and</strong> of 2.937 mgd in 2030.City of <strong>Florida</strong> City <strong>Wastewater</strong> TreatmentThe City reports that the water treatment plant rated with a capacity of 2.376 mgd was closed in1989 <strong>and</strong> that wastewater treatment is provided by Miami-Dade County at the <strong>South</strong> Miami-Dade Sewage Treatment Facility.G. City of Opa-LockaCity of Opa-Locka <strong>Water</strong> TreatmentThe 1990 City of Opa-Locka proposed Comprehensive Plan identifies that the city owns <strong>and</strong>operates the water distribution system <strong>and</strong> that WASD supplies the water from theHialeah/Preston <strong>Water</strong> Treatment Plant. The service area is approximately 6 square miles with3,533 connections within the City <strong>and</strong> 1,237 outside the City limits. The main pump is locatednear NW 135 Street <strong>and</strong> NW 32 Ave. In 1988 the City reported an average daily consumptionrate of 3.071 mgd. No specific plant capacities are identified.City of Opa-Locka <strong>Wastewater</strong> TreatmentThe 1990 City of Opa-Locka proposed Comprehensive Plan identifies that 98 percent of the Cityis sewered. The City owns <strong>and</strong> operates a municipal sanitary sewer collection system that isconveyed to WASD for treatment <strong>and</strong> disposal. The City reported that the capacity of the13
collection system for the Master Station is 4.9 mgd <strong>and</strong> 7.2 mgd for the 16-inch force main.Current dem<strong>and</strong> was reported at 3.7 mgd.Broward CountyBroward County <strong>Water</strong> TreatmentIn 1987, the Biscayne Aquifer supplied one hundred percent of the drinking water in BrowardCounty. Thirty-one (31) public <strong>and</strong> private water utilities provide potable service in BrowardCounty. Seven of the utilities supply water to the unincorporated area including the five localgovernment utilities of Broward County, Pompano Beach to 1,606 residents, Sunrise to 16,653residents, Tamarac to 1,499 residents, <strong>and</strong> Ft. Lauderdale to 18,962 residents. The two privateutilities of Ferncrest <strong>and</strong> University also provide service within Broward County. However,Ferncrest, which provided service for 3,949 people in to two mobile home parks, was closed in1987 <strong>and</strong> the Town of Davie is identified as providing potable water service. Universityprovided service to 1,154 residents.Broward County operates three utility districts consisting of seven water treatment plants. Peakdem<strong>and</strong> for all systems in the County is identified in Table 10.District 1, serves 66,510 residents in portions of Northeast <strong>and</strong> Northwest Broward. District 1 iscomprised of three treatment plants: 1A, 1B, <strong>and</strong> Broadview. Plants 1A <strong>and</strong> Broadview areoperated twenty-four hours a day, while 1B is maintained on st<strong>and</strong>-by to serve peak periods.System 1A is interconnected with 1B. System 1B <strong>and</strong> 1C are interconnected. System 1A <strong>and</strong>Broadview were not interconnected in 1989. The design capacity for 1A is 10.5 mgd. 1B has atreatment design capacity of 2.0 mgd. Broadview also has a design capacity of 2.0 mgd. Thereare currently seven wells serving District 1. The overall wellfield capacity is 15.1 mgd. In 1987,the total flow was calculated at 11.0 mgd.District 2, serves 53,744 residents in Northeast Broward. District 2 is comprised of one treatmentplant known as 2A. The plant operates twenty-four hours a day <strong>and</strong> has a design capacity of 25.9mgd. There are nine wells serving District 2.District 3, serves 44,662 residents in portions of <strong>South</strong>east Broward. District 3 includes threetreatment plants: 3A, 3B, <strong>and</strong> 3C. The 3A treatment plant contains two individual treatmentunits, <strong>and</strong> has a design capacity of 5.3 mgd. The plant operates twenty-four hours a day <strong>and</strong>there are four wells serving the plant.System 3B consists of three individual treatment units <strong>and</strong> has a design capacity of 3.7 mgd <strong>and</strong>operates twenty-four hours a day, however, a 0.5 mgd unit “A” is used to treat backwash water<strong>and</strong> is not used to treat water from the wells. Occasionally the unit is placed in service to assistduring peak flows. There are four well on-site <strong>and</strong> the 3B treatment plant is not interconnected to3A.System 3C consists of one 1.0 mgd treatment unit, which is operated eight to sixteen hours perday <strong>and</strong> there are two well on-site. The 3C treatment plant is not interconnected to either 3A or3B.It was anticipated that by 1990, the projected dem<strong>and</strong> of the 1A, 1B <strong>and</strong> 1C would exceed thecapacity of the plants. The proposed improvements included exp<strong>and</strong>ing the existing capacityfrom 10.5 mgd to 15 mgd to meet the build-out needs of 14.2 mgd. The 15 mgd capacity was14
projected to meet District 1 needs up until the year 2020. In terms of wellfield capacity, theCounty estimated the need for one or two new wells at a cost of $9.6 million in 1980 dollars.The 2A treatment plant was identified with a need to exp<strong>and</strong> by 25 mgd to 45 mgd to meet theneeds until the year 2005. Estimated cost for the expansion was projected at $36 million.In District 3, the 3A treatment plant was identified with a 2.1 mgd surplus in 1989 but had seriouscorrosion problems that threatened the plants potential to provide adequate service. Anexpansion from 5.3 mgd to 10.7 mgd to the 3A plant was scheduled. The 3A wellfield was inimminent danger of saltwater intrusion. New wellfields in the <strong>South</strong> System were projected toprovide adequate service through the year 2020.Table 10Projected Average Daily <strong>and</strong> Peak Day <strong>Water</strong> Dem<strong>and</strong> forBroward County, Private <strong>and</strong> Municipal Utilities Service AreasBroward County1990-2000Facility__________1990_________ _________1995__________ _________2000__________Avg. Peak Capacity Avg. Peak Capacity Avg. Peak Capacity(mgd)___(mgd) ___(mgd)_(mgd)___(mgd) ___(mgd)_(mgd)___(mgd) ___(mgd)_1A, 1B <strong>and</strong>Broadview 9.0 12.4 14.5 9.5 13.0 15.0 9.9 13.5 15.02A 14.0 31.25 45.0 14.8 23.0 45.0 15.3 23.7 45.03A 2.8 3.7 5.3 6.8 8.1 10.7 7.2 8.6 14.73B 3.6 3.9 3.7 NA NA NA NA NA NAFerncrest .54 .99 1.0 .55 1.0 1.0 .55 1.01.0University .35 .73 1.0 NA NA NA .5 1.0 1.0Pompano Beach 20.0 30.2 40.0 NA NA 40.0 22.4 33.8 40.0Ft. Lauderdale 50.21 80.3 90.0 50.46 NA 90.0 52.48 80.3 90.0Tamarac 5.5 4.7 12.0 NA NA 20.0 6.45 9.0 20.0Sunrise 11.12 17.7 20.5 NA NA 22.5 14.7 23.4 30.0Source: Broward CountyPopulation estimates for each water treatment plant service area is provided in Table 11.15
Table 11Population Projections forBroward County, Private <strong>and</strong> Municipal Utilities Service AreasBroward County1990-20001990 1995 2000Facility Est. Pop. Est. Pop. Est. Pop.1A, 1B <strong>and</strong>Broadview 69,215 70,634 71,6132A 56,759 59,279 60,5953A 17,283 18,454 19,6253B 16,380 16,434 16,488Ferncrest 4,995 NA 5,167University 2,988 NA 4,199Pompano Beach 92,865 NA 102,458Ft. Lauderdale 218,535 219,622 273,965Tamarac 43,983 NA 50,734Sunrise 106,864 NA 195,457Source: Broward CountyBroward County <strong>Wastewater</strong> TreatmentIn 1989, the Broward County Comprehensive Plan identifies that there are twenty (20) public <strong>and</strong>private facilities licensed by the County to provide sanitary sewer service in Broward County.Average dem<strong>and</strong> <strong>and</strong> design capacity for each facility is provided in Table 12.Seven utilities supply wastewater services to the unincorporated area. One private facility,Ferncrest, <strong>and</strong> the municipalities of Cooper City, Fort Lauderdale, Hollywood, Margate, Oakl<strong>and</strong>Park, <strong>and</strong> Sunrise. (Broward County Comprehensive Plan (1989), Volume 4, Support Documents,page 12-3). The number of wastewater plants in Broward County has been reduced from 118 to28 since 1974. (ECQB Annual Report, 1985-86)Ferncrest Utilities provides secondary wastewater treatment service to approximately 4,000residents of the Everglades Mobile Home Park <strong>and</strong> the University Mobile Home Park. The plantwas identified in 1989 to have a .1 mgd surplus over peak flow. Effluent disposal is throughdischarge into a 110-acre rock pit.In 1989, Cooper City System II wastewater plant was to have been exp<strong>and</strong>ed <strong>and</strong> a new 5 mgdSystem III plant constructed, in 1990 with a life expectancy of 20 years. The System II <strong>and</strong> IIIplants would be interconnected <strong>and</strong> effluent disposal for both plants is by deep well injection.However, in 1987 the EQCB reported the disposal method as Ocean Outfall.The Broward County Utilities Division (BCUD) provides wastewater service in three Districts.Generally the service areas are the unincorporated areas, however, some portions of are withinmunicipalities.District 1 primarily serves East Central <strong>and</strong> West Central Broward County with portions of theNortheast <strong>and</strong> Northwest served. The total population served is 57,116. District 1 is described as16
composed of mini-sewer systems 1A, 1B, <strong>and</strong> 1C. There are approximately 120 miles of gravitysewer, twenty miles of force main, <strong>and</strong> fifty-one pump stations <strong>and</strong> three regional pump stations.District 2 serves residents in Northeast Broward County. The total population served is 61,232.District 2 is described as composed of several mini-sewer systems with approximately 160 milesof gravity sewer pipe, twenty-five miles of force main <strong>and</strong> ninety-one pump stations.District 3 serves residents in <strong>South</strong>east Broward County, including the FortLauderdale/Hollywood International Airport. Development District 3 is subdivided intosystems 3A, 3B, <strong>and</strong> 3C <strong>and</strong> is composed of mini-sewer systems with twenty-five miles of gravitypipe, seventeen miles of force main, <strong>and</strong> thirty-five pump stations. The total population servedin 15,895 with the 1989 Broward County Comprehensive Plan rating the airport terminal rated at500,000 gpd.For the Hollywood wastewater treatment facility, the County estimates the 1987 servedpopulation as 188,000; however, in the County’s 1990 to 2000 population projections by utility,the County estimates a 1990 population of only 139,802 <strong>and</strong> a year 2000 service population of141,629, nearly 46,371 less people than were estimated to be already served. It is not known howthis undercounting of the service population impacted l<strong>and</strong> use or capital facilities programming.In 1996, a Development of Regional Impact Application for airport expansion was submitted.Included in the data <strong>and</strong> analysis section for wastewater were estimates for up to 644,850 gpd bythe year 2010. Interesting for wastewater <strong>and</strong> potable water service, the DRI application indicatesthat if Hollywood or Broward County were unable to supply service, the Airport wouldconstruct <strong>and</strong> maintain its own utility system. The Hollywood treatment plant is identified witha 37.5 mgd permitted capacity <strong>and</strong> the Hollywood plant was projected to have a design capacityof 48.0 mgd by 1995.Broadview System serves an area within District 1. The population served is 8,993. Broadviewwas reported to have about eight miles of gravity pipe, 9,000 feet of force mains, <strong>and</strong> six pumpstations <strong>and</strong> was to be integrated into District 1, but no time frame was indicated.The North Regional <strong>Wastewater</strong> Treatment System provides wastewater treatment for large usersin the northern part of Broward County. Large user agreements have been executed withCoconut Creek, Coral Springs, Deerfield Beach, Lauderhill, N. Lauderdale, N. SpringsImprovement District, Oakl<strong>and</strong> Park, Pompano Beach, Tamarac, <strong>and</strong> University Utilities. Table13 summarizes existing dem<strong>and</strong> in the North District <strong>and</strong> Table 14 summarizes projected servicepopulations for the North District utilities.The design capacity of the North Regional Treatment Plant is 66 mgd; however, the ultimateplant capacity is projected to be 90 mgd on a maximum monthly flow basis <strong>and</strong> 75 mgd on ayearly average with a recommendation to exp<strong>and</strong> the plant to 80 mgd by 2005. Table 15summarizes wastewater treatment plant data for the North Regional Treatment Plant <strong>and</strong>indicates that design capacity will be 96 mgd rather than 90 mgd as indicated in the data <strong>and</strong>analysis.Problems were identified in transmitting flows northward through the State Road 7 (U.S. 441)Highway system in 2005 under peak hourly conditions <strong>and</strong> in 1989 the transmission main wasdescribed as barely adequate to h<strong>and</strong>le the flow. Another area of concern were the need torehabilitate six master lift stations at Broadview, Coral Springs East, Coral Springs West,Lauderdale Lakes, North Lauderdale <strong>and</strong> Tamarac. With a high priority redevelopment effortbeginning on the State Road 7 corridor, adequacy of the wastewater system will need to be17
evaluated in greater detail. In Districts 3A, 3B, <strong>and</strong> 3C, force main improvements, seventeenpump stations, <strong>and</strong> twelve gravity main improvements were also identified.The average monthly flows <strong>and</strong> design capacities for all wastewater treatment systems inBroward County are summarized in Table 16.Table 12Average Daily <strong>and</strong> Peak <strong>Wastewater</strong> Dem<strong>and</strong> forNorth Regional Treatment Plant, Private <strong>and</strong> Municipal UtilitiesBroward County1987_________ Dem<strong>and</strong> _________DesignAvg. Daily Peak Day Capacity Method ofType ofFacility (mgd) (mgd) (mgd) Disposal TreatmentBroward County 49.0 83.0 66.0 Ocean Outfall SecondaryN. Reg. Treat Plant2401 Powerline RdPompano BeachCooper City .71 .78 3.46 Ocean Outfall Secondary<strong>Wastewater</strong> Plant9070 S.W. 51 StCooper CityFt. Lauderdale 30.4 60.8 38.0 Deep Well SecondaryG.T. LohmeyerInjectionPort EvergladesFt. LauderdaleHollywood 32.8 36.8 38.0 Ocean Outfall Secondary<strong>Wastewater</strong> Plant1621 N. 14 th StreetHollywoodMargate 6.3 8.2 6.5 Deep Well Secondary<strong>Wastewater</strong> PlantInjection1001 W. River DrMargateSunrise II <strong>and</strong> III 4.5 5.7 6.0 Deep Well Secondary<strong>Wastewater</strong> Plant (combined) (combined) Injection8700 SW 19 Pl. #214150 NW 8 St #3Ferncrest Utilities .4 .5 .6 Pond Secondary3015 SW 54 AveFt. LauderdaleSource: Broward County18
Table 13<strong>Wastewater</strong> Dem<strong>and</strong> forNorth Regional Treatment Plant, Private <strong>and</strong> Municipal UtilitiesBroward County1987Dem<strong>and</strong>Avg. DailyAvg. Daily Per CapitaFacility (mgd) (gpd) Est. PopulationN. Reg. Treat Plant 49.0 120 410,000Cooper City .71 103 17,000G.T. Lohmeyer 30.4 195 156,000Hollywood 32.8 174 188,000Margate 6.5 124 47,265Sunrise II <strong>and</strong> II 4.5 132 34,000Ferncrest Utilities .4 93 4,100Source: Broward CountyTable 14Population Projections forNorth Regional Treatment Plant, Private <strong>and</strong> Municipal Utilities Service AreasBroward County1987-20001987 1990 1995 2000Facility Est. Pop Est. Pop. Est. Pop. Est. Pop.N. Reg. Treat Plant 410,000 468,294 526,753 566,903Cooper City 17,000 20,450 25,240 29,694G.T. Lohmeyer 156,000 153,833 154,030 NAHollywood 188,000 139,802 140,505 141,629Margate 47,265 48,675 NA 59,095Sunrise II <strong>and</strong> II 34,000 73,174 82,027 87,036Ferncrest Utilities 4,100 4,957 NA 5,167Source: Broward County19
Table 15Projected Average Daily <strong>and</strong> Peak Day <strong>Wastewater</strong> Dem<strong>and</strong> forNorth Regional Treatment Plant, Private <strong>and</strong> Municipal Utilities Service AreasBroward County1990-2000 271990 1995 2000Avg. Peak Capacity Avg. Peak Capacity Avg. Peak CapacityFacility (mgd) (mgd) (mgd) (mgd) (mgd) (mgd) (mgd) (mgd) (mgd)N. Reg. Treat Plant 65.0 83.0 68.0 73.0 90.0 96.0 78.0 95.0 96.0Cooper City 2.04 2.78 3.5 3.5 NA 4.5 4.6 NA 6.5G.T. Lohmeyer 33.59 37.52 38.0 34.24 38.25 48.0 NA NA 48.0Hollywood 31.35 NA 38.0 34.49 NA 59.01 38.63 NA 59.01Margate 6.58 NA 11.5 7.44 NA 11.5 8.29 NA 11.5Sunrise II <strong>and</strong> II 5.96 NA 6.0 7.11 NA 11.0 8.53 NA 11.0Ferncrest Utilities .4 .5 .6 .4 .5 .6 .4 .5. .6Table 16Average Monthly Flows <strong>and</strong> Design CapacityBroward County EAR 1995 28Monthly Avg. Design Capacity(mgd) (mgd)BCUD #4 69.7487 88.487Cenvil (Pembroke Pines) 3.1351 6.891Cooper City West 2.2148 5.196CSID 4.3979 6.207Davie II 2.1414 3.645Daystar 0.0004 0.035Fernstar 0.2664 0.860G.T. Lohmeyer (Ft. Laud.) 39.2764 46.219Hollywood 30.7803 15.656Plantation 12.8308 16.852<strong>South</strong> Broward Utilities 0.4709 1.486Sunrise Regional 1.3568 3.643_______ ______191.6264 266.629The Broward County Office of Environment Services (OES) currently provides limitedinformation about its Industrial Pretreatment Program <strong>and</strong> effluent limitations on its websitelocated at http://www.broward.org/oes/oei00900.htm. Although not currently available, the27 Source: Broward County20
website is scheduled to provide a GIS-based map of the service area of the Broward CountyNorth Regional <strong>Wastewater</strong> Treatment Plant (BCNRWWTP).Information about what Drainage District boundary your property is located in is provided onthe OES website at http://www.broward.org/oes/wmi04000/index.html. The map is quiteuseful <strong>and</strong> easy to use. Additionally, OES provides general map information related to <strong>Water</strong>Control Districts <strong>and</strong> Flood Elevations. Information about drainage, water <strong>and</strong> sewer can besearched by parcel address at the OES website athttp://lsta.co.broward.fl.us/website/dws/viewer.htm.Since 1993, Broward County has embarked on the Neighborhood Improvement Program (NIP).Among other things, this program constructs various public works projects within eight (8)unincorporated communities in Broward County. A main focus of the NIP has been a series ofdrainage projects in areas experiencing inadequate drainage, aging potable water infrastructure,<strong>and</strong> a lack of sanitary sewer service. By 2011, the NIP program will eliminate 10,252 septic tanks<strong>and</strong> provide 617 miles of pipeline in addition to other community infrastructure at a cost of $629million.Broward County <strong>Stormwater</strong> TreatmentIn Broward County there are thirteen independent <strong>and</strong> eight dependent special taxing districts,which are responsible for operating <strong>and</strong> maintaining drainage systems within their boundaries.The independent water management districts issue surface water management permits withintheir respective districts.Broward County Independent Drainage DistrictsBailey Drainage District (BDD)Central Broward Drainage District (CBDD)Coral Springs Improvement District (CSID)*Plantation Acres Improvement District (PAID)Indian Trace Community Development District (ITCDD)North Lauderdale <strong>Water</strong> Control District (NLWCD)North Springs Improvement District (NSID)*Old Plantation <strong>Water</strong> Control District (OPWCD)*Pine Tree <strong>Water</strong> Control District (PTWCD)<strong>South</strong> Broward Drainage District (SBDD)Sunshine <strong>Water</strong> Control District (SWCD)West Lauderdale <strong>Water</strong> Control District (WLWCD)Turtle Run Community District (TRCD)*Act as permitting authority for projects less than 40 acres.21
Broward County Dependent Drainage DistrictsCocomar <strong>Water</strong> Control DistrictTwin Lakes <strong>Water</strong> Control DistrictLauderdale Isles <strong>Water</strong> Control District<strong>Water</strong> Control District #2<strong>Water</strong> Control District #3<strong>Water</strong> Control District #4Ravenswood <strong>Water</strong> Control DistrictSunrise Drainage DistrictThe service areas <strong>and</strong> design capacities for primary canals in Broward County is summarized inTable 17.Table 17Service Areas <strong>and</strong> Design Capacity for Primary Canals <strong>and</strong>Special Taxing Districts in Broward CountyBroward County 1987 29Acres DesignPrimary Canal Special Taxing District Served Capacity(csm)*C-11 Bailey <strong>Water</strong> Control District 1,500 20C-11 Central Broward Drainage District 29,000 20C-14 Coral Springs Improvement District 5,100 70NNRC Plantation Acres Improvement District 5,100 71C-11 Indian Trace Community Development District 12,800 40C-14 North Lauderdale <strong>Water</strong> Control District 1,600 70C-14 North Springs Improvement District 4,800 70NNRC & C-12 Old Plantation <strong>Water</strong> Control District 10,000 71Hillsboro Pine Tree <strong>Water</strong> Control District 2,900 35C-9 & C-11 <strong>South</strong> Broward Drainage District 44,100 **C-14 Sunshine <strong>Water</strong> Control District 5,550 70NNRC West Lauderdale <strong>Water</strong> Control District 1,500 71C-14 Turtle Run Community District 600 70*csm = cubic feet/second/square mile** 20 csm to C-9 Canal <strong>and</strong> 20 csm to C-11 Canal west of 15 th Avenue, 40 csm to C-11 east of 15 thAvenue.NNRC = North New River Canal29 Source: Broward County22
Municipal Systems in Broward CountyH. City of Fort LauderdaleThe City of Fort Lauderdale’s <strong>Water</strong> <strong>and</strong> <strong>Wastewater</strong> Master Plan identified capitalimprovements necessary to meet to the needs of the Fort Lauderdale service area through theyear 2020. The plan considers issues related to aging infrastructure, redevelopment with higherdensities, <strong>and</strong> sewering of areas on septic tank. The plan also identifies existing deficiencies.City of Fort Lauderdale <strong>Wastewater</strong> TreatmentThe City provides wastewater treatment to approximately 182,785 people in central BrowardCounty. Approximately 70 percent of the service population resides within the City. Nearly47,199 people within the City’s service area use septic systems. By 2020, the City estimates that itwill provide service to 253,224 people.The George T. Lohmeyer Regional <strong>Wastewater</strong> Treatment Plant is owned <strong>and</strong> operated by theCity <strong>and</strong> is the only wastewater treatment facility in the service area. The wastewater treatmentplant is identified to have a treatment capacity of 43 mgd with a pending application to increasethe capacity to 54 mgd. Treated effluent is discharged to five injection wells. The wastewatertransmission system consists of 340 miles of gravity sewers, 110 miles of force main, <strong>and</strong> 144 Cityownedwastewater pump stations. The City also identified 59 private lift stations <strong>and</strong>acknowledges that information on many of the private lift stations is not available. Except forunincorporated area, each municipality in the service area owns <strong>and</strong> operates the wastewatercollection facilities within its jurisdiction. The City has large user wastewater agreements withOakl<strong>and</strong> Park, Wilton Manors, Tamarac, Davie, <strong>and</strong> Port Everglades.Daily flows of the George T. Lohmeyer <strong>Wastewater</strong> Plant are included in Table 18. Forecastflows for the George T. Lohmeyer <strong>Wastewater</strong> Plant are included in Table 19. Populationprojections, by service area, for the George T. Lohmeyer <strong>Wastewater</strong> Plant are provided in Table20.23
Table 18Daily <strong>Wastewater</strong> Flows (mgd) forGeorge T. Lohmeyer RWWTP1988-1999 30Average Max MaxDaily Flow Daily Flow Hour Flow1988 32.10 40.7 63.31989 33.33 46.9 75.21990 34.03 49.1 70.71991 35.44 66.9 75.91992 36.27 58.1 67.01993 36.97 59.2 84.71994 39.51 69.8 77.81995 40.68 67.8 75.31996 36.51 66.4 75.31997 37.74 65.7 74.51998 32.91 65.2 71.01999 36.34 75.3 78.2Table 19Forecast Systemwide Nonresidential <strong>Wastewater</strong> FlowsGeorge T. Lohmeyer RWWTP2000-2020 31Service Residential NonresidentialYear Population AADF (mgd) AADF (mgd)2000 189,984 13.3 5.72005 213,136 14.9 6.92010 240,373 16.8 8.42015 243,312 17.0 9.12020 253,224 17.7 10.130 Source: City of Fort Lauderdale31 Source: City of Fort Lauderdale24
Table 20Population Estimate Comparisons forCity of Fort Lauderdale<strong>Wastewater</strong> Planning Area1995-2020 32Jurisdiction 2000 2005 2010 2015 2020Fort LauderdaleSewered – Resident 118,349 121,472 124,285 125,053 131,340Sewered – Seasonal 10,576 10,345 10,164 9,997 10,034Non-sewered 38,892 39,841 40,639 41,401 42,732Oakl<strong>and</strong> ParkSewered – Resident 25,887 26,504 26,914 27,115 27,652Sewered – Seasonal 1,065 1,058 1,045 1,029 1,039Non-sewered 1,080 1,147 1,193 1,259 1,325TamaracSewered – Resident 830 884 936 954 982Sewered – Seasonal 36 37 39 38 38Non-sewered 0 0 0 0 0Wilton ManorsSewered – Resident 12,188 12,410 12,434 12,857 13,240Sewered – Seasonal 252 245 230 238 236Non-sewered 0 0 0 0 0DavieSewered – Resident 20 36 52 71 93Sewered – Seasonal 0 0 0 0 1Non-sewered 0 0 0 0 0UnincorporatedSewered – Resident 12,671 13,375 14,050 14,768 15,714Sewered – Seasonal 911 905 913 927 970Non-sewered 7,227 7,376 7,478 7,604 7,828________________________________________________________________TotalSewered – Resident 169,945 174,681 178,671 180,818 189,021Sewered – Seasonal 12,840 12,591 12,392 12,230 12,318Non-sewered 47,199 48,364 49,310 50,264 51,885________________________________________________________________TotalPopulation 229,984 235,437 240,373 243,312 253,22432 Source: City of Fort Lauderdale25
I. City of HollywoodCity of Hollywood <strong>Water</strong> TreatmentThe City of Hollywood reports on its website that the Brian Piccolo <strong>Water</strong> Treatment Plant israted for 36 mgd with approximately 500 miles of distribution lines. There are 21 wells that drawwater from the Biscayne Aquifer <strong>and</strong> 4 wells that draw from the <strong>Florida</strong>n Aquifer.In the 1996 City of Hollywood EAR, the City reports that the City’s water plant has a designcapacity of 37.5 mgd with an existing average dem<strong>and</strong> of 18 mgd. Starting in January 1996, theCity is contractually obligated to provide potable water to parts of unincorporated BrowardCounty south of the City, increasing the average dem<strong>and</strong> to 21 mgd. The City also anticipatedproviding services to unincorporated Broward County north of Sterling Road, increasing theaverage dem<strong>and</strong> to 24 mgd.City of Hollywood <strong>Wastewater</strong> TreatmentThe City of Hollywood reports on its website that its <strong>Wastewater</strong> Treatment Plant is rated for 42mgd with approximately 210 miles of distribution lines. There are 63 city-owned wastewater liftstations <strong>and</strong> 88 privately owned lift stations.In the 1996 City of Hollywood EAR, the City reports that the City <strong>Wastewater</strong> Treatment Plantwas upgraded to 42 mgd <strong>and</strong> should provide sufficient capacity until 2010. Additional plantupgrades would allow for additional plant capacity by 3 to 4 mgd.It should be noted that the City of Hollywood has an exceptional webpage located athttp://www.hollywoodfl.org/pub-util/tour-sewer.htm that describes the water <strong>and</strong> wastewatertreatment process in great detail <strong>and</strong> animation.J. City of Pompano BeachCity of Pompano Beach <strong>Water</strong> TreatmentIn the 1996 EAR for the City of Pompano Beach, the City identified that four water treatmentplants serve it. The City-owned water treatment plant at 301 NE 12 Street provided drinkingwater to 85 percent of the City’s l<strong>and</strong> area. The plant was reported with a design capacity of 40mgd with a dem<strong>and</strong> of 17.47 mgd. By 1998, the City projected that average daily flows wouldincrease to 23.1 mgd.Broward County Utilities operated two water treatment plants that served portions of PompanoBeach. Broward County 2A <strong>Water</strong> Treatment Plant at 1390 NE 50 Street provided drinking waterto the northwest portion of the City. Broward County 2A <strong>Water</strong> Treatment Plant is reported tohave a design capacity of 20 mgd with a current dem<strong>and</strong> of 11.15 mgd in 1989.Broward County 1A <strong>Water</strong> Treatment Plant at 3701 N SR 7 provided drinking water for a smallportion of the southwest part of the City. Broward County 1A <strong>Water</strong> Treatment Plant is reportedto have a design capacity of 10.5 mgd with a current dem<strong>and</strong> of 7.4 mgd in 1989. The capacity<strong>and</strong> dem<strong>and</strong> data for 1A <strong>and</strong> 2A are slightly different from the data reported by Broward Countyabove.26
The City of Margate <strong>Water</strong> Treatment Plant located at 1001 W River Drive served the westernportion of the City. The Margate <strong>Water</strong> Treatment Plant is reported to have a design capacity of18 mgd with a current dem<strong>and</strong> of 8 mgd in 1989.City of Pompano Beach <strong>Wastewater</strong> TreatmentIn the 1996 EAR, the City of Pompano Beach identifies that the Broward County North DistrictRegional <strong>Wastewater</strong> Facility <strong>and</strong> the City of Margate <strong>Wastewater</strong> Treatment Plant providewastewater treatment. Approximately 85 percent of the City’s wastewater was sent to theBroward County North Facility. The City reports the design capacity of the North Facility as 80mgd with a current dem<strong>and</strong> of 64.88 mgd. In 1994, the City amended its Large User Agreementwith the County for a reserve capacity of 17.26 mgd. The City identified its current flow to theCounty North Facility as 11.91 mgd. These capacity figures are slightly different than thosereported by Broward County above.The capacity of the Margate <strong>Wastewater</strong> Treatment Plant was identified as 11.75 mgd with acurrent dem<strong>and</strong> of 7.63 mgd. In 1994, the City of Margate identified capacity at its <strong>Wastewater</strong>Treatment Plant to be 8 mgd.K. City of MargateCity of Margate <strong>Water</strong> TreatmentIn the 1989 City of Margate adopted Comprehensive plan the City identifies that its watertreatment facility has a design capacity of 18 mgd with an average daily dem<strong>and</strong> of 6.86 mgd.The permitted capacity is identified as 13.3 mgd. The City draws drinking water from 12 wells,seven of the wells are within on the treatment site <strong>and</strong> five are located in Vinson Park. There areapproximately 40 miles of major distribution mains <strong>and</strong> 150 miles of transmission lines.Allocated capacity is distributed between the City of Margate, City of Coconut Creek, <strong>and</strong>Pompano Beach.City of Margate <strong>Wastewater</strong> TreatmentIn the 1989 City of Margate adopted Comprehensive Plan the City identifies that the <strong>Wastewater</strong>Treatment Plant is divided into two parcels by NW 66 Ave. The west parcel contains a treatmentcapacity of 5 mgd <strong>and</strong> the east parcel contains a treatment capacity of 3 mgd for a total Margate<strong>Wastewater</strong> Treatment Plant capacity of 8 mgd. The City reports an average daily flow of 5.42mgd in 1986 with projections of 7.84 mgd by 2000. Based on these projections, the City identifiesthat it will need to increase the capacity of the wastewater treatment plant to 11.75 mgdscheduled to be complete by 1992.The City owns <strong>and</strong> operates 46 wastewater lift stations. Additionally there are 6 privatewastewater lift stations <strong>and</strong> there are 21 miles of force mains. Effluent is discharged throughdeep well injection. The disposal well has a design capacity of 17 mgd. An emergency outfall isconnected to the Margate Canal, which is hydrologically connected to the C-14 canal.27
L. City of SunriseCity of Sunrise <strong>Water</strong> TreatmentIn the 1989 City of Sunrise adopted Comprehensive Plan the city identifies three water treatmentfacilities with a combined 250 miles of water distribution mains. The City also provides serviceto unincorporated Broward County, Boneventure, Weston, Davie <strong>and</strong> Plantation.The Sunrise <strong>Water</strong> Treatment Plant No. 1 (North Plant) is located between Springtree Drive <strong>and</strong>NW 44 Street. The North Plant consists of 16 raw water supply wells with a production capacityof 22 mgd. The water treatment facility has a rated capacity of 16 mgd with a 12 mgd expansionunderway at that time. The service area is approximately 12 square miles.Sunrise <strong>Water</strong> Treatment Plant No. 2 (<strong>South</strong> Plant) was acquired from the Pine Isl<strong>and</strong> UtilitiesCorporation. The plant is located at SW 21 Street <strong>and</strong> Pine Isl<strong>and</strong> Road. The site contains bothwater <strong>and</strong> wastewater treatment. The service area is approximately 9 square miles <strong>and</strong> includes aportion of unincorporated Broward County <strong>and</strong> the Town of Davie. The <strong>South</strong> Plant consists of 7raw water wells with a production capacity of 6.5 mgd.Sunrise <strong>Water</strong> Treatment Plant No. 3 (Malaleuca Isles Plant) was acquired from the City ofPlantation <strong>and</strong> is located in Plantation. The plant draws raw water from 3 wells. Two of thewells are located on-site. The plant has a rated capacity of 2 mgd <strong>and</strong> was operating on st<strong>and</strong>bybasis.City of Sunrise <strong>Wastewater</strong> TreatmentIn the 1989 City of Sunrise adopted Comprehensive Plan the City identifies that there are threewastewater facilities within the City with a combined 250 miles of wastewater collection mains<strong>and</strong> 125 wastewater lift stations. The City provides service to unincorporated Broward County,Boneventure, Weston, Davie <strong>and</strong> Plantation.Sunrise <strong>Wastewater</strong> Treatment Plant No. 1 (North Plant) is located between Springtree Drive <strong>and</strong>NW 44 Street. The North Plant was identified with a 9 mgd capacity in 1989. The North Planthas a permitted capacity of 7.5 mgd with an application pending for an addition 1.5 mgd.Average daily from was 7 mgd in 1987. Treated effluent is pumped through an 8-mile long forcemain for disposal by deepwell injection with a permit for 30 mgd. The North Plant district has 64wastewater lift stations.Sunrise <strong>Wastewater</strong> Treatment Plant No. 2 (<strong>South</strong> Plant) was acquired from Pine Isl<strong>and</strong> UtilitiesCorporation <strong>and</strong> is located at SW 21 Street <strong>and</strong> Pine Isl<strong>and</strong> Road. The <strong>South</strong> Plant has a designtreatment capacity of 4.5 mgd but was configured in a way to limit treatment capacity to 3 mgd.The <strong>South</strong> Plant had a temporary permit capacity of 2.75 mgd that could increase to 3 mgd ifeffluent st<strong>and</strong>ards are met. Average daily flow was 2.25 mgd in 1987. Effluent is pumped sixmiles to the deepwell injection site at the <strong>Wastewater</strong> Treatment Plant No. 3. The <strong>South</strong> Plantdistrict has 33 wastewater lift stations.Sunrise <strong>Wastewater</strong> Treatment Plant No. 3 (West Broward Plant) was acquired from the City ofPlantation <strong>and</strong> is located at NW 8 th Street <strong>and</strong> NW 136 Avenue. The West Broward Plant consistsof a 1 mgd package plant <strong>and</strong> a 2 mgd package plant. Permitted capacity is 3 mgd. Averagedaily flow was 2.78 mgd in 1987. The West Broward Plant district has 18 wastewater lift stations.28
Monroe CountyMonroe County <strong>Water</strong> TreatmentThe <strong>Florida</strong> Keys Aqueduct Authority (FKAA) provides potable water service in Monroe County.The FKAA is a closed system <strong>and</strong> is not connected to any other water supply system. Emergencypumping stations are located at <strong>Florida</strong> City with 9 MG capacity; Ramrod Key with 12 MGcapacity; <strong>and</strong> Stock Isl<strong>and</strong> with 5 MG capacity. The FKAA is currently implementingunderground storage <strong>and</strong> recover (ASR).FKAA has a reverse osmosis desalinization plant at Stock Isl<strong>and</strong> with a treatment capacity of 2.7MGD. The plant can be operational in 48 hours but has a high production <strong>and</strong> maintenance costsdue to the age of the membrane technology used.The FKAA operates 37 miles of a 36-inch diameter pipe from <strong>Florida</strong> City to Tavernier, 43 milesof 30-inch diameter pipe from Tavernier to Marathon. 24-inch diameter pipe from the west endof the Seven Mile Bridge to Upper Sugarloaf Key, <strong>and</strong> 18-inch diameter pipe from UpperSugarloaf Key to Key West. Portions of the 18-inch pipe were part of the original transmissionline installed in the 1940’s. The 18-inch main used from Upper Sugarloaf to Stock Isl<strong>and</strong> did nothave enough capacity to achieve build out in these areas. There are 430 miles of distribution linesin the Keys via separate storage tanks <strong>and</strong> pump stations.Monroe County <strong>Wastewater</strong> TreatmentIn 1937, the <strong>Florida</strong> Legislature created the <strong>Florida</strong> Keys Aqueduct Commission (FKAC). In 1940,an agreement with the U.S. Navy <strong>and</strong> FKAC shared the cost of constructing a water main fromthe mainl<strong>and</strong>. An 18-inch main was constructed with financial assistance from the Farmer’sHome Administration. In 1970, the <strong>Florida</strong> Keys Aqueduct Authority replaced the FKAC.The County will currently only provide service to areas within 1 mile of the main but will notserve National Wildlife Refuges <strong>and</strong> designated hardwood hammock areas. Crocodile LakeNation Wildlife Refuge, Key Deer National Refuge, <strong>and</strong> Schaus Swallowtail Refuge are excluded.Also excluded is all of No Name Key, portions of Big Torch Key, portions of Big Pine Key northof Watson Boulevard. Hardwood areas excluded include portions of Stock Isl<strong>and</strong>, small portionsof Cudjoe Key, Big Pine Key Cactus Hammock <strong>and</strong> all offshore isl<strong>and</strong>s.Sixty-five percent of the wastewater flow in the Keys is treated by On-Site Disposal Systems(OSDS). Package treatment plants treat the remaining 35 percent.Aside from the City of Key West’s sewage system, no other publicly operated wastewatertreatment facilities are in operation in Monroe County.The existing inventory of sanitary sewer facilities includes 24,000 septic tanks, 193 small packageplants, 99 marinas with 15,000 boats, <strong>and</strong> 5,000 unpermitted <strong>and</strong> unregulated cesspools.Due to the Outst<strong>and</strong>ing <strong>Florida</strong> <strong>Water</strong> designation in Monroe County, it is perceived to be verydifficult to obtain a new permit from the Department of Environmental Protection (DEP) or theEnvironmental Protection Agency (EPA) to construct an outfall to surface waters as a method ofeffluent disposal. There are six (6) wastewater treatment facilities discharging effluent via outfallto surface waters. There have been at least 10 recent enforcement actions by the DEP.29
Monroe County Surface <strong>Water</strong> OutfallsVenture Out – Cudjoe KeyU.S. Coast Guard Station – MarathonIslamoradaU.S. Naval Air Station – Boca Chica<strong>Water</strong>s Edge Mobile Home ParkFiesta Key KOAMunicipal Systems in Monroe CountyA. City of MarathonThe City of Marathon was incorporated in November of 1999. The City’s first proposedComprehensive Plan was submitted for agency review in June 2003. Review of the City’s SanitarySewer, Drainage <strong>and</strong> Potable <strong>Water</strong> Elements revealed that the <strong>Florida</strong> Keys Aqueduct Authority(FKAA) provides potable water to the City. <strong>Stormwater</strong> facilities are largely to storm sewers <strong>and</strong>retention basins installed by the FDOT along U.S. 1.City of Marathon <strong>Water</strong> TreatmentThe City’s current wastewater disposal system is composed of 5,595 septic systems <strong>and</strong> 71 privateon-site wastewater disposal <strong>and</strong> treatment systems (Sixty-nine of which are identified in Table21), with some wastewater flow from the private treatment plants conveyed into cesspools.According to the City’s wastewater data, in the year 1996, there were 1,180 cesspits located withinthe City. The City’s wastewater analysis describes several challenges to the existing wastewaterdisposal system, including 609 subst<strong>and</strong>ard septic systems <strong>and</strong> privately owned <strong>and</strong> maintainedwastewater systems that are not currently inspected by the County or <strong>Florida</strong> Department ofHealth. According to the data <strong>and</strong> analysis, the <strong>Florida</strong> Department of Health does not have thelegal authority to inspect these systems. Additionally, the City identifies that water quality <strong>and</strong>eutrophication of nearshore waters is a major concern. Alternative systems permitted by theDepartment of Environmental Protection, such as aerobic systems, may provide sufficientwastewater treatment to meet existing water-quality st<strong>and</strong>ards.The data <strong>and</strong> analysis suggests seven steps that should be taken by the City to address theseidentified problems, including:• Undertake steps to replace failing systems;• Utilize alternative disposal systems that provide greater levels of treatment;• Provide environmental education for on-site providers;• Promote septic tank maintenance;• Consider a municipal wastewater management system;• Identify funding for a municipal wastewater system;• Create a funding source for wastewater treatment; <strong>and</strong>• Meet 1999 <strong>Florida</strong> Legislature Level of Service St<strong>and</strong>ardsReview of the Goals, Objectives <strong>and</strong> Policies in the City’s Sanitary Sewer, Drainage, <strong>and</strong> Potable<strong>Water</strong> Element revealed that specific action steps recommended above were not incorporatedinto the proposed Goals, Objectives, <strong>and</strong> Policies.30
For example, Policy 3-1.2.1: On-Site Disposal System Inspection System/Compliance Program,indicates that in coordination with the Department of Health, the City will inspect on-sitedisposal systems; however, the data <strong>and</strong> analysis indicates that the Department of Health doesnot have the authority to inspect on-site disposal systems. The policy does not indicate howdeficient systems that may be identified would be upgraded to meet the applicable statest<strong>and</strong>ards. There are no policies to encourage alternative disposal systems that provide greaterlevels of treatment; provide environmental education for on-site providers; promote septic tankmaintenance; to consider a municipal wastewater system; or provide a funding source forwastewater treatment.Policy 3-3.1.2, Provide Concurrency Management, indicates that the City shall provide aConcurrency Management System that will ensure that no permits will be issued for newdevelopment unless adequate surface water management facilities needed to supportdevelopment at the adopted level of service st<strong>and</strong>ards are available. However, according toPolicy 3-3.1.3, a water quality level of service st<strong>and</strong>ards for residential development will not beestablished until the effective date of the plan.Policy 3-1.3.3: to establish an Interlocal Agreement with Key West to allow wastewater from themarina pump-out boats to be hauled <strong>and</strong> treated at the Key West Municipal <strong>Wastewater</strong>Treatment Facility, does not indicate any interim measures that will be taken to ensure thatwastewater collected from the marina will be sufficiently collected <strong>and</strong> treated. On September21, 2003, Council Staff conducted a DRI pre-application meeting with the City of Marathon forthe Boot Key DRI project.The City’s table identifying DEP Permitted <strong>Wastewater</strong> Treatment <strong>Facilities</strong>, only identified sixtynineof the seventy-one facilities identified in the County’s Draft Sanitary Sewer Master Plan,March 2000. These package plants treat effluent to secondary treatment st<strong>and</strong>ards <strong>and</strong> thendischarged through deep well injection.Table 21City of MarathonDEP Permitted <strong>Wastewater</strong> Treatment <strong>Facilities</strong> 332003PermittedPermittedFacility Capacity Facility Capacity1. Hawk’s Nest 0.0100 36. Galaway Bay 0.03802. Hampton Inn Marathon 0.0220 37. Boot Key Harbor 0.04003. Casa Cayo 0.0032 38. Faro Blanco 0.01004. USCG – Marathon 0.0025 39. Marathon Govt. Cntr. 0.01005. Buccaneer Resort 0.0300 40. Turtle Hospital 0.02106. Switlik Elementary 0.0150 41. Mid Town 0.00757. Lady Alex 0.0050 42. Trailerama MHP 0.01008. Harbor House – Marathon 0.0050 43. Gulf Shore Apts. 0.00759. Tropic Isle Apts. 0.0100 44. Guidance Clinic 0.020010. Sombrero Ridge 0.0050 45. Marathon Key Bch Club 0.030011. Blackfin 0.0080 46. Home Depot 0.010012. Marathon CC Condo 0.0080 47. Marathon Plaza 0.005013. Wendy’s 0.0040 48. P<strong>and</strong>a House 0.006414. Tradewinds West 0.0064 49. Captain’s Quarters 0.003033 Source: City of Marathon31
Table 21City of MarathonDEP Permitted <strong>Wastewater</strong> Treatment <strong>Facilities</strong> 342003 (Cont.)PermittedPermittedFacility Capacity Facility Capacity15. Cobia Point 0.0042 50. Coral Club 0.005016. Cracked Conch 0.0030 51. Dockside 0.003517. Harbor Club S. 0.0090 52. Isl<strong>and</strong> Club 0.008018. Marathon High School 0.0150 53. Marathon Manor 0.015019. Publix 0.0300 54. Schooner 0.005020. Sombrero Beach Village 0.0050 55. Sombrero Country Club 0.010021. Sombrero Resort 0.0200 56. Spanish Galleon 0.005022. Eastwinds 0.0600 57. Gulfside Village 0.008023. K-mart Shopping Center 0.0150 58. IHOP 0.009424. Key’s RV Park 0.0150 59. Lucy’s 0.003025. Reef at Marathon 0.0170 60. Shucker’s 0.004026. Kingsail 0.0150 61. Seahorse Motel 0.007527. Marathon Airport 0.0075 62. Pizza Hut – Marathon 0.008028. Office Depot – Marathon 0.0085 63. Key Lime 0.025029. Seawatch 0.0240 64. Coral Lagoon 0.008830. Holiday Inn 0.0350 65. Ramada Inn 0.025031. Isl<strong>and</strong> Tiki Bar 0.0125 66. Quay – Marathon 0.015032. Bonefish Towers 0.0500 67. Coco Plum Apts. 0.008333. Marie’s 0.0090 68. Royal Plum 0.010034. Treasure Cay 0.0050 69. Pelican Motel 0.015035. Jolly Roger 0.030034 Source: City of Marathon32
B. City of Key WestCity of Key West <strong>Water</strong> TreatmentPotable water is provided to the City of Key West through the FKAA. The City identifies theaverage daily flow in 1988 to be 4.82 mgd <strong>and</strong> a system capacity allocable to Key West as 4.13mgd with an overall capacity of the system as 15.7 mgd. Potable water dem<strong>and</strong> projections forthe City of Key West are included in Table 22.The City indicates that the Stock Isl<strong>and</strong> Reverse Osmosis <strong>Water</strong> Treatment plant is used foremergency purposes only <strong>and</strong> can be operational within 36 hours <strong>and</strong> that the plant has anoperating capacity of 2.7 mgd <strong>and</strong> a 5.0 mg storage facility.Table 22Potable <strong>Water</strong> Dem<strong>and</strong> ProjectionsCity of Key West 351991Dem<strong>and</strong>Year Population (mgd)1990 24,652 4.131995 25,372 4.222000 26,119 4.232005 26,895 4.332010 27,701 4.43City of Key West <strong>Wastewater</strong> ElementThe City’s wastewater treatment facility is located on Fleming Key <strong>and</strong> began operation inFebruary 1989. All but four sections of the City are served, including an area to the southeast ofthe airport; an area along North Roosevelt Boulevard near the bridge to Sigsbee Park; a smallarea along North Roosevelt Boulevard across from the Key West Yacht Club; <strong>and</strong> parts of theCity on Stock Isl<strong>and</strong>.The <strong>Wastewater</strong> Treatment Plant has a design capacity of 7.2 mgd average daily flow <strong>and</strong> 10.0mgd maximum month average design capacity. Although Table 23 identifies an annual averageflow of 5.82 in 1989, the average annual flow for approximately the same period in 1990 wasidentified as 6.28 mgd. Additionally, the City’s Sanitary Flow Projection identifies annualaverage flows to be 4.73 mgd <strong>and</strong> would increase to 5.16 mgd by the year 2010 with a projectedpopulation increase of 3,049 by the year 2010 over the 1990 population (Table 24). Curiously theresidential population for the City in 1990 is identified in the Potable <strong>Water</strong> Element as 24,652while the Sanitary Sewer Element provides for a population of 18,652, a difference of 6,000people. By 2010 the population figures provided are 27,701 <strong>and</strong> 21,701, also a 6,000 persondifference35 City of Key West33
The <strong>Wastewater</strong> Treatment Plant provides secondary treatment <strong>and</strong> originally discharged intoHawks Channel <strong>and</strong> the Atlantic Ocean. The ocean outfall was only projected to be in use foronly 2-5 years until the deep well injection facility was completed.In 1993, the City’s <strong>Wastewater</strong> collection <strong>and</strong> transmission system consisted of approximately295,000 linear feet of gravity <strong>and</strong> pressure sewer pipe ranging in diameter from 8 to 30-inches.The collection system is divided into eight districts (A, B, C, D, DA, E F, G). However, the City’sComprehensive plan also identifies a District H, I J when identifying the pump station capacityby district.Table 23<strong>Wastewater</strong> Treatment <strong>Facilities</strong> <strong>and</strong> CapacityCity of Key West 361989AnnualDesign Average AvailableCapacity Flow CapacityFacility (mgd) (mgd) (mgd)City of Key West 10.0 5.82 2.78Hampton Inn 0.03 0.028 0.002Martha’s Restaurant <strong>and</strong>Benihana’s 0.017* 0.004 0Key Ambassador Resort 0.020 0.009 0.001Monroe County Offices 0.012 0.002 0.009Gerald Adams Elementary 0.010 0.001 0.008<strong>Florida</strong> Keys Comm. College 0.015 0.006 0.005<strong>Florida</strong> Keys Memorial Hosp. 0.040 0.019 0.017Key West Resort Utilities 0.250 0.160 0.035Scotty’s 0.0012 NA NA*Permitted flow 3,400 gpd due to drainfield sizeTable 24<strong>Wastewater</strong> Flow Projections 37City of Key West, 1991Dem<strong>and</strong>Year Population (mgd)1990 18,652 4.731995 19,372 4.832000 20,119 4.932005 20,895 5.052010 21,701 5.1636 City of Key West37 City of Key West34
Primary Canal Network as Community AssetsThe region’s drainage system is generally comprised of primary system of canals. Canalsoperated by the <strong>South</strong> <strong>Florida</strong> <strong>Water</strong> Management District (SFWMD), a secondary canal systemoperated by either each County, a municipality, a special taxing district, <strong>and</strong> a third systemassociated with streets, parking lots, storm sewers <strong>and</strong> on-site detention/retention systems. Forthe purposes of this study, only primary <strong>and</strong> secondary drainage systems will be inventoried <strong>and</strong>are generally depicted in the <strong>South</strong> <strong>Florida</strong> Regional Planning Council Map series.The SFWMD operates <strong>and</strong> maintains the primary canal system <strong>and</strong> establishes discharge limitsfor releases into the secondary canal system. Limitations on discharge are determined by thecapacity of the receiving primary canal to accept <strong>and</strong> safely remove storm water.In addition to providing drainage, some of these primary canals also provide recreationalopportunities or have been identified as community assets for community redevelopment.Cutler Ridge MallDowntown KendallNorth Miami BeachMiami Shores/El PortalMiami RiverOakl<strong>and</strong> Park (North Fork New River)OjusLauderdale LakesAs community assets, more <strong>and</strong> more community redevelopment plans will identifyopportunities to turn canal front properties into community assets. Instead of being a utility thatruns through or divides a community, new redevelopment opportunities will look towardtransforming these canals into promenades, linear parks, bikeways, waterfront residential ormixed-use developments. In some community redevelopment plans, ornamental bridges <strong>and</strong>pedestrian crossings are also envisioned. The District must make every attempt to work withcommunities along its canals to ensure that redevelopment can be accommodated withoutreducing the maintenance access <strong>and</strong> conveyance.One major objective of the <strong>South</strong> <strong>Florida</strong> <strong>Water</strong>, <strong>Wastewater</strong> <strong>and</strong> <strong>Stormwater</strong> <strong>Facilities</strong> <strong>Study</strong> is tostrengthen coordination of water supply planning <strong>and</strong> development activities. This coordinationis linked through each local comprehensive plan. Currently, each local government within theregion is beginning to conduct updates to their plan through the Evaluation <strong>and</strong> AppraisalReport (EAR) process. Local Government Comprehensive Plans <strong>and</strong> subsequent EAR’s are to bebased upon “best available data”. A st<strong>and</strong>ardized data source for public facilities will provide aconsistent <strong>and</strong> uniform means to conduct meaningful updates to the comprehensive plans.Currently, the <strong>South</strong> <strong>Florida</strong> Regional Planning Council has requested <strong>and</strong> received the authorityby the Department of Community Affairs to review local government comprehensive EAR. TheEAR delegation agreement is attached. This agreement will help to provide assurances to theDistrict that water supply planning <strong>and</strong> development activity within the region is linked.Review of existing adopted Comprehensive Plans for each County <strong>and</strong> major city indicates thatdata for drainage is routinely limited to the identification of primary facilities. Secondary35
systems are not identified. Review of Section 163.3177(6)(f) F.S. <strong>and</strong> 9J-5.011(1) F.A.C. revealsthat no specific level of data is required to be provided; therefore, there is no uniform report ofthe data. Clarification of the rule may be recommended.Consistency With Lower East Coast <strong>Water</strong> Supply PlanThe Lower East Coast <strong>Water</strong> Supply Plan provides an implementation strategy to ensure thatwater supplies are available to meet the dem<strong>and</strong>s of the natural system, agricultural uses, <strong>and</strong>urban development through the year 2020. This study will augment the Lower East Coast <strong>Water</strong>Supply Plan by ensuring the local government growth plans utilize consistent data <strong>and</strong>projections for water supply planning.The study area for this study includes a portion of Lower East Coast <strong>Study</strong> Area <strong>and</strong> all of LowerEast Coast <strong>Study</strong> Areas 2, 3. A portion of northern Broward County falls within Lower EastCoast Service Area 1 <strong>and</strong> includes a portion of Broward County Drainage District 2A, DeerfieldBeach, the North Springs Improvement District, <strong>and</strong> Parkl<strong>and</strong>. Lower East Coast <strong>Study</strong> Area 2includesmost of Broward County <strong>and</strong> Lower East Coast <strong>Study</strong> Area 3 includes most of Miami-DadeCounty.The Lower East Coast <strong>Study</strong> includes 46 recommendations with several of the recommendationsspecific to improvements within <strong>Study</strong> Areas 1, 2 <strong>and</strong> 3. These recommendations will beconsidered in future Tasks of this study <strong>and</strong> can be reviewed for integration into localgovernment capital improvement plans as part of the EAR <strong>and</strong> EAR amendments. The LowerEast Coast <strong>Study</strong> also identifies the following <strong>Water</strong> <strong>and</strong> <strong>Wastewater</strong> facility capacities.The Lower East Coast Regional Supply Plan identifies the following potable water treatmentcapacities in 1995 (Table 25).Table 25Potable <strong>Water</strong> Utilities 381995 mgdMiami Sewer <strong>and</strong> <strong>Water</strong> Department 168.2Miami Sewer <strong>and</strong> <strong>Water</strong> Department 166.8City of Fort Lauderdale 48.7City of Hollywood 19.3City of Sunrise 18.1City of Pompano Beach 16.23City of North Miami BeachNACity of Plantation 13.9<strong>Florida</strong> Keys Aqueduct Authority 14.08City of Pembroke Pines 9.33City of Homestead 6.47City of Deerfield Beach 11.3Broward County 14.5538 Source: SFWMD36
The Lower East Coast Regional Supply Plan identifies the following wastewater treatmentcapacities in 1995 (Table 26).Table 26<strong>Wastewater</strong> UtilitiesCapacity (mgd)Broward North Regional 80.0City of Hollywood 42.0City of Sunrise .99Plantation Regional 15.00Pompano Beach 2.50Homestead 2.25Krome Service Center 2.25Miami-Dade <strong>South</strong>ern District 88.73Miami-Dade Central District 150.84Miami-Dade Northern District 116.94Duck Key .10Key West Resort Utility .50Source: SFWMD37
Task 1BPopulation Projections for <strong>South</strong> <strong>Florida</strong>The Miami-Dade, Broward <strong>and</strong> Monroe County Comprehensive plans do not currently providepopulation projections beyond the year 2010. As depicted in Table 27, population projectionsused for planning purposes can vary.Developing population projections for a region that grows as fast as <strong>South</strong> <strong>Florida</strong> is a challenge.The region that includes Monroe, Miami-Dade <strong>and</strong> Broward Counties has added between 560<strong>and</strong> 770 thous<strong>and</strong> new residents each decade since 1950. Official projections published by theUniversity of <strong>Florida</strong>’s Bureau of Economic <strong>and</strong> Business Research (BEBR) suggest that the regionwill continue to grow by approximately 600 thous<strong>and</strong> new residents in each of the next threedecades (Table 28).Although no official projections are available beyond 2030, a recent study prepared as part of theupdate of the Comprehensive Everglades Restoration Plan (CERP) projected that populationgrowth during the following two decades (2030-2050) would be greater than half a million ineach decade, bringing regional population from just under 4 million in 2000 to 6.8 million fiftyyears later, an increase of over 70%.In planning for future infrastructure needs in a region this large, the location of growth withinthe region <strong>and</strong> within the three counties is almost important as the amount of growth. Today,there is no single source of population projections for the region as a whole that includes subcountygeography. Each of the county planning departments prepares estimates <strong>and</strong> projectionsthat are used for local planning purposes. The methodology used in each county is different, butthey all have in common an increasing use of the analysis of available l<strong>and</strong> to determine wherefuture population growth will be located within the county. Both Miami-Dade County <strong>and</strong>Broward County produce projections for Traffic Analysis Zones (TAZs) that are consistent withtheir countywide totals. These, in turn, can be aggregated to enable census tract <strong>and</strong> municipaltotals for planning purposes.Monroe County is engaged in discussions with regard to implementation of the <strong>Florida</strong> KeysCarrying Capacity <strong>Study</strong>, which will have a significant impact on the amount of populationgrowth that will take place in the <strong>Florida</strong> Keys in the coming decades. Although thosediscussions have not been finalized at this time, it is safe to say that the amount of growth will besmall when compared to the projected growth in Miami-Dade <strong>and</strong> Broward Counties. Especiallyimportant for the estimation of the need for capital facilities in Monroe County are projections ofthe seasonal population, which includes tourists, “day-trippers” <strong>and</strong> part-time residents. MonroeCounty indicates that it is updating its population projections at this time to take into account theresults of the 2000 Census.As might be expected, county projections are not always consistent with the official projectionspublished by BEBR. However, the current differences are not large, as can be seen in Table 1. Itis important to note that the counties coordinate with the local school boards <strong>and</strong> MetropolitanPlanning Organizations to ensure consistency in the population base used to determine need forschool <strong>and</strong> transportation services.Finally, please note that the <strong>South</strong> <strong>Florida</strong> Regional Planning Council (SFRPC) <strong>and</strong> the TreasureCoast Regional Planning Council (TCRPC) have created a partnership to acquire <strong>and</strong> use aregional economic forecasting model. Implementation of the forecasting model will require the38
development of basic assumptions about population growth over a planning horizon of at least20 years. We plan to convene the partnership before the end of 2003 to begin these discussions.At this time, the best available countywide projections for the required 50-year horizon are thosepresented in the US Army Corps of Engineers report “Municipal <strong>and</strong> Industrial (M&I) <strong>Water</strong> useForecast, Initial Comprehensive Everglades Restoration Plan (CERP) Update” (August 2003).Since these are not available for sub-county geography, the SFRPC will work with the counties, incoordination with the economic forecasting effort, to develop a set of sub-county projections forthe planning horizon.Table 28Comparison ofReported Resident Population Estimates for<strong>South</strong> <strong>Florida</strong> RegionSource 2000 2005 2010Miami-Dade Comp Plan, 1988 1,943,400 2,183,267 2,536,494Miami-Dade EAR Report, 1996 2,102,000 NA 2,331,000Miami-Dade <strong>Water</strong> <strong>and</strong> Sewer, 2002 2,253,485 NA NABroward County Comp Plan, 1989 1,475,248 NA 1,606,013Monroe County Comp Plan, 1997 89,800 NA 99,60039
Table 27<strong>South</strong> <strong>Florida</strong> <strong>Water</strong>, <strong>Wastewater</strong> <strong>and</strong> Drainage <strong>Study</strong>Demographic BaselineSource 2000 2005 2010 2015 2020 2025 2030 2035 2040 20452050USACE, Municipal <strong>and</strong> Industrial (M&I) <strong>Water</strong> Use Forecast, Initial Comprehensive Everglades Restoration Plan (CERP) Update (August 2003)Broward 1,623,018 1,772,800 1,931,600 2,092,300 2,257,100 2,416,900 2,562,900 2,658,825 2,754,751 2,850,884 2,947,017Miami-Dade 2,253,362 2,403,200 2,554,300 2,706,500 2,862,000 3,011,900 3,148,100 3,323,653 3,499,205 3,654,920 3,810,635Monroe 79,589 81,300 82,200 83,100 84,100 85,000 85,800 86,700 87,600 88,500 89,400Regional Total 3,955,969 4,257,300 4,568,100 4,881,900 5,203,200 5,513,800 5,796,800 6,069,178 6,341,556 6,594,304 6,847,052University of <strong>Florida</strong>, Bureau of Economic <strong>and</strong> Business Research (May 2001)Broward 1,623,018 1,785,700 1,949,400 2,117,300 2,289,900 2,458,200 2,612,700Miami-Dade 2,253,362 2,405,100 2,557,100 2,712,100 2,870,600 3,024,200 3,164,300Monroe 79,589 80,300 81,100 81,800 82,600 83,300 84,000Regional Total 3,955,969 4,271,100 4,587,600 4,911,200 5,243,100 5,565,700 5,861,000 0 0 0 0Broward County (2003) 1,623,018 1,789,916 1,954,572 2,117,038 2,273,287 2,418,641 2,548,303Miami-Dade County (2001) 2,253,362 2,402,105 2,551,284 2,703,114 2,858,185 3,019,785Monroe County (1999) 85,622 88,305 90,236 90,65440
Appendix BSurvey <strong>and</strong> Survey Results
Appendix CAdditional Monroe County <strong>Wastewater</strong> Treatment FacilityInformation
City of Key WestThe sewer treatment plant <strong>and</strong> sewer collection system operation <strong>and</strong> maintenance is contractedto Operations Management International, Inc. (OMI). OMI employs 25 people at its Key Westfacility. <strong>Wastewater</strong> is treated <strong>and</strong> pumped into the ocean through an outfall. The new treatmentplant was constructed in 1989 <strong>and</strong> was designed <strong>and</strong> permitted to process sewage at a rate of 10million gallons per day (MGD).Currently, average flows are approximately 4 MGD, a reduction from 8 MGD two years ago. Thisreduction in flow indicates the success of the $56 million collection system rehabilitation.Seawater inflow that previously entered the system <strong>and</strong> had to be unnecessarily pumped to theplant no longer occurs.The City has spent more than $67 million over the past 3 years on sewer capital improvements torebuild the collection system, replace the ocean outfall with a Class I Deep Injection Well, <strong>and</strong>upgrade the current Sewer Treatment Plant to an Advanced <strong>Wastewater</strong> Treatment (AWT)facility.Key Colony BeachThere is no information available on the wastewater treatment facilities located in Key ColonyBeach.Islamorada: Village of Isl<strong>and</strong>sTreatment <strong>and</strong> disposal of wastewater in the Village is performed by residential <strong>and</strong> businessowners through privately owned, operated <strong>and</strong> maintained wastewater systems. There are nopublic wastewater treatment facilities operating in the Village. The wastewater facilities in theVillage consist of on-site wastewater disposal <strong>and</strong> treatment systems (OSTDS) that are permitted bythe State of <strong>Florida</strong> Department of Health (DOH), including subst<strong>and</strong>ard septic systems, <strong>and</strong>“package” or “pre-engineered” wastewater treatment plants permitted by the DEP. There are alsocesspools <strong>and</strong> other undocumented systems scattered throughout the Village. Table 1-7 provides abreakdown of the inventory of existing wastewater facilities within the Village.TABLE 1-7: BREAKDOWN OF EXISTING WASTEWATER FACILITIESKey# ofUnknownSystemsEst. # ofCesspoolsFoundCesspoolsEst.Subst<strong>and</strong>ardSeptic Systems# ofPermitted(ATU) SepticSystems# ofPermittedWW<strong>Facilities</strong>Plantation 559 176 22 117 10 new 23KeypermitsWindleyKey4 0 1 4 -- 8UpperMatecumbeKeyLowerMatecumbeKeys213 41 21 40 6 newpermits183 20 15 27 4 newpermitsSource: Islamorada: Village of Isl<strong>and</strong>s Comprehensive Plan, Chapter 4 D.I.A.306
Approximately 60 percent of the wastewater flow is treated by OSTDS. One <strong>and</strong> two-familydwellings commonly use septic tanks, <strong>and</strong> currently many campgrounds <strong>and</strong> mobile home parks inthe County are also serviced by either septic tanks or package plants. The HRS is the entityresponsible for the issuance of permits for on-site disposal systems.Private package treatment plants treat approximately 35 percent of the wastewater flow <strong>and</strong>about 5 percent is conveyed into cesspools. All of the package plants serve site-specific purposes<strong>and</strong> are privately owned, operated <strong>and</strong> maintained. As of 1999, there were 66 DEP permittedwastewater treatment facilities within Islamorada. The total capacity of these facilities is 1.0304mgd. Table 1-8 shows permitted capacity values for package treatment plants within theVillage’s jurisdiction.Factors such as rapid growth <strong>and</strong> the reliance upon private enterprise for the construction <strong>and</strong>operation of wastewater treatment facilities has caused a proliferation of small package treatmentplants <strong>and</strong> an enormous inventory of individual septic tanks.Table 1-8FACILITY ADDRESS CAPACITY, MGD1 Boy Scouts Sea Base 73800 Overseas Highway 0.0252 Caloosa Cove 73801 Overseas Highway 0.0253 S<strong>and</strong>y Point Condo 108 Costa Brava Drive 0.00334 Captain's Cove Condo Gulf View Drive 0.015 (not in service)5 Matecumbe Resort 76261 Overseas Highway 0.016 White Gate Court 78 MM, Bay UIC7 Papa Joe's Restaurant 79.7 MM, Bay 0.0058 Lazy Days 79867 Overseas Highway 0.00959 Palms of Islamorada 79901 Overseas Highway 0.0210 Hampton Inn 80 MM, Ocean 0.02511 Breezy Palms Resort 80.1 MM, Ocean 0.01512 La Siesta Resort 80.4 MM, Ocean 0.0125 (with reuse)13 S<strong>and</strong> Pebbles Condo 80450 Overseas Highway 0.01514 Maison Matecumbe 80639 Overseas Highway 0.009515 Uncle's Restaurant 80939 Overseas Highway 0.01516 Tarpon Flats 81 MM, Bay 0.00617 Dino's Restaurant 81031 Overseas Highway 0,007518 Wet Net Club 81101 SR 4A 0.0075 (not built)19 Green Turtle Inn 81 MM, Ocean 0.0120 Worldwide Sportsman 81576 Overseas Highway 0.02 (to be upgraded)21 Mexican Cantina (Time OutBBQ) 81.5 MM, Ocean 0.00522 Morada Bay 81.5 MM, Bay 0.01523 Islamorada Bakery 81620 Overseas Highway 0.00924 Squid Row 81901 Overseas Highway 0.00925 Woody's 81.9 MM, Bay 0.003326 Lorelei Madeira Road 0.007527 Islamorada Professional Bldg. 81990 Overseas Highway UIC28 Cheeca Lodge 82 MM, Ocean 0.07 (with reuse)29 Pelican Palms Trailer Park 82.7 MM, Ocean 0.007530 Theater of the Sea 82.7 MM, Ocean UIC31 Sunset Inn 82200 Overseas Highway 0.032
FACILITY ADDRESS CAPACITY, MGD32 The Beach House 82748 Overseas Highway 0.0133 Days Inn 82749 Overseas Highway 0.008334 Bentley's Restaurant 82779 Overseas Highway 0.00435 Coral Grill 83.5 MM, Bay 0.01836 Whale Harbor Inn 83.7 MM, Ocean 0.0437 Beacon Reef Condo 83201 Overseas Highway 0.02538 Chesapeake Resort 83409 Overseas Highway 0.007539 Holiday Isle 84 MM, Ocean 0.0440 Howard Johnson's 84 MM, Ocean 0.0341 Pelican Cove 84457 Old Highway 0.01542 Harbor Lights 84951 Overseas Highway 0.0243 Windley Key Trailer Park 84961 Overseas Highway 0.007544 Tropical Reef Resort 84977 Overseas Highway 0.0245 Smuggler's Cove 85.5 MM, Bay 0.00946 Hawk Channel Bar & Grille 85.5 MM, Ocean 0.01547 Careless Navigator 85361 Overseas Highway 0.00948 USCG Station 183 Palermo Drive 0.00549 Pelican Plaza / Jammers 86701 Overseas Highway 0.01550 Executive Bay Club 87 MM, Bay 0.0551 Seabreeze Trailer Park 87.2 MM, Ocean 0.0075 (to be upgraded)52 Plantation Yacht Harbor 87000 Overseas Highway 0.03553 Plantation by the Sea 87465 SR 4A 0.0254 Ocean Harbour 87851 SR 905 0.02455 Marker 88 88 MM, Bay 0.01556 Coral Harbour 88181 Old Highway 0.01557 Summer Sea Condo 8850 Overseas Highway 0.02658 Indian <strong>Water</strong>ways 89240 Overseas Highway UIC59 Plantation Key Gov. Ctr. 2 High Point Road 0.0160 Old Mariner's Hospital 50 High Point Road 0.0461 Plantation Key Elementary 100 Lake Street 0.0262 Coral Shores High School 90 MM, Ocean 0.01563 Sea Gulls Condo 100 Wrenn Street 0.017564 Turek Building 90.5 MM, Bay 0.00565 Tavenier Harbor 90311 Overseas Highway 0.01566 Tropic Vista Motel/TropicalCafé 90701 Overseas Highway 0.005Source: <strong>Florida</strong> Department of Environmental Protection, Marathon 1999UIC = Underground injection controlCity of MarathonTreatment <strong>and</strong> disposal of wastewater in the City of Marathon is performed by residential <strong>and</strong>business owners through privately owned, operated <strong>and</strong> maintained wastewater systems. Thewastewater facilities in the City consist of on-site wastewater disposal <strong>and</strong> treatment systems thatare permitted by the State of <strong>Florida</strong> Department of Health (DOH), including subst<strong>and</strong>ard septicsystems, <strong>and</strong> “package” or “pre-engineered” wastewater treatment plants permitted by the DEP.There is also property that has been determined to have cesspools or undocumented systems.3
As of February 1998 there were 65 active <strong>Florida</strong> Department of Environmental Protection (DEP)permitted wastewater treatment plants with the prescribed Marathon area, with capacitiesranging from 0.0025 million gallons per day (mgd) to 0.22 mgd. According to the FDOH thereare 1,081 FDOH permitted septic tanks within the Marathon area. <strong>Wastewater</strong> flows that are nottreated by FDEP permitted treatment plants or FDOH permitted septic tanks are discharged tounpermitted septic systems or cesspits. Based on aerial photographs of the Marathon area, thereare 4,500 developed lots that utilize on-site wastewater treatment systems, which indicates that asmany as 3,400 lots may be using unpermitted facilities.Table 1-9Breakdown Of Existing <strong>Wastewater</strong> <strong>Facilities</strong>SingleFamilySepticMulti-FamilySeptic Systems# of CommercialPermitted Septic Systems# of Permitted<strong>Wastewater</strong> PackagePlants3431 1083 1081 71Source: City of Marathon Comprehensive PlanAccording to the <strong>Water</strong> Quality Protection Plan (WQPP) Phase II Report for the <strong>Florida</strong> KeysNational Marine Sanctuary, it is estimated that 24 percent of wastewater treatment is h<strong>and</strong>led bywastewater treatment plants, 63 percent by septic tanks, <strong>and</strong> 13 percent by cesspits. 39In addition to the 65 active wastewater treatment plants in the Marathon area, it is reported thatthere are 2 inactive plants, 1 plant that is being re-permitted <strong>and</strong> reconstructed, <strong>and</strong> 3 plants thathold permits, but are not yet constructed. 40The total permitted capacity of the 71 plants is 1.43 mgd. Of the 71 plants, 20 41 have capacities of0.02 mgd or greater <strong>and</strong> have a combined capacity of 1.01, which is 71 percent of the totalwastewater treatment plant capacity in the Marathon area. The remaining 51 plants have a totalcapacity of 0.42 mgd. Please see the Table 1-10 for a list of all the facilities located in theMarathon area, their permitted capacities <strong>and</strong> average daily flow. Map 1-19 shows the location ofeach facility listed below.Table 1-10Fac. PlanMap #Facility NamePermittedCapacity(mgd)Average DailyFlow (mgd)ExcessCapacity(mgd) 1AvailableExcess Capacity(mgd)1 Bonefish Tower 0.05 0.01 0.03 0.01753 Boot Key Marina 0.04 0.006 0.031 0.0214 Buccaneer Lodge 0.03 0.012 0.013 0.00555 Eastwind Apts. 0.06 0.016 0.014 0.0266 Fisherman's Hospital 0.021 0.011 0.009 0.00387 Galway Bay MHP 0.038 0.015 0.014 08 Guidance Clinic 0.02 0.006 0.011 0.00639 Pg. 4-240 Pg. 4-241 2 of the 20 plants have not yet been constructed.4
Fac. PlanMap #Facility NamePermittedCapacity(mgd)Average DailyFlow (mgd)ExcessCapacity(mgd) 1AvailableExcess Capacity(mgd)9 Hall's Resort 2 0.02 n/a n/a n/a10 Harborside @ Marathon 2 0.06 n/a n/a n/a11 Hawk's Cay Resort 3 0.196 0.058 0.126 0.07712 Holiday Inn/Marathon 0.035 0.021 0.0 0.022513 Howard Johnson's 0.025 0.026 0.0 0.014 Jolly Roger Travel Park 0.03 0.012 0.014 0.006515 Key Colony Beach 0.22 0.184 0.0 0.016 Key Lime Resort 0.025 0.011 0.011 0.004817 Marathon Key Beach Club 0.03 0.012 0.014 0.006518 Marathon Trailerama 0.02 0.0094 0.008 0.00371 Publix 4 0.03 0.0034 0.026 0.018519 Seawatch Condo 0.04 0.004 0.0337 0.023720 Sombrero Resort 0.02 0.007 0.0097 0.004721 Captain's Quarters Condo 0.003 0.0017 0.0 0.022 Casa Cayo Condo 0.0032 0.0009 0.0012 0.000423 Cobia Point Condo 0.0042 0.0016 0.0009 024 Coco Plum Beach Apt.s 0.0083 0.0024 0.0023 0.000225 Coral Club Condo 0.005 0.0014 0.0027 0.001526 Coral Lagoon Resort 0.0088 0.0039 0.0005 0.027 Dockside Lounge 0.0035 0.0036 0.0 0.028 Faro Blanco Resort 0.01 0.0041 0.004 0.0015Gator's Restaurant (T&W29 Seafood) 0.0075 0.001 0.0045 0.002630 Gulfside Village 0.008 0.0028 0.002 0.031 Harbor Club <strong>South</strong> Condo 0.01 0.0012 0.008 0.005532 Harbor House Condo 0.005 0.0015 0.0017 0.000533 Hawk's Nest 0.01 0.0028 0.0057 0.00322 Home Depot 0.01 n/a n/a n/a34 Hurricane/Econo (Blackfin) 0.008 0.0038 0.002 0.035 Int'l House of Pancakes 0.0097 0.0029 0.006 0.036 Isl<strong>and</strong> Club Condo 0.008 0.0017 0.005 0.00337 Key RV Park 0.015 0.0064 0.004 0.000338 Kingsail Resort 0.0033 0.0018 0.0003 0.039 K Mart Plaza 0.015 0.0086 0.002 0.040 Lady Alex<strong>and</strong>er Condo 0.005 0.0008 0.0033 0.002141 Lucy Apartments 0.003 0.0022 0.0 0.042 Leigh-de Sanctis (Tropic Isles) 5 0.01 0.0014 0.0082 0.005743 Marathon Airport 0.0075 0.001 0.0065 0.004644 Marathon Country Club 0.008 0.0026 0.0047 0.045 Marathon High School 0.015 0.0035 0.007 0.003346 Marathon Manor 0.015 0.001 0.0017 0.05
Fac. PlanMap #Facility NamePermittedCapacity(mgd)Average DailyFlow (mgd)ExcessCapacity(mgd) 1AvailableExcess Capacity(mgd)47 Marathon Marina 2 0.01 n/a n/a n/a48 Marie's Yacht Harbor Club 0.009 0.0007 0.008 0.005849 Mid-Town Trailer Park 0.0075 0.0026 0.0028 0.000950 Monroe Reg. Service Center 0.01 0.0024 n/a n/a51 P<strong>and</strong>a House Restaurant 0.005 0.0012 0.003 0.001852 Pelican Motel <strong>and</strong> Trailer Park 0.015 0.0014 0.012 0.008353 Perry's Restaurant 6 0.004 0.002 0.001 0.054 Pizza Hut 0.008 0.0011 0.006 0.00455 Quay Restaurant 0.015 0.004 0.01 0.006356 Royal Plum Condo 0.01 0.004 0.002 0.057 Schooner Condo 0.005 0.0028 0.0 0.058 Seahorse Motel 0.0075 0.0017 0.0052 0.003359 Sombrero Beach Village 0.005 0.0018 0.002 0.000860 Sombrero Country Club 0.01 0.0036 0.004 0.001561 Sombrero Ridge Condo 0.0048 0.001 0.0028 0.001662 Spanish Galleon 0.005 0.0029 0.001 0.063 Stanley Switlik Elementary 0.015 0.004 0.008 0.004364 The Reef 0.017 0.0056 0.0097 0.005565 The Rock (Gulfshore) Apts. 0.0075 0.002 0.0048 0.002966 Tradewinds West 0.0064 0.0013 0.0044 0.002867 Treasure Cay Condo 0.005 0.001 0.003 0.001868 U.S. Coast Guard Station 0.0025 0.002 0.0 0.069 Wendy's 0.004 0.0022 0.0013 0.000370 Winn Dixie Plaza 0.0085 0.0048 0.0015 0.0TOTALS 1.4257 0.5465 0.5411 0.33331 Excess Capacity = (Permitted Capacity) – (Max. 3-month Avg. Daily Flow)2 Facility has not yet been constructed3 A 0.096 mgd expansion of this facility was completed in January 19984 Flows indicated for this new facility are based on DMRs from July 1998 to November 19985 Flows indicated for this new facility are based on DMRs from April 1998 to November 19986 Facility was inactive in February 19986
Hold for Map 1-19, locations of Marathon WW treatment plants7
Appendix DBasin L<strong>and</strong> Use data <strong>and</strong> runoff calculations
Appendix EStatutory Financing Mechanisms2
Section 130.01 Purposes for which county bonds may issue -- Whenever the board of countycommissioners of any county shall deem it expedient, or to the best interests of such county, toissue the county bonds of their county, for the purpose of constructing paved, macadamized, orother hard-surfaced highways, or erecting a courthouse or jail, or other public buildings, <strong>and</strong>funding the outst<strong>and</strong>ing indebtedness of the county, or for any of such purposes, they shalldetermine by resolution to be entered in their records, what amount of bonds is required for suchpurpose, the rate of interest to be paid thereon, <strong>and</strong> the time when the principal <strong>and</strong> interest ofsuch bonds shall be due <strong>and</strong> when payable.Section 166.111 Authority to borrow -- The governing body of every municipality may borrowmoney, contract loans, <strong>and</strong> issue bonds as defined in s. 166.101 from time to time to finance theundertaking of any capital or other project for the purposes permitted by the State Constitution<strong>and</strong> may pledge the funds, credit, property, <strong>and</strong> taxing power of the municipality for thepayment of such debts <strong>and</strong> bonds.Section 166.101 Definitions --As used in this part, the following words <strong>and</strong> terms shall have thefollowing meanings unless some other meaning is plainly indicated:(1) The term "bond" includes bonds, debentures, notes, certificates of indebtedness, mortgagecertificates, or other obligations or evidences of indebtedness of any type or character.(2) The term "general obligation bonds" means bonds which are secured by, or provide for theirpayment by, the pledge, in addition to those special taxes levied for their discharge <strong>and</strong> suchother sources as may be provided for their payment or pledged as security under the ordinanceor resolution authorizing their issuance, of the full faith <strong>and</strong> credit <strong>and</strong> taxing power of themunicipality <strong>and</strong> for payment of which recourse may be had against the general fund of themunicipality.(3) The term "ad valorem bonds" means bonds which are payable from the proceeds of advalorem taxes levied on real <strong>and</strong> tangible personal property.(4) The term "revenue bonds" means obligations of the municipality which are payable fromrevenues derived from sources other than ad valorem taxes on real or tangible personal property<strong>and</strong> which do not pledge the property, credit, or general tax revenue of the municipality.(5) The term "improvement bonds" means special obligations of the municipality which arepayable solely from the proceeds of the special assessments levied for an assessable project.(6) The term "refunding bonds" means bonds issued to refinance outst<strong>and</strong>ing bonds of any type<strong>and</strong> the interest <strong>and</strong> redemption premium thereon. Refunding bonds shall be issuable <strong>and</strong>payable in the same manner as the refinanced bonds, except that no approval by the electorateshall be required unless required by the State Constitution.(7) The term "governing body" means the council, commission, or other board or body in whichthe general legislative powers of the municipality shall be vested.(8) The term "project" means a governmental undertaking approved by the governing body <strong>and</strong>includes all property rights, easements, <strong>and</strong> franchises relating thereto <strong>and</strong> deemed necessary orconvenient for the construction, acquisition or operation thereof, <strong>and</strong> embraces any capitalexpenditure which the governing body of the municipality shall deem to be made for a public
purpose including the refunding of any bonded indebtedness which may be outst<strong>and</strong>ing on anyexisting project which is to be improved by means of a new project.Section 190.012 Special powers; public improvements <strong>and</strong> community facilities -- The districtshall have, <strong>and</strong> the board may exercise, subject to the regulatory jurisdiction <strong>and</strong> permittingauthority of all applicable governmental bodies, agencies, <strong>and</strong> special districts having authoritywith respect to any area included therein, any or all of the following special powers relating topublic improvements <strong>and</strong> community facilities authorized by this act:(1) To finance, fund, plan, establish, acquire, construct or reconstruct, enlarge or extend, equip,operate, <strong>and</strong> maintain systems, facilities, <strong>and</strong> basic infrastructures for the following:(a) <strong>Water</strong> management <strong>and</strong> control for the l<strong>and</strong>s within the district <strong>and</strong> to connect some or anyof such facilities with roads <strong>and</strong> bridges.(b) <strong>Water</strong> supply, sewer, <strong>and</strong> wastewater management, reclamation, <strong>and</strong> reuse or anycombination thereof, <strong>and</strong> to construct <strong>and</strong> operate connecting intercepting or outlet sewers <strong>and</strong>sewer mains <strong>and</strong> pipes <strong>and</strong> water mains, conduits, or pipelines in, along, <strong>and</strong> under any street,alley, highway, or other public place or ways, <strong>and</strong> to dispose of any effluent, residue, or otherbyproducts of such system or sewer system.(c) Bridges or culverts that may be needed across any drain, ditch, canal, floodway, holdingbasin, excavation, public highway, tract, grade, fill, or cut <strong>and</strong> roadways over levees <strong>and</strong>embankments, <strong>and</strong> to construct any <strong>and</strong> all of such works <strong>and</strong> improvements across, through, orover any public right-of-way, highway, grade, fill, or cut.(d) 1. District roads equal to or exceeding the specifications of the county in which such districtroads are located, <strong>and</strong> streetlights.2. Buses, trolleys, transit shelters, ridesharing facilities <strong>and</strong> services, parking improvements,<strong>and</strong> related signage.(e) Investigation <strong>and</strong> remediation costs associated with the cleanup of actual or perceivedenvironmental contamination within the district under the supervision or direction of acompetent governmental authority unless the covered costs benefit any person who is al<strong>and</strong>owner within the district <strong>and</strong> who caused or contributed to the contamination.(f) Conservation areas, mitigation areas, <strong>and</strong> wildlife habitat, including the maintenance of anyplant or animal species, <strong>and</strong> any related interest in real or personal property.(g) Any other project within or without the boundaries of a district when a local governmentissued a development order pursuant to s. 380.06 or s. 380.061 approving or expressly requiringthe construction or funding of the project by the district, or when the project is the subject of anagreement between the district <strong>and</strong> a governmental entity <strong>and</strong> is consistent with the localgovernment comprehensive plan of the local government within which the project is to belocated.(2) After the board has obtained the consent of the local general-purpose government within thejurisdiction of which a power specified in this subsection is to be exercised, to plan, establish,acquire, construct or reconstruct, enlarge or extend, equip, operate, <strong>and</strong> maintain additionalsystems <strong>and</strong> facilities for:2
(a) Parks <strong>and</strong> facilities for indoor <strong>and</strong> outdoor recreational, cultural, <strong>and</strong> educational uses.(b) Fire prevention <strong>and</strong> control, including fire stations, water mains <strong>and</strong> plugs, fire trucks, <strong>and</strong>other vehicles <strong>and</strong> equipment.(c) School buildings <strong>and</strong> related structures, which may be leased, sold, or donated to the schooldistrict, for use in the educational system when authorized by the district school board.(d) Security, including, but not limited to, guardhouses, fences <strong>and</strong> gates, electronic intrusiondetectionsystems, <strong>and</strong> patrol cars, when authorized by proper governmental agencies; exceptthat the district may not exercise any police power, but may contract with the appropriate localgeneral-purpose government agencies for an increased level of such services within the districtboundaries.(e) Control <strong>and</strong> elimination of mosquitoes <strong>and</strong> other arthropods of public health importance.(f) Waste collection <strong>and</strong> disposal.(3) To adopt <strong>and</strong> enforce appropriate rules following the procedures of chapter 120, inconnection with the provision of one or more services through its systems <strong>and</strong> facilities.(4) (a) To adopt rules necessary for the district to enforce certain deed restrictions pertaining tothe use <strong>and</strong> operation of real property within the district. For the purpose of this subsection,"deed restrictions" are those covenants, conditions, <strong>and</strong> restrictions contained in any applicabledeclarations of covenants <strong>and</strong> restrictions that govern the use <strong>and</strong> operation of real propertywithin the district <strong>and</strong>, for which covenants, conditions, <strong>and</strong> restrictions, there is no homeowners'association or property owner's association having respective enforcement powers. The districtmay adopt by rule all or certain portions of the deed restrictions that:1. Relate to limitations or prohibitions that apply only to external structures <strong>and</strong> are deemed bythe district to be generally beneficial for the district's l<strong>and</strong>owners <strong>and</strong> for which enforcement bythe district is appropriate, as determined by the district's board of supervisors; or2. Are consistent with the requirements of a development order or regulatory agency permit.(b) The board may vote to adopt such rules only when all of the following conditions exist:1. The district's geographic area contains no homeowners' associations as defined in s.720.301(9);3
2. The district was in existence on the effective date of this subsection, or is located within adevelopment that consists of multiple developments of regional impact <strong>and</strong> a <strong>Florida</strong> QualityDevelopment;3. The majority of the board has been elected by qualified electors pursuant to the provisions ofs. 190.006; <strong>and</strong>4. The declarant in any applicable declarations of covenants <strong>and</strong> restrictions has provided theboard with a written agreement that such rules may be adopted. A memor<strong>and</strong>um of theagreement shall be recorded in the public records.(c) Within 60 days after such rules take effect, the district shall record a notice of rule adoptionstating generally what rules were adopted <strong>and</strong> where a copy of the rules may be obtained.Districts may impose fines for violations of such rules <strong>and</strong> enforce such rules <strong>and</strong> fines in circuitcourt through injunctive relief.Chapter 163, PART III- COMMUNITY REDEVELOPMENT163.330 Short title, 163.335 Findings <strong>and</strong> declarations of necessity, 163.336 Coastal resort arearedevelopment pilot project, 163.340 Definitions, 163.345 Encouragement of private enterprise,163.346 Notice to taxing authorities, 163.350 Workable program, 163.353 Power of taxingauthority to tax or appropriate funds to a redevelopment trust fund in order to preserve <strong>and</strong>enhance the tax base of the authority, 163.355 Finding of necessity by county or municipality,163.356 Creation of community redevelopment agency, 163.357 Governing body as thecommunity redevelopment agency, 163.358 Exercise of powers in carrying out communityredevelopment <strong>and</strong> related activities, 163.360 Community redevelopment plans, 163.361Modification of community redevelopment plans, 163.362 Contents of communityredevelopment plan, 163.365 Neighborhood <strong>and</strong> community wide plans, 163.367 Public officials,commissioners, <strong>and</strong> employees subject to code of ethics, 163.370 Powers; counties <strong>and</strong>municipalities; community redevelopment agencies, 163.375 Eminent domain, 163.380 Disposalof property in community redevelopment area, 163.385 Issuance of revenue bonds, 163.387Redevelopment trust fund, 163.390 Bonds as legal investments, 163.395 Property exempt fromtaxes <strong>and</strong> from levy <strong>and</strong> sale by virtue of an execution, 163.400 Cooperation by public bodies,163.405 Title of purchaser, 163.410 Exercise of powers in counties with home rule charters,163.415 Exercise of powers in counties without home rule charters, 163.430 Powerssupplemental to existing community redevelopment powers, 163.445 Assistance to communityredevelopment by state agencies, 163.450 Municipal <strong>and</strong> county participation in neighborhooddevelopment programs under Pub. L. No. 90-448, 163.455 Community-Based DevelopmentOrganization Assistance Act; short title, 163.456 Legislative findings <strong>and</strong> intent, 163.457Eligibility for assistance, 163.458 Three-tiered plan, 163.459 Eligible activities, 163.460Application requirements, 163.461 Reporting <strong>and</strong> evaluation requirements, 163.462 Rulemakingauthority, 163.463 Applicability of ch. 2002-294.Section 218.62 Distribution formulas.—(1) Each participating county <strong>and</strong> municipal government shall receive a proportion of moneysearmarked for distribution within that county.(2) The proportion for each county government shall be computed by dividing the sum of theunincorporated area population plus two-thirds of the incorporated area population by the sumof the total county population plus two-thirds of the incorporated area population.4
(3) The proportion for each municipal government shall be computed by dividing the populationof that municipality by the sum of the total county population plus two-thirds of the incorporatedarea population.(4) Effective October 1, 2000, the apportionment factors shall, except in the case of error in thepopulation certified pursuant to s. 186.901, remain in effect for the fiscal year. Adjustments todistributions to correct errors shall be made subsequent to receipt of a corrected populationcertified pursuant to s. 186.901.Section 336.025 County transportation system; levy of local option fuel tax on motor fuel <strong>and</strong>diesel fuel--(1)(a) In addition to other taxes allowed by law, there may be levied as provided in ss.206.41(1)(e) <strong>and</strong> 206.87(1)(c) a 1-cent, 2-cent, 3-cent, 4-cent, 5-cent, or 6-cent local option fuel taxupon every gallon of motor fuel <strong>and</strong> diesel fuel sold in a county <strong>and</strong> taxed under the provisionsof part I or part II of chapter 206.1. All impositions <strong>and</strong> rate changes of the tax shall be levied before July 1 to be effective January1 of the following year for a period not to exceed 30 years, <strong>and</strong> the applicable method ofdistribution shall be established pursuant to subsection (3) or subsection (4). However, levies ofthe tax which were in effect on July 1, 2002, <strong>and</strong> which expire on August 31 of any year may bereimposed at the current authorized rate effective September 1 of the year of expiration. Uponexpiration, the tax may be relevied provided that a redetermination of the method of distributionis made as provided in this section.2. County <strong>and</strong> municipal governments shall utilize moneys received pursuant to this paragraphonly for transportation expenditures.3. Any tax levied pursuant to this paragraph may be extended on a majority vote of thegoverning body of the county. A redetermination of the method of distribution shall beestablished pursuant to subsection (3) or subsection (4), if, after July 1, 1986, the tax is extended orthe tax rate changed, for the period of extension or for the additional tax.Section 336.025 County transportation system; levy of local option fuel tax on motor fuel <strong>and</strong>diesel fuel(1)(b) In addition to other taxes allowed by law, there may be levied as provided in s. 206.41(1)(e)a 1-cent, 2-cent, 3-cent, 4-cent, or 5-cent local option fuel tax upon every gallon of motor fuel soldin a county <strong>and</strong> taxed under the provisions of part I of chapter 206. The tax shall be levied by anordinance adopted by a majority plus one vote of the membership of the governing body of thecounty or by referendum.1. All impositions <strong>and</strong> rate changes of the tax shall be levied before July 1, to be effective January1 of the following year. However, levies of the tax which were in effect on July 1, 2002, <strong>and</strong> whichexpire on August 31 of any year may be reimposed at the current authorized rate effectiveSeptember 1 of the year of expiration.2. The county may, prior to levy of the tax, establish by interlocal agreement with one or moremunicipalities located therein, representing a majority of the population of the incorporated areawithin the county, a distribution formula for dividing the entire proceeds of the tax among5
county government <strong>and</strong> all eligible municipalities within the county. If no interlocal agreement isadopted before the effective date of the tax, tax revenues shall be distributed pursuant to theprovisions of subsection (4). If no interlocal agreement exists, a new interlocal agreement may beestablished prior to June 1 of any year pursuant to this subparagraph. However, any interlocalagreement agreed to under this subparagraph after the initial levy of the tax or change in the taxrate authorized in this section shall under no circumstances materially or adversely affect therights of holders of outst<strong>and</strong>ing bonds which are backed by taxes authorized by this paragraph,<strong>and</strong> the amounts distributed to the county government <strong>and</strong> each municipality shall not bereduced below the amount necessary for the payment of principal <strong>and</strong> interest <strong>and</strong> reserves forprincipal <strong>and</strong> interest as required under the covenants of any bond resolution outst<strong>and</strong>ing on thedate of establishment of the new interlocal agreement.3. County <strong>and</strong> municipal governments shall use moneys received pursuant to this paragraph fortransportation expenditures needed to meet the requirements of the capital improvementselement of an adopted comprehensive plan or for expenditures needed to meet immediate localtransportation problems <strong>and</strong> for other transportation-related expenditures that are critical forbuilding comprehensive roadway networks by local governments. For purposes of thisparagraph, expenditures for the construction of new roads, the reconstruction or resurfacing ofexisting paved roads, or the paving of existing graded roads shall be deemed to increase capacity<strong>and</strong> such projects shall be included in the capital improvements element of an adoptedcomprehensive plan. Expenditures for purposes of this paragraph shall not include routinemaintenance of roads.Section 336.021 County transportation system; levy of ninth-cent fuel tax on motor fuel <strong>and</strong>diesel fuel--(1)(a) Any county in the state, by extraordinary vote of the membership of its governing body orsubject to a referendum, may levy the tax imposed by ss. 206.41(1)(d) <strong>and</strong> 206.87(1)(b). County<strong>and</strong> municipal governments may use the moneys received under this paragraph only fortransportation expenditures as defined in s. 336.025(7).(b) The governing body of the county may, by joint agreement with one or more of themunicipalities located therein, provide for the transportation purposes authorized underparagraph (a) <strong>and</strong> the distribution of the proceeds of this tax within both the unincorporated <strong>and</strong>incorporated areas of the county. The provisions for refund provided in ss. 206.625 <strong>and</strong> 206.64shall not be applicable to such tax levied by any county.(c) Local option taxes collected on sales or use of diesel fuel in this state shall be distributed inthe following manner:1. The fiscal year of July 1, 1995, through June 30, 1996, shall be the base year for all distributions.2. Each year the tax collected, less the service <strong>and</strong> administrative charges enumerated in s. 215.20<strong>and</strong> the allowances allowed under s. 206.91, on the number of gallons reported, up to the totalnumber of gallons reported in the base year, shall be distributed to each county using thedistribution percentage calculated for the base year.3. After the distribution of taxes pursuant to subparagraph 2., additional taxes available fordistribution shall first be distributed pursuant to this subparagraph. A distribution shall be madeto each county in which a qualified new retail station is located. A qualified new retail station is aretail station that began operation after June 30, 1996, <strong>and</strong> that has sales of diesel fuel exceeding6
50 percent of the sales of diesel fuel reported in the county in which it is located during the 1995-1996 state fiscal year. The determination of whether a new retail station is qualified shall be basedon the total gallons of diesel fuel sold at the station during each full month of operation duringthe 12-month period ending January 31, divided by the number of full months of operationduring those 12 months, <strong>and</strong> the result multiplied by 12. The amount distributed pursuant to thissubparagraph to each county in which a qualified new retail station is located shall equal thelocal option taxes due on the gallons of diesel fuel sold by the new retail station during the yearending January 31, less the service charges enumerated in s. 215.20 <strong>and</strong> the dealer allowanceprovided for by s. 206.91. Gallons of diesel fuel sold at the qualified new retail station shall becertified to the department by the county requesting the additional distribution by June 15, 1997,<strong>and</strong> by March 1 in each subsequent year. The certification shall include the beginning inventory,fuel purchases <strong>and</strong> sales, <strong>and</strong> the ending inventory for the new retail station for each month ofoperation during the year, the original purchase invoices for the period, <strong>and</strong> any otherinformation the department deems reasonable <strong>and</strong> necessary to establish the certified gallons.The department may review <strong>and</strong> audit the retail dealer's records provided to a county toestablish the gallons sold by the new retail station. Notwithst<strong>and</strong>ing the provisions of thissubparagraph, when more than one county qualifies for a distribution pursuant to thissubparagraph <strong>and</strong> the requested distributions exceed the total taxes available for distribution,each county shall receive a prorated share of the moneys available for distribution.4. After the distribution of taxes pursuant to subparagraph 3., all additional taxes available fordistribution shall be distributed based on vehicular diesel fuel storage capacities in each countypursuant to this subparagraph. The total vehicular diesel fuel storage capacity shall beestablished for each fiscal year based on the registration of facilities with the Department ofEnvironmental Protection as required by s. 376.303 for the following facility types: retail stations,fuel user/nonretail, state government, local government, <strong>and</strong> county government. Each countyshall receive a share of the total taxes available for distribution pursuant to this subparagraphequal to a fraction, the numerator of which is the storage capacity located within the county forvehicular diesel fuel in the facility types listed in this subparagraph <strong>and</strong> the denominator ofwhich is the total statewide storage capacity for vehicular diesel fuel in those facility types. Thevehicular diesel fuel storage capacity for each county <strong>and</strong> facility type shall be that established bythe Department of Environmental Protection by June 1, 1997, for the 1996-1997 fiscal year, <strong>and</strong> byJanuary 31 for each succeeding fiscal year. The storage capacities so established shall be final. Thestorage capacity for any new retail station for which a county receives a distribution pursuant tosubparagraph 3. shall not be included in the calculations pursuant to this subparagraph.(d) The tax received by the department on motor fuel pursuant to this paragraph shall bedistributed monthly by the department to the county reported by the terminal suppliers,wholesalers, <strong>and</strong> importers as the destination of the gallons distributed for retail sale or use. Thetax on diesel fuel shall be distributed monthly by the department to each county as provided inparagraph (c).(2)(a) The tax collected by the department pursuant to subsection (1) shall be transferred to theNinth-cent Fuel Tax Trust Fund, which fund is created for distribution to the counties pursuantto paragraph (1)(d). The department shall deduct the administrative costs incurred by it incollecting, administering, enforcing, <strong>and</strong> distributing back to the counties the tax, whichadministrative costs may not exceed 2 percent of collections authorized by this section. The totaladministrative cost shall be prorated among those counties levying the tax according to thefollowing formula, which shall be revised on July 1 of each year: Two-thirds of the amountdeducted shall be based on the county's proportional share of the number of dealers who areregistered for purposes of chapter 212 on June 30th of the preceding state fiscal year, <strong>and</strong> one-7
third of the amount deducted shall be based on the county's share of the total amount of the taxcollected during the preceding state fiscal year. The department has the authority to prescribe<strong>and</strong> publish all forms upon which reports shall be made to it <strong>and</strong> other forms <strong>and</strong> recordsdeemed to be necessary for proper administration <strong>and</strong> collection of the tax levied by any county<strong>and</strong> shall adopt rules necessary to enforce this section, which rules shall have the full force <strong>and</strong>effect of law. The provisions of ss. 206.026, 206.027, 206.028, 206.051, 206.052, 206.054, 206.055,206.06, 206.07, 206.075, 206.08, 206.09, 206.095, 206.10, 206.11, 206.12, 206.13, 206.14, 206.15, 206.16,206.17, 206.175, 206.18, 206.199, 206.20, 206.204, 206.205, 206.21, 206.215, 206.22, 206.24, 206.27,206.28, 206.41, 206.416, 206.44, 206.45, 206.48, 206.49, 206.56, 206.59, 206.626, 206.87, 206.872,206.873, 206.8735, 206.874, 206.8741, 206.8745, 206.94, <strong>and</strong> 206.945 shall, as far as practicable, beapplicable to the levy <strong>and</strong> collection of the tax imposed pursuant to this section as if fully set outin this section.(b) The provisions of s. 206.43(7) shall apply to the incorrect reporting of the tax levied under thissection.(3) It is expressly recognized <strong>and</strong> declared by the Legislature that the establishment, operation,<strong>and</strong> maintenance of a transportation system <strong>and</strong> related facilities <strong>and</strong> the acquisition,construction, reconstruction, <strong>and</strong> maintenance of roads <strong>and</strong> streets fulfill a public purpose <strong>and</strong>that payment of the costs <strong>and</strong> expenses therefor may be made from county general funds, specialtaxing district funds, or such other funds as may be authorized by special or general law.Counties are authorized to expend the funds received under this section in conjunction with thestate or federal government in joint projects.(4)(a) A certified copy of the ordinance proposing to levy the tax pursuant to referendum shall befurnished by the county to the department within 10 days after approval of such ordinance.Furthermore, the county levying the tax pursuant to referendum shall notify the departmentwithin 10 days after the passage of the referendum of such passage <strong>and</strong> of the time period duringwhich the tax will be levied. The failure to furnish the certified copy will not invalidate thepassage of the ordinance.(b) A county levying the tax pursuant to ordinance shall notify the department within 10 daysafter the governing body of the county adopts the ordinance <strong>and</strong>, at the same time, furnish thedepartment with a certified copy of the ordinance.(5) All impositions of the tax shall be levied before July 1 of each year to be effective January 1 ofthe following year. However, levies of the tax which were in effect on July 1, 2002, <strong>and</strong> whichexpire on August 31 of any year may be reimposed at the current authorized rate to be effectiveSeptember 1 of the year of expiration. All impositions shall be required to end on December 31 ofa year. A decision to rescind the tax shall not take effect on any date other than December 31 <strong>and</strong>shall require a minimum of 60 days' notice to the department of such decision.(6) Notwithst<strong>and</strong>ing any other provision of this section, the tax authorized pursuant to thissection shall be levied in every county at the rate of 1 cent per gallon of diesel fuel beginningJanuary 1, 1994.Section 166.231 Municipalities; public service tax -- (1)(a) A municipality may levy a tax on thepurchase of electricity, metered natural gas, liquefied petroleum gas either metered or bottled,manufactured gas either metered or bottled, <strong>and</strong> water service. Except for those municipalities inwhich paragraph (c) applies, the tax shall be levied only upon purchases within the municipality<strong>and</strong> shall not exceed 10 percent of the payments received by the seller of the taxable item from8
the purchaser for the purchase of such service. Municipalities imposing a tax on the purchase ofcable television service as of May 4, 1977, may continue to levy such tax to the extent necessary tomeet all obligations to or for the benefit of holders of bonds or certificates which were issuedprior to May 4, 1977. Purchase of electricity means the purchase of electric power by a personwho will consume it within the municipality.Section 166.231 Municipalities; public service tax - (1)(b) The tax imposed by paragraph (a)shall not be applied against any fuel adjustment charge, <strong>and</strong> such charge shall be separatelystated on each bill. The term "fuel adjustment charge" means all increases in the cost of utilityservices to the ultimate consumer resulting from an increase in the cost of fuel to the utilitysubsequent to October 1, 1973.Section 166.231 Municipalities; public service tax - (9) A purchaser who claims an exemptionunder subsection (4) or subsection (5) shall certify to the seller that he or she qualifies for theexemption, which certification may encompass all purchases after a specified date or othermultiple purchases. A seller accepting the certification required by this subsection is relieved ofthe obligation to collect <strong>and</strong> remit tax; however, a governmental body that is exempt from the taxauthorized by this section shall not be required to furnish such certification, <strong>and</strong> a seller is notrequired to collect tax from such an exempt governmental body.Section 210.20 Employees <strong>and</strong> assistants; distribution of funds.-- 2) As collections are receivedby the division from such cigarette taxes, it shall pay the same into a trust fund in the StateTreasury designated "Cigarette Tax Collection Trust Fund" which shall be paid <strong>and</strong> distributed asfollows:(a) The division shall from month to month certify to the Chief Financial Officer the amountderived from the cigarette tax imposed by s. 210.02, less the service charges provided for in s.215.20 <strong>and</strong> less 0.9 percent of the amount derived from the cigarette tax imposed by s. 210.02,which shall be deposited into the Alcoholic Beverage <strong>and</strong> Tobacco Trust Fund, specifying theamounts to be transferred from the Cigarette Tax Collection Trust Fund <strong>and</strong> credited on the basisof 2.9 percent of the net collections to the Revenue Sharing Trust Fund for Counties <strong>and</strong> 29.3percent of the net collections for the funding of indigent health care to the Public MedicalAssistance Trust Fund.Section 206.05 Bond required of licensed terminal supplier, importer, exporter, or wholesaler -(1) Each terminal supplier, importer, exporter, or wholesaler, except a municipality, county,school board, state agency, federal agency, or special district which is licensed under this part,shall file with the department a bond in a penal sum of not more than $100,000, such sum to beapproximately 3 times the combined average monthly tax levied under this part <strong>and</strong> local optiontax on motor fuel paid or due during the preceding 12 calendar months under the laws of thisstate. An exporter shall file a bond in an amount equal to 3 times the average monthly tax due ongallons acquired for export. The bond shall be in such form as may be approved by thedepartment, executed by a surety company duly licensed to do business under the laws of thestate as surety thereon, <strong>and</strong> conditioned upon the prompt filing of true reports <strong>and</strong> the paymentto the department of any <strong>and</strong> all fuel taxes levied under this chapter including local option taxeswhich are now or which hereafter may be levied or imposed, together with any <strong>and</strong> all penalties<strong>and</strong> interest thereon, <strong>and</strong> generally upon faithful compliance with the provisions of the fuel tax<strong>and</strong> local option tax laws of the state. The licensee shall be the principal obligor, <strong>and</strong> the stateshall be the obligee. An assigned time deposit or irrevocable letter of credit may be accepted inlieu of a surety bond.9
(2) In the event that liability upon the bond thus filed with the department is discharged orreduced, whether by judgment rendered, payment made, or otherwise, or if in the opinion of thedepartment any surety on the bond theretofore given has become unsatisfactory or unacceptable,then the department may require a new bond with satisfactory sureties in the same amount,failing which the department shall forthwith cancel the license. If such new bond is furnished asabove provided, the department shall cancel <strong>and</strong> surrender the bond of the person for whichsuch new bond is substituted.(3) In the event that the department decides that the amount of the existing bond is insufficient toensure payment to the state of the amount of the tax <strong>and</strong> any penalties <strong>and</strong> interest for which theperson is or may at any time become liable, then that person shall forthwith, upon the writtendem<strong>and</strong> of the department, file additional bond in the same manner <strong>and</strong> form with like securitythereon as hereinbefore provided, <strong>and</strong> the department shall forthwith cancel the license ofanyone failing to file an additional bond as herein provided.(4) Any surety on any bond furnished by a person, as above provided, shall be released <strong>and</strong>discharged from any <strong>and</strong> all liability to the state accruing on such bond after the expiration of 60days from the date upon which such surety has filed with the department written request to bereleased <strong>and</strong> discharged. However, such request shall not operate to relieve, release, or dischargesuch surety from any liability already accrued, or which shall accrue, before the expiration of the60-day period. The department shall, promptly on receipt of notice of such request, notify thelicensee who furnished the bond, <strong>and</strong>, unless the licensee on or before the expiration of the 60-day period files with the department a new bond with a surety company satisfactory to thedepartment in the amount <strong>and</strong> form hereinbefore in this section provided, the department shallforthwith cancel the license. If the new bond is furnished as above provided, the department shallcancel <strong>and</strong> surrender the bond of the licensee for which the new bond is provided.Section 206.879 State <strong>and</strong> local alternative fuel user fee clearing trust funds; distribution.--(1) Notwithst<strong>and</strong>ing the provisions of s. 206.875, the revenues from the state alternative fuel feesimposed by s. 206.877 shall be deposited into the State Alternative Fuel User Fee Clearing TrustFund, which is hereby created. After deducting the service charges provided in s. 215.20, theproceeds in this trust fund shall be distributed as follows: one-fifth of the proceeds in calendaryear 1991, one-third of the proceeds in calendar year 1992, three-sevenths of the proceeds incalendar year 1993, <strong>and</strong> one-half of the proceeds in each calendar year thereafter shall betransferred to the State Transportation Trust Fund; the remainder shall be distributed as follows:50 percent shall be transferred to the State Board of Administration for distribution according tothe provisions of s. 16, Art. IX of the State Constitution of 1885, as amended; 25 percent shall betransferred to the Revenue Sharing Trust Fund for Municipalities; <strong>and</strong> the remaining 25 percentshall be distributed using the formula contained in s. 206.60(1).Section 218.25 Limitation of shared funds; holders of bonds protected; limitation on use ofsecond guaranteed entitlement for counties -- (1) Except as provided in subsection (2) withrespect to the second guaranteed entitlement for counties, local governments shall not use anyportion of the moneys received in excess of the guaranteed entitlement from the revenue sharingtrust funds created by this part to assign, pledge, or set aside as a trust for the payment ofprincipal or interest on bonds, tax anticipation certificates, or any other form of indebtedness, <strong>and</strong>there shall be no other use restriction on revenues shared pursuant to this part. The state doeshereby covenant with holders of bonds or other instruments of indebtedness issued by localgovernments prior to July 1, 1972, that it is not the intent of this part to affect adversely the rightsof said holders or to relieve local governments of the duty to meet their obligations as a result ofprevious pledges or assignments or trusts entered into which obligated funds received from10
evenue sources which by terms of this part shall henceforth be distributed out of the revenuesharing trust funds.(2) The second guaranteed entitlement for counties may be assigned, pledged, or set aside as atrust for the payment of principal or interest on bonds, tax anticipation certificates, or any otherform of indebtedness, including obligations issued to acquire an insurance contract or contractsfrom a local government liability pool <strong>and</strong> including payments required pursuant to any loanagreement entered into to provide funds to acquire an insurance contract or contracts from a localgovernment liability pool.(3) As an additional assurance to holders of bonds issued before April 18, 2000, which aresecured by the guaranteed entitlement or second guaranteed entitlement for counties, or bondsissued to refund such bonds which mature no later than the bonds that they refunded <strong>and</strong> whichresult in a reduction of debt service payable in each fiscal year, it is the intent of the Legislaturethat, to the extent the elimination of tax sources dedicated to funding the guaranteed entitlementor the second guaranteed entitlement for counties or a reduction in the rate of assessment of suchtaxes results in an inability of a county to pay debt service on such bonds, the Legislature willprovide alternative funding sources in an amount sufficient to pay any deficit in the amountrequired for such debt service. This commitment of the Legislature is contingent on the countyfirst using any funds available under this part for the payment of such debt service.(4) Notwithst<strong>and</strong>ing subsections (1) <strong>and</strong> (2), a local government may assign, pledge, or set asideas a trust for the payment of principal or interest on bonds, tax anticipation certificates, or anyother form of indebtedness an amount up to 50 percent of the funds received in the prior year.Section 206.605 Municipal tax on motor fuel -- (1) The proceeds of the municipal fuel taximposed pursuant to s. 206.41(1)(c), after deducting the service charge pursuant to chapter 215<strong>and</strong> the administrative costs incurred by the department in collecting, administering, enforcing,<strong>and</strong> distributing the tax, which administrative costs may not exceed 2 percent of collections, shallbe transferred into the Revenue Sharing Trust Fund for Municipalities.(2) Funds available under this section shall be used only for purchase of transportation facilities<strong>and</strong> road <strong>and</strong> street rights-of-way; construction, reconstruction, <strong>and</strong> maintenance of roads,streets, bicycle paths, <strong>and</strong> pedestrian pathways; adjustment of city-owned utilities as required byroad <strong>and</strong> street construction; <strong>and</strong> construction, reconstruction, transportation-related publicsafety activities, maintenance, <strong>and</strong> operation of transportation facilities. Municipalities areauthorized to expend the funds received under this section in conjunction with other cities orcounties or state or federal government in joint projects.(3)(a) If any municipality subject to this section does not have the transportation facilitiescapability, the municipality may designate by resolution the projects to be undertaken, <strong>and</strong> theengineering may be thereafter performed <strong>and</strong> administered <strong>and</strong> the construction administered bythe Department of Transportation or, in the case of a municipality, by the appropriate county, ifsuch county has the capability <strong>and</strong> agrees to undertake the projects.(b) In the event the municipality desires the Department of Transportation either to perform oradminister the engineering services or to administer the construction, or both, it must so indicateat the time of the presentation of the annual budget or it must so designate at the time the countypresents its annual budget.11
Section 125.0104 Tourist development tax; procedure for levying; authorized uses;referendum; enforcement -- (5) AUTHORIZED USES OF REVENUE -- (a) All tax revenuesreceived pursuant to this section by a county imposing the tourist development tax shall be usedby that county for the following purposes only:1. To acquire, construct, extend, enlarge, remodel, repair, improve, maintain, operate, or promoteone or more publicly owned <strong>and</strong> operated convention centers, sports stadiums, sports arenas,coliseums, or auditoriums, or museums that are publicly owned <strong>and</strong> operated or owned <strong>and</strong>operated by not-for-profit organizations <strong>and</strong> open to the public, within the boundaries of thecounty or subcounty special taxing district in which the tax is levied. Tax revenues receivedpursuant to this section may also be used for promotion of zoological parks that are publiclyowned <strong>and</strong> operated or owned <strong>and</strong> operated by not-for-profit organizations <strong>and</strong> open to thepublic. However, these purposes may be implemented through service contracts <strong>and</strong> leases withlessees with sufficient expertise or financial capability to operate such facilities;2. To promote <strong>and</strong> advertise tourism in the State of <strong>Florida</strong> <strong>and</strong> nationally <strong>and</strong> internationally;however, if tax revenues are expended for an activity, service, venue, or event, the activity,service, venue, or event shall have as one of its main purposes the attraction of tourists asevidenced by the promotion of the activity, service, venue, or event to tourists;3. To fund convention bureaus, tourist bureaus, tourist information centers, <strong>and</strong> news bureaus ascounty agencies or by contract with the chambers of commerce or similar associations in thecounty, which may include any indirect administrative costs for services performed by thecounty on behalf of the promotion agency; or4. To finance beach park facilities or beach improvement, maintenance, renourishment,restoration, <strong>and</strong> erosion control, including shoreline protection, enhancement, cleanup, orrestoration of inl<strong>and</strong> lakes <strong>and</strong> rivers to which there is public access as those uses relate to thephysical preservation of the beach, shoreline, or inl<strong>and</strong> lake or river. However, any fundsidentified by a county as the local matching source for beach renourishment, restoration, orerosion control projects included in the long-range budget plan of the state's Beach ManagementPlan, pursuant to s. 161.091, or funds contractually obligated by a county in the financial plan fora federally authorized shore protection project may not be used or loaned for any other purpose.In counties of less than 100,000 population, no more than 10 percent of the revenues from thetourist development tax may be used for beach park facilities.(b) Tax revenues received pursuant to this section by a county of less than 750,000 populationimposing a tourist development tax may only be used by that county for the following purposesin addition to those purposes allowed pursuant to paragraph (a): to acquire, construct, extend,enlarge, remodel, repair, improve, maintain, operate, or promote one or more zoological parks,fishing piers or nature centers which are publicly owned <strong>and</strong> operated or owned <strong>and</strong> operated bynot-for-profit organizations <strong>and</strong> open to the public. All population figures relating to thissubsection shall be based on the most recent population estimates prepared pursuant to theprovisions of s. 186.901. These population estimates shall be those in effect on July 1 of each year.(c) The revenues to be derived from the tourist development tax may be pledged to secure <strong>and</strong>liquidate revenue bonds issued by the county for the purposes set forth in subparagraphs (a)1.<strong>and</strong> 4. or for the purpose of refunding bonds previously issued for such purposes, or both;however, no more than 50 percent of the revenues from the tourist development tax may bepledged to secure <strong>and</strong> liquidate revenue bonds or revenue refunding bonds issued for thepurposes set forth in subparagraph (a)4. Such revenue bonds <strong>and</strong> revenue refunding bonds may12
e authorized <strong>and</strong> issued in such principal amounts, with such interest rates <strong>and</strong> maturity dates,<strong>and</strong> subject to such other terms, conditions, <strong>and</strong> covenants as the governing board of the countyshall provide. The Legislature intends that this paragraph shall be full <strong>and</strong> complete authority foraccomplishing such purposes, but such authority shall be supplemental <strong>and</strong> additional to, <strong>and</strong>not in derogation of, any powers now existing or later conferred under law.(d) Any use of the local option tourist development tax revenues collected pursuant to thissection for a purpose not expressly authorized by paragraph (3)(l) or paragraph (3)(n) orparagraph (a), paragraph (b), or paragraph (c) of this subsection is expressly prohibited.Section 212.0305 Convention development taxes; intent; administration; authorization; use ofproceeds -- (1) TITLE.--This section may be cited as the "Convention Development Tax Act."(2) LEGISLATIVE INTENT.--No convention development tax on transient rentals shall beimposed by the governing body of any county unless specifically authorized herein. Any taxauthorized pursuant to this section shall be administered <strong>and</strong> collected exclusively as providedherein <strong>and</strong> may consist of one or more component levies as enumerated in subsection (4). It is thelegislative intent that any authorization for imposition of a convention development tax shall bepublished in the <strong>Florida</strong> Statutes as a paragraph of subsection (4), irrespective of the duration ofthe levy. Each enactment shall specify the types of local governments authorized to levy aconvention development tax; the rate or rates which may be imposed; the maximum length oftime the tax may be imposed, if any; the procedure which must be followed to secure voterapproval, if required; the purpose for which the proceeds may be expended; <strong>and</strong> such otherrequirements as the Legislature may provide. One of the principal purposes of the conventiondevelopment tax is to promote tourism <strong>and</strong> the use of hotel facilities by facilitating theimprovement <strong>and</strong> construction of convention centers. Any municipality or county wherein theconvention development tax is levied is specifically authorized to adopt <strong>and</strong> implement aconvention center booking policy to apply to convention centers owned or operated by amunicipality or county which gives priority to bookings after July 1, 1993, in accordance with theminimum number of hotel rooms to be utilized in connection with such convention centerbookings or in accordance with the impact of such bookings on the convention development taxgenerated.(3) APPLICATION; ADMINISTRATION; PENALTIES.--(a) The convention development tax on transient rentals imposed by the governing body of anycounty authorized to so levy shall apply to the amount of any payment made by any person torent, lease, or use for a period of 6 months or less any living quarters or accommodations in ahotel, apartment hotel, motel, resort motel, apartment, apartment motel, roominghouse, tourist ortrailer camp, mobile home park, recreational vehicle park, or condominium. When receipt ofconsideration is by way of property other than money, the tax shall be levied <strong>and</strong> imposed on thefair market value of such nonmonetary consideration. Any payment made by a person to rent,lease, or use any living quarters or accommodations which are exempt from the tax imposedunder s. 212.03 shall likewise be exempt from any tax imposed under this section.(b) The tax shall be charged by the person receiving the consideration for the lease or rental, <strong>and</strong>the tax shall be collected from the lessee, tenant, or customer at the time of payment of theconsideration for such lease or rental.(c) The person receiving the consideration for such rental or lease shall receive, account for, <strong>and</strong>remit the tax to the department at the time <strong>and</strong> in the manner provided for persons who collect13
<strong>and</strong> remit taxes under s. 212.03. The same duties <strong>and</strong> privileges imposed by this chapter upondealers in tangible property respecting the collection <strong>and</strong> remission of tax; the making of returns;the keeping of books, records, <strong>and</strong> accounts; <strong>and</strong> compliance with the rules of the department inthe administration of this chapter apply to <strong>and</strong> are binding upon all persons who are subject tothe provisions of this section. However, the department may authorize a quarterly return <strong>and</strong>payment when the tax remitted by the dealer for the preceding quarter did not exceed $25.(d) The department shall keep records showing the amount of taxes collected, which recordsshall disclose the taxes collected from each county in which a local government resort tax islevied. These records shall be subject to the provisions of s. 213.053 <strong>and</strong> are confidential <strong>and</strong>exempt from the provisions of s. 119.07(1).(e) The collections received by the department from the tax, less costs of administration, shall bepaid <strong>and</strong> returned monthly to the county which imposed the tax, for use by the county asprovided in this section. Such receipts shall be placed in a specific trust fund or funds created bythe county.(f) The department shall promulgate such rules <strong>and</strong> shall prescribe <strong>and</strong> publish such forms asmay be necessary to effectuate the purposes of this section. The department is authorized toestablish audit procedures <strong>and</strong> to assess for delinquent taxes.(g) The estimated tax provisions contained in s. 212.11 do not apply to the administration of anytax levied under this section.(h) Any person taxable under this section who, either by himself or herself or through theperson's agents or employees, fails or refuses to charge <strong>and</strong> collect the taxes herein provided fromthe person paying any rental or lease is, in addition to being personally liable for the payment ofthe tax, guilty of a misdemeanor of the first degree, punishable as provided in s. 775.082 or s.775.083.(i) No person shall advertise or hold out to the public in any manner, directly or indirectly, thathe or she will absorb all or any part of the tax; that he or she will relieve the person paying therental of the payment of all or any part of the tax; or that the tax will not be added to the rental orlease consideration or, if added, that the tax or any part thereof will be refunded or refused,either directly or indirectly, by any method whatsoever. Any person who willfully violates anyprovision of this paragraph is guilty of a misdemeanor of the first degree, punishable as providedin s. 775.082 or s. 775.083.(j) The tax shall constitute a lien on the property of the lessee, customer, or tenant in the samemanner as, <strong>and</strong> shall be collectible as are, liens authorized <strong>and</strong> imposed by ss. 713.67, 713.68, <strong>and</strong>713.69.(k) Any tax levied pursuant to this section shall be in addition to any other tax imposed pursuantto this chapter <strong>and</strong> in addition to all other taxes <strong>and</strong> fees <strong>and</strong> the consideration for the rental orlease.(l) The department shall administer the taxes levied herein as increases in the rate of the taxauthorized in s. 125.0104. The department shall collect <strong>and</strong> enforce the provisions of this section<strong>and</strong> s. 125.0104 in conjunction with each other in those counties authorized to levy the taxesauthorized herein. The department shall distribute the proceeds received from the taxes leviedpursuant to this section <strong>and</strong> s. 125.0104 in proportion to the rates of the taxes authorized to the14
appropriate trust funds as provided by law. In the event of underpayment of the total amountdue by a taxpayer pursuant to this section <strong>and</strong> s. 125.0104, the department shall distribute theamount received in proportion to the rates of the taxes authorized to the appropriate trust fundsas provided by law <strong>and</strong> the penalties <strong>and</strong> interest due on both of said taxes shall be applicable.(4) AUTHORIZATION TO LEVY; USE OF PROCEEDS; OTHER REQUIREMENTS.--(a) Consolidated government levy for convention development.--1. Each county that operates under a government consolidated with that of one or moremunicipalities in the county may impose, pursuant to an ordinance enacted by the governingbody of the county, a levy on the exercise within its boundaries of the taxable privilege of leasingor letting transient rental accommodations described in subsection (3) at the rate of 2 percent ofeach dollar <strong>and</strong> major fraction of each dollar of the total consideration charged therefor. Theproceeds of this levy shall be known as the consolidated county convention development tax.2. The county shall furnish to the department, within 10 days after approval of the ordinanceimposing the levy, a copy of the ordinance. The effective date of imposition of the levy must bethe first day of any month that is at least 60 days after enactment of the ordinance.3. All consolidated county convention development moneys, including any interest accruedthereon, received by a county imposing the levy must be used in any of the following manners,although the utilization authorized in sub-subparagraph a. shall apply only to municipalitieswith a population of 10,000 or more:a. To promote <strong>and</strong> advertise tourism;b. To extend, enlarge, <strong>and</strong> improve existing publicly owned convention centers in the county;c. To construct a multipurpose convention/coliseum/exhibition center or the maximumcomponents thereof as funds permit in the county; <strong>and</strong>d. To acquire, construct, extend, enlarge, remodel, repair, improve, or maintain one or moreconvention centers, stadiums, exhibition halls, arenas, coliseums, or auditoriums.4. For the purposes of completion of any project under this paragraph, tax revenues <strong>and</strong> interestaccrued may be used:a. As collateral, pledged, or hypothecated for projects authorized by this paragraph, includingbonds issued in connection therewith; orb. As a pledge or capital contribution in conjunction with a partnership, joint venture, or otherbusiness arrangement between the county <strong>and</strong> one or more business entities for projectsauthorized by this paragraph.5.a. The county may designate or appoint an authority to administer <strong>and</strong> disburse such proceeds<strong>and</strong> any other related source of revenue. However, the annual budget of the authority is subjectto approval of the governing body of the county.15
. Except as otherwise provided by law, one-half of the proceeds of the tax which are collectedwithin a municipality the government of which is not consolidated with that of the county must,at the request of the governing body of the municipality, be remitted to the municipality. Therevenue remitted to a municipality under this sub-subparagraph may be used by themunicipality only for the purposes <strong>and</strong> in the manner authorized in this paragraph, but themunicipality may enter into an interlocal agreement with the county or with any othermunicipality in the county to use such revenue to jointly finance any project authorized by thisparagraph. This sub-subparagraph does not apply to the distribution to the county of anyconvention development tax revenues necessary to repay the principal of or the interest on anybonds issued under sub-subparagraph 4.a. before May 29, 1984. Notwithst<strong>and</strong>ing this subsubparagraph,if the governing body of such a municipality adopts a resolution stating that themunicipality is unable to use such revenue for any purpose authorized in this paragraph, themunicipality may use the revenue to acquire <strong>and</strong> develop municipal parks, lifeguard stations, orathletic fields.6. The consolidated county convention development tax shall be in addition to any other levyimposed under this section.7. Revenues collected <strong>and</strong> returned to the county must be deposited in a conventiondevelopment trust fund, which must be established by the county as a condition precedent toreceipt of such funds.(b) Charter county levy for convention development.--1. Each county, as defined in s. 125.011(1), may impose, pursuant to an ordinance enacted by thegoverning body of the county, a levy on the exercise within its boundaries of the taxable privilegeof leasing or letting transient rental accommodations described in subsection (3) at the rate of 3percent of the total consideration charged therefor. The proceeds of this levy shall be known asthe charter county convention development tax.2. All charter county convention development moneys, including any interest accrued thereon,received by a county imposing the levy shall be used as follows:a. Two-thirds of the proceeds shall be used to extend, enlarge, <strong>and</strong> improve the largest existingpublicly owned convention center in the county.b. One-third of the proceeds shall be used to construct a new multipurposeconvention/coliseum/exhibition center/stadium or the maximum components thereof as fundspermit in the most populous municipality in the county.c. After the completion of any project under sub-subparagraph a., the tax revenues <strong>and</strong> interestaccrued under sub-subparagraph a. may be used to acquire, construct, extend, enlarge, remodel,repair, improve, plan for, operate, manage, or maintain one or more convention centers,stadiums, exhibition halls, arenas, coliseums, or auditoriums, <strong>and</strong> may be used to acquire <strong>and</strong>construct an intercity light rail transportation system as described in the Light Rail TransitSystem Status Report to the Legislature dated April 1988, which shall provide a means totransport persons to <strong>and</strong> from the largest existing publicly owned convention center in thecounty <strong>and</strong> the hotels north of the convention center <strong>and</strong> to <strong>and</strong> from the downtown area of themost populous municipality in the county as determined by the county.16
d. After completion of any project under sub-subparagraph b., the tax revenues <strong>and</strong> interestaccrued under sub-subparagraph b. may be used, as determined by the county, to operate anauthority created pursuant to subparagraph 4. or to acquire, construct, extend, enlarge, remodel,repair, improve, operate, or maintain one or more convention centers, stadiums, exhibition halls,arenas, coliseums, auditoriums, golf courses, or related buildings <strong>and</strong> parking facilities in themost populous municipality in the county.e. For the purposes of completion of any project pursuant to this paragraph, tax revenues <strong>and</strong>interest accrued may be used:(I) As collateral, pledged, or hypothecated for projects authorized by this paragraph, includingbonds issued in connection therewith; or(II) As a pledge or capital contribution in conjunction with a partnership, joint venture, or otherbusiness arrangement between a municipality <strong>and</strong> one or more business entities for projectsauthorized by this paragraph.3. The governing body of each municipality in which a municipal tourist tax is levied may adopta resolution prohibiting imposition of the charter county convention development levy withinsuch municipality. If the governing body adopts such a resolution, the convention developmentlevy shall be imposed by the county in all other areas of the county except such municipality. Nofunds collected pursuant to this paragraph may be expended in a municipality which hasadopted such a resolution.4.a. Before the county enacts an ordinance imposing the levy, the county shall notify thegoverning body of each municipality in which projects are to be developed pursuant to subsubparagraph2.a., sub-subparagraph 2.b., sub-subparagraph 2.c., or sub-subparagraph 2.d. As acondition precedent to receiving funding, the governing bodies of such municipalities shalldesignate or appoint an authority that shall have the sole power to:(I) Approve the concept, location, program, <strong>and</strong> design of the facilities or improvements to bebuilt in accordance with this paragraph <strong>and</strong> to administer <strong>and</strong> disburse such proceeds <strong>and</strong> anyother related source of revenue.(II) Appoint <strong>and</strong> dismiss the authority's executive director, general counsel, <strong>and</strong> any otherconsultants retained by the authority. The governing body shall have the right to approve ordisapprove the initial appointment of the authority's executive director <strong>and</strong> general counsel.b. The members of each such authority shall serve for a term of not less than 1 year <strong>and</strong> shall beappointed by the governing body of such municipality. The annual budget of such authority shallbe subject to approval of the governing body of the municipality. If the governing body does notapprove the budget, the authority shall use as the authority's budget the previous fiscal yearbudget.c. The authority, by resolution to be adopted from time to time, may invest <strong>and</strong> reinvest theproceeds from the convention development tax <strong>and</strong> any other revenues generated by theauthority in the same manner that the municipality in which the authority is located may investsurplus funds.17
5. The charter county convention development levy shall be in addition to any other levyimposed pursuant to this section.6. A certified copy of the ordinance imposing the levy shall be furnished by the county to thedepartment within 10 days after approval of such ordinance. The effective date of imposition ofthe levy shall be the first day of any month at least 60 days after enactment of the ordinance.7. Revenues collected pursuant to this paragraph shall be deposited in a conventiondevelopment trust fund, which shall be established by the county as a condition precedent toreceipt of such funds.(c) Special district levy for convention development.--1. Each county which was chartered under Art. VIII of the State Constitution <strong>and</strong> which onJanuary 1, 1984, levied a tourist advertising ad valorem tax within a special taxing district in thatcounty may impose, pursuant to an ordinance enacted by the governing body of the county, alevy within the boundaries of such special taxing district on the exercise of the taxable privilegeof leasing or letting transient rental accommodations described in subsection (3) at a rate of up to3 percent of each dollar <strong>and</strong> major fraction of each dollar of the total consideration chargedtherefor. The proceeds of this levy shall be known as the special district convention developmenttax.2. The county shall designate or appoint an authority to administer <strong>and</strong> disburse the proceeds ofsuch levy <strong>and</strong> any revenue related to the levy authorized by this paragraph. The members ofsuch authority shall be selected from persons involved in the tourism <strong>and</strong> lodging industriesdoing business within such special district. Not less than a majority of the members shall beselected from persons doing business in the lodging industry. Members shall serve at thepleasure of the governing body of such county <strong>and</strong> shall serve without compensation. The annualbudget of such authority shall be subject to approval of the governing body of the county. Theauthority shall consist of 11 members, who shall annually select a chair from among theirmembers.3. The county shall have no power to levy <strong>and</strong> impose the tourist advertising ad valorem tax insuch district on or after January 1 of the year following the date of the adoption of the levyauthorized in this paragraph. All special district convention development moneys, including anyinterest accrued thereon, received by a county imposing the special district conventiondevelopment levy shall be used for the following purposes only:a. To promote <strong>and</strong> advertise tourism;b. To fund convention bureaus, tourist bureaus, tourist information centers, <strong>and</strong> news bureaus.4. The special district convention development tax shall be in addition to any other levy imposedpursuant to this section.5. A certified copy of the ordinance imposing the levy shall be furnished by the county to thedepartment within 10 days after approval of such ordinance. The effective date of the levy shallbe the first day of any month at least 60 days after enactment of the ordinance.18
6. Revenues collected <strong>and</strong> returned to the county shall be deposited in a conventiondevelopment trust fund, which shall be established by the county as a condition precedent toreceipt of such funds.(d) Special levy for convention development.--1. Each county which was chartered under Art. VIII of the State Constitution <strong>and</strong> which onJanuary 1, 1984, levied a tourist advertising ad valorem tax within a special taxing district in thatcounty may impose, pursuant to an ordinance enacted by the governing body of the county, alevy outside the boundaries of such special taxing district <strong>and</strong> to the southeast of State Road 415,on the exercise of the taxable privilege of leasing or letting transient rental accommodationsdescribed in subsection (3), at a rate of up to 3 percent of each dollar <strong>and</strong> major fraction of eachdollar of the total consideration charged therefor. The proceeds of this levy shall be known as thespecial convention development tax.2. The county shall designate or appoint an authority to administer <strong>and</strong> disburse the proceeds ofsuch levy <strong>and</strong> any revenue related to the levy authorized by this paragraph. The members of theauthority shall be selected from persons doing business within the area in which the tax is levied.Not less than three of the members shall be selected from persons doing business in the lodgingindustry. Members shall serve at the pleasure of the governing body of the county <strong>and</strong> shall servewithout compensation. The annual budget of the authority shall be subject to approval of thegoverning body of the county. The authority shall consist of seven members, who shall annuallyselect a chair from among their members.3. All special convention development moneys, including any interest accrued thereon, receivedby a county imposing the special convention development levy shall be used for the followingpurposes only:a. To promote <strong>and</strong> advertise tourism;b. To fund convention bureaus, tourist bureaus, tourist information centers, <strong>and</strong> news bureaus.4. The special convention development tax shall be in addition to any other levy imposedpursuant to this section.5. A certified copy of the ordinance imposing the levy shall be furnished by the county to thedepartment within 10 days after approval of the ordinance. The effective date of the levy shall bethe first day of any month at least 60 days after enactment of the ordinance.6. Revenues collected <strong>and</strong> returned to the county shall be deposited in a separate conventiondevelopment trust fund, which shall be established by the county as a condition precedent toreceipt of such funds.(e) Subcounty levy for convention development.--1. Each county which was chartered under Art. VIII of the State Constitution <strong>and</strong> which onJanuary 1, 1984, levied a tourist advertising ad valorem tax within a special taxing district in thatcounty may impose, pursuant to an ordinance enacted by the governing body of the county, alevy outside the boundaries of such special taxing district <strong>and</strong> to the northwest of State Road 415,on the exercise of the taxable privilege of leasing or letting transient rental accommodations19
described in subsection (3), at a rate of up to 3 percent of each dollar <strong>and</strong> major fraction of eachdollar of the total consideration charged therefor. The proceeds of this levy shall be known as thesubcounty convention development tax.2. The county shall designate or appoint an authority to administer <strong>and</strong> disburse the proceeds ofsuch levy <strong>and</strong> any revenue related to the levy authorized by this paragraph. The members of theauthority shall be selected from persons doing business within the area in which the tax is levied.Not less than three of the members shall be selected from persons doing business in the lodgingindustry. Members shall serve at the pleasure of the governing body of the county <strong>and</strong> shall servewithout compensation. The annual budget of the authority shall be subject to approval of thegoverning body of the county. The authority shall consist of seven members, who shall annuallyselect a chair from among their members.3. All subcounty convention development moneys, including any interest accrued thereon,received by a county imposing the subcounty convention development levy shall be used for thefollowing purposes only:a. To promote <strong>and</strong> advertise tourism;b. To fund convention bureaus, tourist bureaus, tourist information centers, <strong>and</strong> news bureaus.4. The subcounty convention development tax shall be in addition to any other levy imposedpursuant to this section.5. A certified copy of the ordinance imposing the levy shall be furnished by the county to thedepartment within 10 days after approval of the ordinance. The effective date of the levy shall bethe first day of any month at least 60 days after enactment of the ordinance.6. Revenues collected <strong>and</strong> returned to the county shall be deposited in a separate conventiondevelopment trust fund, which shall be established by the county as a condition precedent toreceipt of such funds.(5) LOCAL ADMINISTRATION OF TAX.--(a) A county levying a tax under the provisions of this section may be exempt from therequirements of this section that the tax collected be remitted to the Department of Revenuebefore being returned to the county <strong>and</strong> that such tax be administered according to theprovisions of this chapter, if the county adopts an ordinance providing for the collection <strong>and</strong>administration of the tax on a local basis.(b) The ordinance shall include provision for, but need not be limited to:1. Initial collection of the tax to be made in the same manner as the tax imposed under thischapter.2. Designation of the local official to whom the tax shall be remitted <strong>and</strong> that official's powers<strong>and</strong> duties with respect thereto. Tax revenues may be used only in accordance with theprovisions of this section.20
3. Requirements respecting the keeping of appropriate books, records, <strong>and</strong> accounts by thoseresponsible for collecting <strong>and</strong> administering the tax.4. Payment of a dealer's credit as required under this chapter.5. A portion of the tax collected may be retained by the county for costs of administration, butsuch portion shall not exceed 2 percent of collections.1 (c) A county adopting an ordinance providing for the collection <strong>and</strong> administration of the tax ona local basis shall also adopt an ordinance electing either to assume all responsibility for auditingthe records <strong>and</strong> accounts of dealers, <strong>and</strong> assessing, collecting, <strong>and</strong> enforcing payments ofdelinquent taxes, or to delegate such authority to the Department of Revenue. If the county electsto assume such responsibility, it shall be bound by the rules promulgated by the Department ofRevenue pursuant to paragraph (3)(f), as well as those rules pertaining to the sales <strong>and</strong> use tax ontransient rentals imposed by s. 212.03. The county may use any power granted in this chapter tothe department to determine the amount of tax, penalties, <strong>and</strong> interest to be paid by each dealer<strong>and</strong> to enforce payment of such tax, penalties, <strong>and</strong> interest. The county may use a certified publicaccountant licensed in this state in the administration of its statutory duties <strong>and</strong> responsibilities.Such certified public accountants are bound by the same confidentiality requirements <strong>and</strong> subjectto the same penalties as the county under s. 213.053. If the county delegates such authority to thedepartment, the department shall distribute any collections so received, less costs ofadministration, to the county. The amount deducted for costs of administration by thedepartment shall be used only for those costs which are solely <strong>and</strong> directly attributable toauditing, assessing, collecting, processing, <strong>and</strong> enforcing payments of delinquent taxesauthorized in this section. If a county elects to delegate such authority to the department, thedepartment shall audit only those businesses in the county that it audits pursuant to this chapter.Section 212.03055 Super majority vote required for levy at rate in excess of 2 percent under ch.95-290 --A special taxing district may not levy a tax under chapter 95-290, Laws of <strong>Florida</strong>, at arate in excess of 2 percent unless the levy of such tax is approved by a super majority (a majorityplus one) vote of the members of the governing body of the county in which the special taxingdistrict is located.Section 218.23 Revenue sharing with units of local government -- (1) To be eligible toparticipate in revenue sharing beyond the minimum entitlement in any fiscal year, a unit of localgovernment is required to have:(a) Reported its finances for its most recently completed fiscal year to the Department ofFinancial Services, pursuant to s. 218.32.(b) Made provisions for annual postaudits of its financial accounts in accordance with provisionsof law.(c) Levied, as shown on its most recent financial report pursuant to s. 218.32, ad valorem taxes,exclusive of taxes levied for debt service or other special millages authorized by the voters, toproduce the revenue equivalent to a millage rate of 3 mills on the dollar based on the 1973 taxablevalues as certified by the property appraiser pursuant to s. 193.122(2) or, in order to producerevenue equivalent to that which would otherwise be produced by such 3-mill ad valorem tax, tohave received a remittance from the county pursuant to s. 125.01(6)(a), collected an occupationallicense tax or a utility tax, levied an ad valorem tax, or received revenue from any combination ofthese four sources. If a new municipality is incorporated, the provisions of this paragraph shall21
apply to the taxable values for the year of incorporation as certified by the property appraiser.This paragraph requires only a minimum amount of revenue to be raised from the ad valoremtax, the occupational license tax, <strong>and</strong> the utility tax. It does not require a minimum millage rate.(d) Certified that persons in its employ as law enforcement officers, as defined in s. 943.10(1),meet the qualifications for employment as established by the Criminal Justice St<strong>and</strong>ards <strong>and</strong>Training Commission; that its salary structure <strong>and</strong> salary plans meet the provisions of chapter943; <strong>and</strong> that no law enforcement officer is compensated for his or her services at an annualsalary rate of less than $6,000. However, the department may waive the minimum lawenforcement officer salary requirement if a city or county certifies that it is levying ad valoremtaxes at 10 mills.(e) Certified that persons in its employ as firefighters, as defined in s. 633.30(1), meet thequalification for employment as established by the Division of State Fire Marshal pursuant to theprovisions of ss. 633.34 <strong>and</strong> 633.35 <strong>and</strong> that the provisions of s. 633.382 have been met.(f) Certified that each dependent special district that is budgeted separately from the generalbudget of the local governing authority has met the provisions for annual postaudit of itsfinancial accounts in accordance with the provisions of law.Additionally, to receive its share of revenue sharing funds, a unit of local government shallcertify to the Department of Revenue that the requirements of s. 200.065, if applicable, were met.The certification shall be made annually within 30 days of adoption of an ordinance or resolutionestablishing a final property tax levy or, if no property tax is levied, not later than November 1.The portion of revenue sharing funds which, pursuant to this part, would otherwise bedistributed to a unit of local government which has not certified compliance or has otherwisefailed to meet the requirements of s. 200.065 shall be deposited in the General Revenue Fund forthe 12 months following a determination of noncompliance by the department.(2) Any unit of local government which is consolidated as provided by s. 9, Art. VIII of the StateConstitution of 1885, as preserved by s. 6(e), Art. VIII, 1968 revised constitution, shall receive anannual distribution from the Revenue Sharing Trust Fund for Counties equal to $6.24 times itspopulation.(3) The distribution to a unit of local government under this part is determined by the followingformula:(a) First, the entitlement of an eligible unit of local government shall be computed on the basis ofthe apportionment factor provided in s. 218.245, which shall be applied for all eligible units oflocal government to all receipts available for distribution in the respective revenue sharing trustfund.(b) Second, revenue shared with eligible units of local government for any fiscal year shall beadjusted so that no eligible unit of local government receives less funds than its guaranteedentitlement.(c) Third, revenues shared with counties for any fiscal year shall be adjusted so that no countyreceives less funds than its guaranteed entitlement plus the second guaranteed entitlement forcounties.22
(d) Fourth, revenue shared with units of local government for any fiscal year shall be adjusted sothat no unit of local government receives less funds than its minimum entitlement.(e) Fifth, after the adjustments provided in paragraphs (b), (c), <strong>and</strong> (d), <strong>and</strong> after deducting theamount committed to all the units of local government, the funds remaining in the respectivetrust funds shall be distributed to those eligible units of local government which qualify toreceive additional moneys beyond the guaranteed entitlement, on the basis of the additionalmoney of each qualified unit of local government in proportion to the total additional money ofall qualified units of local government.(4) Notwithst<strong>and</strong>ing the provisions of paragraph (1)(c), no unit of local government which waseligible to participate in revenue sharing in the 3 years prior to initially participating in the localgovernment half-cent sales tax shall be ineligible to participate in revenue sharing solely due to amillage or utility tax reduction afforded by the local government half-cent sales tax.Section 218.63 Participation requirements -- (1) Only those units of local government whichmeet the eligibility requirements for revenue sharing pursuant to s. 218.23 shall participate in thelocal government half-cent sales tax. However, a municipality incorporated subsequent to theeffective date of chapter 82-154, Laws of <strong>Florida</strong>, which does not meet the applicable criteria forincorporation pursuant to s. 165.061 shall not participate in the local government half-cent salestax. In either case, distributions to eligible units of local government in that county shall be madeas though the nonparticipating municipality had not incorporated.(2) The moneys which otherwise would be distributed pursuant to this part to a unit of localgovernment failing to certify compliance as required by s. 218.23(1) or having otherwise failed tomeet the requirements of s. 200.065 shall be deposited in the General Revenue Fund for the 12months following a determination of noncompliance by the department.Section 165.061 St<strong>and</strong>ards for incorporation, merger, <strong>and</strong> dissolution -- (1) The incorporationof a new municipality, other than through merger of existing municipalities, must meet thefollowing conditions in the area proposed for incorporation:(a) It must be compact <strong>and</strong> contiguous <strong>and</strong> amenable to separate municipal government.(b) It must have a total population, as determined in the latest official state census, specialcensus, or estimate of population, in the area proposed to be incorporated of at least 1,500persons in counties with a population of 75,000 or less, <strong>and</strong> of at least 5,000 population incounties with a population of more than 75,000.(c) It must have an average population density of at least 1.5 persons per acre or haveextraordinary conditions requiring the establishment of a municipal corporation with lessexisting density.(d) It must have a minimum distance of any part of the area proposed for incorporation from theboundaries of an existing municipality within the county of at least 2 miles or have anextraordinary natural boundary which requires separate municipal government.(e) It must have a proposed municipal charter which:23
1. Prescribes the form of government <strong>and</strong> clearly defines the responsibility for legislative <strong>and</strong>executive functions.2. Does not prohibit the legislative body of the municipality from exercising its powers to levyany tax authorized by the Constitution or general law.(f) In accordance with s. 10, Art. I of the State Constitution, the plan for incorporation must honorexisting solid-waste contracts in the affected geographic area subject to incorporation. However,the plan for incorporation may provide for existing contracts for solid-waste-collection services tobe honored only for 5 years or the remainder of the contract term, whichever is less, <strong>and</strong> mayrequire that a copy of the pertinent portion of the contract or other written evidence of theduration of the contract, excluding any automatic renewals or evergreen provisions, be providedto the municipality within a reasonable time after a written request to do so.(2) The incorporation of a new municipality through merger of existing municipalities <strong>and</strong>associated unincorporated areas must meet the following conditions:(a) The area proposed for incorporation must be compact <strong>and</strong> contiguous <strong>and</strong> susceptible tourban services.(b) Any unincorporated area to be included must meet the st<strong>and</strong>ards provided in s. 171.042, ifavailable.(c) The plan for merger <strong>and</strong> incorporation must provide for an equitable arrangement in relationto bonded indebtedness <strong>and</strong> the status <strong>and</strong> pension rights of employees of each governmentalunit proposed to be merged.(d) In accordance with s. 10, Art. I of the State Constitution, the plan for merger must honorexisting solid-waste contracts in the affected geographic area subject to merger. However, theplan for merger may provide for existing contracts for solid-waste-collection services to behonored only for 5 years or the remainder of the contract term, whichever is shorter, <strong>and</strong> mayrequire that a copy of the pertinent portion of the contract or other written evidence of theduration of the contract, excluding any automatic renewals or so-called "evergreen" provisions,be provided to the municipality within a reasonable time following a written request to do so.(3) The dissolution of a municipality must meet the following conditions:(a) The municipality to be dissolved must not be substantially surrounded by othermunicipalities.(b) The county or another municipality must be demonstrably able to provide necessary servicesto the municipal area proposed for dissolution.(c) An equitable arrangement must be made in relation to bonded indebtedness <strong>and</strong> vestedrights of employees of the municipality to be dissolved.Section 125.0104 Tourist development tax; procedure for levying; authorized uses;referendum; enforcement.—(3) TAXABLE PRIVILEGES; EXEMPTIONS; LEVY; RATE.—24
(l) In addition to any other tax which is imposed pursuant to this section, a county may imposeup to an additional 1-percent tax on the exercise of the privilege described in paragraph (a) bymajority vote of the governing board of the county in order to:1. Pay the debt service on bonds issued to finance the construction, reconstruction, or renovationof a professional sports franchise facility, or the acquisition, construction, reconstruction, orrenovation of a retained spring training franchise facility, either publicly owned <strong>and</strong> operated, orpublicly owned <strong>and</strong> operated by the owner of a professional sports franchise or other lessee withsufficient expertise or financial capability to operate such facility, <strong>and</strong> to pay the planning <strong>and</strong>design costs incurred prior to the issuance of such bonds.2. Pay the debt service on bonds issued to finance the construction, reconstruction, or renovationof a convention center, <strong>and</strong> to pay the planning <strong>and</strong> design costs incurred prior to the issuance ofsuch bonds.3. Pay the operation <strong>and</strong> maintenance costs of a convention center for a period of up to 10 years.Only counties that have elected to levy the tax for the purposes authorized in subparagraph 2.may use the tax for the purposes enumerated in this subparagraph. Any county that elects to levythe tax for the purposes authorized in subparagraph 2. after July 1, 2000, may use the proceeds ofthe tax to pay the operation <strong>and</strong> maintenance costs of a convention center for the life of thebonds.4. Promote <strong>and</strong> advertise tourism in the State of <strong>Florida</strong> <strong>and</strong> nationally <strong>and</strong> internationally;however, if tax revenues are expended for an activity, service, venue, or event, the activity,service, venue, or event shall have as one of its main purposes the attraction of tourists asevidenced by the promotion of the activity, service, venue, or event to tourists.The provision of paragraph (b) which prohibits any county authorized to levy a conventiondevelopment tax pursuant to s. 212.0305 from levying more than the 2-percent tax authorized bythis section, <strong>and</strong> the provisions of paragraphs (4)(a)-(d), shall not apply to the additional taxauthorized in this paragraph. The effective date of the levy <strong>and</strong> imposition of the tax authorizedunder this paragraph shall be the first day of the second month following approval of theordinance by the governing board or the first day of any subsequent month as may be specifiedin the ordinance. A certified copy of such ordinance shall be furnished by the county to theDepartment of Revenue within 10 days after approval of such ordinance.Section 212.0305 Convention development taxes; intent; administration; authorization; use ofproceeds.-- 4) AUTHORIZATION TO LEVY; USE OF PROCEEDS; OTHER REQUIREMENTS.—(a) Consolidated government levy for convention development.--1. Each county that operates under a government consolidated with that of one or moremunicipalities in the county may impose, pursuant to an ordinance enacted by the governingbody of the county, a levy on the exercise within its boundaries of the taxable privilege of leasingor letting transient rental accommodations described in subsection (3) at the rate of 2 percent ofeach dollar <strong>and</strong> major fraction of each dollar of the total consideration charged therefor. Theproceeds of this levy shall be known as the consolidated county convention development tax.2. The county shall furnish to the department, within 10 days after approval of the ordinanceimposing the levy, a copy of the ordinance. The effective date of imposition of the levy must bethe first day of any month that is at least 60 days after enactment of the ordinance.25
3. All consolidated county convention development moneys, including any interest accruedthereon, received by a county imposing the levy must be used in any of the following manners,although the utilization authorized in sub-subparagraph a. shall apply only to municipalitieswith a population of 10,000 or more:a. To promote <strong>and</strong> advertise tourism;b. To extend, enlarge, <strong>and</strong> improve existing publicly owned convention centers in the county;c. To construct a multipurpose convention/coliseum/exhibition center or the maximumcomponents thereof as funds permit in the county; <strong>and</strong>d. To acquire, construct, extend, enlarge, remodel, repair, improve, or maintain one or moreconvention centers, stadiums, exhibition halls, arenas, coliseums, or auditoriums.4. For the purposes of completion of any project under this paragraph, tax revenues <strong>and</strong> interestaccrued may be used:a. As collateral, pledged, or hypothecated for projects authorized by this paragraph, includingbonds issued in connection therewith; orb. As a pledge or capital contribution in conjunction with a partnership, joint venture, or otherbusiness arrangement between the county <strong>and</strong> one or more business entities for projectsauthorized by this paragraph.5.a. The county may designate or appoint an authority to administer <strong>and</strong> disburse such proceeds<strong>and</strong> any other related source of revenue. However, the annual budget of the authority is subjectto approval of the governing body of the county.b. Except as otherwise provided by law, one-half of the proceeds of the tax which are collectedwithin a municipality the government of which is not consolidated with that of the county must,at the request of the governing body of the municipality, be remitted to the municipality. Therevenue remitted to a municipality under this sub-subparagraph may be used by themunicipality only for the purposes <strong>and</strong> in the manner authorized in this paragraph, but themunicipality may enter into an interlocal agreement with the county or with any othermunicipality in the county to use such revenue to jointly finance any project authorized by thisparagraph. This sub-subparagraph does not apply to the distribution to the county of anyconvention development tax revenues necessary to repay the principal of or the interest on anybonds issued under sub-subparagraph 4.a. before May 29, 1984. Notwithst<strong>and</strong>ing this subsubparagraph,if the governing body of such a municipality adopts a resolution stating that themunicipality is unable to use such revenue for any purpose authorized in this paragraph, themunicipality may use the revenue to acquire <strong>and</strong> develop municipal parks, lifeguard stations, orathletic fields.6. The consolidated county convention development tax shall be in addition to any other levyimposed under this section.7. Revenues collected <strong>and</strong> returned to the county must be deposited in a conventiondevelopment trust fund, which must be established by the county as a condition precedent toreceipt of such funds.26
Section 218.62 Distribution formulas -- (1) Each participating county <strong>and</strong> municipalgovernment shall receive a proportion of moneys earmarked for distribution within that county.(2) The proportion for each county government shall be computed by dividing the sum of theunincorporated area population plus two-thirds of the incorporated area population by the sumof the total county population plus two-thirds of the incorporated area population.(3) The proportion for each municipal government shall be computed by dividing the populationof that municipality by the sum of the total county population plus two-thirds of the incorporatedarea population.(4) Effective October 1, 2000, the apportionment factors shall, except in the case of error in thepopulation certified pursuant to s. 186.901, remain in effect for the fiscal year. Adjustments todistributions to correct errors shall be made subsequent to receipt of a corrected populationcertified pursuant to s. 186.901.Section 395.002 Definitions.--As used in this chapter:(1) "Accrediting organizations" means the Joint Commission on Accreditation of HealthcareOrganizations, the American Osteopathic Association, the Commission on Accreditation ofRehabilitation <strong>Facilities</strong>, <strong>and</strong> the Accreditation Association for Ambulatory Health Care, Inc.(2) "Agency" means the Agency for Health Care Administration.(3) "Ambulatory surgical center" or "mobile surgical facility" means a facility the primarypurpose of which is to provide elective surgical care, in which the patient is admitted to <strong>and</strong>discharged from such facility within the same working day <strong>and</strong> is not permitted to stayovernight, <strong>and</strong> which is not part of a hospital. However, a facility existing for the primarypurpose of performing terminations of pregnancy, an office maintained by a physician for thepractice of medicine, or an office maintained for the practice of dentistry shall not be construed tobe an ambulatory surgical center, provided that any facility or office which is certified or seekscertification as a Medicare ambulatory surgical center shall be licensed as an ambulatory surgicalcenter pursuant to s. 395.003. Any structure or vehicle in which a physician maintains an office<strong>and</strong> practices surgery, <strong>and</strong> which can appear to the public to be a mobile office because thestructure or vehicle operates at more than one address, shall be construed to be a mobile surgicalfacility.(4) "Applicant" means an individual applicant, or any officer, director, or agent, or any partner orshareholder having an ownership interest equal to a 5-percent or greater interest in thecorporation, partnership, or other business entity.(5) "Biomedical waste" means any solid or liquid waste as defined in s. 381.0098(2)(a).(6) "Clinical privileges" means the privileges granted to a physician or other licensed health carepractitioner to render patient care services in a hospital, but does not include the privilege ofadmitting patients.(7) "Department" means the Department of Health.27
(8) "Director" means any member of the official board of directors as reported in theorganization's annual corporate report to the <strong>Florida</strong> Department of State, or, if no such report ismade, any member of the operating board of directors. The term excludes members of separate,restricted boards that serve only in an advisory capacity to the operating board.(9) "Emergency medical condition" means:(a) A medical condition manifesting itself by acute symptoms of sufficient severity, which mayinclude severe pain, such that the absence of immediate medical attention could reasonably beexpected to result in any of the following:1. Serious jeopardy to patient health, including a pregnant woman or fetus.2. Serious impairment to bodily functions.3. Serious dysfunction of any bodily organ or part.(b) With respect to a pregnant woman:1. That there is inadequate time to effect safe transfer to another hospital prior to delivery;2. That a transfer may pose a threat to the health <strong>and</strong> safety of the patient or fetus; or3. That there is evidence of the onset <strong>and</strong> persistence of uterine contractions or rupture of themembranes.(10) "Emergency services <strong>and</strong> care" means medical screening, examination, <strong>and</strong> evaluation by aphysician, or, to the extent permitted by applicable law, by other appropriate personnel underthe supervision of a physician, to determine if an emergency medical condition exists <strong>and</strong>, if itdoes, the care, treatment, or surgery by a physician necessary to relieve or eliminate theemergency medical condition, within the service capability of the facility.(11) "General hospital" means any facility which meets the provisions of subsection (13) <strong>and</strong>which regularly makes its facilities <strong>and</strong> services available to the general population.(12) "Governmental unit" means the state or any county, municipality, or other politicalsubdivision, or any department, division, board, or other agency of any of the foregoing.(13) "Hospital" means any establishment that:(a) Offers services more intensive than those required for room, board, personal services, <strong>and</strong>general nursing care, <strong>and</strong> offers facilities <strong>and</strong> beds for use beyond 24 hours by individualsrequiring diagnosis, treatment, or care for illness, injury, deformity, infirmity, abnormality,disease, or pregnancy; <strong>and</strong>(b) Regularly makes available at least clinical laboratory services, diagnostic X-ray services, <strong>and</strong>treatment facilities for surgery or obstetrical care, or other definitive medical treatment of similarextent.However, the provisions of this chapter do not apply to any institution conducted by or for the28
adherents of any well-recognized church or religious denomination that depends exclusivelyupon prayer or spiritual means to heal, care for, or treat any person. For purposes of local zoningmatters, the term "hospital" includes a medical office building located on the same premises as ahospital facility, provided the l<strong>and</strong> on which the medical office building is constructed is zonedfor use as a hospital; provided the premises were zoned for hospital purposes on January 1, 1992.(14) "Hospital bed" means a hospital accommodation which is ready for immediate occupancy,or is capable of being made ready for occupancy within 48 hours, excluding provision of staffing,<strong>and</strong> which conforms to minimum space, equipment, <strong>and</strong> furnishings st<strong>and</strong>ards as specified byrule of the agency for the provision of services specified in this section to a single patient.(15) "Initial denial determination" means a determination by a private review agent that thehealth care services furnished or proposed to be furnished to a patient are inappropriate, notmedically necessary, or not reasonable.(16) "Intensive residential treatment programs for children <strong>and</strong> adolescents" means a specialtyhospital accredited by the Joint Commission on Accreditation of Healthcare Organizations whichprovides 24-hour care <strong>and</strong> which has the primary functions of diagnosis <strong>and</strong> treatment ofpatients under the age of 18 having psychiatric disorders in order to restore such patients to anoptimal level of functioning.(17) "Licensed facility" means a hospital, ambulatory surgical center, or mobile surgical facilitylicensed in accordance with this chapter.(18) "Lifesafety" means the control <strong>and</strong> prevention of fire <strong>and</strong> other life-threatening conditions ona premises for the purpose of preserving human life.(19) "Managing employee" means the administrator or other similarly titled individual who isresponsible for the daily operation of the facility.(20) "Medical staff" means physicians licensed under chapter 458 or chapter 459 with privilegesin a licensed facility, as well as other licensed health care practitioners with clinical privileges asapproved by a licensed facility's governing board.(21) "Medically necessary transfer" means a transfer made necessary because the patient is inimmediate need of treatment for an emergency medical condition for which the facility lacksservice capability or is at service capacity.(22) "Mobile surgical facility" is a mobile facility in which licensed health care professionalsprovide elective surgical care under contract with the Department of Corrections or a privatecorrectional facility operating pursuant to chapter 957 <strong>and</strong> in which inmate patients are admittedto <strong>and</strong> discharged from said facility within the same working day <strong>and</strong> are not permitted to stayovernight. However, mobile surgical facilities may only provide health care services to theinmate patients of the Department of Corrections, or inmate patients of a private correctionalfacility operating pursuant to chapter 957, <strong>and</strong> not to the general public.(23) "Person" means any individual, partnership, corporation, association, or governmental unit.(24) "Premises" means those buildings, beds, <strong>and</strong> equipment located at the address of thelicensed facility <strong>and</strong> all other buildings, beds, <strong>and</strong> equipment for the provision of hospital,29
ambulatory surgical, or mobile surgical care located in such reasonable proximity to the addressof the licensed facility as to appear to the public to be under the dominion <strong>and</strong> control of thelicensee. For any licensee that is a teaching hospital as defined in s. 408.07(44), reasonableproximity includes any buildings, beds, services, programs, <strong>and</strong> equipment under the dominion<strong>and</strong> control of the licensee that are located at a site with a main address that is within 1 mile ofthe main address of the licensed facility; <strong>and</strong> all such buildings, beds, <strong>and</strong> equipment may, at therequest of a licensee or applicant, be included on the facility license as a single premises.(25) "Private review agent" means any person or entity which performs utilization reviewservices for third-party payors on a contractual basis for outpatient or inpatient services.However, the term shall not include full-time employees, personnel, or staff of health insurers,health maintenance organizations, or hospitals, or wholly owned subsidiaries thereof or affiliatesunder common ownership, when performing utilization review for their respective hospitals,health maintenance organizations, or insureds of the same insurance group. For this purpose,health insurers, health maintenance organizations, <strong>and</strong> hospitals, or wholly owned subsidiariesthereof or affiliates under common ownership, include such entities engaged as administrators ofself-insurance as defined in s. 624.031.(26) "Service capability" means all services offered by the facility where identification of servicesoffered is evidenced by the appearance of the service in a patient's medical record or itemizedbill.(27) "At service capacity" means the temporary inability of a hospital to provide a service whichis within the service capability of the hospital, due to maximum use of the service at the time ofthe request for the service.(28) "Specialty bed" means a bed, other than a general bed, designated on the face of the hospitallicense for a dedicated use.(29) "Specialty hospital" means any facility which meets the provisions of subsection (13), <strong>and</strong>which regularly makes available either:(a) The range of medical services offered by general hospitals, but restricted to a defined age orgender group of the population;(b) A restricted range of services appropriate to the diagnosis, care, <strong>and</strong> treatment of patientswith specific categories of medical or psychiatric illnesses or disorders; or(c) Intensive residential treatment programs for children <strong>and</strong> adolescents as defined insubsection (16).(30) "Stabilized" means, with respect to an emergency medical condition, that no materialdeterioration of the condition is likely, within reasonable medical probability, to result from thetransfer of the patient from a hospital.(31) "Utilization review" means a system for reviewing the medical necessity or appropriatenessin the allocation of health care resources of hospital services given or proposed to be given to apatient or group of patients.30
(32) "Utilization review plan" means a description of the policies <strong>and</strong> procedures governingutilization review activities performed by a private review agent.(33) "Validation inspection" means an inspection of the premises of a licensed facility by theagency to assess whether a review by an accrediting organization has adequately evaluated thelicensed facility according to minimum state st<strong>and</strong>ards.31