

Annual Report 2011 - Analist.be
Annual Report 2011 - Analist.be
Annual Report 2011 - Analist.be

You also want an ePaper? Increase the reach of your titles
YUMPU automatically turns print PDFs into web optimized ePapers that Google loves.
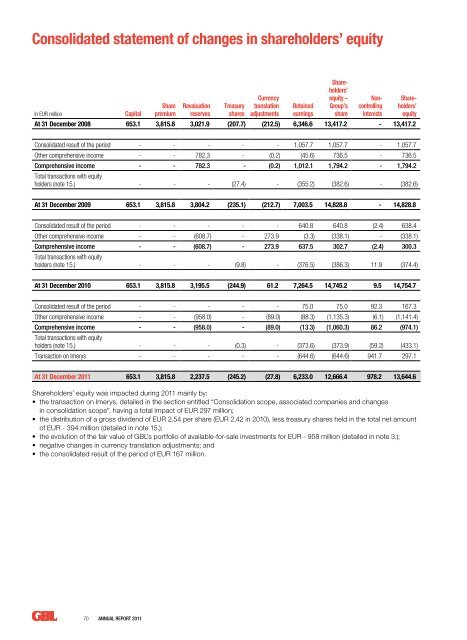
Consolidated statement of changes in shareholders’ equityIn EUR millionCapitalSharepremiumRevaluationreservesTreasurysharesCurrencytranslationadjustmentsRetainedearningsShareholders’equity –Group’sshareNoncontrollinginterestsShareholders’equityAt 31 Decem<strong>be</strong>r 2008 653.1 3,815.8 3,021.9 (207.7) (212.5) 6,346.6 13,417.2 - 13,417.2Consolidated result of the period - - - - - 1,057.7 1,057.7 - 1,057.7Other comprehensive income - - 782.3 - (0.2) (45.6) 736.5 - 736.5Comprehensive income - - 782.3 - (0.2) 1,012.1 1,794.2 - 1,794.2Total transactions with equityholders (note 15.) - - - (27.4) - (355.2) (382.6) - (382.6)At 31 Decem<strong>be</strong>r 2009 653.1 3,815.8 3,804.2 (235.1) (212.7) 7,003.5 14,828.8 - 14,828.8Consolidated result of the period - - - - - 640.8 640.8 (2.4) 638.4Other comprehensive income - - (608.7) - 273.9 (3.3) (338.1) - (338.1)Comprehensive income - - (608.7) - 273.9 637.5 302.7 (2.4) 300.3Total transactions with equityholders (note 15.) - - - (9.8) - (376.5) (386.3) 11.9 (374.4)At 31 Decem<strong>be</strong>r 2010 653.1 3,815.8 3,195.5 (244.9) 61.2 7,264.5 14,745.2 9.5 14,754.7Consolidated result of the period - - - - - 75.0 75.0 92.3 167.3Other comprehensive income - - (958.0) - (89.0) (88.3) (1,135.3) (6.1) (1,141.4)Comprehensive income - - (958.0) - (89.0) (13.3) (1,060.3) 86.2 (974.1)Total transactions with equityholders (note 15.) - - - (0.3) - (373.6) (373.9) (59.2) (433.1)Transaction on Imerys - - - - - (644.6) (644.6) 941.7 297.1At 31 Decem<strong>be</strong>r <strong>2011</strong> 653.1 3,815.8 2,237.5 (245.2) (27.8) 6,233.0 12,666.4 978.2 13,644.6Shareholders’ equity was impacted during <strong>2011</strong> mainly by:• the transaction on Imerys, detailed in the section entitled “Consolidation scope, associated companies and changesin consolidation scope”, having a total impact of EUR 297 million;• the distribution of a gross dividend of EUR 2.54 per share (EUR 2.42 in 2010), less treasury shares held in the total net amountof EUR - 394 million (detailed in note 15.);• the evolution of the fair value of GBL’s portfolio of available-for-sale investments for EUR - 958 million (detailed in note 3.);• negative changes in currency translation adjustments; and• the consolidated result of the period of EUR 167 million.70 <strong>Annual</strong> <strong>Report</strong> <strong>2011</strong>


