Overview of the activities - Suez EnvironnementFinancial reportIn a subdued economic environment,the group experienced sustained activitygrowth on each of its three operationalbusiness lines in <strong>2011</strong>.Turnover rose by 6.9% in <strong>2011</strong> toEUR 14,830 million from its 2010 level(EUR 13,869 million). Excluding foreignexchange and group structure effects,activity expanded by 5.0%.• The Water Europe business line (grossexpansion of 2.0%, organic expansionof 2.9%) <strong>be</strong>nefited from higher pricesand volumes at Agbar, while favourableprice evolutions at Lyonnaise des Eauxwere partially offset by a decline involumes invoiced.• The Waste Europe division registeredorganic growth of 9.0% (+ 9.4%gross) driven by the overall rise involumes and prices of secondary rawmaterials, which positively impactedthe Sorting/Recycling activity.• The International business line (grossgrowth of 8.5%, organic growth of1.6%) gained from a positive groupstructure effect (WSN EnvironmentalSolutions) and dynamic activity (pricesand volumes) in all units, particularlyin Asia, Australia and Morocco, withthe exception of Degrémont, impactedby the Melbourne contract.Earnings generated in Europe, NorthAmerica and Australia accountedfor more than 84% of total income,with more than 71% coming from theEuropean continent alone.This turnover increase was matchedwith improved operating performance.Gross operating income (EBITDA) for<strong>2011</strong> grew by 7.4% to EUR 2,513 million(EUR 2,339 million in 2010), in particulardue to the effect of progress in costoptimisation (Compass 2), which resulted inEUR 130 million in net savings over the year,despite the additional construction costs forthe desalination plant in Melbourne.• The Water Europe business lineaccounted for 48% of this result withEUR 1,213 million, a gross increase of16.8% over 2010 (EUR 1,038 million).Its profit margin rose to 28.8% (25.2%in 2010), primarily reflecting thepositive impact of higher tariffs andcost control.• The Waste Europe business lineaccounted for 35% of this result withEUR 881 million, a 5.0% increase(EUR 839 million in 2010). Profitmargin declined slightly to 13.7%(14.2% in 2010) owing to the negativeimpact of higher secondary rawmaterials prices on margins.• The International business linecontributed EUR 471 million, a 15.2%decline from the previous year. Itsprofit margin also fell to 11.3% (14.4%in 2010) due to costs related to theMelbourne plant for an amount ofEUR 153 million in <strong>2011</strong>.The group’s current operating income(EBIT) grew by 1.4% over 2010 toEUR 1,039 million (EUR 1,025 million).This positive evolution resulted fromfavourable group structure effects (Spainand Australia) which were offset to alarge extent by negative organic growth(impact of the Melbourne plant in theamount of EUR 262 million) and by slightlyunfavourable foreign exchange effects.Net result, group share, stood atEUR 323 million, a 42.8% decline from2010 (EUR 565 million), a year thatregistered net capital gains related to theAgbar transaction and to the unbundlingof joint interests. For <strong>2011</strong>, operationalperformance improvements were largelyoffset by the impact of the additionalcosts in Melbourne (EUR 237 million).The group’s cash flow <strong>be</strong>fore financialexpenses and taxes (EUR 2,130 million)expanded (EUR 1,977 million in 2010).Free cash flow <strong>be</strong>fore disposals anddevelopment investments amountedto EUR 860 million, a 1% increase over2010 excluding non-recurring elements.This recurring improvement stemmedmainly from the favourable change intaxes paid. Net investments amountedto EUR 1,414 million.The group’s net financial debtat the end of <strong>2011</strong> amounted toEUR 7,557 million (EUR 7,526 million atend 2010). Average debt maturity wasextended to 6.4 years (6.2 years atend 2010).Return on capital employed (ROCE)stood at 7.1% in <strong>2011</strong> (7.2% in 2010),reflecting the impact of the constructionof the desalination plant in Melbournenot <strong>be</strong>ing compensated for by theimproved profitability of existing assets.Suez Environnement will propose,at the General Meeting of shareholderson 24 May 2012, to distribute a dividendof EUR 0.65 per share for <strong>2011</strong>, a stablepayout compared to the previous year.Geographical breakdown of revenue (in %) Current operating margin by activities (in %) Return on capital employedby activities (ROCE) (in %)4030201004036.036.630201004036.036.630201010.111.5036.036.624.924.710.111.524.924.710.111.55.96.024.924.76.85.75.96.06.85.75.96.016.415.516.415.56.85.7FranceFranceSpainFranceOther European SpaincountriesOther European Spaincountries NorthOther America Europeancountries NorthAmerica AustraliaNorthAmerica AustraliaRest ofthe WorldAustraliaRest ofthe World16.415.5Rest ofthe World161412108642016 161412108642014.5141211.9108642014.511.914.511.96.06.06.06.06.06.03.18.33.18.33.18.3Water EuropeWater EuropeWater EuropeWaste EuropeWaste EuropeWaste EuropeInternationalInternationalInternational10 10 108086 64 42 209.78.0864209.78.09.78.06.76.26.76.26.72.8 6.27.22.87.22.87.2Water EuropeWater EuropeWater EuropeWaste EuropeWaste EuropeWaste EuropeInternational &otherInternational &otherInternational &other<strong>2011</strong> 201056 <strong>Annual</strong> <strong>Report</strong> <strong>2011</strong>
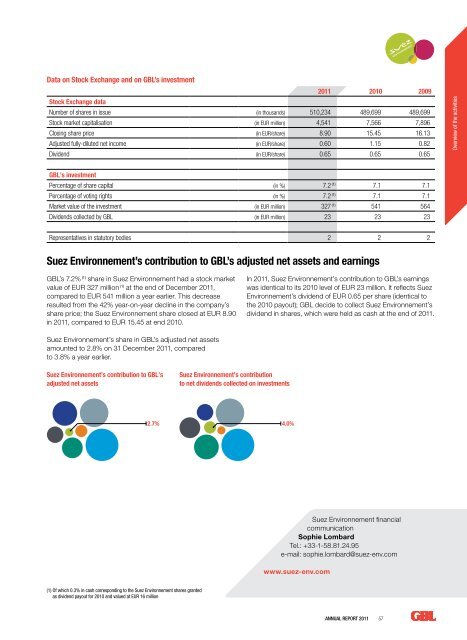
Data on Stock Exchange and on GBL’s investment<strong>2011</strong> 2010 2009Stock Exchange dataNum<strong>be</strong>r of shares in issue (in thousands) 510,234 489,699 489,699Stock market capitalisation (in EUR million) 4,541 7,566 7,896Closing share price (in EUR/share) 8.90 15.45 16.13Adjusted fully-diluted net income (in EUR/share) 0.60 1.15 0.82Dividend (in EUR/share) 0.65 0.65 0.65Overview of the activitiesGBL’s investmentPercentage of share capital (in %) 7.2 (1) 7.1 7.1Percentage of voting rights (in %) 7.2 (1) 7.1 7.1Market value of the investment (in EUR million) 327 (1) 541 564Dividends collected by GBL (in EUR million) 23 23 23403020100Representatives in statutory bodies 2 2 240Suez Environnement’s contribution 14 14to GBL’s adjusted net assets and earnings36.036.636.036.63012 12GBL’s 7.2% (1) share in Suez Environnement had 10 a 10 stock market20 value of EUR 327 million (1) at the end of Decem<strong>be</strong>r 8 8<strong>2011</strong>,compared to EUR 541 million a year earlier. This decrease6 6resulted from the 42% year-on-year decline in the company’s104 4share price; the Suez Environnement share closed at EUR 8.902 2in <strong>2011</strong>, compared to EUR 15.45 at end 2010.00 0Suez Environnement’s share in GBL’s adjusted net assetsamounted to 2.8% on 31 Decem<strong>be</strong>r <strong>2011</strong>, comparedto 3.8% a year earlier.10.111.524.924.710.111.524.924.75.96.05.96.06.85.716.415.56.85.7FranceFranceSpainOther European SpaincountriesOther Europeancountries NorthAmericaNorthAmerica AustraliaAustraliaRest ofthe World16.415.5Rest ofthe World161614.511.914.511.9Water EuropeWater Europe6.06.08 8In <strong>2011</strong>, Suez Environnement’s contribution to GBL’s earnings6 6was identical to its 2010 level of EUR 23 million. It reflects SuezEnvironnement’s dividend of 4EUR 40.65 per share (identical tothe 2010 payout); GBL decide to collect Suez Environnement’sdividend in shares, which were 2 held 2 as cash at the end of <strong>2011</strong>.6.06.0Waste EuropeWaste Europe3.18.33.18.3InternationalInternational1001009.78.09.78.0Water EuropeWater Europe6.76.26.76.2Waste EuropeWaste Europe2.87.22.87.2International &otherInternational &otherSuez Environnement’s contribution to GBL’sadjusted net assetsSuez Environnement’s contributionto net dividends collected on investments2.7% 2.7%4.0% 4.0%Suez Environnement financialcommunicationSophie LombardTel.: +33-1-58.81.24.95e-mail: sophie.lombard@suez-env.comwww.suez-env.com(1) Of which 0.3% in cash corresponding to the Suez Environnement shares grantedas dividend payout for 2010 and valued at EUR 16 million<strong>Annual</strong> <strong>Report</strong> <strong>2011</strong> 57