Consolidated figures IFRSKey figuresIn EUR million <strong>2011</strong> 2010 2009 2008 2007Consolidated resultCash earnings 522.3 565.0 603.5 718.1 532.2Mark to market and other non-cash 18.9 (20.0) 4.7 (117.8) (9.3)Operating companies (associated or consolidated)and private equity 284.4 260.2 135.5 337.7 144.0Eliminations, capital gains, impairments and reversals (750.6) (164.4) 314.0 (1,625.5) 112.0Consolidated result, group’s share 75.0 640.8 1,057.7 (687.5) 778.9Consolidated result of the period 167.3 638.4 1,057.7 (687.5) 778.9Total distribution 419.5 409.9 390.5 371.1 337.2Consolidated balance sheet (1)AssetsNon-current assets 15,788.7 14,727.7 14,694.7 12,894.7 17,519.3Current assets 2,361.2 818.7 632.2 1,141.1 1,863.2LiabilitiesShareholders’ equity 13,644.6 14,754.7 14,828.8 13,417.2 18,868.6Non-current liabilities 3,073.1 685.0 428.4 425.3 422.3Current liabilities25,0001,432.2 106.7 69.7 193.3 91.620,000 Num<strong>be</strong>r of shares at the end of the year (2)Basic 155,258,843 155,223,385 155,641,380 155,849,909 148,997,89115,000 Diluted 157,431,914 158,721,241 161,202,533 155,849,909 154,324,86610,000Pay-out (in %)Dividend/cash earnings5,00080.3 72.5 64.7 51.5 65.9Dividend/consolidated result 250.7 64.2 36.9 N/A 43.30Consolidated result per share 0.48 4.13 6.80 (4.41) 5.23Consolidated cash earnings per share 3.36 3.64 3.88 4.61 3.5720027,0417,52820038,8892004200511,11016,7632006200719,74612,8112008200915,23214,324201011,561 12,838<strong>2011</strong>02/2012Cash flow: Evolution over 1 year (in EUR million)1,2001,0008006004002000(200)(400)(600)(800)509Net cash31/12/2010522Cash earnings(410)Dividend paid(1,311)Investments90DisposalsPrivate equity(20)(74)Various(694)Net debt31/12/<strong>2011</strong>(1) The balance sheet figures for 2008 to 2010 presented for comparison purposes were restarted to take account of the voluntary change of accounting method for the treatment of actuarial variancesin respect of employee <strong>be</strong>nefits(2) The calculation of the num<strong>be</strong>r of basic and diluted shares is detailed on page 112 of the annual report2010Suez Environnement 3.8% 14 <strong>Annual</strong> <strong>Report</strong> <strong>2011</strong>Imerys 3.9%2.1% Other
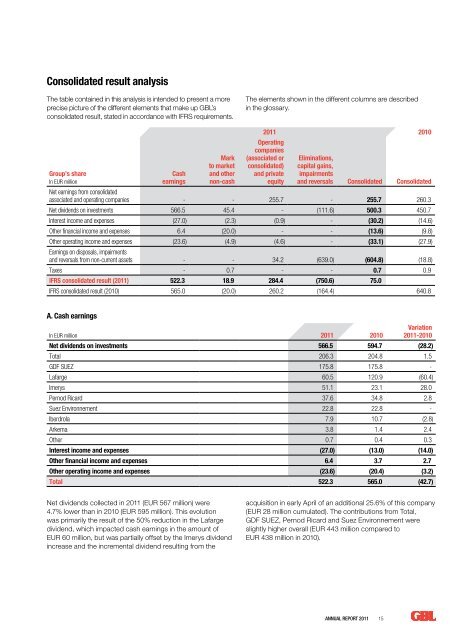
Consolidated result analysisThe table contained in this analysis is intended to present a moreprecise picture of the different elements that make up GBL’sconsolidated result, stated in accordance with IFRS requirements.The elements shown in the different columns are descri<strong>be</strong>din the glossary.Group’s shareIn EUR millionCashearningsMarkto marketand othernon-cash<strong>2011</strong> 2010Operatingcompanies(associated orconsolidated)and privateequityEliminations,capital gains,impairmentsand reversals Consolidated ConsolidatedNet earnings from consolidatedassociated and operating companies - - 255.7 - 255.7 260.3Net dividends on investments 566.5 45.4 - (111.6) 500.3 450.7Interest income and expenses (27.0) (2.3) (0.9) - (30.2) (14.6)Other financial income and expenses 6.4 (20.0) - - (13.6) (9.8)Other operating income and expenses (23.6) (4.9) (4.6) - (33.1) (27.9)Earnings on disposals, impairmentsand reversals from non-current assets - - 34.2 (639.0) (604.8) (18.8)Taxes - 0.7 - - 0.7 0.9IFRS consolidated result (<strong>2011</strong>) 522.3 18.9 284.4 (750.6) 75.0IFRS consolidated result (2010) 565.0 (20.0) 260.2 (164.4) 640.8A. Cash earningsIn EUR million <strong>2011</strong> 2010Variation<strong>2011</strong>-2010Net dividends on investments 566.5 594.7 (28.2)Total 206.3 204.8 1.5GDF SUEZ 175.8 175.8 -Lafarge 60.5 120.9 (60.4)Imerys 51.1 23.1 28.0Pernod Ricard 37.6 34.8 2.8Suez Environnement 22.8 22.8 -I<strong>be</strong>rdrola 7.9 10.7 (2.8)Arkema 3.8 1.4 2.4Other 0.7 0.4 0.3Interest income and expenses (27.0) (13.0) (14.0)Other financial income and expenses 6.4 3.7 2.7Other operating income and expenses (23.6) (20.4) (3.2)Total 522.3 565.0 (42.7)Net dividends collected in <strong>2011</strong> (EUR 567 million) were4.7% lower than in 2010 (EUR 595 million). This evolutionwas primarily the result of the 50% reduction in the Lafargedividend, which impacted cash earnings in the amount ofEUR 60 million, but was partially offset by the Imerys dividendincrease and the incremental dividend resulting from theacquisition in early April of an additional 25.6% of this company(EUR 28 million cumulated). The contributions from Total,GDF SUEZ, Pernod Ricard and Suez Environnement wereslightly higher overall (EUR 443 million compared toEUR 438 million in 2010).<strong>Annual</strong> <strong>Report</strong> <strong>2011</strong> 15
- Page 1: Annual Report2011 Groupe Bruxelles
- Page 4 and 5: Responsible persons1 Responsibility
- Page 6: Message to shareholdersLadies and G
- Page 10 and 11: Stock Exchange dataShareholder info
- Page 14: Selected Portfolio and financial ad
- Page 20 and 21: Consolidated figures IFRSIn 2011, t
- Page 22 and 23: 20 Annual Report 2011
- Page 24 and 25: Total is a global, integrated oil a
- Page 30: GDF SUEZ is a world reference energ
- Page 34 and 35: Overview of the activities - GDF SU
- Page 36 and 37: The world’s co-leader in Wine & S
- Page 39 and 40: Main financial data30 June 2011 30
- Page 42 and 43: With a presence in 64 countries, La
- Page 45 and 46: Environment variables and operating
- Page 47 and 48: Data on Stock Exchange and on GBL
- Page 49 and 50: Percentage of share capital .......
- Page 51 and 52: Environment variables and operating
- Page 54 and 55: Suez Environnement is a global lead
- Page 58 and 59: Overview of the activities - Suez E
- Page 62 and 63: Overview of the activities - Arkema
- Page 64 and 65: Overview of the activities - Arkema
- Page 66 and 67:
Other investmentsIberdrola(http://w
- Page 68 and 69:
66 Annual Report 2011
- Page 70 and 71:
Consolidated balance sheet at 31 De
- Page 72 and 73:
Consolidated statement of changes i
- Page 74 and 75:
Accounting policiesGroupe Bruxelles
- Page 77 and 78:
Non-current assets held for sale an
- Page 79 and 80:
Pension liabilities and similar obl
- Page 81 and 82:
When such estimates are established
- Page 83 and 84:
Changes in group structureThe most
- Page 85:
NotesFor the sake of consistency, t
- Page 88 and 89:
Accounts at 31 December 2011 - Note
- Page 90 and 91:
Accounts at 31 December 2011 - Note
- Page 92 and 93:
Accounts at 31 December 2011 - Note
- Page 94 and 95:
Accounts at 31 December 2011 - Note
- Page 96:
Accounts at 31 December 2011 - Note
- Page 99 and 100:
In EUR millionLand andbuildingsMine
- Page 101 and 102:
11. InventoriesIn EUR million 2011
- Page 103 and 104:
Bank loans (GBL)GBL drew on its cre
- Page 105 and 106:
16. ProvisionsIn EUR million Legal
- Page 107 and 108:
Asset plan distributionIn % 2011 20
- Page 109 and 110:
18. Other current liabilitiesIn EUR
- Page 111 and 112:
19.2. Change in net balance sheet p
- Page 113 and 114:
ImerysImerys has put in place an in
- Page 115:
Fair value and carrying amountTo re
- Page 118 and 119:
Statutory Auditor’s report116 Ann
- Page 120 and 121:
Non-consolidated summary balance sh
- Page 122 and 123:
Dividend policyThe profit appropria
- Page 124 and 125:
Accounts at 31 December 2011 - Hist
- Page 126 and 127:
Corporate governance statementIan G
- Page 128 and 129:
Corporate governance statement1.1.2
- Page 130 and 131:
Corporate governance statementGéra
- Page 132 and 133:
Corporate governance statementAmaur
- Page 134 and 135:
Corporate governance statementNumbe
- Page 136 and 137:
Corporate governance statementThe a
- Page 138 and 139:
Corporate governance statementThe t
- Page 140 and 141:
Corporate governance statement3.2.
- Page 142 and 143:
Corporate governance statement3.4.1
- Page 145 and 146:
6. Risk management and internal con
- Page 147 and 148:
Six specific risks have been identi
- Page 149 and 150:
7. Policy on conflicts of interestC
- Page 151 and 152:
Extract of the minutes of the meeti
- Page 153 and 154:
Chain of ownershipPaul G.Desmarais6
- Page 155 and 156:
9.3.3. Organisation chart of shareh
- Page 157 and 158:
11.9. Capital11.9.1. Issued capital
- Page 159 and 160:
Resolutions proposed to shareholder
- Page 161 and 162:
• Regent and Member of the Budget
- Page 163 and 164:
Paul DesmaraisVice-Chairman of the
- Page 165 and 166:
• Director of 152245 Canada Inc.
- Page 167 and 168:
List of activities and other mandat
- Page 169 and 170:
• Director of Pargesa Holding S.A
- Page 171 and 172:
• Director of Great-West Lifeco I
- Page 173 and 174:
Amaury de SezeDirectorList of activ
- Page 175 and 176:
• Director of 4400046 Canada Inc.
- Page 177:
Gross annual returnThe gross annual
- Page 180:
Groupe Bruxelles Lambertwww.gbl.be