Appendix B Aircraft Noise - Phoenix Sky Harbor International Airport
Appendix B Aircraft Noise - Phoenix Sky Harbor International Airport
Appendix B Aircraft Noise - Phoenix Sky Harbor International Airport

Create successful ePaper yourself
Turn your PDF publications into a flip-book with our unique Google optimized e-Paper software.
<strong>Appendix</strong> B<strong>Aircraft</strong> <strong>Noise</strong>
PHOENIX SKY HARBORINTERNATIONAL AIRPORTNOISE EXPOSUREMETHODOLOGY ANDASSUMPTIONSPrepared By:APPENDIX B-1
TABLE OF CONTENTSSectionPage1.0 EXISTING CONDITION ...................................................................................................................11.1 INTRODUCTION.................................................................................................................11.1.1 Methodology........................................................................................................... 11.1.2 Data Sources ......................................................................................................... 21.2 AIRCRAFT OPERATIONS AND FLEET MIX .....................................................................21.2.1 Number of <strong>Aircraft</strong> Departures and Arrivals........................................................... 21.2.2 <strong>Aircraft</strong> Types......................................................................................................... 31.2.3 Time of Day............................................................................................................ 41.2.4 <strong>Aircraft</strong> Profiles....................................................................................................... 41.2.5 Average Annual Day Operations ........................................................................... 61.3 FLIGHT TRACKS AND RUNWAY UTILIZATION...............................................................61.3.1 Flight Tracks........................................................................................................... 61.3.2 Runway Utilization.................................................................................................. 72.0 2015 FUTURE CONDITION ............................................................................................................82.1 INTRODUCTION.................................................................................................................82.1.1 Methodology........................................................................................................... 82.1.2 Data Sources ......................................................................................................... 82.2 AIRCRAFT OPERATIONS AND FLEET MIX .....................................................................82.2.1 Number of <strong>Aircraft</strong> Departures and Arrivals........................................................... 82.2.2 <strong>Aircraft</strong> Types......................................................................................................... 92.2.3 Average Annual Day Operations ......................................................................... 102.3 FLIGHT TRACKS AND RUNWAY UTILIZATION.............................................................10W:\12001277_PHOENIX EIS\APPENDICES\APP B\B-1\APP B-1.DOC\11/30/04i<strong>Phoenix</strong> <strong>Sky</strong> <strong>Harbor</strong> <strong>International</strong> <strong>Airport</strong><strong>Noise</strong> Exposure Methodology and Assumptions
LIST OF TABLESTable B-1-1 Summary of 2001 FAA Form 7230-1Table B-1-2 2001 <strong>Aircraft</strong> Activity SummaryTable B-1-3 A List of INM <strong>Aircraft</strong> Types with IATA <strong>Aircraft</strong> Type Codes, FAR Part 36 Stage, andHush KitTable B-1-4 IATA Airline Codes and OperatorsTable B-1-5 Departure Stage Length Distance in Nautical MilesTable B-1-6 Cargo Airline Hub <strong>Airport</strong>s and Distances to PHXTable B-1-7 Destinations and Stage Lengths from PHXTable B-1-8 2001 Air Carrier Average Daily <strong>Aircraft</strong> Operations SummaryTable B-1-9 2001 Air Cargo Average Daily <strong>Aircraft</strong> Operations SummaryTable B-1-10 2001 General Aviation Average Daily <strong>Aircraft</strong> Operations SummaryTable B-1-11 2001 Military Average Daily <strong>Aircraft</strong> Operations SummaryTable B-1-12 Departure Flight Track Utilization SummaryTable B-1-13 Arrival Flight Track Utilization SummaryTable B-1-14 2001 Existing Condition Runway Utilization SummaryTable B-1-15 2001 Normalized Condition Runway Utilization SummaryTable B-1-16 2015 Future Condition Annual <strong>Aircraft</strong> Operations SummaryTable B-1-17 2015 Future Condition Air Carrier’s <strong>Aircraft</strong> Replacement / Retirement SummaryTable B-1-18 2015 Future Condition Air Carrier Average Daily <strong>Aircraft</strong> Operations SummaryTable B-1-19 2015 Future Condition Air Cargo Average Daily <strong>Aircraft</strong> Operations SummaryTable B-1-20 2015 Future Condition General Aviation Average Daily <strong>Aircraft</strong> Operations SummaryTable B-1-21 2015 Future Condition Military Average Daily <strong>Aircraft</strong> Operations SummaryW:\12001277_PHOENIX EIS\APPENDICES\APP B\B-1\APP B-1.DOC\11/30/04ii <strong>Phoenix</strong> <strong>Sky</strong> <strong>Harbor</strong> <strong>International</strong> <strong>Airport</strong><strong>Noise</strong> Exposure Methodology and Assumptions
LIST OF FIGURESFigure B-1-1Figure B-1-2Figure B-1-3Figure B-1-4Figure B-1-5Figure B-1-6Figure B-1-7Figure B-1-8Figure B-1-9Figure B-1-10Figure B-1-11Figure B-1-12Figure B-1-13Figure B-1-14Figure B-1-15Figure B-1-16Figure B-1-17Figure B-1-18Figure B-1-19Figure B-1-20Figure B-1-21Figure B-1-22Figure B-1-23Runway 7L/25R Jet Departure Flight TracksRunway 7L/25R Turbo-Prop Departure Flight TracksRunway 7L/25R Prop Departure Flight TracksRunway 7R/25L Jet Departure Flight TracksRunway 7R/25L Turbo-Prop Departure Flight TracksRunway 7R/25L Prop Departure Flight TracksRunway 8/26 Jet Departure Flight TracksRunway 8/26 Turbo-Prop Departure Flight TracksRunway 8/26 Prop Departure Flight TracksRunway 7L/25R Jet Arrival Flight TracksRunway 7L/25R Turbo-Prop Arrival Flight TracksRunway 7L/25R Prop Arrival Flight TracksRunway 7R/25L Jet Arrival Flight TracksRunway 7R/25L Turbo-Prop Arrival Flight TracksRunway 7R/25L Prop Arrival Flight TracksRunway 8/26 Jet Arrival Flight TracksRunway 8/26 Turbo-Prop Arrival Flight TracksRunway 8/26 Prop Arrival Flight Tracks2001 Existing Condition East/West Flow Percentages2001 Normalized Condition East/West Flow Percentages2015 Future Condition Runway 7R/25L Jet Arrival Flight Times2015 Future Condition Runway 7R/25L Turbo-Prop Arrival Flight Tracks2015 Future Condition Runway 7R/25L Prop Arrival Flight TracksW:\12001277_PHOENIX EIS\APPENDICES\APP B\B-1\APP B-1.DOC\10/24/05iii <strong>Phoenix</strong> <strong>Sky</strong> <strong>Harbor</strong> <strong>International</strong> <strong>Airport</strong><strong>Noise</strong> Exposure Methodology and Assumptions
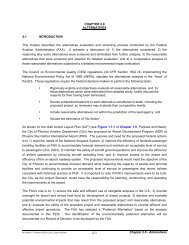
1.0 EXISTING CONDITION1.1 INTRODUCTIONThis report describes the methodology and assumptions to be utilized for the 2001 Baseline Conditionaircraft noise exposure analysis for the operation of the <strong>Phoenix</strong> <strong>Sky</strong> <strong>Harbor</strong> <strong>International</strong> <strong>Airport</strong> (PHX).It was prepared as part of an Environmental Impact Statement (EIS) for PHX. This aircraft noise analysisis based on PHX’s airport and aircraft operations for the period January 1 through December 31, 2001.1.1.1 METHODOLOGYThe evaluation of the PHX noise environment was conducted using the methodologies developed by theFAA and published in FAA Order 5050.4A, FAA Order 1050.1E, and FAR Title 14 CFR Part 150. Thesepublications require that aircraft noise levels in the vicinity of airports be determined on an annualaverage-daily basis utilizing the Day Night Average Sound Level (DNL) metric.The Integrated <strong>Noise</strong> Model (INM), Version 6.1, will be used to produce the noise contours and to analyzenoise levels at sensitive sites. The FAA developed the INM computer model and it is the most commonlyused method to predict airport noise contours. FAA continually enhances the INM to take advantage ofincreased computer speed, to incorporate new aircraft types into the aircraft noise database, and toimprove its noise computation algorithms.INM was designed to model the noise from aircraft operations in the immediate vicinity of an airport.Numerous tests have proven its ability to accurately model the DNL metric at distances from the airportcorresponding to the 65 dB DNL contour. The INM models departure operations beginning at the start oftakeoff roll and ending when aircraft reach an altitude of 10,000 feet, and arrival operations beginning at6,000 feet and ending when aircraft land and complete application of reverse thrust.Information required to run the model includes:• A physical description of the airport layout,• The airport elevation and average annual temperature,• The aircraft fleet mix for the average day,• The number of daytime flight and engine run-up operations (7 a.m. to 9:59 p.m.),• The number of nighttime flight and engine run-up operations (10 p.m. to 6:59 a.m.),• Runway utilization rates,• Primary departure and arrival flight tracks, and• Flight track utilization rates.W:\12001277_PHOENIX EIS\APPENDICES\APP B\B-1\APP B-1.DOC\03/03/051 <strong>Phoenix</strong> <strong>Sky</strong> <strong>Harbor</strong> <strong>International</strong> <strong>Airport</strong><strong>Noise</strong> Exposure Methodology and Assumptions
1.1.2 DATA SOURCESMultiple sources of data were collected, examined, and utilized to ensure that this aircraft noise analysisprovides an accurate depiction of the PHX baseline (2001) aircraft noise environment. The data sourcesexamined for this analysis included:• <strong>Aircraft</strong> operations from the January through December 2001 Federal AviationAdministration (FAA) <strong>Airport</strong> Traffic Records, Form 7230-1;• Passenger and Cargo Airline operations from PHX’s monthly Passenger andActivity Worksheets for January 2000 through April 2002;• <strong>Aircraft</strong> fleet mix, destination, time of day data, and runway use based on a sample offive days per month from PHX’s Total <strong>Airport</strong> Management Information System(TAMIS). TAMIS is operated and maintained by the PHX <strong>Noise</strong> Office; and• <strong>Aircraft</strong> flight track information for each of the PHX air traffic flows based on a sampleof ten days from PHX’s TAMIS.1.2 AIRCRAFT OPERATIONS AND FLEET MIX<strong>Airport</strong> operational factors that can significantly affect overall noise levels, as described by DNL, includethe total number of operations, aircraft fleet mix, and the time of day when aircraft operations occur. Thefollowing paragraphs describe these factors in more detail.1.2.1 NUMBER OF AIRCRAFT DEPARTURES AND ARRIVALSThe FAA’s <strong>Airport</strong> Traffic Records for 2001 provided the total number of operations that occurred during2001. The <strong>Airport</strong> Traffic Records (FAA Form 7230-1) report the number of operations in four generalcategories:• AC (Air Carrier),• AT (Air Taxi),• GA (General Aviation), and• MIL (Military).For traffic count purposes, an air carrier aircraft is considered to be an aircraft capable of carrying morethan 60 passengers. This applies even if the aircraft is conducting air freight operations. The air taxicategory includes operations by aircraft other than air carriers, which use three-letter companydesignators or the prefix “TANGO.” General aviation includes all civil aircraft except those classified as aircarriers or air taxis, and military includes all classes of military operations (FAA Order 7210.3R, FacilityOperation and Administration). Sometimes large private aircraft are counted in the AT category, ratherthan in the GA category.The total number of annual itinerant operations, by category, was divided by 365 to obtain the number ofaverage daily operations by category. The total number of average daily operations, by category, wasdivided in half to obtain the number of average daily arrivals and average daily departures. Table B-1summarizes the data obtained from the FAA <strong>Airport</strong> Traffic Records. According to the FAA Form 7230-1,W:\12001277_PHOENIX EIS\APPENDICES\APP B\B-1\APP B-1.DOC\03/03/052 <strong>Phoenix</strong> <strong>Sky</strong> <strong>Harbor</strong> <strong>International</strong> <strong>Airport</strong><strong>Noise</strong> Exposure Methodology and Assumptions
there were a total of 553,330 itinerant aircraft operations and 53,358 local aircraft operations in 2001.FAA Tower personnel at PHX indicated that “itinerant” refers to aircraft operated at PHX and “local” refersto aircraft that operated at satellite airports under the PHX Terminal Radar Approach Control facility(TRACON). Therefore, the number of local aircraft operations was excluded from noise modeling. Thenumber of average daily aircraft operations was 1,516 (annual aircraft operations divided by 365 days).The aircraft operations data taken from the monthly Passenger and Activity Worksheets provided byPHX are summarized in Table B-1-2. The worksheets indicated that there were 442,592 air carrieroperations and 28,866 air cargo operations, for a total of 471,458 annual air carrier and cargo operations.The FAA Form 7230-1 data indicated there were 394,912 AC operations and 93,751 AT operations, for atotal of 488,663 AC & AT operations.Sometimes large private aircraft are counted in the AT category, rather than in the GA category.Therefore, to reconcile the difference between the FAA Form 7230-1 data (488,663 operations) and thePassenger and Activity Worksheet data (471,458 operations), URS assumed that the excessoperations (488,663 – 471,458 = 17,205 annual operations) were actually GA operations that had beencounted as AT operations.The 17,205 excess AT operations calculated above were added to the 59,581 GA operations for a total of76,786 general aviation operations.1.2.2 AIRCRAFT TYPESCertain aircraft operating in the United States are subject to Federal requirements regarding noiseemission levels. Title 14 CFR Part 36, <strong>Noise</strong> Standards: <strong>Aircraft</strong> Type and Airworthiness Certificationprescribes the noise standards for aircraft certification in the United States. An aircraft is categorizedunder this regulation by one of three noise standards called stages. Stage 1 is the loudest category andStage 3 is currently the quietest category. Title 14 CFR Part 91 Subpart I, Operating <strong>Noise</strong> Limits, inconjunction with Part 36, apply to civil subsonic aircraft with maximum weights of more than 75,000pounds and mandate operating limits and compliance times for each stage. Under Part 91, Stage 1 and2 aircraft cannot be operated in the United States. Specifically, Title 14 CFR Part 91, § 91.853 reads inpart as follows: “Except as provided in § 91.873, after December 31, 1999, no person shall operate to orfrom any airport in the contiguous United States any airplane subject to § 91.801(c) of this subpart, unlessthat airplane has been shown to comply with Stage 3 noise levels.” Airlines operating in the UnitedStates have been able to comply with the Part 91 requirements by acquiring new aircraft that meet Stage3 standards, and by re-certificating some of their newer Stage 2 aircraft. Re-certificated Stage 2 aircrafthave been modified in some way to meet the more stringent Stage 3 standards. Examples of suchmodifications include the installation of hush-kits on existing engines, replacement of existing engines,installation or modification of other airframe components, and modification of aircraft operationalparameters.Military aircraft (e.g., KC-135, C141) and civil aircraft with maximum takeoff weights of less than 75,000 lb(e.g., GII, Falcon 20, Lear 25) are exempt from meeting the Stage 3 standards.W:\12001277_PHOENIX EIS\APPENDICES\APP B\B-1\APP B-1.DOC\11/30/043 <strong>Phoenix</strong> <strong>Sky</strong> <strong>Harbor</strong> <strong>International</strong> <strong>Airport</strong><strong>Noise</strong> Exposure Methodology and Assumptions
Based on the sample of TAMIS data analyzed for this project, all civil aircraft with maximum weights ofmore than 75,000 pounds complied with Part 36 Stage 3 in 2001. However, approximately 7 percent ofoverall aircraft operations in 2001 met the Stage 3 requirement through the use of re-certificated Stage 2aircraft.The make and model of aircraft that operated at PHX during 2001 was obtained from the TAMIS data.The aircraft type was provided in the Air Transport Association (ATA)/<strong>International</strong> Air TransportAssociation (IATA) <strong>Aircraft</strong> Type Codes. These ATA/IATA codes were translated by URS into INMaircraft types. Table B-1-3 shows the ATA/IATA codes and the corresponding INM aircraft types, asdetermined by URS.The INM aircraft database contains actual noise and performance data for 248 types of aircraft. Althoughthe INM aircraft database provides a large selection of aircraft to model, it does not contain every knownaircraft. For this reason, the FAA has developed an official aircraft substitution list, containing 256 typesof aircraft, which allows the modeler to substitute similar aircraft when necessary for modeling purposes.These substitutions represent a very close estimate of the noise produced by the aircraft. For thecalculation of the 2001 Baseline Condition contours, all modeled aircraft in this study are either a truerepresentative of an aircraft type or an acceptable FAA-approved substitution.The TAMIS data also provided an IATA Airline Code and flight number or an aircraft “N” number.Table B-1-4 shows the list of IATA airline codes and the corresponding aircraft operator, as determinedby URS.1.2.3 TIME OF DAYThe time of day that aircraft operations occur is a very important factor in the calculation of cumulativenoise exposure. The DNL treats nighttime (10:00 p.m. to 6:59 a.m.) noise differently from daytime(7:00 a.m. to 9:59 p.m.) noise. DNL multiplies each nighttime operation by 10. This weighting of theoperations effectively adds 10 dB to the A-weighted levels of each nighttime operation. This weightingfactor is applied to account for people’s greater sensitivity to nighttime noise. In addition, events duringthe night are often more intrusive because the ambient sound levels during this time are usually lowerthan daytime ambient sound levels.The TAMIS data listed the time of day operations occurred.1.2.4 AIRCRAFT PROFILESThe impact of noise on people increases or decreases as a function of the distance between the noisesource and the people. The greater the distance between the noise source and people, the less impactnoise has on people. Correspondingly, as the distance decreases, increased noise impacts areexperienced.<strong>Aircraft</strong> profiles are associated with distance in feet traveled from the runway, altitude in feet (above fieldelevation), speed in knots (true airspeed), and thrust setting in pounds. During departure procedures,distance is proportional to altitude and speed. When distance increases, altitude and speed alsoW:\12001277_PHOENIX EIS\APPENDICES\APP B\B-1\APP B-1.DOC\11/30/044 <strong>Phoenix</strong> <strong>Sky</strong> <strong>Harbor</strong> <strong>International</strong> <strong>Airport</strong><strong>Noise</strong> Exposure Methodology and Assumptions
increase. On the other hand, when distance increases, thrust setting decreases and remains stable.During arrival procedures, altitude and speed decrease as an aircraft approaches the airport. Unlikedeparture profiles, the thrust setting increases when an aircraft approaches the airport.Departure ProfilesThere are several factors that can influence an aircraft’s climb rate performance and altitude as it departsfrom PHX. The major influencing factors include the aircraft’s takeoff weight, instructions from Air TrafficControl, and the temperature and humidity. Generally, the aircraft’s altitude continues to increase as ittravels further away from the runway. The INM models departure profiles (i.e., altitude vs. distance fromthe runway) based on the pre-determined performance characteristics of each aircraft type.The altitude and temperature of the airport are important factors for noise modeling because high altitudeand temperature reflect lower air densities, resulting in decreased aircraft performance. According to the<strong>Airport</strong> Layout Plan, PHX is at an altitude of 1,133 feet above mean sea level. The INM input temperaturewas obtained from National Oceanic and Atmospheric Administration (NOAA), Monthly Station Normals ofTemperature, Precipitation, and Heating and Cooling Degree Days, 1971-2000. It indicated that annualaverage temperature at PHX is 72.8° Fahrenheit. The average relative humidity was obtained fromNOAA, National Climatic Data Center, 1960-2001. It indicated that annual average relative humidity inthe morning was 50 percent and in the afternoon was 23 percent. URS assumed that annual relativehumidity would be the average of the morning and afternoon annual average relative humidity.Therefore, the average relative humidity would be 36.5 percent for the INM input.The INM database contains several departure profiles for each aircraft type representing the varyingperformance characteristics for that aircraft at a particular takeoff weight. Use of appropriate departureprofiles is an important component of calculating DNL noise exposure contours. Historically, it has beeneasier to obtain trip length data than average weight data, so the INM uses “departure stage length” tobest represent typical aircraft takeoff weight. INM standard database aircraft departure profiles will beused to model existing aircraft operations at PHX.Departure stage length is the distance between the departure airport and the destination airport. As thedeparture stage length increases, the aircraft’s required fuel load and takeoff weight also increase. Theincrease in takeoff weight equates to a decrease in aircraft takeoff and climb performance. A decrease inaircraft performance results in a longer takeoff departure roll and decreased climb rates. Theseperformance characteristics produce increased noise exposure impacts. The aircraft’s noise impacts aregreater because the aircraft is producing noise closer to the ground longer. The departure stage lengthsare defined in Table B-1-5.The TAMIS data listed the destination of the air carrier departure operations. However, destinations forcargo operations were often listed as “unknown.” In these cases, URS assumed that the destination ofthese flights was each airline’s respective hub airport. A list of cargo hub airports is shown in Table B-1-6.W:\12001277_PHOENIX EIS\APPENDICES\APP B\B-1\APP B-1.DOC\11/30/045 <strong>Phoenix</strong> <strong>Sky</strong> <strong>Harbor</strong> <strong>International</strong> <strong>Airport</strong><strong>Noise</strong> Exposure Methodology and Assumptions
For passenger and cargo air carrier operations, departure stage lengths were identified by determiningthe distance between PHX and each destination airport. Table B-1-7 contains the list of destinations andtheir distance from PHX.Destinations were not provided by TAMIS for general aviation or military operations. URS assumed thelongest stage length available in INM for each general aviation and military aircraft type.Approach ProfilesURS assumed that all aircraft used standard approach profiles. Standard approach procedures have 4descent steps starting at 6,000, 3,000, 1,500, and 1,000 feet above field elevation and 2 final steps, whichare land and decelerate steps. A 3-degree descent angle is used to model all approaches. The INMcalculates aircraft noise until the aircraft has landed and stopped on the runway. The land and deceleratesteps end when aircraft stop on the runway.1.2.5 AVERAGE ANNUAL DAY OPERATIONSTables B-1-8 through B-1-11 provide the detailed average daily operations, by aircraft type, stage length,and time of day for air carrier, air cargo, general aviation, and military operations at PHX. These tableswill be the basis of the INM input.1.3 FLIGHT TRACKS AND RUNWAY UTILIZATIONIn order to calculate the annual average noise exposure, it is necessary to identify the predominantdeparture and arrival flight tracks for each runway, and the number of aircraft that used each runway andflight track. These are significant factors in determining the extent and shape of the noise contours.1.3.1 FLIGHT TRACKSRadar flight track data depict the actual path of aircraft over the ground for each aircraft departure andarrival. Ten days of 2001 radar data were used to identify the predominant departure and arrival flighttracks at PHX. The radar flight track data provided the underlying foundation for the development of flighttracks for the noise modeling effort.“Spine” tracks are placed in the area with the highest concentration of radar flight tracks. Dispersion flighttracks are placed in areas of lesser concentration of radar flight tracks. Dispersion flight tracks are notnecessarily parallel to the spine tracks, but placed so as to adequately represent the range of diversity ofthe radar flight tracks. These dispersion flight tracks simulate variations in pilot and air traffic controllertechniques and aircraft performance. The number of dispersion flight tracks for each “spine” track andthe width of the associated dispersion were developed by analyzing the radar data samples. In general,the width of the dispersion flight tracks increase in proportion to the distance from the runway.Figures B-1-1 through B-1-18 depict the existing departure and arrival flight tracks by runway ends andaircraft categories.W:\12001277_PHOENIX EIS\APPENDICES\APP B\B-1\APP B-1.DOC\11/30/046 <strong>Phoenix</strong> <strong>Sky</strong> <strong>Harbor</strong> <strong>International</strong> <strong>Airport</strong><strong>Noise</strong> Exposure Methodology and Assumptions
The use of individual flight tracks on any given runway is dependent on a variety of factors including AirTraffic Control procedures, the aircraft’s origin or destination, aircraft performance, weather conditions,and PHX noise abatement policies. The flight track utilization rates were derived from the radar datadescribed above. The radar data were segregated by the first navigation point (waypoint) for departuresor the last waypoint for arrivals. Each waypoint was associated with a particular departure or arrival flighttrack. The percentage of operations using each waypoint were summed and assigned to the associatedflight track. Tables B-1-12 and B-1-13 provide detailed information regarding departure and arrival flighttrack utilization by jet, turboprop, and prop aircraft.1.3.2 RUNWAY UTILIZATIONRunway use statistics, concerning which aircraft landed or departed a particular runway, were collectedand summarized for 2001. A sample of five days of aircraft operational data for each month, based onactual observations from the TAMIS data, was evaluated to identify runway utilization. The TAMIS datalisted the runway used for each aircraft operation.Table B-1-14 provides the runway utilization for air carriers, cargo, general aviation, and military aircraftoperations by aircraft category and day/night. In addition, Figure B-1-19 indicated over all runway use ineast/west flow and by day/night.During the months of January through April of 2001, Runway 8/26 (north runway) was reconstructedin concrete and utilization of the runway was limited during nighttime hours (between 10:00 p.m.and 7:00 a.m.). The runway reconstruction was completed on May 5, 2001. As a result, the runwayutilization for the study year 2001 does not represent the typical aircraft operational environment at PHX.Figure B-1-19 illustrates percentages for East and West flow for each runway during daytime andnighttime periods from January 1, 2001 through December 31, 2001.To normalize runway utilization and develop noise contours representing typical aircraft operations,aircraft operational data from June 1, 2001 to May 31, 2002 was collected and analyzed. During thisperiod, the airport operated under typical conditions. It was assumed that the runway utilization duringthis period would represent typical and normal aircraft operations at PHX. Table B-1-15 provides therunway utilization for air carriers, cargo, general aviation, and military aircraft operations by aircraftcategory and day/night. Figure B-1-20 illustrates percentages for East and West flow for each runwayduring daytime and nighttime periods from June 1, 2001 through May 31, 2002.W:\12001277_PHOENIX EIS\APPENDICES\APP B\B-1\APP B-1.DOC\11/30/047 <strong>Phoenix</strong> <strong>Sky</strong> <strong>Harbor</strong> <strong>International</strong> <strong>Airport</strong><strong>Noise</strong> Exposure Methodology and Assumptions
TABLE B-1-1Summary of 2001 FAA Form 7230-1<strong>Phoenix</strong> <strong>Sky</strong> <strong>Harbor</strong> <strong>International</strong> <strong>Airport</strong> Environmental Impact StatementMethodology and Assumptions ReportItinerant Local GrandMonth Air Carrier Air Taxi GA Military Total GA Military Total TotalJan-01 35,578 7,815 5,399 429 49,221 4,839 194 5,033 54,254Feb-01 32,180 7,302 5,398 355 45,235 4,799 138 4,937 50,172Mar-01 36,118 8,300 6,169 394 50,981 5,657 194 5,851 56,832Apr-01 34,135 7,759 5,855 357 48,106 5,186 165 5,351 53,457May-01 34,562 7,848 5,932 273 48,615 5,449 267 5,716 54,331Jun-01 33,596 8,022 5,102 293 47,013 4,701 191 4,892 51,905Jul-01 34,803 7,974 4,997 352 48,126 4,485 150 4,635 52,761Aug-01 35,143 8,128 5,123 382 48,776 4,455 345 4,800 53,576Sep-01 27,977 6,331 3,301 770 38,379 2,508 74 2,582 40,961Oct-01 32,162 7,653 4,314 811 44,940 2,683 116 2,799 47,739Nov-01 28,695 8,294 4,231 418 41,638 3,221 129 3,350 44,988Dec-01 29,963 8,325 3,760 252 42,300 3,303 109 3,412 45,712Total 394,912 93,751 59,581 5,086 553,330 51,286 2,072 53,358 606,688Note: GA - General AviationSource: <strong>Phoenix</strong> <strong>Sky</strong> <strong>Harbor</strong> <strong>International</strong> <strong>Airport</strong>, 2001.FAA Airoprt Traffic Records, 2001.W:\12001276_<strong>Phoenix</strong> <strong>Noise</strong>\B-1 Tables\11/30/2004
TABLE B-1-22001 <strong>Aircraft</strong> Activity Summary<strong>Phoenix</strong> <strong>Sky</strong> <strong>Harbor</strong> <strong>International</strong> <strong>Airport</strong> Environmental Impact StatementMethodology and Assumptions ReportAirline IATA Code* Jan Feb Mar Apr May Jun Jul Aug Sep Oct Nov Dec TotalTeminal 2Air Canada ACA 72 54 66 60 62 60 62 62 52 78 182 182 992Alaska ASA 808 758 886 832 556 502 514 498 392 564 720 774 7,804Express Air Inc AAE 184 156 104 54 - - - - - - - - 498Great Lakes Aviation Ltd GLA - - - - - 106 156 154 130 152 100 96 894TWA TWA 374 338 380 362 372 358 370 376 284 314 350 - 3,878United UAL 1,850 1,664 1,838 1,814 1,870 1,714 1,716 1,750 1,244 1,528 1,092 1,152 19,232USAirways USA 556 598 676 648 576 538 562 558 434 438 526 480 6,590Teminal 3American AAL 1,466 1,328 1,506 1,470 1,436 1,372 1,402 1,408 864 976 820 1,246 15,294American Trans Air AMT 228 198 238 230 222 186 194 192 176 198 182 202 2,446Casino Express CXP 46 56 44 46 38 10 6 2 4 4 4 12 272Delta DAL 1,414 1,112 1,234 1,250 1,296 1,160 1,216 1,262 1,082 1,252 982 1,054 14,314Frontier FFT 238 224 258 218 242 214 210 234 176 230 212 212 2,668Midwest Express MEP 112 110 124 120 90 96 94 98 82 116 106 114 1,262Northwest NWA 736 728 874 720 678 652 680 676 516 558 598 772 8,188<strong>Sky</strong>West SKW - - - - - - 118 124 106 200 774 800 2,122Sun Country SCX 60 64 80 72 60 60 62 62 54 62 60 - 696Terminal 4Aerolitoral SLI 8 6 10 6 2 - - - - - - - 32Aeromexico AMX 156 150 168 132 108 102 120 116 92 94 102 120 1,460Air Jamaica AJM 20 16 22 16 18 20 22 18 14 4 - - 170Allegro GRO 8 8 10 8 12 12 8 8 10 8 8 6 106America West AWE 14,504 13,190 14,752 13,634 14,182 13,980 14,378 14,556 11,790 12,826 10,690 11,470 159,952British Airways BAW 122 112 110 60 62 60 62 62 52 62 58 60 882Continental COA 784 696 772 752 726 686 712 722 562 624 604 624 8,264Lufthansa DLH - - - 60 58 60 62 62 52 28 26 32 440Mesa Airlines ASH/AMW 5,420 4,828 5,638 5,322 5,276 5,278 5,310 5,410 3,806 4,126 4,766 4,990 60,170Southwest SWA 10,452 9,418 10,518 10,258 10,524 10,340 10,898 10,990 9,112 10,940 10,208 10,308 123,966Passenger Airline Total 39,618 35,812 40,308 38,144 38,466 37,566 38,934 39,400 31,086 35,382 33,170 34,706 442,592CargoABX Air ABX 154 150 170 146 172 166 152 170 136 174 156 150 1,896AirNet USC 128 140 156 150 168 170 156 178 144 166 160 166 1,882Ameriflight AMF 922 802 644 978 1,066 986 986 980 722 942 842 816 10,686BAX Global CCI 48 48 48 38 42 46 38 48 32 44 40 46 518DHL DHL 80 80 92 80 88 94 80 92 74 88 84 76 1,008Emery Worldwide EWW/RYN 56 44 66 80 82 86 76 90 66 84 44 40 814Emery Worldwide Postal EWW/RYN 240 212 162 154 154 154 154 154 - - - - 1,384Empire CFS 198 192 206 172 192 190 176 196 162 178 180 204 2,246Evergreen EIA - - - - - - - - - - - 28 28Federal Express FDX 276 260 322 268 282 268 262 302 276 354 372 310 3,552Kalitta Air CKS - - - - - - - - 2 - - 12 14Kitty Hawk KHA 202 192 158 140 138 104 78 122 40 56 56 44 1,330Mid-Atlantic Freight MDC 42 40 46 40 44 44 40 46 32 44 42 38 498UPS UPS 244 232 246 236 256 246 246 282 92 272 290 368 3,010Cargo Airline Total 2,590 2,392 2,316 2,482 2,684 2,554 2,444 2,660 1,778 2,402 2,266 2,298 28,866GRAND TOTAL 42,208 38,204 42,624 40,626 41,150 40,120 41,378 42,060 32,864 37,784 35,436 37,004 471,458Source: <strong>Phoenix</strong> <strong>Sky</strong> <strong>Harbor</strong> <strong>International</strong> <strong>Airport</strong>, 2001.* Airline Coding Directory, 57th Edition, Effective 12/01/01 through 03/31/02, <strong>International</strong> Air Transport Association* URS Corporation, 2003.W:\12001276_<strong>Phoenix</strong> <strong>Noise</strong>\B-1 Tables\11/30/2004
TABLE B-1-3A List of INM <strong>Aircraft</strong> Types with IATA <strong>Aircraft</strong> Type Codes, FAR Part 36 Stage, and Hush Kit<strong>Phoenix</strong> <strong>Sky</strong> <strong>Harbor</strong> <strong>International</strong> <strong>Airport</strong> Environmental Impact StatementMethodology and Assumptions ReportFAR Part Hush Kit INM <strong>Aircraft</strong>ATA/IATA <strong>Aircraft</strong> Type Codes36 Stage Stage 3 TypeKC135E* 1 707320B717-200 3 717200B737-300 3 737300B737-400 3 737400B737-500 3 737500B737-700 3 737700B737-800/-900 3 737800B747-400 3 747400B767-300 3 767300B777-200 3 777200B720 (see Note 1) 1 720BB727-100 3 Hush Kit 727EM1B727-200 3 Hush Kit 727EM2B737-200 3 Hush Kit 737N17B737-200 3 Hush Kit 737N9B747-100 3 74710QB747-200 3 74720AB747-200 3 74720BB757-200 3 757PWB757-200 3 757RRB767-200 3 767CF6B767-200 3 767JT9A300 3 A300A310 3 A310A319 3 A319A320 3 A320A320 3 A32023A321 3 A32123A340 3 A340A4* N/A A4CBAC111 (see Note 2) 2 BAC111AC50, ASTR, BE18/50/55/58/60/65/76/95,C303/310/320/337/340/401/402/404/414/421, PA23/30/31/32/34/44N/ABEC58PC12* N/A C12C130* 3 C130J:\PHX\<strong>Noise</strong>\Assumptions Report\B-1 Tables\11/30/2004
TABLE B-1-3A List of INM <strong>Aircraft</strong> Types with IATA <strong>Aircraft</strong> Type Codes, FAR Part 36 Stage, and Hush Kit<strong>Phoenix</strong> <strong>Sky</strong> <strong>Harbor</strong> <strong>International</strong> <strong>Airport</strong> Environmental Impact StatementMethodology and Assumptions ReportATA/IATA <strong>Aircraft</strong> Type CodesFAR Part36 StageHush KitStage 3INM <strong>Aircraft</strong>TypeC141* N/A C141AC5* N/A C5ADC9* N/A C9AC650 3 CIT3CL600, FA2000 3 CL600CL64, FA50, CRJ 200 3 CL601C120/150/152/170/172/177/175 N/A CNA172C180/182/185/188/190/195/206/210 N/A CNA206AC680/690/95, BE100/90, C425/441, PA42, MERLIN III N/A CNA441C500/501/525 3 CNA500C750 3 CNA750CVR640, CVLT N/A CVR580DC10 3 DC1010DC10 3 DC1030DC10 3 DC1040DC3, CVR240/340 N/A DC3DC8, DC870 3 DC870DC9 3 Hush Kit DC93LWBE 02/190/200/300/350/99, MU2, PC12/13, JS31, MERLIN IV, C12 N/A DHC6DHC8 3 DHC8EMB120 3 EMB120FA900 3 EMB145F-100 3 F10065F18* N/A F-18FA20 2 FAL20AA1/5, AC112/114, BE17/23, C208/305, DHC1, PA18, BL26 N/A GASEPFBE33/35/36, M20, PA27/28/32/46 N/A GASEPVGII/III 2 GIIBGIV 3 GIVGV 3 GVG1159, F27 2 HS748AWW1124/1125 3 IA1125KC135R* N/A KC135RL-1011 3 L1011J:\PHX\<strong>Noise</strong>\Assumptions Report\B-1 Tables\11/30/2004
TABLE B-1-3A List of INM <strong>Aircraft</strong> Types with IATA <strong>Aircraft</strong> Type Codes, FAR Part 36 Stage, and Hush Kit<strong>Phoenix</strong> <strong>Sky</strong> <strong>Harbor</strong> <strong>International</strong> <strong>Airport</strong> Environmental Impact StatementMethodology and Assumptions ReportATA/IATA <strong>Aircraft</strong> Type CodesFAR Part36 StageHush KitStage 3INM <strong>Aircraft</strong>TypeHS125, LJ24/25/28, SABR40 2 LEAR25LJ31/35/36/45/55/60, L1329, HS125B/C, FA10, BE40 3 LEAR35MD11 3 MD11GEMD80/87 3 MD81MD80/82 3 MD82MD80/83/88 3 MD83C550/551/560, MU3 3 MU3001BE2000 3 SD330T34* N/A T34T37* N/A T37BT38* N/A T-38A* = Military <strong>Aircraft</strong>Note 1: This Boeing 727-015B aircraft is operated by Honeywell <strong>International</strong>, Inc. at PHX.It has an "Experimental Exemption" and is used for engine research and development.Note 2: This BAC-111 aircraft is operated by Select Leasing. It has hushkits that meet Stage 3.Source: Integrated <strong>Noise</strong> Model 6.1J:\PHX\<strong>Noise</strong>\Assumptions Report\B-1 Tables\11/30/2004
TABLE B-1-4IATA Airline Codes and Operators<strong>Phoenix</strong> <strong>Sky</strong> <strong>Harbor</strong> <strong>International</strong> <strong>Airport</strong> Environmental Impact StatementMethodology and Assumptions ReportIATA Codes Operators IATA Codes Airline NamePassenger AirlinesOthersAAE Express Air CMM Canada 3000AAL American COO Corporate AirlinkACA Air Canada CPF Airtechservice LtdAJM Air Jamaica CSK Flightcraft IncAMT American Trans Air CTT Custom Air TransportAMW Mesa Airlines/Air Midwest/USAirways Express CVF Dassault Falcon Jet CorpAMX Aeromexico CYO Air Transport IncASA Alaska Air DST AEX Air IncASH Mesa Airlines EGJ Eagle Jet CharterAWE America West EJA Executive JetBAW British Airways EJM Executive Jet ManagementCOA Continental ELT Elliott Aviation IncCXP/CSO Casino Express ELX UnknownDAL Delta EXA Execaire Aviation LTDDLH Lufthansa FAB First Air LtdFFT Frontier FBD UnknownGLA Great Lake Aviation FLC Finfo Flight Inspectin <strong>Aircraft</strong>MEP Midwest Express GCO Gemini Air CargoNWA Northwest HPJ Hop-A-Jet IncSCX Sun Country HTV UnknownSKW <strong>Sky</strong> West JUD Dep of JusticeSLI Aerolitoral JUS USA Jet AirwaysSWA Southwest KAI Kaiser Air IncTWA TWA KSS Raytheon TravelUAL United LAN LAN ChiliUSA USAirways LHN Express One <strong>International</strong>GRO Allegro LXJ Unknown/Flex Jet?Cargo Airlines NAT North Atlantic Air IncABX ABX Air NJC Nashville Jet ChartersAMF Ameriflight OJF Occitania Jet FleetCCI BAX Global/Capital Cargo <strong>International</strong> Airline OPT Corporate WingsCFS Empire PAT ArmyCKS Kalitta Air/Kitty Hawk Charters PKW Sierra WestDHL DHL PLZ Planet AirwaysEIA Evergreen RCH Air Mobility CommandoEWW/RYN Emery Worldwide RLT Raliant AirlineFDX FedEx ROK National AirlinesKHA Kitty Hawk RTN Raytheon <strong>Aircraft</strong> CompanyMDC Mid-Atlantic Freight SLH Silverhawk AviationUPS UPS SNK Southeast AirlinesUSC AirNet SPA Sierra Pacific AirlinesOthers SPK Diamond AviationAFX Airfreight Express Limited SSV <strong>Sky</strong>service FBOAIP Alpine Aviation STR Astanair-KazakhstanAJI Ameristar Jet Charter SWQ Interstate Equipment Leasing IncATN Air Transport <strong>International</strong> TAG TAG Aviation USABSK Miami Air <strong>International</strong> TDX Tradewinds Airlines (Wrangler Aviation)BYA Berry Aviation Inc TRZ Transmeridian Airlines (Prime Air)CAP Capital Air TSU Contract Air CargoCBT Catalina Flying Boat TWN Avialeasing Aviation CompanyCCP Champion Air UJT Universal jet AviationCCY Cherry Air VBS Avbase Aviation LLCCFP Compania De Aviacion VCM Volare Air CharterCGN Changan Airlines WOA World AirwaysCJY Unknown WST UnknownCLX Cargolux Arilines <strong>International</strong> WTV Western AviatorsNote:BAX Global is operated by Capital Cargo <strong>International</strong>.Kalitta Air is operated by Kitty Hawk Charters.AMW (Air Midwest) is operated by Mesa Airlines.Others are categorised as General Aviation.Source: <strong>Phoenix</strong> <strong>Sky</strong> <strong>Harbor</strong> <strong>International</strong> <strong>Airport</strong>, 2001.Airline Coding Directory, 57th Edition, Effective 12/01/01 through 03/31/02, <strong>International</strong> Air Transport AssociationW:\12001276_<strong>Phoenix</strong> <strong>Noise</strong>\B-1 Tables\11/30/2004
TABLE B-1-5Departure Stage Length Distance in Nautical Miles<strong>Phoenix</strong> <strong>Sky</strong> <strong>Harbor</strong> <strong>International</strong> <strong>Airport</strong> Environmental Impact StatementMethodology and Assumptions ReportStageDistance (NM)1 Less Than 5002 500 - 1,0003 1,000 - 1,5004 1,500 - 2,5005 2,500 - 3,5006 3,500 - 4,5007 Greater Than 4,500Source: Integrated <strong>Noise</strong> Model (INM) 6.1W:\12001276_<strong>Phoenix</strong> <strong>Noise</strong>\B-1 Tables\11/30/2004
TABLE B-1-6Cargo Airline Hub <strong>Airport</strong>s and Distance to PHX<strong>Phoenix</strong> <strong>Sky</strong> <strong>Harbor</strong> <strong>International</strong> <strong>Airport</strong> Environmental Impact StatementMethodology and Assumptions ReportAirline <strong>Airport</strong> City State Stage Length*Airborne Express Airborne Airpark Wilmington OH 3Ameriflight <strong>Phoenix</strong> <strong>Sky</strong> <strong>Harbor</strong> <strong>International</strong> <strong>Airport</strong> <strong>Phoenix</strong> AZ 1BAX Global Orlando <strong>International</strong>/Executive <strong>Airport</strong> Orlando FL 4Empire <strong>Phoenix</strong> <strong>Sky</strong> <strong>Harbor</strong> <strong>International</strong> <strong>Airport</strong> <strong>Phoenix</strong> AZ 1Kalitta Air Willow Run <strong>Airport</strong> Detroit MI 3DHL Cincinnati/Northern Kentucky Int'l <strong>Airport</strong> Cincinnati OH 3Evergreen Oakland <strong>International</strong> <strong>Airport</strong> Oakland CA 2Emery Worldwide Dayton <strong>International</strong> <strong>Airport</strong> Dayton OH 3FedEx Memphis <strong>International</strong> <strong>Airport</strong> Memphis TN 3Kitty Hawk Denver <strong>International</strong> <strong>Airport</strong> Denver CO 2Mid-Atlantic Freight Piemont Triad <strong>International</strong> <strong>Airport</strong> Greensboro NC 4UPS Louisville <strong>International</strong> <strong>Airport</strong> Louisville KY 3US Check Port Columbus <strong>International</strong> <strong>Airport</strong> Columbus OH 3Note:BAX Global is operated by Capital Cargo <strong>International</strong>.Kalitta Air is operated by Kitty Hawk <strong>International</strong>.* Stage length from PHX to destination airport.See Table 5 for desctiption of Stage Lengths.Source: URS Corporation, 2003.W:\12001276_<strong>Phoenix</strong> <strong>Noise</strong>\B-1 Tables\11/30/2004
TABLE B-1-7Destinations and Stage Lengths from PHX<strong>Phoenix</strong> <strong>Sky</strong> <strong>Harbor</strong> <strong>International</strong> <strong>Airport</strong> Environmental Impact StatementMethodology and Assumptions Report<strong>Airport</strong> ID LocationDistance(N Mi.)StageLength* <strong>Airport</strong> ID LocationDistance(N Mi.)StageLength*ABQ Albuquerque 284 1 LIT Little Rock 984 2ACA Acapulco 1197 3 MCI Kansas City 904 2ANC Anchorage 2213 4 MCO Orlando 1601 4ATL Atlanta 1375 3 MDW Midway 1251 3AUS Austin 755 2 MEM Memphis 1094 3BDL Hartford 1917 4 MEX Mexico City 1087 3BHM Birmingham 1260 3 MIA Miami 1709 4BNA Nashville 1255 3 MKE Milwaukee 1266 3BOI Boise 638 2 MSP Minneapolis 1107 3BOS Boston 1992 4 MSY New Orleans 1127 3BUF Buffalo 1656 4 MZT Mazatlan 684 2BUR Burbank 319 1 OAK Oakland 560 2BWI Baltimore 1731 4 OGG Kahului 2467 4CLE Cleveland 1505 4 OKC Oklahoma City 722 2CLT Charlotte 1536 4 OMA Omaha 899 2CMH Columbus 1447 3 ONT Ontario 281 1COS Colorado Springs 478 1 ORD Chicago O'Hare 1248 3CVG Cincinnati 1359 3 PDX Portland 876 2DAY Dayton 1386 3 PHL Philadelphia 1798 4DCA Washington National 1714 4 PIT Pittsburgh 1571 4DEN Denver 522 2 PSP Palm Springs 225 1DFW Dallas Ft. Worth 751 2 PVD Providence 1973 4DSM Des Moines 996 2 PVR Puerto Vallarta 843 2DTW Detroit 1448 3 RDU Raleigh-Durham 1638 4ELP El Paso 300 1 RNO Reno 521 2EWR Newark 1848 4 SAN San Diego 263 1FLL Ft. Lauderdale 1709 4 SAT San Antonio 730 2FRA Frankfurt 4898 7 SDF Louisville 1304 3FWA Fort Wayne 1359 3 SEA Seattle 961 2GDL Guadalajara 901 2 SFO San Francisco 564 2GEG Spokane 887 2 SJC San Jose 539 2GYM Guaymas 331 1 SJD San Jose Cabo 627 2HMO Hermosilla 266 1 SLC Salt Lake City 441 1HNL Honolulu 2530 5 SMF Sacramento 561 2HOU Houston 884 2 SNA Orange County 293 1IAD Washington Dulles 1694 4 STL St. Louis 1093 3IAH Houston 874 2 TPA Tampa 1549 4ICT Wichita 754 2 TUL Tulsa 810 2IND Indianapolis 1289 3 TUS Tucson 95 1ILN Wilmington 1402 3 YVR Vancouver 1068 3JFK New York 1865 4 YYC Calgary 1063 3LAS Las Vegas 221 1 YYZ Toronto 1630 4LAX Los Angels 320 1 ZIH Ixtapa 1104 3LGB Long Beach 307 1 ZLO Manzanillo 943 2LGW London, England 4600 7Note: See Table 5 for list of corresponding INM Stage Lengths.Source: Airline Coding Directory, 57th Edition, Effective 12/01/01 through 03/31/02, Int'l Air Transport Assoc.Great Circle Mapper at http://gc.kls2.com/W:\12001276_<strong>Phoenix</strong> <strong>Noise</strong>\B-1 Tables\11/30/2004
TABLE B-1-82001 Air Carrier Average Daily <strong>Aircraft</strong> Operations Summary<strong>Phoenix</strong> <strong>Sky</strong> <strong>Harbor</strong> <strong>International</strong> <strong>Airport</strong> Environmental Impact StatementMethodology and Assumptions ReportDepartures<strong>Aircraft</strong> Arrivals Stage 1 Stage 2 Stage 3 Stage 4 Stage 5 Stage 6 Stage 7Airline Actual INM Engine Day Night Day Night Day Night Day Night Day Night Day Night Day Night Day Night TotalExpress Air PA31 BEC58P P 0.26 - 0.17 0.09 - - - - - - - - - - - - 0.52C208 GASEPF P 0.42 - 0.25 0.17 - - - - - - - - - - - - 0.84American B737-800 737800 J 0.02 - - - - - 0.02 - - - - - - - - - 0.03B767-300 767300 J 0.02 - - - 0.02 - - - - - - - - - - - 0.03B757-200 757RR J 3.12 0.03 - - 2.46 - 0.69 - - - - - - - - - 6.31F-100 F10065 J 0.02 - - - 0.02 - - - - - - - - - - - 0.03MD80 MD82 J 15.64 2.10 2.92 0.37 7.63 1.62 4.82 0.38 - - - - - - - - 35.49Air Canada B737-200 737N17 J 0.52 0.07 - - - - 0.32 0.02 0.25 - - - - - - - 1.18B767-200 767JT9 J 0.43 - - - - - - - 0.42 0.02 - - - - - - 0.86A319 A319 J 0.22 - - - - - - - 0.22 - - - - - - - 0.45A320 A320 J 0.10 0.01 - - - - - - 0.12 - - - - - - - 0.23Air Jamaica A320 A320 J 0.18 0.05 - - - 0.23 - - - - - - - - - - 0.47American Trans Air B737-800 737800 J 0.21 - - - - - 0.14 0.07 - - - - - - - - 0.41B757-300 757300 J 0.21 0.04 - - - - 0.18 0.07 - - - - - - - - 0.50B727-200 727EM2 J 0.35 0.12 - - - - 0.16 0.30 - - - - - - - - 0.93B757-200 757RR J 1.77 0.62 - - - - 0.91 1.00 0.26 - 0.23 - - - - - 4.79L-1011 L1011 J 0.03 - - - - - 0.03 - - - - - - - - - 0.07Aeromexico MD80/87 MD81 J 0.40 0.21 0.24 - 0.07 0.15 0.15 - - - - - - - - - 1.23MD82 MD82 J 0.76 0.15 0.78 - 0.06 0.06 - - - - - - - - - - 1.82MD83 MD83 J 0.24 0.24 0.34 - 0.03 0.08 0.03 - - - - - - - - - 0.95Alaska Air B737-400 737400 J 2.68 0.67 - - 2.84 0.40 0.12 - - - - - - - - - 6.69B737-700 737700 J 0.46 - - - 0.46 - - - - - - - - - - - 0.92B737-800/-900 737800 J 0.30 0.02 - - 0.29 0.02 - - - - - - - - - - 0.62B737-200 737N17 J 0.02 0.02 - - 0.02 0.02 - - - - - - - - - - 0.07MD80 MD83 J 4.89 1.65 - - 6.11 0.33 0.10 - - - - - - - - - 13.08Mesa Airline CRJ 200 CL601 J 35.14 2.03 34.65 2.52 - - - - - - - - - - - - 74.34B190 DHC6 T 10.59 0.71 10.96 0.34 - - - - - - - - - - - - 22.60DHC8 DHC8 T 32.41 1.55 32.67 1.29 - - - - - - - - - - - - 67.91America West B737-300 737300 J 78.52 5.50 28.35 2.43 45.70 2.43 5.06 0.02 0.03 - - - - - - - 168.04B737-200 737N9 J 26.40 2.09 13.94 1.21 12.26 1.08 - - - - - - - - - - 56.98B757-200 757RR J 12.80 0.93 6.11 0.37 1.20 0.19 1.18 - 4.41 0.26 - - - - - - 27.46A319 A319 J 31.29 1.40 8.68 0.68 7.51 0.42 7.87 0.12 6.92 0.49 - - - - - - 65.38A320 A32023 J 57.16 3.03 16.98 1.84 10.72 1.64 16.07 - 12.43 0.50 - - - - - - 120.36British Airways B747-400 747400 J 0.47 0.02 0.23 - - - - - - - - - - - - 0.25 0.96B777-200 777200 J 0.73 - - - - - - - - - - - - - 0.73 - 1.45Continental Airline B737-300 737300 J 0.83 0.02 - - 0.02 0.02 - - 0.61 0.20 - - - - - - 1.68B737-500 737500 J 0.04 - - - - - - - 0.03 0.01 - - - - - - 0.08B737-700 737700 J 4.20 0.83 - - 0.53 0.02 - - 3.52 0.97 - - - - - - 10.07B737-800 737800 J 2.98 0.24 - - 1.76 0.09 - - 1.37 0.02 - - - - - - 6.45B757-200 757RR J 0.36 0.11 - - 0.34 0.12 - - 0.02 - - - - - - - 0.95MD80 MD82 J 1.65 0.03 - - 1.16 0.50 - - 0.02 - - - - - - - 3.37MD83 MD83 J 0.02 - - - 0.02 - - - - - - - - - - - 0.03Casino Express B737-200 737N17 J 0.37 - 0.37 - - - - - - - - - - - - - 0.75Delta Airline B737-300 737300 J 1.30 0.45 1.19 0.57 - - - - - - - - - - - - 3.51B737-800 737800 J 0.56 - - - - - 0.05 0.13 0.38 - - - - - - - 1.12B767-300 767300 J 1.40 0.03 1.01 0.20 - - 0.05 - 0.17 - - - - - - - 2.86B727-200 727EM2 J 2.75 1.06 0.95 - 0.17 - 1.65 1.03 - - - - - - - - 7.60B757-200 757PW J 8.21 1.13 2.26 0.02 0.25 - 5.51 0.80 0.50 - - - - - - - 18.68B767-200 767CF6 J 0.35 0.25 0.17 - - - 0.42 - - - - - - - - - 1.19MD88 MD83 J 1.64 0.49 - - 1.53 - 0.31 0.24 - 0.05 - - - - - - 4.26Lufthansa A340 A340 J 0.60 - - - - - - - - - - - - - 0.60 - 1.21Frontier B737-300 737300 J 1.93 0.41 - - 2.34 - - - - - - - - - - - 4.68B737-200 737N17 J 0.53 0.05 - - 0.56 0.02 - - - - - - - - - - 1.16A319 A319 J 0.74 - - - 0.74 - - - - - - - - - - - 1.47Great Lakes B190 DHC6 T 1.22 - 1.22 - - - - - - - - - - - - - 2.45Allegro B727-200 727EM2 J 0.15 - 0.15 - - - - - - - - - - - - - 0.29Medwest Express DC9 DC93LW J 0.03 0.02 0.05 - - - - - - - - - - - - - 0.09MD80 MD81 J 0.34 0.01 - - - - 0.36 - - - - - - - - - 0.72MD82 MD82 J 0.10 - - - - - 0.10 - - - - - - - - - 0.20MD83 MD83 J 1.22 - - - - - 1.22 - - - - - - - - - 2.45Northwest Airline B727-200 727EM2 J 0.04 0.06 - - - - 0.04 0.06 - - - - - - - - 0.21B747-200 74720B J 0.02 - - - - - 0.02 - - - - - - - - - 0.05B757-200 757PW J 3.97 0.79 - - - - 4.09 0.67 - - - - - - - - 9.51A319 A319 J 0.55 0.10 - - - - 0.55 0.09 - - - - - - - - 1.29A320 A320 J 3.85 0.54 - - - - 3.69 0.70 - - - - - - - - 8.77DC10 DC1040 J 0.98 0.33 - - - - 1.29 0.02 - - - - - - - - 2.60Sun Country B737-800 737800 J 0.40 - - - - - 0.40 - - - - - - - - - 0.79B727-200 727EM2 J 0.54 0.02 - - - - 0.53 0.03 - - - - - - - - 1.12<strong>Sky</strong>west CRJ 200 CL601 J 2.51 0.40 2.87 0.04 - - - - - - - - - - - - 5.81Aerolitoral MERLIN IV DHC6 T 0.04 - 0.04 - - - - - - - - - - - - - 0.09Southwest Airline B737-300 737300 J 97.30 10.89 56.55 7.84 30.57 1.15 10.07 0.03 1.99 - - - - - - - 216.39B737-500 737500 J 14.56 2.72 11.89 1.31 3.26 0.66 0.15 - 0.02 - - - - - - - 34.57B737-700 737700 J 37.50 3.76 14.32 1.39 12.31 0.70 6.39 0.02 6.12 - - - - - - - 82.51B737-200 737N17 J 2.62 0.46 2.09 0.34 0.51 0.08 0.06 - - - - - - - - - 6.16TWA B717-200 717200 J - 0.02 - - - - 0.02 - - - - - - - - - 0.03B757-200 757PW J 1.10 0.51 - - - - 1.36 0.25 - - - - - - - - 3.23MD82 MD82 J 1.35 0.16 - - - - 1.28 0.24 - - - - - - - - 3.03MD83 MD83 J 1.67 0.50 - - - - 1.90 0.27 - - - - - - - - 4.33United Airline B737-300 737300 J 10.76 1.59 1.88 0.37 8.56 1.21 - 0.33 - - - - - - - - 24.71B737-500 737500 J 6.44 0.85 1.41 0.41 4.86 0.60 - - - - - - - - - - 14.58B767-300 767300 J 0.13 - - - - - 0.13 - - - - - - - - - 0.25B727-200 727EM2 J 1.52 0.07 - - 0.02 - 1.38 0.19 - - - - - - - - 3.17B757-200 757PW J 2.40 0.39 0.13 - 0.29 - 2.21 - 0.15 - - - - - - - 5.57B767-200 767JT9 J 0.13 - 0.03 - 0.02 - 0.05 - 0.03 - - - - - - - 0.27A320 A32023 J 2.06 0.02 0.75 0.05 0.18 - 0.21 - 0.88 - - - - - - - 4.14US Airways B757-200 757RR J 1.52 0.75 - - - - - - 1.64 0.63 - - - - - - 4.54A319 A319 J 4.75 0.44 - - - - - - 4.39 0.80 - - - - - - 10.37A320 A320 J 0.42 - - - - - - - 0.38 0.03 - - - - - - 0.83A321 A32123 J 1.00 0.15 - - - - - - 1.14 0.02 - - - - - - 2.31Total 552.40 53.89 256.62 23.82 167.39 13.84 83.33 7.08 48.41 3.99 0.23 - - - 1.33 0.25 1,212.58Engine: J - JetDay: 7:00 a.m. - 10:00 p.m.T - TurbopropNight: 10:00 p.m. - 7:00 a.m.P - PropSource: <strong>Phoenix</strong> <strong>Sky</strong> <strong>Harbor</strong> <strong>International</strong> <strong>Airport</strong>, 2001.URS Corporation, 2003.W:\12001276_<strong>Phoenix</strong> <strong>Noise</strong>\B-1 Tables\11/30/2004
TABLE B-1-92001 Air Cargo Average Daily <strong>Aircraft</strong> Operations Summary<strong>Phoenix</strong> <strong>Sky</strong> <strong>Harbor</strong> <strong>International</strong> <strong>Airport</strong> Environmental Impact StatementMethodology and Assumptions ReportDepartures<strong>Aircraft</strong> Arrivals Stage 1 Stage 2 Stage 3 Stage 4Airline Actual INM Engine Day Night Day Night Day Night Day Night Day Night TotalAirborne Express B767-200 767CF6 J 0.58 0.67 - - - - 0.91 0.34 - - 2.49A300 A300 J - 0.01 - - - - - 0.01 - - 0.03DC9 DC93LW J 0.68 0.66 - - - - 0.89 0.45 - - 2.67Ameriflight PA31 BEC58P P 2.79 0.35 1.15 1.99 - - - - - - 6.27MERLIN III CNA441 T 0.05 0.43 0.15 0.34 - - - - - - 0.97B190, MERLIN IV, BE02 DHC6 T 7.03 1.43 4.45 4.01 - - - - - - 16.92PA32 GASEPV P 2.02 0.01 0.67 1.36 - - - - - - 4.06LJ35 LEAR35 J - 0.52 - 0.52 - - - - - - 1.05BAX Global B727-200 727EM2 J 0.71 - - - - - - - 0.71 - 1.42Empire C208 GASEPF P 3.08 - 2.59 0.48 - - - - - - 6.15Kalitta Air B727-200 727EM2 J 0.01 0.00 - - - - 0.01 0.00 - - 0.02B747-100 74710Q J 0.00 0.00 - - - - 0.00 0.00 - - 0.01HS-125 LEAR35 J 0.00 - 0.00 - - - - - - - 0.00DHL B727-200 727EM2 J 0.42 0.29 0.11 0.24 - - 0.36 - - - 1.43A300 A300 J 0.39 0.26 0.13 0.19 - - 0.33 - - - 1.31DC8 DC870 J - 0.02 0.02 - - - - - - - 0.03Evergreen B747-100 74710Q J 0.01 0.01 - - 0.01 0.02 - - - - 0.04B747-200 74720A J 0.01 - - - 0.01 0.01 - - - - 0.03LJ35 LEAR35 J 0.00 - 0.00 - - - - - - - 0.01Emery Worldwide B727-200 727EM2 J 1.62 0.60 - - - - 1.50 0.72 - - 4.44DC10 DC1010 J 0.23 0.27 0.19 0.07 - - 0.22 0.02 - - 1.00DC8 DC870 J 0.26 0.02 - - - - 0.25 0.02 - - 0.55MD11 MD11GE J 0.02 - - - - - 0.02 - - - 0.04FedEx B727-100 727EM1 J - 0.01 - - - - - 0.01 - - 0.03B727-200 727EM2 J 0.93 1.44 - - - - 1.24 1.14 - - 4.76A300 A300 J 0.53 0.47 - - - - 0.91 0.10 - - 2.01A310 A310 J 0.05 0.01 - - - - 0.05 0.02 - - 0.13DC10 DC1010 J 0.51 0.45 - - - - 0.87 0.09 - - 1.91DC10 DC1030 J 0.19 0.24 - - - - 0.33 0.10 - - 0.86MD11 MD11GE J 0.01 - - - - - 0.01 - - - 0.03Kitty Hawk B727-200 727EM2 J 1.13 0.67 - - 1.11 0.69 - - - - 3.60LJ25 LEAR25 J - 0.01 0.01 - - - - - - - 0.02LJ36 LEAR35 J 0.01 - 0.01 - - - - - - - 0.02Mid-Atlantic Freight C208 GASEPF P 0.67 0.01 0.32 0.36 - - - - - - 1.36UPS B767-300 767300 J 1.21 1.36 0.07 1.13 - - 0.82 0.54 - - 5.13B727-200 727EM2 J - 0.03 - - - - 0.03 - - - 0.06B757-200 757PW J 0.82 0.54 0.01 0.48 0.55 - 0.25 0.07 - - 2.72A300 A300 J 0.06 - - - - - 0.06 - - - 0.11DC8 DC870 J 0.01 0.09 - - - - - 0.10 - - 0.20C208 GASEPF P 0.01 - 0.01 - - - - - - - 0.03US Check LJ35 LEAR35 J 1.14 1.43 0.67 1.91 - - - - - - 5.16Total 27.20 12.35 10.58 13.09 1.67 0.71 9.06 3.73 0.71 - 79.08Engine: J - JetT - TurbopropP - PropDay: 7:00 a.m. - 10:00 p.m.Night: 10:00 p.m. - 7:00 a.m.Source: <strong>Phoenix</strong> <strong>Sky</strong> <strong>Harbor</strong> <strong>International</strong> <strong>Airport</strong>, 2001.URS Corporation, 2003.W:\12001276_<strong>Phoenix</strong> <strong>Noise</strong>\B-1 Tables\11/30/2004
TABLE B-1-102001 General Aviation Average Daily <strong>Aircraft</strong> Operations Summary<strong>Phoenix</strong> <strong>Sky</strong> <strong>Harbor</strong> <strong>International</strong> <strong>Airport</strong> Environmental Impact StatementMethodology and Assumptions ReportDepartures<strong>Aircraft</strong> Arrivals Stage 1 Stage 2 Stage 3 Stage 4 Stage 5 Stage 6 Stage 7Actual INM Engine Day Night Day Night Day Night Day Night Day Night Day Night Day Night Day Night TotalB737-300 737300 J 0.02 0.05 - - - - - - - 0.07 - - - - - - 0.14B737-400 737400 J 0.18 0.11 - - - - - - 0.21 0.08 - - - - - - 0.58B737-800 737700 J 0.02 - - - - - - - - - - - 0.02 - - - 0.05B747-400 747400 J 0.02 - - - - - - - - - - - - - 0.02 - 0.05B767-300 767300 J 0.05 - - - - - - - - - - - - - 0.05 - 0.10B720 720B J 0.24 - - - - - - - - - 0.24 - - - - - 0.48B727-100 727EM1 J 0.10 - - - - - - - 0.07 0.02 - - - - - - 0.19B727-200 727EM2 J 0.28 0.26 - - - - - - - - 0.47 0.07 - - - - 1.09B737-200 737N17 J 0.11 0.03 - - - - - - 0.07 0.07 - - - - - - 0.27B747-200 74720B J 0.02 - - - - - - - - - - - - - 0.02 - 0.05B757-200 757RR J 0.33 0.11 - - - - - - - - 0.35 0.09 - - - - 0.87B767-200 767CF6 J 0.42 0.02 - - - - - - - - - - - - 0.37 0.07 0.89A300 A300 J 0.16 - - - - - - - - - 0.16 - - - - - 0.31A319 A319 J 0.05 - - - - - - - 0.05 - - - - - - - 0.10A320 A320 J 0.04 0.02 - - - - - - - - 0.03 0.03 - - - - 0.12BAC111 BAC111 J 0.07 - - - - - 0.07 - - - - - - - - - 0.14AC50, ASTR,BE18/50/55/58/60/65/76/95,C303/310/320/337/340/401/402/4BEC58P P 19.67 4.29 16.42 7.54 - - - - - - - - - - - - 47.9304/414/421, PA23/30/31/32/34/44C650 CIT3 J 2.06 0.15 1.85 0.36 - - - - - - - - - - - - 4.42CL600, FA2000 CL600 J 1.52 0.05 1.38 0.19 - - - - - - - - - - - - 3.14CL64, FA50 CL601 J 0.84 0.02 0.82 0.05 - - - - - - - - - - - - 1.74C120/150/152/170/172/177/175 CNA172 P 5.00 0.27 4.72 0.55 - - - - - - - - - - - - 10.53C180/182/185/188/190/195/206/2CNA20610P 6.12 0.50 5.94 0.68 - - - - - - - - - - - - 13.24AC680/690/95, BE100/90,C425/441, PA42, Merlin IIICNA441 T 10.14 1.90 10.00 2.04 - - - - - - - - - - - - 24.09C500/501/525 CNA500 J 1.65 0.02 1.56 0.12 - - - - - - - - - - - - 3.36C750 CNA750 J 0.79 0.08 0.80 0.07 - - - - - - - - - - - - 1.74CVR640, CVLT CVR580 T - 0.02 - - - - 0.02 - - - - - - - - - 0.05DC10 DC1030 J 0.51 0.17 - - - - - - - - - - - - 0.51 0.17 1.35DC3, CVR240/340 DC3 P 0.05 0.05 - - - - 0.11 - - - - - - - - - 0.22DC870 DC870 J 0.02 - - - - - - - - - - - - - 0.02 - 0.05DC9 DC93LW J 0.10 - - - - - 0.10 - - - - - - - - - 0.19BE190/200/300/350/99, MU2,PC12/13, Merlin IV, JS31DHC6 T 8.85 1.14 7.65 2.33 - - - - - - - - - - - - 19.98EMB120 EMB120 T 0.83 - 0.28 0.56 - - - - - - - - - - - - 1.67FA900 EMB145 J 0.79 0.08 - - - - - - 0.82 0.05 - - - - - - 1.74FA20 FAL20 J 0.98 0.05 0.91 0.12 - - - - - - - - - - - - 2.05AA1/5, AC112/114, BE17/23,C208/305, DHC1, PA18, BL26GASEPF P 2.55 0.37 1.66 1.26 - - - - - - - - - - - - 5.85GASEPVBE33/35/36, M20, PA27/28/32/46P 9.57 0.96 8.76 1.77 - - - - - - - - - - - - 21.07GII/III GIIB J 1.16 0.12 1.06 0.22 - - - - - - - - - - - - 2.56GIV GIV J 1.71 0.09 1.70 0.10 - - - - - - - - - - - - 3.60GV GV J 0.48 0.03 0.42 0.09 - - - - - - - - - - - - 1.01G1159, F27 HS748A T 0.37 - 0.33 0.04 - - - - - - - - - - - - 0.75WW1124/1125 IA1125 J 0.97 - 0.90 0.07 - - - - - - - - - - - - 1.93HS125, LJ24/25/28, SABR40 LEAR25 J 1.75 0.32 1.69 0.38 - - - - - - - - - - - - 4.13LJ31/35/36/45/55/60, L1329,HS125B/C, FA10, BE40LEAR35 J 7.23 0.69 7.26 0.66 - - - - - - - - - - - - 15.85MD80 MD81 J 0.02 - - - - - 0.02 - - - - - - - - - 0.05C550/551/560, MU3 MU3001 J 5.00 0.29 4.91 0.38 - - - - - - - - - - - - 10.58BE2000 SD330 T 0.04 - 0.04 - - - - - - - - - - - - - 0.07Total 92.90 12.28 81.06 19.58 - - 0.33 - 1.22 0.29 1.25 0.19 0.02 - 1.00 0.24 210.37Engine: J - JetDay: 7:00 a.m. - 10:00 p.m.T - TurbopropNight: 10:00 p.m. - 7:00 a.m.P - PropSource: <strong>Phoenix</strong> <strong>Sky</strong> <strong>Harbor</strong> <strong>International</strong> <strong>Airport</strong>, 2001.URS Corporation, 2003.W:\12001276_<strong>Phoenix</strong> <strong>Noise</strong>\B-1 Tables\11/30/2004
TABLE B-1-112001 Military Average Daily <strong>Aircraft</strong> Operations Summary<strong>Phoenix</strong> <strong>Sky</strong> <strong>Harbor</strong> <strong>International</strong> <strong>Airport</strong> Environmental Impact StatementMethodology and Assumptions ReportDepartures<strong>Aircraft</strong> Arrivals Stage 1 Stage 2 Stage 3 Stage 4 Stage 5 Stage 6 Stage 7Actual INM Engine Day Night Day Night Day Night Day Night Day Night Day Night Day Night Day Night TotalKC135E 707320 J 4.13 0.06 - - - - - - - - - - - - 4.19 - 8.37A4 A4C J 0.05 - 0.05 - - - - - - - - - - - - - 0.10CNA414 BEC58P P 0.05 - 0.05 - - - - - - - - - - - - - 0.10C12 C12 T 0.42 - 0.42 - - - - - - - - - - - - - 0.83C130 C130 T 0.08 - - - 0.08 - - - - - - - - - - - 0.16C141 C141A J 0.31 - 0.31 - - - - - - - - - - - - - 0.62C5 C5A J 0.05 - 0.05 - - - - - - - - - - - - - 0.10DC9 C9A J 0.10 - 0.10 - - - - - - - - - - - - - 0.21CNA650 CIT3 J 0.05 - 0.05 - - - - - - - - - - - - - 0.10CNA210 CNA206 P 0.16 - 0.16 - - - - - - - - - - - - - 0.31BE20 DHC6 T 0.68 - 0.58 0.10 - - - - - - - - - - - - 1.35F18 F-18 J 0.23 - 0.23 - - - - - - - - - - - - - 0.47KC135R KC135R J 0.08 - 0.04 0.04 - - - - - - - - - - - - 0.16LJ35, BE40 LEAR35 J 0.10 - 0.10 - - - - - - - - - - - - - 0.21CNA550/560 MU3001 J 0.13 - 0.13 - - - - - - - - - - - - - 0.26T34 T34 P 0.05 - 0.05 - - - - - - - - - - - - - 0.10T37 T37B J 0.08 - 0.08 - - - - - - - - - - - - - 0.16T38 T-38A J 0.16 - 0.16 - - - - - - - - - - - - - 0.31Total 6.39 0.06 2.05 0.14 0.08 - - - - - - - - - 4.19 - 13.93Engine: J - JetT - TurbopropP - PropDay: 7:00 a.m. - 10:00 p.m.Night: 10:00 p.m. - 7:00 a.m.Source: <strong>Phoenix</strong> <strong>Sky</strong> <strong>Harbor</strong> <strong>International</strong> <strong>Airport</strong>, 2001-2002.URS Corporation, 2003.W:\12001276_<strong>Phoenix</strong> <strong>Noise</strong>\B-1 Tables\11/30/2004
TABLE B-1-12Departure Flight Track Utilization Summary<strong>Phoenix</strong> <strong>Sky</strong> <strong>Harbor</strong> <strong>International</strong> <strong>Airport</strong> Environmental Impact StatementMethodology and Assumptions ReportRunway Track Jet Turboprop Prop07L 07LD1 100% - -07L 07LD2 - 15% -07L 07LD3 - 85% -07L 07LD4 - - 75%07L 07LD5 - - 25%Total 100% 100% 100%25R 25RD1 50% - -25R 25RD2 50% - -25R 25RD3 - 55% -25R 25RD4 - 45% -25R 25RD5 - - 30%25R 25RD6 - - 70%Total 100% 100% 100%07R 07RD1 100% - -07R 07RD2 - 20% -07R 07RD3 - 80% -07R 07RD4 - - 35%07R 07RD5 - - 65%Total 100% 100% 100%25L 25LD1 45% - -25L 25LD2 55% - -25L 25LD3 - 65% -25L 25LD4 - 35% -25L 25LD5 - - 35%25L 25LD6 - - 65%Total 100% 100% 100%08 08D1 40% - -08 08D2 60% 100% 30%08 08D3 - - 45%08 08D4 - - 25%Total 100% 100% 100%26 26D1 40% - -26 26D2 35% 100% -26 26D3 25% - -26 26D4 - - 100%Total 100% 100% 100%Source: <strong>Phoenix</strong> <strong>Sky</strong> <strong>Harbor</strong> <strong>International</strong> <strong>Airport</strong>, 2001.URS Corporation, 2003.W:\12001276_<strong>Phoenix</strong> <strong>Noise</strong>\B-1 Tables\11/30/2004
TABLE B-1-13Arrival Flight Track Utilization Summary<strong>Phoenix</strong> <strong>Sky</strong> <strong>Harbor</strong> <strong>International</strong> <strong>Airport</strong> Environmental Impact StatementMethodology and Assumptions ReportRunway Track Jet Turboprop Prop07L 07LA1 100% 100% 65%07L 07LA2 - - 35%Total 100% 100% 100%25R 25RA1 100% 100% 100%Total 100% 100% 100%07R 07RA1 100% 100% 85%07R 07RA2 - - 15%Total 100% 100% 100%25L 25LA1 100% 100% 60%25L 25LA2 - - 40%Total 100% 100% 100%08 08A1 95% 100% 75%08 08A2 5% - -08 08A3 - - 15%08 08A4 - - 10%Total 100% 100% 100%26 26A1 85% 90% 100%26 26A2 15% 10% -Total 100% 100% 100%Source: <strong>Phoenix</strong> <strong>Sky</strong> <strong>Harbor</strong> <strong>International</strong> <strong>Airport</strong>, 2001.URS Corporation, 2003.W:\12001276_<strong>Phoenix</strong> <strong>Noise</strong>\B-1 Tables\11/30/2004
TABLE B-1-142001 Existing Condition Runway Utilization Summary<strong>Phoenix</strong> <strong>Sky</strong> <strong>Harbor</strong> <strong>International</strong> <strong>Airport</strong> Environmental Impact StatementMethodology and Assumptions ReportAir CarrierArrivalDepartureJet Prop Turboprop Jet Prop TurbopropRunway Day Night Day Night Day Night Day Night Day Night Day Night7L 5% 19% 0% 0% 1% 5% 47% 52% 5% 40% 18% 31%25R 9% 30% 0% 0% 4% 1% 48% 30% 0% 0% 23% 45%7R 18% 15% 34% 0% 10% 14% 1% 2% 53% 60% 2% 2%25L 15% 8% 26% 0% 9% 3% 0% 1% 0% 0% 0% 0%8 25% 15% 23% 0% 40% 67% 2% 7% 32% 0% 27% 12%26 28% 13% 17% 0% 35% 9% 3% 9% 11% 0% 30% 11%Total 100% 100% 100% 0% 100% 100% 100% 100% 100% 100% 100% 100%CargoArrivalDepartureJet Prop Turboprop Jet Prop TurbopropRunway Day Night Day Night Day Night Day Night Day Night Day Night7L 7% 40% 3% 4% 1% 72% 33% 49% 23% 46% 29% 30%25R 19% 30% 9% 8% 5% 4% 45% 26% 3% 6% 24% 11%7R 26% 21% 16% 20% 14% 14% 11% 17% 39% 16% 17% 44%25L 37% 8% 39% 20% 43% 1% 9% 6% 13% 3% 5% 8%8 3% 1% 9% 28% 13% 8% 0% 0% 15% 26% 10% 1%26 7% 1% 24% 20% 23% 1% 2% 2% 7% 4% 15% 4%Total 100% 100% 100% 100% 100% 100% 100% 100% 100% 100% 100% 100%General AviationArrivalDepartureJet Prop Turboprop Jet Prop TurbopropRunway Day Night Day Night Day Night Day Night Day Night Day Night7L 2% 18% 3% 17% 1% 12% 22% 27% 14% 40% 11% 25%25R 4% 15% 6% 26% 3% 25% 25% 20% 14% 11% 8% 10%7R 20% 24% 22% 24% 18% 11% 13% 14% 16% 23% 16% 27%25L 18% 16% 25% 15% 20% 6% 11% 12% 18% 9% 14% 6%8 26% 12% 20% 10% 25% 20% 20% 16% 23% 13% 23% 22%26 30% 17% 23% 8% 32% 26% 9% 11% 16% 3% 28% 10%Total 100% 100% 100% 100% 100% 100% 100% 100% 100% 100% 100% 100%MilitaryArrivalDepartureJet Prop Turboprop Jet Prop TurbopropRunway Day Night Day Night Day Night Day Night Day Night Day Night7L 11% 0% 0% 0% 0% 0% 36% 100% 0% 0% 15% 0%25R 7% 0% 0% 0% 0% 0% 40% 0% 50% 0% 25% 0%7R 34% 100% 0% 0% 10% 0% 13% 0% 0% 0% 10% 0%25L 36% 0% 0% 0% 5% 0% 4% 0% 0% 0% 0% 0%8 4% 0% 0% 0% 35% 0% 6% 0% 50% 0% 45% 50%26 9% 0% 100% 0% 50% 0% 2% 0% 0% 0% 5% 50%Total 100% 100% 100% 0% 100% 0% 100% 100% 100% 0% 100% 100%Source: <strong>Phoenix</strong> <strong>Sky</strong> <strong>Harbor</strong> <strong>International</strong> <strong>Airport</strong>, 2001.URS Corporation, 2003.W:\12001276_<strong>Phoenix</strong> <strong>Noise</strong>\B-1 Tables\11/30/2004
TABLE B-1-152001 Normalized Condition Runway Utilization Summary<strong>Phoenix</strong> <strong>Sky</strong> <strong>Harbor</strong> <strong>International</strong> <strong>Airport</strong> Environmental Impact StatementMethodology and Assumptions ReportAir CarrierArrivalDepartureJet Prop Turboprop Jet Prop TurbopropRunway Day Night Day Night Day Night Day Night Day Night Day Night7L 4% 12% 18% 100% 1% 2% 37% 43% 38% 0% 16% 8%25R 10% 33% 18% 0% 5% 2% 56% 23% 24% 0% 28% 39%7R 13% 11% 29% 0% 10% 18% 0% 2% 0% 0% 1% 0%25L 16% 7% 35% 0% 10% 0% 0% 1% 0% 0% 0% 0%8 22% 19% 0% 0% 32% 72% 2% 11% 14% 0% 20% 8%26 35% 18% 0% 0% 41% 6% 4% 20% 24% 0% 34% 44%Total 100% 100% 100% 100% 100% 100% 100% 100% 100% 0% 100% 100%CargoArrivalDepartureJet Prop Turboprop Jet Prop TurbopropRunway Day Night Day Night Day Night Day Night Day Night Day Night7L 5% 32% 0% 4% 0% 58% 18% 42% 15% 28% 20% 21%25R 23% 32% 10% 4% 8% 6% 58% 26% 3% 5% 35% 9%7R 14% 21% 7% 8% 6% 15% 10% 20% 34% 10% 8% 52%25L 44% 10% 43% 8% 51% 1% 13% 9% 14% 1% 9% 8%8 4% 3% 4% 15% 8% 18% 0% 1% 27% 49% 9% 2%26 10% 1% 36% 62% 27% 3% 1% 3% 7% 7% 20% 8%Total 100% 100% 100% 100% 100% 100% 100% 100% 100% 100% 100% 100%General AviationArrivalDepartureJet Prop Turboprop Jet Prop TurbopropRunway Day Night Day Night Day Night Day Night Day Night Day Night7L 2% 8% 2% 9% 0% 7% 13% 21% 10% 32% 7% 15%25R 5% 16% 7% 24% 3% 16% 30% 9% 16% 8% 10% 7%7R 15% 20% 20% 23% 15% 6% 11% 11% 14% 28% 13% 24%25L 22% 12% 33% 15% 25% 5% 15% 13% 24% 11% 19% 6%8 20% 19% 13% 12% 18% 29% 19% 29% 18% 14% 17% 32%26 36% 25% 26% 16% 39% 37% 11% 18% 17% 7% 34% 15%Total 100% 100% 100% 100% 100% 100% 100% 100% 100% 100% 100% 100%MilitaryArrivalDepartureJet Prop Turboprop Jet Prop TurbopropRunway Day Night Day Night Day Night Day Night Day Night Day Night7L 2% 0% 0% 0% 0% 0% 31% 50% 0% 0% 3% 0%25R 8% 25% 0% 0% 3% 0% 46% 0% 100% 0% 28% 0%7R 17% 25% 0% 0% 15% 0% 7% 0% 0% 0% 14% 0%25L 48% 0% 0% 0% 3% 0% 7% 0% 0% 0% 0% 0%8 6% 0% 0% 0% 26% 0% 5% 0% 0% 0% 44% 67%26 19% 50% 100% 0% 53% 100% 3% 50% 0% 0% 11% 33%Total 100% 100% 100% 0% 100% 100% 100% 100% 100% 0% 100% 100%Source: <strong>Phoenix</strong> <strong>Sky</strong> <strong>Harbor</strong> <strong>International</strong> <strong>Airport</strong>, 2001.URS Corporation, 2003.W:\12001276_<strong>Phoenix</strong> <strong>Noise</strong>\B-1 Tables\11/30/2004
These flight tracks were assumedas being other than Jet <strong>Aircraft</strong>.25RD107LD125RD2LEGENDSTREETWATERHIGHWAYRAILROADFLIGHT TRACKRADAR TRACKGENERALIZED STUDY AREAPHOENIX SKY HARBORINTERNATIONAL AIRPORTFIGURE B-1-1RUNWAY 7L/25R JETDEPARTURE FLIGHT TRACKS1"=12,000'
07LD225RD307LD325RD4LEGENDSTREETWATERHIGHWAYRAILROADFLIGHT TRACKRADAR TRACKGENERALIZED STUDY AREAPHOENIX SKY HARBORINTERNATIONAL AIRPORTFIGURE B-1-2RUNWAY 7L/25R TURBOPROPDEPARTURE FLIGHT TRACKS1"=12,000'
25RD507LD425RD607LD5LEGENDSTREETWATERHIGHWAYRAILROADFLIGHT TRACKRADAR TRACKGENERALIZED STUDY AREAPHOENIX SKY HARBORINTERNATIONAL AIRPORTFIGURE B-1-3RUNWAY 7L/25R PROPDEPARTURE FLIGHT TRACKS1"=12,000'
These flight tracks were assumedas being other than Jet <strong>Aircraft</strong>.25LD107RD125LD2LEGENDSTREETWATERHIGHWAYRAILROADFLIGHT TRACKRADAR TRACKGENERALIZED STUDY AREAPHOENIX SKY HARBORINTERNATIONAL AIRPORTFIGURE B-1-4RUNWAY 7R/25L JETDEPARTURE FLIGHT TRACKS1"=12,000'
25LD307RD207RD325LD4LEGENDSTREETWATERHIGHWAYRAILROADFLIGHT TRACKRADAR TRACKGENERALIZED STUDY AREAPHOENIX SKY HARBORINTERNATIONAL AIRPORTFIGURE B-1-5RUNWAY 7R/25L TURBOPROPDEPARTURE FLIGHT TRACKS1"=12,000'
25LD507RD425LD607RD5LEGENDSTREETWATERHIGHWAYRAILROADFLIGHT TRACKRADAR TRACKGENERALIZED STUDY AREAPHOENIX SKY HARBORINTERNATIONAL AIRPORTFIGURE B-1-6RUNWAY 7R/25L PROPDEPARTURE FLIGHT TRACKS1"=12,000'
These flight tracks were assumedas being other than Jet <strong>Aircraft</strong>.26D208D226D108D126D3LEGENDSTREETWATERHIGHWAYRAILROADFLIGHT TRACKRADAR TRACKGENERALIZED STUDY AREAPHOENIX SKY HARBORINTERNATIONAL AIRPORTFIGURE B-1-7RUNWAY 8/26 JETDEPARTURE FLIGHT TRACKS1"=12,000'
26D208D2LEGENDSTREETWATERHIGHWAYRAILROADFLIGHT TRACKRADAR TRACKGENERALIZED STUDY AREAPHOENIX SKY HARBORINTERNATIONAL AIRPORTFIGURE B-1-8RUNWAY 8/26 TURBOPROPDEPARTURE FLIGHT TRACKS1"=12,000'
26D408D308D208D4LEGENDSTREETWATERHIGHWAYRAILROADFLIGHT TRACKRADAR TRACKGENERALIZED STUDY AREAPHOENIX SKY HARBORINTERNATIONAL AIRPORTFIGURE B-1-9RUNWAY 8/26 PROPDEPARTURE FLIGHT TRACKS1"=12,000'
07LA125RA1LEGENDSTREETWATERHIGHWAYRAILROADFLIGHT TRACKRADAR TRACKGENERALIZED STUDY AREAPHOENIX SKY HARBORINTERNATIONAL AIRPORTFIGURE B-1-10RUNWAY 7L/25R JETARRIVAL FLIGHT TRACKS1"=12,000'
07LA125RA1LEGENDSTREETWATERHIGHWAYRAILROADFLIGHT TRACKRADAR TRACKGENERALIZED STUDY AREAPHOENIX SKY HARBORINTERNATIONAL AIRPORTFIGURE B-1-11RUNWAY 7L/25R TURBOPROPARRIVAL FLIGHT TRACKS1"=12,000'
07LA125RA107LA2LEGENDSTREETWATERHIGHWAYRAILROADFLIGHT TRACKRADAR TRACKGENERALIZED STUDY AREAPHOENIX SKY HARBORINTERNATIONAL AIRPORTFIGURE B-1-12RUNWAY 7L/25R PROPARRIVAL FLIGHT TRACKS1"=12,000'
07RA125LA1LEGENDSTREETWATERHIGHWAYRAILROADFLIGHT TRACKRADAR TRACKGENERALIZED STUDY AREAPHOENIX SKY HARBORINTERNATIONAL AIRPORTFIGURE B-1-13RUNWAY 7R/25L JETARRIVAL FLIGHT TRACKS1"=12,000'
07RA125LA1LEGENDSTREETWATERHIGHWAYRAILROADFLIGHT TRACKRADAR TRACKGENERALIZED STUDY AREAPHOENIX SKY HARBORINTERNATIONAL AIRPORTFIGURE B-1-14RUNWAY 7R/25L TURBOPROPARRIVAL FLIGHT TRACKS1"=12,000'
07RA125LA107RA225LA2LEGENDSTREETWATERHIGHWAYRAILROADFLIGHT TRACKRADAR TRACKGENERALIZED STUDY AREAPHOENIX SKY HARBORINTERNATIONAL AIRPORTFIGURE B-1-15RUNWAY 7R/25L PROPARRIVAL FLIGHT TRACKS1"=12,000'
08A126A108A226A2LEGENDSTREETWATERHIGHWAYRAILROADFLIGHT TRACKRADAR TRACKGENERALIZED STUDY AREAPHOENIX SKY HARBORINTERNATIONAL AIRPORTFIGURE B-1-16RUNWAY 8/26 JETARRIVAL FLIGHT TRACKS1"=12,000'
08A126A126A2LEGENDSTREETWATERHIGHWAYRAILROADFLIGHT TRACKRADAR TRACKGENERALIZED STUDY AREAPHOENIX SKY HARBORINTERNATIONAL AIRPORTFIGURE B-1-17RUNWAY 8/26 TURBOPROPARRIVAL FLIGHT TRACKS1"=12,000'
08A308A126A108A4LEGENDSTREETWATERHIGHWAYRAILROADFLIGHT TRACKRADAR TRACKGENERALIZED STUDY AREAPHOENIX SKY HARBORINTERNATIONAL AIRPORTFIGURE B-1-18RUNWAY 8/26 PROPARRIVAL FLIGHT TRACKS1"=12,000'
FIGURE B-1-192001 Existing Condition East/West Flow Percentages<strong>Phoenix</strong> <strong>Sky</strong> <strong>Harbor</strong> <strong>International</strong> <strong>Airport</strong>Environmental Impact StatementDaytime47%82653%50%7L25R50%7R25LNighttime54%82646%7L25R35% 65%7R25LNotes: 1. % Utilization of all aircraft types from TAMIS data recorded in CY2001.2. % rounded to nearest number.3. Daytime = 7AM – 10 PM, Nighttime = 10PM – 7AMArrival percentages add up to 100%.Departure percentages add up to 100%.Source: <strong>Phoenix</strong> <strong>Sky</strong> <strong>Harbor</strong> <strong>International</strong> <strong>Airport</strong>, 2001.
FIGURE B-1-202001 Normalized Condition East/West Flow Percentages<strong>Phoenix</strong> <strong>Sky</strong> <strong>Harbor</strong> <strong>International</strong> <strong>Airport</strong>Environmental Impact StatementDaytime37%82663%60%7L25R40%7R25LNighttime48%82652%7L25R38% 62%7R25LNotes: 1. % Utilization of all aircraft types from TAMIS data recorded in CY2001.2. % rounded to nearest number.3. Daytime = 7AM – 10 PM, Nighttime = 10PM – 7AMArrival percentages add up to 100%.Departure percentages add up to 100%.Source: <strong>Phoenix</strong> <strong>Sky</strong> <strong>Harbor</strong> <strong>International</strong> <strong>Airport</strong>, 2001.
2.0 2015 FUTURE CONDITION2.1 INTRODUCTIONThis section describes the methodology and assumptions to prepare for the 2015 Future Conditionaircraft noise exposure contours for the operation at the <strong>Phoenix</strong> <strong>Sky</strong> <strong>Harbor</strong> <strong>International</strong> <strong>Airport</strong> (PHX).This aircraft noise analysis is based on the 2001 Existing Condition and Aviation Demand Forecastsprovided by Leigh Fisher Associates.2.1.1 METHODOLOGYTo estimate future noise levels at PHX, the same methodology of the 2001 Existing Condition was usedto develop 2015 Future Condition noise contours (See Section 1.1.1 Methodology).2.1.2 DATA SOURCESThe data collected and developed for the 2001 Existing Condition is the basis of the 2015 FutureCondition. In addition, the following sources were reviewed for the future condition aircraft activity datadevelopment.• Aviation Demand Forecasts by Leigh Fisher Associates• World Airline Fleets 2002 – World Airline Reports July 2003• North America Airlines Handbook – 2 nd Edition• Boeing and Airbus fleet order data – http://surf.to/orders2.2 AIRCRAFT OPERATIONS AND FLEET MIX<strong>Airport</strong> operational factors that can significantly affected overall noise levels, as described by DNL,include the total number of operations, aircraft fleet mix, and the time of day when aircraft operationsoccur. The following paragraphs describe these factors in more detail.2.2.1 NUMBER OF AIRCRAFT DEPARTURES AND ARRIVALSThe Aviation Demand Forecasts were prepared by Leigh Fisher Associates and approved by the FAA in2003. It provides the projected number of aircraft operations in 2015 by operational category and aircraftbody type. According to the forecast, 670,000 operations are projected to occur in 2015 (an increase of116,670 operations when compared to the 2001 existing condition).Table B-1-16 provides a summary of the 2015 aircraft operations by operational category derived fromthe Aviation Demand Forecasts.W:\12001277_PHOENIX EIS\APPENDICES\APP B\B-1\APP B-1.DOC\11/30/048 <strong>Phoenix</strong> <strong>Sky</strong> <strong>Harbor</strong> <strong>International</strong> <strong>Airport</strong><strong>Noise</strong> Exposure Methodology and Assumptions
2.2.2 AIRCRAFT TYPESThe most significant change projected to occur between the 2001 existing condition and the 2015 futurecondition is the air carrier fleet mix. Currently, air carriers have retired older aircraft types due to lessdemand and high maintenance cost. Benefits and advantages of replacing older and noisier aircraft withnewer and quieter aircraft are lower maintenance costs, lower fuel costs, increased operational efficiency,and less noise impact.The air carrier fleet mix assumptions are based on the age of the aircraft type, each airline’s aircraftphase-out and order schedule obtained from North America Airlines Handbook – 2 nd Edition, World AirlineFleets 2002 – World Airline Reports July 2003, and http://surf.to/orders. All three of these sourcesindicate aircraft order schedules by air carriers.Table B-1-17 presents replacement and retirement of air carrier aircraft types from 2001 to 2015. Ingeneral, it was assumed that the airlines operating at PHX in 2001 would still be in service in 2015.However, Passenger and Activity Worksheets and Table B-1-2 (See Section 1.1.2, Data Sources)indicated that Air Jamaica and Allegro terminated their services at PHX at the end of 2001. AmericanAirlines took over TWA’s operations at PHX since December 2001. Thus, these three airlines were notincluded the fleet mix assumptions for 2015.As Table B-1-17 shows, older Boeing 727s and 737s would be phased out or replaced with newer aircrafttypes by 2015. Currently, most of the regional air carriers are replacing turbo-prop aircraft with regionaljet, such as the Canadair Regional Jet and Embraer Jet.A telephone interview was conducted to verify Casino Express’ Boeing 737-200 replacement schedule.The carrier has decided to replace Boeing 737-200 with either Boeing 737-300 or –500 in next two years.For the purposes of noise analysis, it was conservative to use Boeing 737-300 because it is louderaircraft than Boeing 737-500.Air Cargo and General Aviation fleet mix were remained unchanged from the 2001 Existing Condition.The assumptions and reasons why there are no changes in fleet mix in the 2015 Future Condition weredescribed in below.• Air cargo and general aviation aircraft are not operated as frequently as air carriers’.Thus, the useful life of air cargo and general aviation aircraft are generally longerthan for air carriers.• It could be assumed that a natural evolution of new general aviation and/or cargoaircraft would occur, but to be conservative, existing fleet mix would be appropriate toproject future noise exposure.• Future plans to upgrade or replace aircraft are unknown.Louder and older aircraft might be replaced with newer and quieter aircraft in the future. However, itwould be conservative to keep fleet mix as it was in 2001 to produce the worst case scenario noisecontours.W:\12001277_PHOENIX EIS\APPENDICES\APP B\B-1\APP B-1.DOC\11/30/049 <strong>Phoenix</strong> <strong>Sky</strong> <strong>Harbor</strong> <strong>International</strong> <strong>Airport</strong><strong>Noise</strong> Exposure Methodology and Assumptions
According to the airport, the Arizona Air National Guard (Az ANG) will be replacing their existing KC-135swith the KC-135R model in October 2004. This aircraft will equip the CFM-56 engine. In the 2001existing condition, there were KC-135E which were substituted to 707320 in the INM. All of them werereplaced with KC-135R in the 2015 future condition.2.2.3 AVERAGE ANNUAL DAY OPERATIONSTables B-1-18 through B-1-21 provide the detailed average daily operations by aircraft type, stagelength, and time of day for air carrier, air cargo, general aviation, and military operations at PHX. Thesetables will be the basis of the INM input for 2015 future condition.It should be noted that time of day and aircraft profiles described in Sections 1.2.3 and 1.2.4 would notchange in 2015 future condition.2.3 FLIGHT TRACKS AND RUNWAY UTILIZATIONThis EIS is for the west terminal development. It does not include any changes to the current runway.Therefore, no modifications are anticipated to runway utilization in the 2015 future condition. However,an update was made to flight tracks due to the suspension of the Runway 25L Side Step Procedure. Acategorical exclusion was conducted to identify the noise benefits of the side-step procedure. The resultof the analyses indicated that the noise levels associated with a straight-in approach versus a side-stepapproach are not significant and likely unnoticeable to the human ear. Thus, as of March 27, 2002, theside-step procedure was suspended and replaced with a straight-in visual approach to Runway 25L.Figures B-1-13, B-1-14, and B-1-15 were replaced with Figures B-1-21, B-1-22, and B-1-23,respectively, to identify the straight-in approach for the 2015 Future Condition. The categorical exclusiondocument is included in <strong>Appendix</strong> B-3.As stated in Section 1.3.2, two runway utilization rates were established for the 2001 existing condition. Itwas assumed that the year 2015 would have typical aircraft activities throughout the year. Thus, the2001 Normalized Condition runway utilization was used for the 2015 Future Condition noise modeling.Table B-1-15 provides the runway utilization for air carriers, cargo, general aviation, and military aircraftoperations by aircraft category and day/night. Figure B-1-20 illustrates percentages for East and Westflow for each runway during daytime and nighttime periods.Figures B-1-1 through B-1-12, B-1-16 through B-1-18, and B-1-21 through B-1-23 depict the departureand arrival flight tracks by runway ends and aircraft categories. Tables B-1-12 and B-1-13 show detailedinformation regarding departure and arrival flight track utilization by jet, turboprop, and prop aircraft.W:\12001277_PHOENIX EIS\APPENDICES\APP B\B-1\APP B-1.DOC\10/25/0510 <strong>Phoenix</strong> <strong>Sky</strong> <strong>Harbor</strong> <strong>International</strong> <strong>Airport</strong><strong>Noise</strong> Exposure Methodology and Assumptions
TABLE B-1-162015 Future Condition Annual <strong>Aircraft</strong> Operations Summary<strong>Phoenix</strong> <strong>Sky</strong> <strong>Harbor</strong> <strong>International</strong> <strong>Airport</strong> Environmental Impact StatementMethodology and Assumptions ReportOperationalCategory Body Type <strong>Aircraft</strong> Type Annual OperationsAir Carrier Widebody B747-400, B767-200/-300, B777-200, A340 13,568Boeing 757 B757-200 40,693Narrowbody B717-200, B737-500/-700/-800, A319, A320 388,688Regional Jet Embraer 135, CRJ200 105,850Turboprop Beech 1900, Cessna 421 23,200Total 572,000Cargo Widebody B767-200/-300, A300, A310, DC10, MD11 1,400Boeing 757 B757-200 2,800Narrowbody B727-200, B737-300, A320, DC8, DC9 8,400Regional Jet Lear Jet 35 4,600Turboprop Cessna 208, Piper 28/32, Beech 1900, SW3 12,800Total 30,000General Aviation 63,000Military 5,000Grand Total 670,000Source: Leigh Fisher Associates, 2003.URS Corporation, 2003.w:\12001277_<strong>Phoenix</strong> EIS\B-1 Future Tables\11/30/2004
TABLE B-1-172015 Future Condition Air Carrier's <strong>Aircraft</strong> Replacement / Retirement Summary<strong>Phoenix</strong> <strong>Sky</strong> <strong>Harbor</strong> <strong>International</strong> <strong>Airport</strong> Environmental Impact StatementMethodology and Assumptions ReportAirline Name2001 Existing ConditionActual <strong>Aircraft</strong> Type2001 Existing ConditionINM <strong>Aircraft</strong> Type2015 Future ConditionINM <strong>Aircraft</strong> TypeAeromexico MD80 MD81 737700MD82 MD82 737700MD83 MD83 737700Air Canada A319 A319 A319A320 A320 A320B732 737N17 RetiredB762 767JT9 767JT9Air Jamaica A320 A320 Out of Service at PHXAlaska Air B734 737400 737700B737/9 737700 737800MD80 MD83 737800Allegro B722 727EM2 Out of Service at PHXAmerica West A319 A319 A319A320 A32023 A32023B733 737300 RetiredB73Q 737N9 RetiredB752 757RR 757RRAmerican 737 737700 737700B752 757RR 757RRB763 767300 767300F100 F10065 737700MD80 MD82 737700American Eagle E135 CL600 CL600American Trans Air B738 737700 737800B722 727EM2 737800B752 757RR 757RRL1011 L1011 RetiredArizona Express C421 BEC58P BEC58PBritish Airways B772 777200 777200Casino Express B73Q 737N17 737500Continental B733 737300 737700B735 737500 737700B737/8/9 737700 737800B752 757RR 757RRMD80 MD81 RetiredMD82 MD82 RetiredMD83 MD83 RetiredDelta B72Q 727EM2 737700B733 737300 737700B738 737700 737800B752 757PW 757PWB762 767CF6 767CF6B763 767300 767300MD80 MD83 RetiredMD90 MD9025 RetiredFrontier A319 A319 A319B733 737300 RetiredB73Q 737N17 Retiredw:12001277\<strong>Phoenix</strong> EIS\B-1 Future Tables\11/30/2004
TABLE B-1-172015 Future Condition Air Carrier's <strong>Aircraft</strong> Replacement / Retirement Summary<strong>Phoenix</strong> <strong>Sky</strong> <strong>Harbor</strong> <strong>International</strong> <strong>Airport</strong> Environmental Impact StatementMethodology and Assumptions ReportAirline Name2001 Existing ConditionActual <strong>Aircraft</strong> Type2001 Existing ConditionINM <strong>Aircraft</strong> Type2015 Future ConditionINM <strong>Aircraft</strong> TypeGreat Lake Aviation B190 DHC6 DHC6Lufthansa A342 A340 A340B742 74720B 747400Mesa/Air Midwest CRJ2 CL601 CL601DB8B DHC8 CL601B190 DHC6 CL601Midwest Express MD81 MD81 717200MD82 MD82 717200MD88 MD83 717200Northwest A319 A319 A319A320 A320 A320B72Q 727EM2 RetiredB752 757PW 757PWDC10 DC1040 Retired<strong>Sky</strong> West CRJ2 CL601 CL601Southwest B733 737300 737700B735 737500 737700B737 737700 737700B73Q 737N17 737700Sun Country B72Q 727EM2 737800B738 737700 737800TWA B717 717200 American Airline AcquiredB752 757PW American Airline AcquiredMD82 MD82 American Airline AcquiredMD83 MD83 American Airline AcquiredUnited A319 A319 A319A320 A32023 A32023B722 727EM2 RetiredB733 737300 RetiredB735 737500 RetiredB752 757PW 757PWB763 767300 767300USAirways A319 A319 A319A320/1 A320 A320B752 757RR 757RRF100 F10065 RetiredSource:World Airline Fleets 2002 – World Airline Reports July 2003North America Airlines Handbook – 2 nd Editionhttp://surf.to/ordersURS Corporation, 2003.w:12001277\<strong>Phoenix</strong> EIS\B-1 Future Tables\11/30/2004
TABLE B-1-182015 Future Condition Air Carrier Average Daily <strong>Aircraft</strong> Operations Summary<strong>Phoenix</strong> <strong>Sky</strong> <strong>Harbor</strong> <strong>International</strong> <strong>Airport</strong> Environmental Impact StatementMethodology and Assumptions ReportINMDepartures<strong>Aircraft</strong> Arrivals Stage 1 Stage 2 Stage 3 Stage 4 Stage 5 Stage 7Type Engine Day Night Day Night Day Night Day Night Day Night Day Night Day Night Total717200 J 2.81 0.05 - - - - 2.86 - - - - - - - 5.71737300 J 0.13 - 0.13 - - - - - - - - - - - 0.26737700 J 281.80 34.77 142.83 17.44 90.53 6.61 40.97 2.58 15.30 0.30 - - - - 633.13737800 J 24.83 3.06 - - 15.21 0.94 1.70 0.42 8.10 1.52 - - - - 55.79747400 J 0.06 - - - - - - - - - - - 0.06 - 0.12767300 J 8.26 0.38 4.39 1.59 0.09 - 0.85 - 1.72 - - - - - 17.28777200 J 3.68 - - - - - - - - - - - 3.68 - 7.36757PW J 21.70 3.03 1.86 - 1.81 - 17.91 2.76 0.39 - - - - - 49.45757RR J 28.65 2.37 7.89 0.43 8.83 0.64 5.34 1.61 5.78 0.11 0.38 - - - 62.03767CF6 J 2.90 - 1.79 - - - 1.11 - - - - - - - 5.80767JT9 J 1.05 - - - - - - - 1.05 - - - - - 2.11A319 J 67.78 2.36 15.60 0.86 14.66 1.46 16.04 0.34 19.59 1.58 - - - - 140.27A320 J 11.27 1.38 - - - - 5.57 1.01 5.53 0.55 - - - - 25.32A32023 J 99.26 2.96 26.63 2.41 22.93 1.66 28.36 - 20.06 0.16 - - - - 204.42A340 J 2.25 - - - - - - - - - - - 2.25 - 4.50CL600 J 4.02 0.16 3.67 0.51 - - - - - - - - - - 8.35CL601 J 132.55 8.28 136.05 4.77 - - - - - - - - - - 281.65BEC58P P 5.59 0.16 5.75 - - - - - - - - - - - 11.50DHC6 T 26.03 - 26.03 - - - - - - - - - - - 52.06Total 724.61 58.95 372.62 28.01 154.06 11.31 120.71 8.73 77.51 4.23 0.38 - 5.99 - 1,567.12Engine: J - Jet Day: 7:00 a.m. - 10:00 p.m.T - Turboprop Night: 10:00 p.m. - 7:00 a.m.P - PropSource: Leigh Fisher Associates, 2003.URS Corporation, 2003.w:12001277\<strong>Phoenix</strong> EIS\B-1 Future Tables\11/30/2004
TABLE B-1-192015 Future Condition Air Cargo Average Daily <strong>Aircraft</strong> Operations Summary<strong>Phoenix</strong> <strong>Sky</strong> <strong>Harbor</strong> <strong>International</strong> <strong>Airport</strong> Environmental Impact StatementMethodology and Assumptions ReportINMDepartures<strong>Aircraft</strong> Arrivals Stage 1 Stage 2 Stage 3 Stage 4Type Engine Day Night Day Night Day Night Day Night Day Night Total727EM2 J 5.82 3.34 0.24 0.61 0.87 0.26 3.41 2.49 1.28 - 18.30737300 J - 0.05 - - - - - 0.05 - - 0.11757PW J 2.25 1.59 0.07 1.60 1.02 - 0.78 0.34 0.03 - 7.67767300 J 0.31 0.32 0.01 0.27 0.03 - 0.10 0.07 0.08 0.07 1.25767CF6 J 0.15 0.18 - - - - 0.24 0.09 - - 0.66A300 J 0.19 0.14 - - - - 0.28 0.05 - - 0.66A310 J 0.02 0.01 - - - - 0.02 0.01 - - 0.04A320 J 0.16 0.12 - 0.09 - - 0.18 - - - 0.55BEC58P P 2.55 0.39 1.05 1.89 - - - - - - 5.88CNA441 T 0.05 0.47 0.52 - - - - - - - 1.05DC1010 J 0.27 0.21 0.03 0.03 - - 0.37 0.06 - - 0.97DC1030 J 0.07 0.04 - - - - 0.07 0.04 - - 0.23DC870 J 0.09 0.09 - - 0.02 - 0.04 0.13 - - 0.37DC93LW J 0.95 0.89 - - - - 1.28 0.56 - - 3.68DHC6 T 6.99 1.30 3.98 4.31 - - - - - - 16.58GASEPF P 3.73 - 3.09 0.64 - - - - - - 7.46GASEPV P 2.04 0.02 1.20 0.85 - - - - - - 4.10LEAR35 J 2.38 3.92 1.29 4.70 0.10 0.22 - - - - 12.60MD11GE J 0.01 - - - - - 0.01 - - - 0.03Total 28.01 13.09 11.47 14.99 2.04 0.47 6.78 3.88 1.39 0.07 82.19Engine: J - Jet Day: 7:00 a.m. - 10:00 p.m.T - Turboprop Night: 10:00 p.m. - 7:00 a.m.P - PropSource: Leigh Fisher Associates, 2003.URS Corporation, 2003.w:\12001277\<strong>Phoenix</strong> EIS\B-1 Future Tables\11/30/2004
TABLE B-1-202015 Future Condition General Aviation Average Daily <strong>Aircraft</strong> Operations Summary<strong>Phoenix</strong> <strong>Sky</strong> <strong>Harbor</strong> <strong>International</strong> <strong>Airport</strong> Environmental Impact StatementMethodology and Assumptions ReportINMDepartures<strong>Aircraft</strong> Arrivals Stage 1 Stage 2 Stage 3 Stage 4 Stage 5 Stage 6 Stage 7Type Engine Day Night Day Night Day Night Day Night Day Night Day Night Day Night Day Night Total737300 J - 0.04 - - - - - - - 0.04 - - - - - - 0.08737400 J 0.13 0.08 - - - - - - 0.15 0.07 - - - - - - 0.43737700 J 0.08 - - - - - - - - - - - 0.08 - - - 0.16747400 J 0.02 - - - - - - - - - - - - - 0.02 - 0.04720B J 0.20 - - - - - - - - - 0.20 - - - - - 0.40727EM1 J 0.11 - - - - - - - 0.11 - - - - - - - 0.22727EM2 J 0.43 0.21 - - - - - - - - 0.62 0.02 - - - - 1.28737N17 J 0.15 0.04 - - - - - - 0.12 0.08 - - - - - - 0.3874720B J 0.04 - - - - - - - - - - - - - 0.04 - 0.08757RR J 0.13 0.13 - - - - - - - - 0.19 0.07 - - - - 0.51A300 J 0.61 0.08 - - - - - - - - 0.67 0.02 - - - - 1.38A319 J 0.04 - - - - - - - 0.04 - - - - - - - 0.08A320 J 0.02 - - - - - - - - - 0.02 - - - - - 0.04BEC58P P 17.00 3.69 13.99 6.70 - - - - - - - - - - - - 41.37CIT3 J 1.51 0.04 1.35 0.20 - - - - - - - - - - - - 3.10CL600 J 1.36 0.04 1.23 0.16 - - - - - - - - - - - - 2.79CL601 J 0.87 0.10 0.90 0.06 - - - - - - - - - - - - 1.92CNA172 P 3.14 0.18 2.90 0.42 - - - - - - - - - - - - 6.64CNA206 P 4.56 0.27 4.31 0.52 - - - - - - - - - - - - 9.68CNA20T P 0.06 - 0.06 - - - - - - - - - - - - - 0.12CNA441 T 7.55 2.04 7.76 1.82 - - - - - - - - - - - - 19.17CNA500 J 1.21 0.04 1.20 0.04 - - - - - - - - - - - - 2.49CNA750 J 0.79 0.17 0.87 0.08 - - - - - - - - - - - - 1.90CVR580 T - 0.02 - - - - 0.02 - - - - - - - - - 0.04DC1030 J 0.34 0.14 - - - - - - - - - - - - 0.38 0.10 0.97DC93LW J 0.02 - - - - - 0.02 - - - - - - - - - 0.04DC3 P 0.04 - - - - - 0.04 - - - - - - - - - 0.08DHC6 T 7.61 1.24 6.49 2.36 - - - - - - - - - - - - 17.69EMB120 T 0.87 - 0.14 0.73 - - - - - - - - - - - - 1.74EMB145 J 0.73 0.10 - - - - - - 0.79 0.04 - - - - - - 1.66FAL20 J 0.71 0.02 0.67 0.06 - - - - - - - - - - - - 1.46GASEPF P 3.19 0.41 1.53 2.07 - - - - - - - - - - - - 7.21GASEPV P 6.20 0.77 5.69 1.27 - - - - - - - - - - - - 13.93GIIB J 0.83 - 0.76 0.07 - - - - - - - - - - - - 1.66GIV J 1.07 0.10 1.10 0.06 - - - - - - - - - - - - 2.33GV J 0.35 0.02 0.32 0.05 - - - - - - - - - - - - 0.75HS748A T 0.36 - 0.33 0.04 - - - - - - - - - - - - 0.73IA1125 J 0.66 0.02 0.66 0.02 - - - - - - - - - - - - 1.36LEAR25 J 1.10 0.22 1.12 0.20 - - - - - - - - - - - - 2.65LEAR35 J 6.61 0.57 6.45 0.73 - - - - - - - - - - - - 14.35MD11GE J 0.02 - - - - - - - - - - - - - 0.02 - 0.04MD81 J 0.02 - - - - - 0.02 - - - - - - - - - 0.04MU3001 J 4.47 0.28 4.42 0.33 - - - - - - - - - - - - 9.49SD330 T 0.04 - 0.04 - - - - - - - - - - - - - 0.08SF340 T 0.02 - - - 0.02 - - - - - - - - - - - 0.04Total 75.24 11.06 64.30 18.00 0.02 - 0.10 - 1.20 0.22 1.69 0.11 0.08 - 0.47 0.10 172.60Engine: J - Jet Day: 7:00 a.m. - 10:00 p.m.T - Turboprop Night: 10:00 p.m. - 7:00 a.m.P - PropSource: Leigh Fisher Associates, 2003.URS Corporation, 2003.w:\12001277\<strong>Phoenix</strong> EIS\B-1 Future Tables\11/30/2004
TABLE B-1-212015 Future Condition Military Average Daily <strong>Aircraft</strong> Operations Summary<strong>Phoenix</strong> <strong>Sky</strong> <strong>Harbor</strong> <strong>International</strong> <strong>Airport</strong> Environmental Impact StatementMethodology and Assumptions ReportINMDepartures<strong>Aircraft</strong> Arrivals Stage 1 Stage 2Type Engine Day Night Day Night Day Night TotalA4C J 0.05 - 0.05 - - - 0.10C141A J 0.31 - 0.31 - - - 0.61C5 J 0.05 - 0.05 - - - 0.10C9A J 0.10 - 0.10 - - - 0.20CIT3 J 0.05 - 0.05 - - - 0.10F-18 J 0.23 - 0.23 - - - 0.46KC135R J 4.14 0.06 4.15 0.04 - - 8.38LEAR35 J 0.10 - 0.10 - - - 0.20MU3001 J 0.13 - 0.13 - - - 0.26T37B J 0.08 - 0.08 - - - 0.15T-38A J 0.15 - 0.15 - - - 0.31BEC58P P 0.05 - 0.05 - - - 0.10CNA206 P 0.15 - 0.15 - - - 0.31T34 P 0.05 - 0.05 - - - 0.10C12 T 0.41 - 0.41 - - - 0.82C130 T 0.08 - - - 0.08 - 0.15DHC6 T 0.66 - 0.57 0.09 - - 1.33Total 6.79 0.06 6.64 0.13 0.08 - 13.70Engine: J - Jet Day: 7:00 a.m. - 10:00 p.m.T - Turboprop Night: 10:00 p.m. - 7:00 a.m.P - PropSource: Leigh Fisher Associates, 2003.URS Corporation, 2003.w:\12001277<strong>Phoenix</strong> EIS\B-1 Future Tables\11/30/2004
PHOENIX SKY HARBORINTERNATIONAL AIRPORTAIRCRAFT NOISEPrepared By:APPENDIX B-2
APPENDIX B-2AIRCRAFT NOISEINTRODUCTIONThis appendix describes several aircraft noise terms that are used throughout this EIS, aircraft noise onindividuals and communities, and specific point analysis results.AIRCRAFT NOISE TERMINOLOGYThe Decibel, dB - All sounds come from a sound source: a musical instrument, a voice, an airplane. Theenergy that produces these sounds is transmitted through the air in sound waves, or sound pressures,which impinge on the ear, creating the sound we hear.Logarithms are used to express a ratio of two pressures; the first is the sound source and the second thereference pressure (the quietest sound we can hear). This ratio is referred to as a sound pressure level(SPL), which is expressed in decibels (dB). This logarithmic conversion means that the quietest soundwe can hear has a SPL of 0 dB, while the loudest sounds we can hear have SPLs of about 120 dB. Mostenvironmental sounds have SPLs ranging from 30 to 100 dB.Because decibels are logarithmic, they do not behave like other numbers. For example, if two soundsources each produce 100 dB, when they are operated together they will produce 103 dB, not 200 dB.Four 100 dB sources operating together again double the sound energy, resulting in a total SPL of 106dB, and so on. In addition, if one source is much louder than another, the two sources operating togetherwill produce the same SPL as if the louder source were operating alone. For example, a 100 dB sourceplus an 80 dB source produce 100 dB when operating together. The louder source masks the quieterone.Two useful rules of thumb to remember when comparing SPLs are: (1) most people perceive a 6 to 10 dBincrease in SPL between two noise events to be about a doubling of loudness, and (2) changes in SPL ofless than about 3 dB between two events are not easily detected outside of a laboratory.A-Weighted Decibel, dBA - Frequency, or pitch, is an important characteristic of sound. When analyzingnoise, it is of interest to know how much of the noise is low-, middle-, or high-frequency. This breakdownis important for two reasons. First, human ears are better equipped to hear middle and high frequencies;middle- and high-frequency noises are more annoying. High-frequency noise also produces morehearing loss. Second, engineering solutions to noise problems are different for different frequencyranges. The normal frequency range of hearing for most people extends from about 20 to 15,000 Hertz(Hz). The "A" weighting filter approximates the sensitivity of the human ear and helps in assessing theperceived loudness of various sounds.Maximum A-Weighted <strong>Noise</strong> Level, L max - A-weighted sound levels vary with time. For example, thesound increases as an aircraft approaches, then falls and blends into the background as the aircraftW:\12001277_<strong>Phoenix</strong> EIS\Appendices\App B\B-2\App B-2.doc1<strong>Phoenix</strong> <strong>Sky</strong> <strong>Harbor</strong> <strong>International</strong> <strong>Airport</strong><strong>Aircraft</strong> <strong>Noise</strong>
ecedes into the distance. Because of this variation, it is often convenient to describe a particular noise"event" by its maximum sound level (L max ). For example, the aircraft noise level increases as the aircraftapproaches and then decreases as the aircraft passes by. A lesser ambient A-weighted level is alsomeasurable which is due to the background sounds that dominate before and after the aircraft passes.Note that L max describes only one dimension of an event; it provides no information on the cumulativenoise exposure generated by a sound source. In fact, two events with identical L max may produce verydifferent total exposures. One may be of very short duration, while the other may be much longer.Sound Exposure Level, SEL - The most common measure of cumulative noise exposure for a singleaircraft flyover is the SEL. SEL is a summation of the A-weighted sound energy at a particular locationover the duration of a noise event. The duration is defined as the amount of time the noise eventexceeds background levels. Mathematically, the SEL equation compresses (i.e., totals) this noise energyinto a column one second wide. The height of the column is the SEL, measured in decibels.Because the SEL is normalized to one second, it will almost always be larger in magnitude than the L maxfor the event. In fact, for most aircraft events, the SEL is about 7 to 12 dB higher than the L max . Also, thefact that it is a cumulative measure means that a higher SEL can result from either a louder or longerevent, or some combination.SEL provides a comprehensive way to describe noise events for use in modeling and comparing noiseenvironments. Computer noise models base their computations on these SELs.Day-Night Average Sound Level - The DNL represents noise as it occurs over a 24-hour period. It isthe same as a 24-hour equivalent sound level (Leq), with one important exception: DNL treats nighttimenoise differently from daytime noise. The equivalent sound level is the logarithm of the average value ofthe sound exposure during a stated time period. It is often used to describe sounds with respect to theirpotential for interfering with human activity. In calculating DNL, it is assumed that the A-weighted levelsoccurring at night (10:00 p.m. to 7:00 a.m.) are 10 dB louder than they really are. This penalty is appliedto account for greater sensitivity to nighttime noise and because events at night are often perceived to bemore intrusive.EFFECTS ON AIRCRAFT NOISE ON PEOPLEThis section addresses the primary ways humans can be affected by airport noise: speech interferenceand sleep disturbance.Speech Interference - A primary effect of aircraft noise is its tendency to drown out or "mask" speech,making it difficult to carry on a normal conversation. The sound level of speech decreases as thedistance between a talker and listener increases. As an aircraft approaches and its sound levelincreases, it becomes harder to hear speech. As the background noise level increases, the talker mustraise his/her voice, or the individuals must get closer together to continue talking.For typical communication distances of 3 or 4 feet (1 to 1.5 meters), acceptable outdoor conversationscan be carried on in a normal voice as long as the background noise outdoors is less than about 65 dBA.W:\12001277_<strong>Phoenix</strong> EIS\Appendices\App B\B-2\App B-2.doc2<strong>Phoenix</strong> <strong>Sky</strong> <strong>Harbor</strong> <strong>International</strong> <strong>Airport</strong><strong>Aircraft</strong> <strong>Noise</strong>
If the noise exceeds this level, intelligibility would be lost unless vocal effort was increased orcommunication distance was decreased.Sleep Disturbance - Research on sleep disruption from noise has led to widely varying observations. Inpart, this is because: (1) sleep can be disturbed without causing awakening, (2) the deeper the sleep themore noise it takes to cause arousal, (3) the tendency to awaken increases with age, and (4) otherfactors. In addition, most of the early sleep disturbance studies have been conducted under laboratoryconditions, which minimizes the effect that habituation is believed to have on awakening. A field study ofnoise-induced sleep disturbance was conducted in residents’ homes near Los Angeles <strong>International</strong><strong>Airport</strong> (LAX), Castle Air Force Base (AFB), and control locations (non-aircraft influenced) in the LosAngeles area. The study supports the theory that habituation has a great influence on noise-inducedsleep disturbance. The major findings of the study, which can be applied to long-term residents of areaswith stable nighttime noise exposure, are as follows:• A statistically reliable relationship between SEL and sleep disturbance (within 5minutes of the event) was observed. That is, the higher the SEL, the greater thelikelihood that the resident’s sleep would be disturbed.• Long-term noise exposure metrics, such as DNL, show no useful association withsleep disturbance.• The average spontaneous (non-noise event related) awakening rate wasapproximately two per night, regardless of other noise sources (Fidell et al., August1995).Similar findings were found in a study of sleep disturbance near the Denver <strong>International</strong> <strong>Airport</strong> (DIA)before and after its opening in 1995 (Fidell et al., December 1995). A study in England (Ollerhead et al.,December 1992) found that “very few people living near airports are at risk of any substantial sleepdisturbance due to aircraft noise, even at the highest event noise levels.”Vibration Resulting from <strong>Aircraft</strong> Operations - Generally, fixed-wing subsonic aircraft do not generatevibration levels of the frequency or intensity to result in damage to structures. It has been found thatexposure to normal weather conditions, such as thunder and wind, usually have more potential to result insignificant structural vibration than aircraft (FAA, 1985b). Two studies that involved the measurement ofvibration levels resulting from aircraft operations upon sensitive historic structures concluded that aircraftoperations did not result in significant structural vibration.For an EIS conducted at the Stinson Municipal <strong>Airport</strong> in San Antonio, Texas, vibration measurementswere taken at several historic structures in the airport vicinity. At sites located between 1.1 and 2.5 milesfrom the airport, vibration of historic structures caused by aircraft operations were found to fall far belowthe most stringent structural damage criteria (Raba-Kistner Consultants, 1986).At the Pueblo Grande Museum Culture Park located in <strong>Phoenix</strong>, Arizona, a vibration measurementanalysis was accomplished to identify the source of vibration which appeared to be resulting in structuraldamage to ancient Hohokam Indian ruins located in the park. These ruins, constructed of adobe, arelisted in the National Register of Historic Places and the area is designated as a National HistoricW:\12001277_<strong>Phoenix</strong> EIS\Appendices\App B\B-2\App B-2.doc3<strong>Phoenix</strong> <strong>Sky</strong> <strong>Harbor</strong> <strong>International</strong> <strong>Airport</strong><strong>Aircraft</strong> <strong>Noise</strong>
Landmark. Pueblo Grande is located in the vicinity of busy roadways, a railroad, and within 0.5 mile ofthe longest runway of the <strong>Phoenix</strong> <strong>Sky</strong> <strong>Harbor</strong> <strong>International</strong> <strong>Airport</strong>. The airport is one of the busiest inthe U.S. and serves hundreds of large jet aircraft operations daily, including one of the largest aircraft inthe world, the Boeing 747. The results of the vibration analysis indicated that activities at the <strong>Phoenix</strong><strong>Sky</strong> <strong>Harbor</strong> <strong>International</strong> <strong>Airport</strong> create low or no risk of damage to the adobe ruins from vibration (King,1991).Given the conclusions reached in the studies cited above, significant vibration that has the potential tocause structural damage is not likely to result from the operation of PHX, with or without the airportimprovements.Health Effects - Regarding public health effects, the “Information on Levels of Environmental <strong>Noise</strong>Requisite to Protect Public Health and Welfare with an Adequate Margin of Safety” stated, “At this timethere is insufficient scientific evidence that non-auditory diseases are caused by noise levels lower thanthose that cause noise-induced hearing loss.” That document identified an Leq not exceeding 70 dB (i.e.8 hours per day) over a 40-year period for protection against noise-induced hearing loss (U.S. EPA,1974). In 1981, the National Academy of Sciences, Committee on Hearing, Bioacoustics andBiomechanics (CHABA) was asked by the National Institute for Occupational Safety and Health (NIOSH)to consider research that might be performed to examine the effects on human health from long-termexposure to noise. The CHABA (Working Group 18), in their report, The Effects on Human Health FromLong-Term Exposure to <strong>Noise</strong>, concluded that “evidence from available research is suggestive, but itdoes not provide definitive answers to the question of health effects other than to the auditory system ofthe long-term exposure to noise” (National Academy of Sciences, 1981). Consequently, the issue ofwhether significant non-auditory health effects results from aircraft noise still remains and requiresadditional research.COMMUNITY RESPONSESocial survey data make it clear that individual reactions to noise vary widely for a given noise level.Nevertheless, as a group, people's aggregate response is predictable and relates well to measures ofcumulative noise exposure such as DNL.SPECIFIC POINT ANALYSISSingle point DNL noise exposure analysis was conducted for 169 locations shown on Figures B-2-1 andB-2-2 for 2001 Existing Condition and Figure B-2-3 for 2015 Future Condition within the GeneralizedStudy Area.A detailed listing of the 2001 Existing Condition, 2001 Normalized Condition, and 2015 Future ConditionDNL noise exposure levels for each of the 169 noise-sensitive locations is shown in Table B-2-1.W:\12001277_<strong>Phoenix</strong> EIS\Appendices\App B\B-2\App B-2.doc4<strong>Phoenix</strong> <strong>Sky</strong> <strong>Harbor</strong> <strong>International</strong> <strong>Airport</strong><strong>Aircraft</strong> <strong>Noise</strong>
TABLE B-2-1DNL AT SELECTED SITES2001ExistingCondition DNL2001NormalizedCondition DNL2015 FutureCondition DNLSite # Category Name1 Church First Hispanic Baptist Church 52.7 53.9 54.42 Church First Presbyterian Church 52.7 54.3 54.63 Church Unknown 60.9 61.6 61.84 Church Tonto Church of Christ 61.3 61.7 61.35 Church Unknown 61.2 61.7 61.66 Church New Home Baptist Church 61.1 61.6 61.77 Church Bethel CME 61.0 61.5 61.18 Church Unknown 61.0 61.5 61.39 Church Valley Christian Center 61.0 61.4 61.210 Church Unknown 61.5 61.8 60.711 Church Emmanuel Church Of God-Christ 61.2 61.5 60.612 Church Unknown 61.1 61.5 60.813 Church Unknown 61.1 61.5 60.914 Church Unknown 61.4 61.7 60.515 Church Our Lady Of Fatima 61.5 61.7 60.616 Church Unknown 60.7 61.2 61.117 Church Shiloh Baptist Church 61.8 62.2 61.518 Church Berean Baptist Church 61.8 62.2 61.519 Church Maricopa County Seventh Av 62.4 62.7 61.620 Church Unknown 62.1 62.4 61.321 Church House of Prayer-God In Christ 62.3 62.5 61.422 Church St John Instnl Baptist Church 62.3 62.5 61.423 Church Unknown 61.9 62.2 61.124 Church Unknown 62.7 62.8 61.725 Church Centro Christiano De Alabanca 63.0 63.1 62.126 Church Unknown 62.5 62.5 61.527 Church Lone Star Baptist Church 63.9 63.4 62.828 Church Unknown 63.5 63.0 62.929 Church Unknown 63.8 63.5 63.230 Church Hope Evangelistic Community Center 67.3 67.0 66.031 Church Unknown 62.1 62.6 62.532 Church St. Anthony Catholic Church 62.2 62.8 62.733 Church New World Educational Center 61.6 62.2 62.234 Church Primera Iglesia Metodista 63.2 63.9 64.035 Church Catholic Diocese 54.0 56.0 55.536 Church Unknown 56.0 58.3 57.137 Church Immaculate Heart Church 56.5 58.4 57.838 Church First Institutional Baptist 57.8 59.8 59.039 Church Tanner Chapel 56.6 58.5 57.940 Church Open Door Church 56.0 58.3 57.141 Church Pentecost Church-Jesus Christ 56.3 58.6 57.442 Church Bethlehem Baptist Church 56.3 58.4 57.543 Church Phillips Memorial CME Church 56.6 58.8 57.8W:\12001277_<strong>Phoenix</strong> EIS\Appendices\App B\B-2\App B-2.doc\10/24/20055
TABLE B-2-1 (CONTINUED)DNL AT SELECTED SITES2001ExistingCondition DNL2001NormalizedCondition DNL2015 FutureCondition DNLSite # Category Name44 Church Pilgrim Rest Baptist Church 58.6 60.8 59.645 Church Unknown 57.1 59.0 58.446 Church Unknown 65.1 66.4 65.947 Church Unknown 65.0 65.9 65.848 Church Unknown 67.8 67.8 66.549 Church Unknown 68.7 68.4 67.450 Church Unknown 70.1 69.6 68.651 Church Unknown 70.7 70.2 69.152 Church Unknown 69.8 69.6 68.553 Church Unknown 70.4 70.1 69.054 Church Sacred Heart Parish 66.9 67.3 65.955 Church Mt Zion Baptist Church 68.4 68.6 67.256 Church Greater Friendship Baptist Church 58.2 60.2 59.357 Church Beautiful Savior Lutheran Church 55.6 55.0 56.058 Church Tempe Third Lds Ward 54.8 54.2 55.259 Church Church in Tempe 55.4 54.8 55.960 Church Unknown 61.0 60.4 60.961 Church City Of The Lord Church 58.7 58.1 58.862 Church Unknown 59.6 58.9 59.563 Church First Southern Baptist Church 52.2 51.5 52.864 Church Unknown 52.2 51.6 52.965 Church Arizona State University 57.1 56.5 57.466 Church Newman Center At ASU 57.9 57.2 58.167 Church Alleluia Lutheran Student 54.8 54.1 55.468 Church Arizona State University 53.9 53.3 54.669 Church Arizona State University 54.5 53.8 55.170 Church Tempe Seventh Day Adventist 51.9 51.2 52.571 Church Tempe Friends Meeting-Quaker 50.5 49.8 51.272 Church University Lutheran Church 50.3 49.6 51.073 Church City In The Desert Metro Church 51.8 51.2 52.574 Church Sonrise Faith Community Church 51.3 50.7 52.175 Church Unknown 62.0 62.0 61.676 Church Unknown 54.0 54.1 55.177 Hospital Memorial Hospital 62.5 62.9 61.978 Church Unknown 66.1 66.5 65.179 Park Bolin Memorial Park 54.1 55.2 55.880 Park Carnegie Library Park 54.8 56.0 56.581 Park Patriots Park 55.3 56.8 56.982 Park Central Park 62.7 63.3 63.283 Park Grant Park 62.4 63.1 63.284 Park Harmon Park 63.1 63.4 62.385 Park Alkire Park 61.9 62.0 60.986 Park Nuestro Park 66.7 67.0 65.587 Park University Park 51.8 53.2 53.888 Park University Park 51.9 53.3 53.989 Park University Park 51.9 53.5 53.9W:\12001277_<strong>Phoenix</strong> EIS\Appendices\App B\B-2\App B-2.doc\10/24/20056
TABLE B-2-1 (CONTINUED)DNL AT SELECTED SITES2001ExistingCondition DNL2001NormalizedCondition DNL2015 FutureCondition DNLSite # Category Name90 School Paul Lawrence Dunbar 61.6 62.3 62.491 School Mary McLeod Bethune Elementary 62.0 62.2 61.092 School Tertulia Elementary 61.7 62.3 62.493 School Unknown 62.7 63.0 61.894 School Friendly House Acad Del Pueblo El 67.4 66.6 66.095 School Lowell Elementary 62.6 63.0 62.296 School Faith North Montessori School 55.9 58.0 57.197 School Silvestre S. Herrara 66.0 66.4 65.198 School Friendly House Acad Del Pueblo El 67.3 66.6 66.099 School Augustus H. Shaw, JR. High. 56.6 58.9 57.7100 School Maricopa Skill Center 65.4 65.9 64.9101 School Ann Ott Elementary 70.6 70.2 69.1102 Park Eastlake Park 59.3 61.5 60.2103 Park Barrios Unidos Park 71.2 70.9 69.7104 Park Barrios Unidos Park 71.5 71.2 70.0105 Park Barrios Unidos Park 71.8 71.3 70.2106 Park Green Valley Park 69.2 69.3 67.9107 Park Rio Salado Park 58.0 58.3 58.5108 School Enterprise Academy 61.8 62.5 62.7109 School <strong>Phoenix</strong> Job Corp Center 62.0 63.0 63.0110 School Unknown 61.0 62.2 62.2111 School Unknown 57.1 59.3 58.3112 School Laird School 57.2 57.3 58.3113 School Arizona State University 60.5 60.0 60.6114 School Arizona State University 60.8 60.2 60.8115 School Arizona State University 54.6 53.9 55.2116 School School UNDER CONSTRUCTION 52.0 51.3 52.7117 School Arizona State University 50.8 50.2 51.6118 School Arizona State University 53.9 53.2 54.5119 School Scalessel 55.9 55.2 56.3120 School Scales School 62.5 61.9 62.2121 School Gateway Community College 57.3 58.2 58.0122 School <strong>Phoenix</strong> Academy of Performing Arts 55.1 54.9 55.1123 School University of <strong>Phoenix</strong> 54.5 54.1 54.2124 School Collins College 55.0 54.4 55.3125 School Collins College 54.5 53.9 54.8Pueblo Grande Museum & Cultural61.1126 Park Park 61.1 62.2Pueblo Grande Museum & Cultural63.0127 Park Park 63.0 64.2Pueblo Grande Museum & Cultural68.0128 Park Park 67.4 68.8Pueblo Grande Museum & Cultural69.9129 Park Park 68.6 70.1130 Park Rio Salado Park 66.8 66.5 66.0131 Park Rio Salado Park 70.7 70.0 68.6W:\12001277_<strong>Phoenix</strong> EIS\Appendices\App B\B-2\App B-2.doc\10/24/20057
TABLE B-2-1 (CONTINUED)DNL AT SELECTED SITES2001ExistingCondition DNL2001NormalizedCondition DNL2015 FutureCondition DNLSite # Category Name132 Park Canal Park 57.5 57.8 58.5133 Park Tempe Women’s Club Park 61.2 61.7 62.1134 Park Papago Park 64.4 63.9 63.3135 Park Rio Salado Park 66.0 65.4 64.1136 Park Rio Salado Park 70.9 70.4 69.2137 Park Rio Salado Park 70.3 69.7 68.4138 Park Unknown 67.4 67.0 66.2139 Park Tempe Beach Park 67.6 67.2 66.2140 Park Hayden Butte Park 65.0 64.7 64.5141 Golf Course ASU-Karsten Golf Course 62.5 62.1 62.1142 Golf Course Rio Salado Golf Course 60.0 60.2 60.3143 Park Indian Bend Park 55.1 55.1 56.2144 Golf Course Rio Salado Golf Course 59.9 60.1 60.2145 Golf Course ASU-Karsten Golf Course 63.8 63.4 62.6146 Park Rio Salado Park 65.4 64.8 63.6147 Park Hudson Park 49.8 49.2 50.6148 Park Jaycee Park 62.8 62.2 62.5149 Park Mitchell Park 57.3 56.7 57.6150 Park Birchett Park 52.6 51.9 53.3151 Park Creamery Park 55.2 54.6 55.5152 School Rio Salado College 54.4 53.9 54.1153 School Unknown 62.0 61.4 61.8154 School Unknown 57.5 58.5 57.4155 School Unknown 62.5 62.7 62.5156 Park Unknown 61.1 61.6 61.4157 Hospital Unknown 51.3 50.7 51.8158 School Unknown 61.1 61.5 60.8159 Park Unknown 57.4 57.9 57.4160 Hotel Best Western <strong>Airport</strong> Inn 69.2 69.1 68.7161 Hotel Motel 6 64.2 66.0 64.8162 Hotel Howard Johnson <strong>Phoenix</strong> <strong>Airport</strong> 62.0 63.8 62.7163 Hotel Hilton <strong>Phoenix</strong> <strong>Airport</strong> 71.0 70.5 69.7164 Hotel Courtyard by Marriott <strong>Phoenix</strong> <strong>Airport</strong> 69.3 68.8 68.2165 Hotel Sleep Inn <strong>Airport</strong> 67.4 66.8 66.3166 Hotel Southwest Inn at Eagle Mountain 70.8 70.5 69.7167 Hotel Amerisuites Tempe <strong>Airport</strong> 70.1 69.8 69.1168 Hotel E-Z 8 Motels 68.2 67.6 66.9169 Hotel Pay Less Inn 66.5 66.5 65.3Source: URS Corporation, 2002.W:\12001277_<strong>Phoenix</strong> EIS\Appendices\App B\B-2\App B-2.doc\10/24/20058
c1_516//g:(c1_375-GIS Data 2)\G:\<strong>Phoenix</strong>_eis\Applications\apr\phx_eis.apr{Figure B-2-1 2001 Existing Condition Specific Point Analysis Sites}, LAV, 10/04/04S 19TH AVE# # ## 1 87 88 89 # 2 # 35 96 # 36 40 # 41 # 4279### # 458081111 ## # # # 99 43 56#39 37 # # 10238 44 ### # 110310916## 90 # 108 836# # 34# # # # 479 156 # 5# 92## # #46##1588 33 32# 13 7 31 8211 4 12 23### # ## # 18172077 # #14 10## ## 95#21 ##100159378 97 #91 # # 8486548522 19169## # # 5526 24 2530 48# ## # 52 ##53##1032749 ###101 10498 94# 50.-, 17# 51 105# 28 #106 #29159#107## 162161160 #E MCDOWELL RD(/ 89 ø÷202S 7TH AVE.-, 10 168S CENTRAL AVEE BUCKEYE RDS 7TH STS 16TH STôó51.-, 10E BROADWAY RDS 24TH STE VAN BUREN STE WASHINGTON STE SKY HARBOR BLVDS 32ND STSites657075ø÷143###15476 143121#132##127 126 112##133142 144## #70 # 12865129155 75## #75130134##ø÷202ø÷153131135## 146#136 137### # 145#166# 138 139#14075 163##70 167141#164 ##120 148114 113165# #153 # ## 6062# 61 # 6665149## #151##119 67 115 69# ## # # 11857 #5968# #124 58# #15073 116# # 74#####15212564 70122# 123## #157 63117 147#7172##S 40TH STHospitalChurchSchoolPark/RecreationHotel.-, 10S 48TH STE UNIVERSITY DRS PRIEST DRS MILL AVE2001 Existing Generalized Study AreaDNL Contours Land Use6565 DNLParks and Recreation707070 DNL7575 DNLRoadwaysMajor HighwaysOther RoadsLEGENDRoad Right of Way/PavementSchoolResidentialHotel/Transient ResidentialRiver BottomOthersS RURAL RD<strong>Airport</strong> PropertyBoundaryWNSES MCCLINTOCK DR2000 0 2000 4000 FeetScale: 1" = 4000'2001 Existing ConditionSpecific Point Analysis SitesFIGUREB-2-1
c1_516//g:(c1_375-GIS Data 2)\G:\<strong>Phoenix</strong>_eis\Applications\apr\phx_eis.apr{Figure B-2-2 2001 Normalized Condition Specific Point Analysis Sites}, LAV, 10/04/04S 19TH AVE(/ 89ôó51.-, 10 ø÷202ø÷202.-, 10.-, 10 ø÷143# # ## 1 87 88 89 # 2 # 35 96 # 36 40 # 41 # 42 #### ### 154764514379 80 81### ## 43 56121111 99##13239 37 # # 102#####161## # 16212611238 44127### #3109 110 133142 144#16#6 # 90 # 108 837012865# # 34# # # # 47129155 75## #9 156 # 5# 92## 7# # ### 4##### # ## # # #10 11 1331 32468 3375821301341581214 2318172077## ## 95#### ø÷15322 9378 54# # 84169 86 9710013113515 21####85 91 24 # # 55 146#26 251930 48# ## # 52 #### ##### # #168 #166# ##.-, 17 274953 103 136 137 14598 9450 101 10451 105138 139#163167140# 1417570# ## 28 #106 #164 ## 11329160 #165120 148114# #153 # ## 6062# 61 # 65#66149# #151### ## # #57 #5967 115 6911968 118# #107124 58## #15073 11664# #### 7074125##122# 123 152## #157 6315971 117 147##72##S 7TH AVES CENTRAL AVEE BUCKEYE RDS 7TH STS 16TH STE BROADWAY RDS 24TH STE MCDOWELL RDE VAN BUREN STE WASHINGTON STE SKY HARBOR BLVDS 32ND STSites657075S 40TH STHospitalChurchSchoolPark/RecreationHotelS 48TH STE UNIVERSITY DRS PRIEST DRS MILL AVE2001 Normalized Generalized Study AreaDNL Contours Land Use6565 DNLParks and Recreation707070 DNL7575 DNLRoadwaysMajor HighwaysOther RoadsLEGENDRoad Right of Way/PavementSchoolResidentialHotel/Transient ResidentialRiver BottomOthersS RURAL RD<strong>Airport</strong> PropertyBoundaryWNSES MCCLINTOCK DR2000 0 2000 4000 FeetScale: 1" = 4000'2001 Normalized ConditionSpecific Point Analysis SitesFIGUREB-2-2
c1_516//g:(c1_375-GIS Data 2)\G:\<strong>Phoenix</strong>_eis\Applications\apr\phx_eis.apr{Figure B-2-3 2015 Future Condition Specific Point Analysis Sites}, rpf, 09/19/05S 19TH AVE# # ## 1 87 88 89 # 2 # 35 96 # 36 40 # 41 # 4279### # 458081# 111 ## # # # 99 43 56#39 37 # # 10238 44 #3109## # 11016## 90 # 108 836# # 34# # # # 479 156 # 5# 92## # #46##1588 33 32# 13 7 31 8211 4 12 23### # ## # 18172077 # #14 10## ## 95#21 ##100159378 97 #91 # # 8486548522 19169## # # 5526 24 2530 48# ## # 52 ##53## 1032749 ###101 10498 94# 50.-, 17# 51 105# 28 #106 #29159#107## 162161160 #E MCDOWELL RD(/ 89 ø÷202S 7TH AVE.-, 10 168S CENTRAL AVES 7TH STE BUCKEYE RDS 16TH STôó51.-, 10E BROADWAY RDS 24TH STE VAN BUREN STE WASHINGTON STE SKY HARBOR BLVDS 32ND STø÷143###15476 143121#132##127 126 112##133142 144## #70 # 12812965155 75## #75130134##ø÷202ø÷153131135## 146#136 137### # 145#75# #138 13970140163166 167# 141# #164 ##120 148114 113165# #153 # ## 6062# 61 # 6665149## #151##119 67 115 69# ## # # 11857 #5968# #124 58# #15073 116# ###74##15212564 70122# 123## #157 63#71 117 14772##S 40TH STSites657075.-, 10S 48TH STHospitalChurchSchoolPark/RecreationHotelE UNIVERSITY DRS PRIEST DR2015 FutureDNL ContoursLEGENDS MILL AVEOther FeaturesS RURAL RD6565 DNLGeneralized 70 DNL7570 Water BodyStudy Area<strong>Airport</strong> Property75 DNLBoundaryRoadwaysMajor HighwaysOther RoadsScale: 1" = 4000'W0 4000 FeetNSS MCCLINTOCK DRE2015 Future ConditionSpecific Point Analysis SitesFIGUREB-2-3
PHOENIX SKY HARBORINTERNATIONAL AIRPORTSIDE-STEPCATEGORICAL EXCLUSIONPrepared By:APPENDIX B-3