WATER RESOURCES TECHNICAL REPORTseparate project to provide the source <strong>of</strong> imported surface water and additionalgroundwater, respectively, for blending. The blending capacity will be 25,000 gallons perminute (36 million gallons per day) with a maximum <strong>of</strong> approximately 8,000 gallons perminute (11.5 million gallons per day) coming from onsite wells. The facility will haveoperational flexibility and will be able to blend local <strong>Oxnard</strong> or UWCD water with importedCMWD water.Blending Station No. 4 (Del Norte Blending Station)Blending Station No. 4 is located near the UWCD El Rio Spreading Grounds on RoseAvenue and serves as the primary backup to Blending Station No. 3. Blending Station No. 4currently has two sources <strong>of</strong> water: (1) groundwater from UWCD and (2) surface water fromCMWD. Groundwater delivered from UWCD is through a 20-inch steel pipe with anestimated delivery capacity <strong>of</strong> approximately 5,800 gpm or 8.5 mgd. Surface water fromCMWD is delivered through the 36-inch Del Norte Conduit with an estimated deliverycapacity <strong>of</strong> approximately 19,000 gpm or 27.4 mgd. Blending Station No. 4 has a rateddesign capacity <strong>of</strong> 24.5 mgd.Recent Groundwater ProductionThe recent potable water demand <strong>of</strong> the <strong>City</strong> has steadily risen as the <strong>City</strong> has grown. Therecent annual water production <strong>of</strong> the <strong>City</strong> over the past several years is summarized below.Recent <strong>City</strong> Groundwater ProductionCMWDYear Deliveries, AFYUWCDDeliveries, AFY<strong>Oxnard</strong>Wells, AFYTotalProduction, AFY1996 a 23,195 32 0 23,2271997 14,077 10,478 0 24,5551998 b 12,198 7,861 0 20,1101999 14,251 10,198 0 24,4492000 14,890 8,633 1,926 25,4492001 14,108 6,113 6,434 26,655Notes:a Surplus water and in-lieu rates were available in 1996.b The <strong>City</strong> acknowledges that there may have been a discrepancy in the metering <strong>of</strong> water during this year.The <strong>City</strong> reinitiated production from its own wells in 2000. As the most inexpensive source<strong>of</strong> water, the use <strong>of</strong> <strong>City</strong> well water has enabled the <strong>City</strong> to meet increasing consumerdemands without significantly increasing its own costs.The historical reduced reliance <strong>of</strong> the <strong>City</strong> on groundwater has had some unfortunateconsequences. As described in Section 2.0, FCGMA was created in 1982 to address ongoingoverdraft and seawater intrusion into the <strong>Oxnard</strong> Plain Basin. The purpose <strong>of</strong> the FCGMA isto manage the groundwater supply <strong>of</strong> the region by protecting the quantity and quality <strong>of</strong>local groundwater resources and by balancing the supply and demand for groundwaterresources.To eliminate groundwater overdraft and bring extractions within safe yield by 2010, theFCGMA adopted Ordinance No. 5. This ordinance established historical allocations for eachpumped in the <strong>Oxnard</strong> Plain Basin and a schedule <strong>of</strong> pumping allocation reductions. TheW112003002SCO LW1458.DOC/ 033390002 35
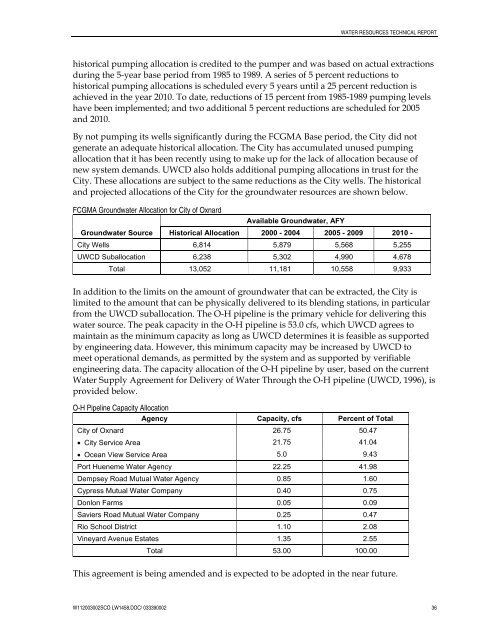
WATER RESOURCES TECHNICAL REPORThistorical pumping allocation is credited to the pumper and was based on actual extractionsduring the 5-year base period from 1985 to 1989. A series <strong>of</strong> 5 percent reductions tohistorical pumping allocations is scheduled every 5 years until a 25 percent reduction isachieved in the year 2010. To date, reductions <strong>of</strong> 15 percent from 1985-1989 pumping levelshave been implemented; and two additional 5 percent reductions are scheduled for 2005and 2010.By not pumping its wells significantly during the FCGMA Base period, the <strong>City</strong> did notgenerate an adequate historical allocation. The <strong>City</strong> has accumulated unused pumpingallocation that it has been recently using to make up for the lack <strong>of</strong> allocation because <strong>of</strong>new system demands. UWCD also holds additional pumping allocations in trust for the<strong>City</strong>. These allocations are subject to the same reductions as the <strong>City</strong> wells. The historicaland projected allocations <strong>of</strong> the <strong>City</strong> for the groundwater resources are shown below.FCGMA Groundwater Allocation for <strong>City</strong> <strong>of</strong> <strong>Oxnard</strong>Available Groundwater, AFYGroundwater Source Historical Allocation 2000 - 2004 2005 - 2009 2010 -<strong>City</strong> Wells 6,814 5,879 5,568 5,255UWCD Suballocation 6,238 5,302 4,990 4,678Total 13,052 11,181 10,558 9,933In addition to the limits on the amount <strong>of</strong> groundwater that can be extracted, the <strong>City</strong> islimited to the amount that can be physically delivered to its blending stations, in particularfrom the UWCD suballocation. The O-H pipeline is the primary vehicle for delivering thiswater source. The peak capacity in the O-H pipeline is 53.0 cfs, which UWCD agrees tomaintain as the minimum capacity as long as UWCD determines it is feasible as supportedby engineering data. However, this minimum capacity may be increased by UWCD tomeet operational demands, as permitted by the system and as supported by verifiableengineering data. The capacity allocation <strong>of</strong> the O-H pipeline by user, based on the currentWater Supply Agreement for Delivery <strong>of</strong> Water Through the O-H pipeline (UWCD, 1996), isprovided below.O-H Pipeline Capacity AllocationAgency Capacity, cfs Percent <strong>of</strong> Total<strong>City</strong> <strong>of</strong> <strong>Oxnard</strong> 26.75 50.47• <strong>City</strong> Service Area 21.75 41.04• Ocean <strong>View</strong> Service Area 5.0 9.43Port Hueneme Water Agency 22.25 41.98Dempsey Road Mutual Water Agency 0.85 1.60Cypress Mutual Water Company 0.40 0.75Donlon Farms 0.05 0.09Saviers Road Mutual Water Company 0.25 0.47Rio School District 1.10 2.08Vineyard Avenue Estates 1.35 2.55Total 53.00 100.00This agreement is being amended and is expected to be adopted in the near future.W112003002SCO LW1458.DOC/ 033390002 36
- Page 4 and 5:
CONTENTS6.2.2 Base Case and Phase 1
- Page 6 and 7:
CONTENTSFiguresSection 1.0 - Introd
- Page 8 and 9:
AcronymsACPAFYASRAWTFBasin PlanbgsB
- Page 10:
1.0 IntroductionThis Technical Repo
- Page 13 and 14:
WATER RESOURCES TECHNICAL REPORT•
- Page 15 and 16:
SANTA BARBARACOUNTYSanta BarbaraVEN
- Page 17 and 18:
WATER RESOURCES TECHNICAL REPORT2.2
- Page 19 and 20: WATER RESOURCES TECHNICAL REPORTmul
- Page 21 and 22: WATER RESOURCES TECHNICAL REPORT2.4
- Page 23 and 24: WATER RESOURCES TECHNICAL REPORTof
- Page 25 and 26: WATER RESOURCES TECHNICAL REPORTFor
- Page 27 and 28: WATER RESOURCES TECHNICAL REPORTThe
- Page 29 and 30: WATER RESOURCES TECHNICAL REPORTThe
- Page 31 and 32: WATER RESOURCES TECHNICAL REPORTres
- Page 33 and 34: WATER RESOURCES TECHNICAL REPORTPum
- Page 35 and 36: WATER RESOURCES TECHNICAL REPORTdis
- Page 37 and 38: Figure 2-1Groundwater Basins and th
- Page 39 and 40: Figure 2-3Groundwater Basins andUWC
- Page 41 and 42: 604020Precipitation (inches)0-20189
- Page 43 and 44: Note: Generalized surficial geology
- Page 45 and 46: (a) Groundwater Elevation Monitorin
- Page 47 and 48: Figure 2-11DWR 1976Schematic CrossS
- Page 49 and 50: 02N22W12R01S02N22W22M04SVineyard Av
- Page 51 and 52: Figure 2-15USGS Groundwater LevelHy
- Page 53 and 54: Figure 2-17USGS Groundwater LevelHy
- Page 55 and 56: (a) Groundwater Elevations, LAS, Sp
- Page 57 and 58: (a) Total Dissolved Solids, UAS, 20
- Page 59 and 60: (a) Chloride Concentrations, Oxnard
- Page 61 and 62: Figure 2-25Subsidence onthe Oxnard
- Page 63 and 64: WATER RESOURCES TECHNICAL REPORTAgr
- Page 65 and 66: WATER RESOURCES TECHNICAL REPORTto
- Page 67 and 68: WATER RESOURCES TECHNICAL REPORTOxn
- Page 69: WATER RESOURCES TECHNICAL REPORTGro
- Page 73 and 74: WATER RESOURCES TECHNICAL REPORTsou
- Page 75 and 76: WATER RESOURCES TECHNICAL REPORTPro
- Page 77 and 78: WATER RESOURCES TECHNICAL REPORTPro
- Page 79 and 80: WATER RESOURCES TECHNICAL REPORTove
- Page 81 and 82: WATER RESOURCES TECHNICAL REPORTout
- Page 83 and 84: TABLE 3-2City Blended Water Quality
- Page 85 and 86: TABLE 3-4Agricultural Water Supply
- Page 87 and 88: Figure 3-1NNo ScaleOxnard Plain Wat
- Page 89 and 90: Figure 3-3Santa Clara RiverFlow and
- Page 91 and 92: Figure 3-5Agriculture andPumping al
- Page 93 and 94: Figure 3-7Agriculture and Pumpingal
- Page 95 and 96: 50,00045,00040,00035,000Supply and
- Page 97 and 98: Acre-Feet6,0005,0004,0003,0002,0001
- Page 99 and 100: WATER RESOURCES TECHNICAL REPORT4.1
- Page 101 and 102: WATER RESOURCES TECHNICAL REPORTSea
- Page 103 and 104: WATER RESOURCES TECHNICAL REPORTfro
- Page 105 and 106: WATER RESOURCES TECHNICAL REPORTcar
- Page 107 and 108: WATER RESOURCES TECHNICAL REPORTirr
- Page 109: WATER RESOURCES TECHNICAL REPORThyd
- Page 112 and 113: WATER RESOURCES TECHNICAL REPORT•
- Page 114 and 115: WATER RESOURCES TECHNICAL REPORTRec
- Page 116 and 117: WATER RESOURCES TECHNICAL REPORTdes
- Page 118 and 119: Hwy 101 - Ventura FwyCamarilloVentu
- Page 120 and 121:
101 FreewayVentura RoadCaminoDel So
- Page 122 and 123:
WELL#21WELL#22WELL#20WELL #23BLENDI
- Page 124 and 125:
5.0 Historical Groundwater Flow Mod
- Page 126 and 127:
WATER RESOURCES TECHNICAL REPORTcli
- Page 128 and 129:
WATER RESOURCES TECHNICAL REPORT•
- Page 130 and 131:
WATER RESOURCES TECHNICAL REPORT−
- Page 132 and 133:
SANTA BARBARACOUNTYSanta BarbaraVEN
- Page 134 and 135:
6.0 GREAT Program Groundwater FlowM
- Page 136 and 137:
WATER RESOURCES TECHNICAL REPORTgro
- Page 138 and 139:
WATER RESOURCES TECHNICAL REPORTto
- Page 140 and 141:
WATER RESOURCES TECHNICAL REPORTGro
- Page 142 and 143:
WATER RESOURCES TECHNICAL REPORT6.1
- Page 144 and 145:
WATER RESOURCES TECHNICAL REPORTfor
- Page 146 and 147:
WATER RESOURCES TECHNICAL REPORTin
- Page 148 and 149:
WATER RESOURCES TECHNICAL REPORT•
- Page 150 and 151:
WATER RESOURCES TECHNICAL REPORT−
- Page 152 and 153:
WATER RESOURCES TECHNICAL REPORTtwo
- Page 154 and 155:
WATER RESOURCES TECHNICAL REPORTThe
- Page 156 and 157:
TABLE 6-1Scenarios for Model Simula
- Page 158 and 159:
100Cumulative Departure from Mean20
- Page 160 and 161:
15060Elevation (feet, msl)00Rainfal
- Page 162 and 163:
5833aPci f ic5O c55185e a n51513552
- Page 164 and 165:
-100406080700-40-20406050-103001402
- Page 166 and 167:
400-402030-50010-30-10-60-20-30-107
- Page 168 and 169:
-20400-40103020-500-10-30-20-401200
- Page 170 and 171:
0-10-204030-40-50-30-1001020-20-40-
- Page 172 and 173:
0-204030-40-6001020-30-10-20-30-50-
- Page 174 and 175:
North Oxnard Plain Area6 7 8 901N22
- Page 176 and 177:
10040608070504010901001201401701601
- Page 178 and 179:
14050809030506070104001030100120901
- Page 180 and 181:
10080507060401001201401701802001501
- Page 182 and 183:
01005070601601201108070906050210180
- Page 184 and 185:
70140509070601040501020901101401701
- Page 186 and 187:
Oxnard Forebay Area1 2 3 402N22W 12
- Page 188 and 189:
South Oxnard Plain Area11 12 13 140
- Page 190 and 191:
WATER RESOURCES TECHNICAL REPORTtho
- Page 192 and 193:
WATER RESOURCES TECHNICAL REPORT7.2
- Page 194 and 195:
WATER RESOURCES TECHNICAL REPORTRed
- Page 196 and 197:
WATER RESOURCES TECHNICAL REPORT•
- Page 198:
WATER RESOURCES TECHNICAL REPORTKen