View File - Development Services - City of Oxnard
View File - Development Services - City of Oxnard View File - Development Services - City of Oxnard
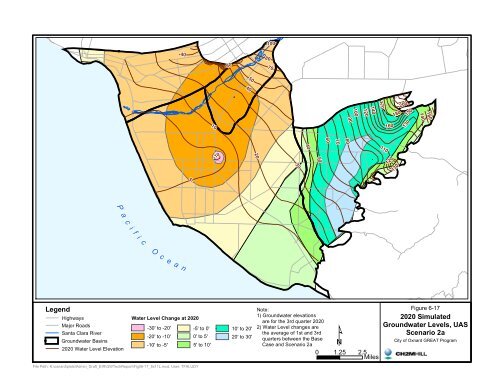
1004060807050401090100120140170160180200150130140160608070-10203040501101201300aPci f icO ce a nLegendHighwaysMajor RoadsSanta Clara RiverGroundwater Basins2020 Water Level ElevationWater Level Change at 2020-30' to -20' -5' to 0'-20' to -10' 0' to 5'-10' to -5'5' to 10'10' to 20'20' to 30'Note:1) Groundwater elevationsare for the 3rd quarter 20202) Water Level changes arethe average of 1st and 3rdquarters between the BaseCase and Scenario 2a0 1.25 2.5 MilesFigure 6-172020 SimulatedGroundwater Levels, UASScenario 2aCity of Oxnard GREAT ProgramFile Path: K:\oxnard\plots\Admin_Draft_EIR\GWTechReport\Fig06-17_8x11L.mxd, User: TFALUDY
-600703040-20-40-60-50-3002010-20-10-20-30060-30308011013090-20-404050-50P a-20-40-50-70-30 -50-60-60-30-10-201020P aci f i c-10-60-60-40Ocean-30LegendHighwaysMajor RoadsSanta Clara RiverGroundwater Basins2020 Water Level ElevationWater Level Change at 2020-15' to -10'0' to 20'-10' to -5'20' to 40'-5' to 0'40' to 60'Note:1) Groundwater elevationsare for the 3rd quarter 20202) Water Level changes arethe average of 1st and 3rdquarters between the BaseCase and Scenaio 2a0 1.25 2.5 MilesFigure 6-182020 SimulatedGroundwater Levels, LASScenario 2aCity of Oxnard GREAT ProgramFile Path: K:\oxnard\plots\Admin_Draft_EIR\GWTechReport\Fig06-18_8x11L.mxd, User: TFALUDY
- Page 126 and 127: WATER RESOURCES TECHNICAL REPORTcli
- Page 128 and 129: WATER RESOURCES TECHNICAL REPORT•
- Page 130 and 131: WATER RESOURCES TECHNICAL REPORT−
- Page 132 and 133: SANTA BARBARACOUNTYSanta BarbaraVEN
- Page 134 and 135: 6.0 GREAT Program Groundwater FlowM
- Page 136 and 137: WATER RESOURCES TECHNICAL REPORTgro
- Page 138 and 139: WATER RESOURCES TECHNICAL REPORTto
- Page 140 and 141: WATER RESOURCES TECHNICAL REPORTGro
- Page 142 and 143: WATER RESOURCES TECHNICAL REPORT6.1
- Page 144 and 145: WATER RESOURCES TECHNICAL REPORTfor
- Page 146 and 147: WATER RESOURCES TECHNICAL REPORTin
- Page 148 and 149: WATER RESOURCES TECHNICAL REPORT•
- Page 150 and 151: WATER RESOURCES TECHNICAL REPORT−
- Page 152 and 153: WATER RESOURCES TECHNICAL REPORTtwo
- Page 154 and 155: WATER RESOURCES TECHNICAL REPORTThe
- Page 156 and 157: TABLE 6-1Scenarios for Model Simula
- Page 158 and 159: 100Cumulative Departure from Mean20
- Page 160 and 161: 15060Elevation (feet, msl)00Rainfal
- Page 162 and 163: 5833aPci f ic5O c55185e a n51513552
- Page 164 and 165: -100406080700-40-20406050-103001402
- Page 166 and 167: 400-402030-50010-30-10-60-20-30-107
- Page 168 and 169: -20400-40103020-500-10-30-20-401200
- Page 170 and 171: 0-10-204030-40-50-30-1001020-20-40-
- Page 172 and 173: 0-204030-40-6001020-30-10-20-30-50-
- Page 174 and 175: North Oxnard Plain Area6 7 8 901N22
- Page 178 and 179: 14050809030506070104001030100120901
- Page 180 and 181: 10080507060401001201401701802001501
- Page 182 and 183: 01005070601601201108070906050210180
- Page 184 and 185: 70140509070601040501020901101401701
- Page 186 and 187: Oxnard Forebay Area1 2 3 402N22W 12
- Page 188 and 189: South Oxnard Plain Area11 12 13 140
- Page 190 and 191: WATER RESOURCES TECHNICAL REPORTtho
- Page 192 and 193: WATER RESOURCES TECHNICAL REPORT7.2
- Page 194 and 195: WATER RESOURCES TECHNICAL REPORTRed
- Page 196 and 197: WATER RESOURCES TECHNICAL REPORT•
- Page 198: WATER RESOURCES TECHNICAL REPORTKen
1004060807050401090100120140170160180200150130140160608070-10203040501101201300aPci f icO ce a nLegendHighwaysMajor RoadsSanta Clara RiverGroundwater Basins2020 Water Level ElevationWater Level Change at 2020-30' to -20' -5' to 0'-20' to -10' 0' to 5'-10' to -5'5' to 10'10' to 20'20' to 30'Note:1) Groundwater elevationsare for the 3rd quarter 20202) Water Level changes arethe average <strong>of</strong> 1st and 3rdquarters between the BaseCase and Scenario 2a0 1.25 2.5 MilesFigure 6-172020 SimulatedGroundwater Levels, UASScenario 2a<strong>City</strong> <strong>of</strong> <strong>Oxnard</strong> GREAT Program<strong>File</strong> Path: K:\oxnard\plots\Admin_Draft_EIR\GWTechReport\Fig06-17_8x11L.mxd, User: TFALUDY


