PARIA RIVER WATERSHED - Division of Water Quality - Utah.gov
PARIA RIVER WATERSHED - Division of Water Quality - Utah.gov
PARIA RIVER WATERSHED - Division of Water Quality - Utah.gov

You also want an ePaper? Increase the reach of your titles
YUMPU automatically turns print PDFs into web optimized ePapers that Google loves.
<strong>PARIA</strong> <strong>RIVER</strong><strong>WATERSHED</strong>WATER QUALITYMANAGEMENT PLANEPA Approval Date:_____________Prepared For:<strong>Utah</strong> Department <strong>of</strong> Environmental <strong>Quality</strong><strong>Division</strong> <strong>of</strong> <strong>Water</strong> <strong>Quality</strong>Carl AdamsProject ManagerHarry Lewis JuddProject SupervisorPrepared By:MSEMillennium Science & Engineering, Inc.Pocket <strong>Water</strong> Inc.
<strong>PARIA</strong> <strong>RIVER</strong> <strong>WATERSHED</strong>WATER QUALITY MANAGEMENT PLANTABLE OF CONTENTS1.0 INTRODUCTION ............................................................................................................... 11.1 Background and Document Organization.................................................................... 11.2 The TMDL Process...................................................................................................... 21.3 <strong>Utah</strong>’s <strong>Water</strong>shed Approach ........................................................................................ 21.4 <strong>Water</strong>shed Characterization ......................................................................................... 41.4.1 Location and Population................................................................................ 41.4.2 Land Use/Land Cover.................................................................................... 61.4.3 Geology and Soils.......................................................................................... 61.4.4 Climate........................................................................................................... 81.4.5 Surface <strong>Water</strong> Hydrology............................................................................ 101.4.6 Groundwater Hydrogeology ........................................................................ 122.0 WATER QUALITY CRITERIA...................................................................................... 142.1 Beneficial Uses and 303(d) Listed Section ................................................................ 142.2 <strong>Water</strong> <strong>Quality</strong> Standards ............................................................................................ 143.0 IMPAIRMENT ANALYSIS............................................................................................. 163.1 Geographic Extent <strong>of</strong> the <strong>Water</strong> <strong>Quality</strong> Management Plan...................................... 163.2 <strong>Water</strong> <strong>Quality</strong> Data in STORET ................................................................................ 163.3 SOURCE ASSESSMENT ......................................................................................... 184.0 TMDL/SITE-SPECIFIC CRITERIA .............................................................................. 195.0 PROJECT IMPLEMENTATION PLANS AND BMPs ................................................ 235.1 Statement <strong>of</strong> Need...................................................................................................... 245.1.1 Project <strong>Water</strong> <strong>Quality</strong> Priority..................................................................... 245.1.2 Project Goals................................................................................................ 245.1.3 Objectives and Tasks ................................................................................... 255.1.4 Permits ......................................................................................................... 285.1.5 Lead Sponsor ............................................................................................... 285.1.6 Assurance <strong>of</strong> Project Operation and Maintenance....................................... 285.2 Coordination Plan ...................................................................................................... 295.2.1 Lead Project Sponsor................................................................................... 295.2.2 Local Support............................................................................................... 295.2.3 Coordination and Linkages.......................................................................... 295.2.4 Similar Activities......................................................................................... 295.3 Evaluation and Monitoring Plan ................................................................................ 305.3.1 Sampling and Analysis Plan Goals.............................................................. 305.3.2 Implementation and Effectiveness Monitoring ........................................... 305.3.3 Trend Monitoring......................................................................................... 335.3.4 Data Management, Storage, and Reporting................................................. 345.4 Long-Term Funding Plans for Operation and Maintenance ...................................... 355.5 Public Involvement .................................................................................................... 356.0 CONCLUSIONS AND RECOMMENDATIONS .......................................................... 367.0 REFERENCES .................................................................................................................. 38i
LIST OF TABLESTable 1-1 Landownership Patterns in the Paria Study Area ......................................................... 6Table 1-2 Climate zones for the GSENM including Paria River <strong>Water</strong>shed................................ 8Table 1-3 Monthly Climate Summary, Tropic <strong>Utah</strong> (428847) ..................................................... 8Table 1-4 <strong>Water</strong>shed Characteristics within the Paria Study Area ............................................. 10Table 1-5 USGS Stream Gaging Stations ................................................................................... 11Table 2-1 303(d) Listed Segments in the Paria River <strong>Water</strong>sheds.............................................. 14Table 2-2 <strong>Utah</strong> <strong>Water</strong> <strong>Quality</strong> Criteria for TDS and Related Parameters................................... 14Table 2-3 303(d) Criteria for Assessing Agricultural Beneficial Use Support - Class 4 ............ 15Table 3-1 Summary <strong>of</strong> STORET Stations and Available TDS Data .......................................... 17Table 4-1 Statistics and Site-Specific Criteria for Paria River Reach-1 Based on Station495186 - Paria River at Kodachrome Basin Road Crossing ...................................... 20Table 4-2 Statistics and Site-Specific Criteria for Paria River Reach-3 Based on Station495185 - Paria River at US89 Crossing...................................................................... 22Table 5-1 Example Variables for Tracking BMP implementation ............................................. 31Table 5-2 Suggested Monitoring Stations for Trend Monitoring ............................................... 34Table 6-1 Recommended Site-Specific Criteria for TDS in the Paria River .............................. 36LIST OF FIGURESFigure 1-1 Location <strong>of</strong> Paria River ................................................................................................ 5Figure 1-2 Average Precipitation for Southeast Colorado for the Most Recent 10-Year Period(<strong>Utah</strong> <strong>Division</strong> <strong>of</strong> <strong>Water</strong> Resources website) ............................................................... 9Figure 1-3 Historical Flows Compared to 2002 and 2003 Flows ................................................ 12Figure 1-4 Regional Aquifers in the Paria River Area (BLM 1999) ........................................... 13Figure 4-1 Concentration <strong>of</strong> TDS at Two Stations on Paria River Reach-1 Compared to the<strong>Utah</strong> Standard for Irrigation <strong>of</strong> 1,200 mg/L ............................................................... 20Figure 4-2 Concentration <strong>of</strong> TDS at Two Stations on Paria River Reach-3 Compared to the<strong>Utah</strong> Standard for Irrigation <strong>of</strong> 1,200 mg/L ............................................................... 21Appendix 1:Appendix 2:Appendix 3:Appendix 4:Appendix 5:Appendix 6:Appendix 7:LIST OF APPENDICESList <strong>of</strong> ContributorsMap 1 <strong>Water</strong>shed OverviewMap 2 General TopographyMap 3 GeologyMap 4 SoilsMap 5 VegetationMap 6 Land OwnershipMap 7 STORET Sites and USGS Stream Gaging StationsSTORET Station Data and Statistical SummariesUSGS Stream Gage Station Flow SummariesParia River Climate SummaryList <strong>of</strong> AcronymsResponse to Commentsii
1.0 INTRODUCTION1.1 Background and Document OrganizationThis document presents a <strong>Water</strong> <strong>Quality</strong> Management Plan (WQMP) for the Paria River<strong>Water</strong>shed located in southern <strong>Utah</strong>. The <strong>Utah</strong> <strong>Division</strong> <strong>of</strong> <strong>Water</strong> <strong>Quality</strong> (DWQ) developed this<strong>Water</strong> <strong>Quality</strong> Management Plan with assistance from the Canyonlands Soil ConservationDistrict. The DWQ contracted Millennium Science & Engineering to assess water qualityimpairments <strong>of</strong> the Paria River, quantify loadings for limiting water quality parameters, developTotal Maximum Daily Loads, and assist the Canyonlands Soil Conservation District indeveloping this <strong>Water</strong>shed <strong>Water</strong> <strong>Quality</strong> Management Plan. Many private individuals,agencies, and consultants contributed to these efforts. A list <strong>of</strong> contributors is provided inAppendix 1.<strong>Utah</strong>'s Year 2002 303(d) list identifies two reaches <strong>of</strong> the Paria River as being impaired due toexceedence <strong>of</strong> <strong>Utah</strong>'s total dissolved solids (TDS) criteria for protection <strong>of</strong> agricultural uses,Class-4 waters. The upper and lower reaches ("Reach-1" and "Reach-3", respectively) are listeddue to the measured elevated TDS concentrations (the "Listed Sections"). The middle reach isnot listed as a water quality limited segment.The Paria River flows from the headwaters in Bryce Canyon National Park and Dixie NationalForest through private agricultural lands in Garfield County, <strong>Utah</strong> and south through the BLMadministered Grand Staircase-Escalante National Monument (GSENM) into Arizona and theColorado River below Glen Canyon Dam. The river flows through the Grand Staircase region, aseries <strong>of</strong> multi-colored cliffs which begin at the rim <strong>of</strong> the Grand Canyon, and ascend over 5,000feet across GSENM to end at the cliffs in Bryce Canyon. The small towns <strong>of</strong> Tropic,Cannonville and Henrieville at the northern end <strong>of</strong> the basin are based on a primarily agriculturaleconomy dependent on irrigation from surface waters. Downstream from private lands nearHenrieville Wash the river enters GSENM and flows through these primitive public lands forapproximately 45 river miles to the Arizona border. The Paria River is situated in a dry desertclimate so the majority <strong>of</strong> surface streams and washes are intermittent. The Paria River isperennial for most but not all <strong>of</strong> its length through the state.Section 1 <strong>of</strong> the <strong>Water</strong> <strong>Quality</strong> Management Plan provides background on the EnvironmentalProtection Agency (EPA) Total Maximum Daily Load (TMDL) process, <strong>Utah</strong>’s watershedmanagement approach, and describes the characteristics <strong>of</strong> the watershed. Section 2 describesthe water quality criteria that apply to the TMDL. Section 3 evaluates impairment by evaluatingthe water quality, water quantity and TDS data. Section 4 describes the TMDL (sources <strong>of</strong>pollution, loading calculations and allocation if appropriate, water quality goals and targets) andevaluation <strong>of</strong> site-specific criteria. Section 5 describes the project implementation plans (PIPs)and best management practices (BMPs) to attain the water quality goals and targets, anddescribes a monitoring plan to evaluate implementation and effectiveness. Conclusions andrecommendations are presented in Section 6. A list <strong>of</strong> references cited in this document isprovided in Section 7.Appendix 1 lists the people that contributed to this document. All maps are provided inAppendix 2. Appendices 3 through 5 provide supporting data on water quality, flowconditions, and climate. Appendix 6 lists acronyms used in the document. Review commentsand responses are provided in Appendix 7.1
1.2 The TMDL Process<strong>Water</strong> quality standards are set by States, Territories, and Tribes. They identify the scientificcriteria to support a waterbody’s beneficial uses such as for drinking water supply, contactrecreation (swimming), and agricultural uses (including irrigation <strong>of</strong> crops and stock watering).A TMDL or Total Maximum Daily Load is a calculation <strong>of</strong> the maximum amount <strong>of</strong> a pollutantthat a waterbody can receive and still meet water quality standards (EPA, 1999). The Clean<strong>Water</strong> Act, Section 303(d), establishes the TMDL program. As part <strong>of</strong> the TMDL process, themaximum amount <strong>of</strong> the pollutant <strong>of</strong> concern is allocated to its contributing sources. Therefore,a TMDL is the sum <strong>of</strong> the allowable loads <strong>of</strong> the pollutant <strong>of</strong> concern from all contributing pointand nonpoint sources. The calculation must include a margin <strong>of</strong> safety to account for futuregrowth and changes in land use, uncertainties in data collection, analysis, and interpretation.Section 303(d) and EPA's <strong>Water</strong> <strong>Quality</strong> Planning and Management Regulations (40 CFR Part130), requires that States report waterbodies (i.e., lakes, reservoirs, rivers, and streams) thatcurrently do not support their designated beneficial use(s). EPA regulations require that eachState submit a prioritized list <strong>of</strong> waterbodies to be targeted for improvement to EPA every twoyears. These regulations also require States to develop TMDLs for those targeted waterbodies.Thus, those waterbodies that are not currently achieving, or are not expected to achieve,applicable water quality standards are identified as water quality limited. <strong>Water</strong>bodies can bewater quality limited due to point sources <strong>of</strong> pollution and nonpoint sources <strong>of</strong> pollution.Pollutants that can cause use impairment include heavy metals, pathogens and nutrients forwhich there are numeric standards. In addition to pollutants, impairments may originate fromsources such as habitat alteration or hydrologic modification that have associated narrativestandards (DWQ, 2002). Section 303(d)(1)(A) and the implementing regulations (40 CFR130.7(b)) provide States with latitude to determine their own priorities for developing andimplementing TMDLs.Once a waterbody is identified as water quality limited, the State, Tribe, or EPA is required todetermine the source(s) <strong>of</strong> the pollutant and to allocate the responsibility for controlling it. Thegoal <strong>of</strong> the TMDL is reduction in pollutant loading necessary for a waterbody to meet waterquality standards and support its beneficial uses. This process determines: 1) the amount <strong>of</strong> aspecific pollutant that a waterbody can receive without exceeding its water quality standard orimpair a beneficial use; 2) the allocation <strong>of</strong> the load to point and nonpoint sources; and 3) amargin <strong>of</strong> safety. While the term TMDL implies that the target load (loading capacity) isdetermined on a daily time scale, TMDLs can range from meeting an instantaneousconcentration (e.g., an acute standard) to computing an acceptable annual load to a waterbody(DWQ, 2002).The Paria River is listed on <strong>Utah</strong>'s 2002 303d list (DWQ, 2002) for waters requiring thedevelopment <strong>of</strong> a TMDL due to the exceedences <strong>of</strong> the agricultural criteria for Beneficial Use 4.Cooperative monitoring by DWQ and BLM have identified several monitoring stations whereTDS concentrations exceeded State criteria. Therefore, DWQ prompted this TMDL to identifyand quantify sources contributing to TDS increase in the Paria River watershed.1.3 <strong>Utah</strong>’s <strong>Water</strong>shed Approach<strong>Utah</strong>’s watershed approach is aimed at improving and protecting the State’s surface andgroundwater resources. Characteristics <strong>of</strong> the approach include a high level <strong>of</strong> stakeholderinvolvement, water quality monitoring and information gathering, problem targeting andprioritization, and integrated solutions that make use <strong>of</strong> multiple agencies and groups. Federal2
and state regulations appoint DWQ with the task <strong>of</strong> preventing, controlling, and abating waterpollution. Other state and local agencies have associated responsibilities. <strong>Utah</strong>'s watershedapproach is to form partnerships with accountable <strong>gov</strong>ernment agencies and interested groups tocombine resources and increase the effectiveness <strong>of</strong> existing programs.Throughout the State <strong>of</strong> <strong>Utah</strong> a series <strong>of</strong> ten nested management units provide spatial focus towatershed management activities, thereby improving coordination. <strong>Water</strong>shed managementunits in the State may contain more than one stream system, or watershed, defined as the entirearea drained by a stream and its tributaries. <strong>Water</strong>shed management units are consistent with thehydrologic basins defined by the <strong>Utah</strong> Department <strong>of</strong> Natural Resources - <strong>Division</strong> <strong>of</strong> <strong>Water</strong>Resources for the State <strong>Water</strong> Plan project (<strong>Utah</strong> <strong>Division</strong> <strong>of</strong> <strong>Water</strong> Resources, 1990). Thewatershed management units provide boundaries for evaluating the impact <strong>of</strong> various stressorson commonly shared resources, provide boundaries for evaluating the impacts <strong>of</strong> managementactions, and provide a better perspective for DWQ and stakeholders to determine environmentalobjectives and to develop management strategies that account for local and regionalconsiderations.Each watershed plan will establish management actions at several spatial scales ranging from thewatershed scale to specific sites that are influenced by unique environmental conditions.<strong>Water</strong>shed plans consider a holistic approach to watershed management in which groundwaterhydrologic basins and eco-regions encompassed within the units are considered. The goal <strong>of</strong><strong>Utah</strong>'s watershed approach is better coordination and integration <strong>of</strong> the State's existing resourcesand water quality management programs to improve protection for surface and groundwaterresources. Better coordination and integration extends beyond the tiers <strong>of</strong> <strong>gov</strong>ernment agenciesto include all stakeholders in the watershed.<strong>Utah</strong>’s watershed approach is based on hydrologically defined watershed boundaries and aims tode-emphasize jurisdictional delineations in watershed management efforts. This approach isexpected to accelerate improvements in water quality as a result <strong>of</strong> increased coordination andsharing <strong>of</strong> resources. Statewide watershed management is not a new regulatory program, it is ameans <strong>of</strong> operating within existing regulatory and non-regulatory programs to more efficientlyand effectively protect, enhance, and restore aquatic resources. The Statewide watershedmanagement approach has been introduced to establish a framework to integrate existingprograms and coordinate management activities geographically (DWQ, 2000c).In addition to the technical components, <strong>Utah</strong>’s watershed approach is dependant on the criticalrole stakeholders play in watershed water quality management. The success <strong>of</strong> theimplementation plan, and ultimately the restoration <strong>of</strong> water quality, depends on the voluntaryparticipation <strong>of</strong> the stakeholders in <strong>Utah</strong>'s watersheds. Therefore, to be successful, the TMDLdevelopment approach must ensure public participation and input at critical points throughout theprocess.A successful water quality management plan and TMDL relies as much on voluntary stakeholderparticipation and buy-in as on the rigor <strong>of</strong> technical analysis. The advantages <strong>of</strong> involvingstakeholders throughout the TMDL development and implementation process are numerous.Through their voluntary participation, the stakeholders can become more comfortable that themonitoring and modeling programs generate reliable data that are scientifically defensible.Further, effluent limits and BMPs developed by the Stakeholders are less prone to credibilitychallenges and litigation. Stakeholders are more apt to agree to pollutant reduction or habitatimprovement schemes that they helped to formulate.3
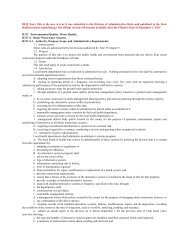
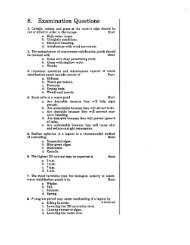
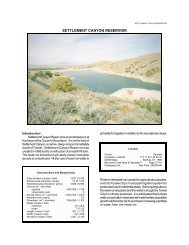
The boundaries <strong>of</strong> watershed management units in <strong>Utah</strong> were drawn so that stakeholders wouldbe aggregated or grouped into areas sharing common environmental characteristics. Definingwatershed management units in this way is intended to encourage a sense <strong>of</strong> ownership in theresident stakeholders and to encourage involvement in stewardship activities. Based on a modelsuccessfully used by other states, the program draws on the expertise <strong>of</strong> those involved in oraffected by water quality management decisions. These stakeholders help gather informationand design BMPs, then become involved in stewardship activities.In the Paria River watershed, both <strong>gov</strong>ernmental and non-<strong>gov</strong>ernmental entities worked toachieve a skillful and honest presentation <strong>of</strong> technical information to the Canyonlands SoilConservation District throughout this study. These efforts have resulted in a <strong>Water</strong> <strong>Quality</strong>Management Plan that assures control <strong>of</strong> nonpoint source pollution that are acceptable to thoseliving and working in the watershed.1.4 <strong>Water</strong>shed Characterization1.4.1 Location and PopulationThe Paria River is located in Garfield and Kane Counties in southern <strong>Utah</strong> and contained in partwithin the GSENM (Figure 1-1). The locations <strong>of</strong> the water quality limited sections <strong>of</strong> the PariaRiver are also indicated in Figure 1-1.Garfield County had the fifth smallest population in the State <strong>of</strong> <strong>Utah</strong>, 4,599 in 2002, and is theleast densely populated 1 . The county’s average annual growth rate from 1990-2000 was 1.8%;lower than the state average <strong>of</strong> 2.7%. Total nonagricultural employment totaled 2,129 in 2001 inGarfield County. Services accounted for the greatest share <strong>of</strong> nonagricultural employment at45.2% and <strong>gov</strong>ernment accounted for 28.7% <strong>of</strong> Garfield County’s 2001 employment.Agriculture and trade were also important. Growth in tourism-related industries is expected tocontinue at a more accelerated pace because <strong>of</strong> the designation in 1996 <strong>of</strong> the GSENM. GarfieldCounty had 121,381 acres <strong>of</strong> private land on 285 farms; 116 were full-time farms (1997). Themarket value <strong>of</strong> agricultural products sold was $7.6 million in 1997; crop sales accounted for18% <strong>of</strong> agricultural products and livestock sales for 82%. Cattle, hay, dairy products, and sheepare all significant agricultural products <strong>of</strong> the county. There are 3,330,924 land acres in GarfieldCounty. Of that amount, 90% is federally owned, while 5.4% is state owned. The remainingland in Garfield is privately owned, owned by municipal organizations, or state sovereign lands.Kane County’s population was 5,958 in 2002. With a population density <strong>of</strong> 1.5 persons persquare mile, the county was one <strong>of</strong> the least densely populated in the state. Kane Countysustained an average growth rate <strong>of</strong> 1.6% per year from 1990 to 2000. Kane’s Census 2000average household size, 2.67 people, was one <strong>of</strong> the lowest in the state. By 2030, Kane County’spopulation is expected to swell to over 13,628 people. Nonagricultural employment reached2,902 in 2001. Services (41%) and <strong>gov</strong>ernment (25.4%) accounted for the largest shares <strong>of</strong>employment. Manufacturing (12.9%) and trade (12.7%) also occupied an important presence.Kane’s economy is specialized in tourism-related industries, agriculture, and non-metallicminerals extraction.1 County Economic Pr<strong>of</strong>iles. Governor’s Office <strong>of</strong> Planning and Budget, Demographic and Economic Analysis.http://<strong>gov</strong>ernor.utah.<strong>gov</strong>/dea/WrittenPr<strong>of</strong>iles.PDF4
Figure 1-1 Location <strong>of</strong> Paria River5
1.4.2 Land Use/Land CoverLand ownership patterns are shown in Map 6, and summarized in Table 1-1. The northern end<strong>of</strong> the watershed is bordered by Bryce Canyon National Park and Dixie National Forest. Belowthe national park and forest service boundary the watershed, excluding private land, has beenincorporated into the GSENM.Table 1-1Landownership Patterns in the Paria Study AreaLand Ownership Area (square miles)<strong>Water</strong>shed BLM USFS NPS <strong>Utah</strong> Private TotalParia River Reach-1(Paria Reach-1) 34.1 14.7 5.1 10.8Rock Springs Creek 1 50.1 1.5 0.6 5.2 57.4Henrieville Wash 53.4 5.4 0.8 4.0 63.6Yellow Creek 8.2 4.6 0.7 2.1 15.7Henderson Creek 10.5 16.6 0.1 2.1 29.2Tropic Ditch 3.9 0.7 17.6 0.6 6.0 28.8Total 160.3 38.9 22.1 7.9 30.2 194.7Paria River Reach-3Kitchen Corral Creek 2 292.3 10.3 4.0 1.2 17.8 325.7Sand Gulch 36.6 3.7 40.3(Paria Reach-3) 62.2 12.2 1.4 75.9Total 391.1 10.3 4.0 13.4 22.9 441.8Notes to Table: Subwatersheds Reach-1 and Reach-3 (in parentheses) are the land areas that drain directly tothe river, and do not include the tributaries in the table. 1 Rock Springs Creek with Wiggler Wash tributary asheadwaters. 2 Kitchen Corral Creek with Deer Springs Wash tributary as headwaters.The Paria River occurs within the Grand Staircase physiographic region. The Grand Staircaseregion is a series <strong>of</strong> multi-colored cliffs which begin at the rim <strong>of</strong> the Grand Canyon, and ascendnearly 5,500 feet across the southwestern side <strong>of</strong> GSENM, to end with a final stair <strong>of</strong> pink cliffsin Bryce Canyon National Park. These stairs consist <strong>of</strong> "risers" <strong>of</strong> resistant and non-resistantrock formations up to 2,000 feet high, and "treads" which are valleys or plateaus up to 15 mileswide. The stairs include the Chocolate Cliffs, Vermilion Cliffs, White Cliffs, Gray Cliffs, andPink Cliffs, all large expanses <strong>of</strong> exposed, virtually undeformed rock strata which provide arelatively continuous stratigraphic record from Grand Canyon (Precambrian) to Bryce Canyon(Tertiary).Map 5 shows the vegetation patterns as identified by the <strong>Utah</strong> GAP vegetation analysis. GAPrefers to a process to identify “gaps” in protection <strong>of</strong> high biodiversity areas for wildlife species.The resulting maps characterize plant communities at a broad scale, and are not particularlyuseful for streamside zones. Vegetation in Paria River Reach-1 transitions from mountain shruband juniper at higher elevations and wetter sites to salt desert scrub. In Paria River Reach-3, saltdesert scrub transitions to blackbrush communities toward the Arizona border.1.4.3 Geology and SoilsThe Paria River flows through a series <strong>of</strong> topographic benches and cliffs that form the GrandStaircase region. From its headwaters approximately 5 miles northeast <strong>of</strong> Tropic, <strong>Utah</strong>, to whereit joins the Colorado River near the town <strong>of</strong> Lee's Ferry, Arizona, the Paria River cuts through6
sedimentary strata <strong>of</strong> several geologic formations ranging from Late Triassic to Early Tertiary(middle to late Eocene) in age.The upper Listed Section <strong>of</strong> the Paria River flows through the Claron Formation in the northernmost part <strong>of</strong> the study area. The Claron is characterized by upper white limestone and lowerpink limestone members (Bowers, 1972), which are continuous throughout the Markagunt,Paunsaugunt, Seiver and Table Cliffs Plateaus (GSA, 2002).As the river flows south to Cannonville (near STORET 495187), it crosses the WahweapSandstone and Tropic Shale Formation and Dakota Sandstone. The Wahweap is composed <strong>of</strong>interbedded mudstones, siltstones sandstones, and conglomerates (Doelling, et al., 2000), thataccumulated in fluvial, flood plain and lacustrine environments. Locally rich fossil-bearingsections <strong>of</strong> the Wahweap contain petrified wood, vertebrates (including dinosaurs), andgastropods. The Tropic Shale is characteristically blue-gray in color and represents deposition <strong>of</strong>muds in a deep water marine environment. It forms distinctive slopes that are prone to landslidesand slumps that likely contribute much <strong>of</strong> the sediment loading to the Paria. Bentonite beds areabundant throughout the Tropic Shale and are correlated with well established ammonitebiozones (Cobban, et al., 2000) The lower part <strong>of</strong> the Tropic Shale contains limestoneconcretions, rich in molluscan fauna, whereas the upper Tropic becomes sandy (GSA, 2002).The Dakota Sandstone is composed <strong>of</strong> sandstone, conglomerate, mudstone, siltstone and coaldeposited in coastal flood plain and shallow marine environments.Approximately 8 miles south <strong>of</strong> Cannonville, the Paria River crosses the Entrada and Carmelformations <strong>of</strong> middle Jurassic age. The Entrada is highly variable, but is most <strong>of</strong>ten associatedwith cross bedded eolian sandstones in the region (Peterson, 1994). The Entrada has threemembers (Gunsite Butte, Cannonville, and Escalante) consisting <strong>of</strong> white to reddish-orange, siltyto fine grained sandstones with sparse, medium to coarse frosted sand grains (Doelling, et al.,2000). Lower Jurassic formations (Navajo Sandstone, Kayenta Formation, Moenave Formationand Wingate Sandstone) are well developed in the Vermillion Cliffs, Wygaret Terrace and WhiteCliffs. They consist predominantly <strong>of</strong> red sandstones (Moenave and Kayenta Formations) thatare crossed by the Paria River in the lower part <strong>of</strong> the upper Listed Section (Reach-1).The lower Listed Section Paria River begins approximately 2 miles south <strong>of</strong> STORET Site599455. Here, the Paria again crosses Entrada/Carmel Formation, Wahweap Sandstone, TropicShale, Dakota Sandstone and Navajo/Kayenta/Moenave Formations, as it flows south to theArizona Border.Throughout much <strong>of</strong> its entire length the Paria River flows through alluvium. From STORETSite 495192 to the end <strong>of</strong> the upper Listed Section, the Paria flows through thick deposits <strong>of</strong>Quaternary age alluvium. In the lower Listed Section, the Paria flows almost entirely thoughalluvium. These valley-fill deposits are extensive, extending across the entire width <strong>of</strong> the valleybetween bedrock margins. The alluvium formed by repeated (cut and fill) episodes <strong>of</strong> valleyerosion and stream entrenchment followed by aggradation and build up <strong>of</strong> the stream bed(Hereford, 1997).Considering the geology <strong>of</strong> the Paria River <strong>Water</strong>shed, the Tropic Shale is identified as apotential source <strong>of</strong> TDS to the Paria River. Given its deposition in a marine environment itcontains salts that could leach out to surface and groundwater. Furthermore, because its slopesare prone to landslides and slumps, percolating surface waters could also carry significant loads<strong>of</strong> saline sediments to the Paria River.7
Soils data and GIS coverages from the Natural Resources Conservation Service (NRCS) wereused to map soils in the Paria River <strong>Water</strong>shed. General soils data and map unit delineations forthe area are provided as part <strong>of</strong> the State Soil Geographic (STATSGO) database. Identificationfields in the GIS coverage can be linked to a database that provides information on chemical andphysical soil characteristics. Map 4 shows the general soil unit boundaries in the Paria River<strong>Water</strong>shed.1.4.4 ClimateExtreme changes in weather are characteristic <strong>of</strong> the canyons and plateaus <strong>of</strong> the Grand Staircaseregion. Powder-dry arroyos can change suddenly into boiling, muddy stream channels bythunderstorms many miles away. Scorching desert heat during the day gives way to cold, clearnights. During the summer months, small springs and tinajas (small temporary rock pools)provide oasis for wildlife. When winter arrives, bitter cold temperatures rule the canyons, whilesnows blanket the higher plateaus.Annual precipitation varies from about 6 inches at the lowest elevations to approximately 25inches at the highest elevations. The variation in elevation and precipitation produce threedifferent climate zones: upland, semi-desert, and desert. At the highest elevations, precipitationfalls primarily in the winter as snow. The majority <strong>of</strong> rainfall in the semi-desert areas occursduring the summer months as intense but localized thunderstorms. The climatic zones for theGSENM are summarized in Table 1-2 (BLM, 1999).Table 1-2Climate zones for the GSENM including Paria River <strong>Water</strong>shedDesert Semi-desert UplandPrecipitation (inches) 6 to 8 8 to 12 12 to 16Soil temperature (degrees F) 50 to 57 47 to 55 43 to 50Frost Free Period (days) 170 to 300 125 to 170 100 to 125Elevation (feet) 4,000 to 4,800 4,800 to 6,200 6,200 to 7,500The weather station at the town <strong>of</strong> Tropic, <strong>Utah</strong> (6295 feet elevation) is the closest long termclimate station (Station Number 428847). Data was obtained from the Western RegionalClimate Center (WRC) operated by the Desert Research Institute (Reno, Nevada), aclearinghouse for the National Climatic Data Center.The average monthly temperatures and average total precipitation for the 52-year period areshown in Table 1-3. The months <strong>of</strong> June, July and August are the warmest months during theyear with average maximum temperatures between 80 - 85 degrees Fahrenheit. The higherprecipitation in the late summer is due to the monsoon-type weather that influences climate insouthern <strong>Utah</strong>. Additional climatic summaries for the Paria weather station (428847) areprovided in Appendix 5.Table 1-3Monthly Climate Summary, Tropic <strong>Utah</strong> (428847)Jan Feb Mar Apr May Jun Jul Aug Sep Oct Nov Dec AnnualAverage Max. Temperature (F) 41 46 52 61 70 80 85 83 76 65 52 43 62.7Average Min. Temperature (F) 15 19 24 30 37 45 52 50 43 34 24 17 32.3Average Total Precipitation (in.) 1 1 1 0.7 0.7 0.5 1.1 1.8 1.2 1.2 0.9 0.9 12.088
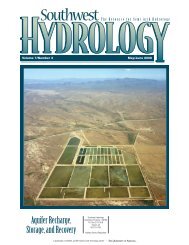
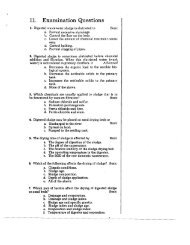
<strong>Utah</strong> is experiencing a drought cycle that has influenced both the flow and TDS measurements inthe Paria River system. Previous droughts occurred during 1896-1905, 1930-36, 1953-65, 1974-78, and more recently during 1988-93 and 1999-2002 (USGS 2003). Southern <strong>Utah</strong> beganexperiencing drought conditions during the winter <strong>of</strong> 1998-99. By 2000, drought conditionswere evident throughout all <strong>of</strong> <strong>Utah</strong>. The current drought (1999-present) is generally comparablein length and magnitude to previous droughts. During 2002, the fourth straight year <strong>of</strong> nearlystatewide drought conditions, some areas <strong>of</strong> <strong>Utah</strong> experienced record-low stream flows. Severalrecord-low stream flows occurred in streams with records dating back to the 1900s.The intensity and duration <strong>of</strong> the drought is illustrated by precipitation for the recent 10-yearperiod (Figure 1-2) prepared by the <strong>Utah</strong> <strong>Division</strong> <strong>of</strong> <strong>Water</strong> Resources for the SoutheastColorado River Basin 2 . The figure uses a water year, which runs from the previous October 1 stthrough September 30 th .Precipitation (inches)35302520151050Southeast Colorado River BasinAverage Precipitation for 3 Mountain Snotel Sites200420032002200120001999199819971994199519961993<strong>Water</strong> Years(dashed line - 30-year average annual precipitation 1961-1991)Figure 1-2 Average Precipitation for Southeast Colorado for the Most Recent 10-YearPeriod (<strong>Utah</strong> <strong>Division</strong> <strong>of</strong> <strong>Water</strong> Resources website)The recent five-year period starting with <strong>Water</strong> Year 2000 (October 1999) is well below theaverage precipitation when compared to the 30-Year average annual precipitation for the region.The TDS data available in STORET needs to be interpreted in the context <strong>of</strong> the drought whenmaking policy and regulatory decisions.2 Basin Drought Reports. <strong>Utah</strong> <strong>Division</strong> <strong>of</strong> <strong>Water</strong> Resources.http://www.water.utah.<strong>gov</strong>/droughtconditions/BasinDroughtReports/SeColorado/default.asp9
1.4.5 Surface <strong>Water</strong> HydrologyMap 1, <strong>Water</strong>shed Overview, shows the primary stream network. Although indicated as acontinuous blue line many <strong>of</strong> the stream reaches are not perennial. BLM roughly estimated that10% <strong>of</strong> the 2,500 miles <strong>of</strong> stream channels and washes on the GSENM are perennial, (BLM1999). The map delineates the 303(d) Listed Sections <strong>of</strong> the Paria River (Reach-1 and Reach-3)in red. The middle section <strong>of</strong> the watershed is not listed as a water quality limited streamsegment.Paria River Reach-1 includes the headwaters <strong>of</strong> the Paria River and four major tributaries.Tropic Ditch is used for irrigation in the irrigated lands near the town <strong>of</strong> Tropic, bringing inirrigation water originating in the Sevier River basin. A smaller irrigation tract occurs within thevicinity <strong>of</strong> Cannonville and Henrieville. <strong>Water</strong>shed area and elevation are summarized in Table1-4.The lower listed section, indicated as Reach-3 on Map 1 includes the Paria River from theArizona-<strong>Utah</strong> Stateline to the confluence with Cottonwood Creek. Two major tributaries enterwithin the listed section; Sand Gulch that runs along Highway 89, and Kitchen Corral Creek thatdrains a large subwatershed on the western side <strong>of</strong> the basin. In addition, there are a number <strong>of</strong>washes and spring systems that drain into this reach <strong>of</strong> the river. The quantity and quality <strong>of</strong>water in these potential tributaries however is unknown.<strong>Water</strong>shedTable 1-4<strong>Water</strong>shed Characteristics within the Paria Study AreaStreamMilesSq miElevation (ft)minimumElevation (ft)maximumElevation (ft)meanRiver MileIndexParia River Reach-1 21.0 39 to 60Rock Springs Creek 1 17.8 57.4 5,431 9,245 6,579 39Henrieville Wash 15.4 63.6 5,741 10,073 6,914 46Yellow Creek 9.3 15.7 5,669 8,292 6,628 50Henderson Creek 12.2 29.2 6,093 10,270 7,752 50.5Tropic Ditch 6.5 28.8 6,082 8,290 7,031 51Paria River Reach-3 19.4 0 to 19.5Kitchen Corral Creek 2 46.8 325.8 4,323 9,392 6,178 0.1Sand Gulch 14.9 40.3 4,360 6,712 5,293 9.5Paria River TMDL Reach 3Notes to Table: River/creek miles are approximate and measure the length <strong>of</strong> the primary channel as indicatedas the blue and red lines on Map 7. 1 Rock Springs Creek with Wiggler Wash tributary as headwaters. 2Kitchen Corral Creek with Deer Springs Wash tributary as headwaters.Narrative Description <strong>of</strong> Surface Hydrology in the Paria River BasinThe Paria River drains the GSENM's west central area into Arizona and eventually the ColoradoRiver. The towns <strong>of</strong> Tropic, Cannonville, and Henrieville, located high in the drainage, are thehighest concentration <strong>of</strong> private and municipal water rights. Most <strong>of</strong> the mainstem <strong>of</strong> the PariaRiver within the GSENM flows on a perennial basis, with small reaches near the upper andlower extremities <strong>of</strong> the river within the Monument that are typically dry. The flowing reachesare fed by subsurface flows, springs and other groundwater expressions, and by bank storageafter high flows.10
A four-mile section <strong>of</strong> Cottonwood Creek is also perennial, but the creek is normally dry about 2miles above its confluence with the Paria River. The gaining reaches <strong>of</strong> the Paria River andCottonwood Creek are followed by losing reaches that are intermittent, flowing only afterprecipitation events. Little or no water storage occurs upstream <strong>of</strong> the GSENM. All upstreamdepletions result from direct diversions.A BLM assessment 3 noted that the Paria River is depleted but still flowing when it reaches thenorthern GSENM boundary. However, shortly after entering GSENM the Paria River commonlydries up for about one mile, then reappears and flows continuously until a point about four milesfrom where it again leaves the Monument boundaries. Outside the irrigation season, lesserupstream depletion results from the municipal uses <strong>of</strong> the towns <strong>of</strong> Tropic, Cannonville, andHenrieville. The USGS gage “Paria River near Cannonville”, with 20 years <strong>of</strong> record (1951-55and 1959-74), is located inside GSENM in the intermittent reach <strong>of</strong> the river, below the streamemerging from Little Dry Valley but upstream <strong>of</strong> the river’s confluence with Rock SpringsCreek, and shows a mean daily flow <strong>of</strong> 9.08 cubic feet per second (cfs) despite the intermittentcharacter <strong>of</strong> the stream in this reach.<strong>Water</strong> stored in Tropic Reservoir is imported from the Sevier River drainage via the “TropicDitch”. Upstream use has a more substantial impact on base flows near the northern boundary <strong>of</strong>the GSENM. Henrieville Creek contributes flow to the Paria River downstream from theirrigated lands. Three miles inside GSENM the Paria River becomes perennial at the confluencewith Rock Springs Creek.Other water-related concerns in the Paria River drainage relates to this stream as a source <strong>of</strong>sediment and salinity loading to the Colorado River system, largely as a result <strong>of</strong> the geologicformations through which it passes (claystone and siltstone <strong>of</strong> the Chinle Formation and TropicShale).US Geological Survey (USGS) Stream Gaging StationsThere are two USGS stream gaging stations located within the Listed Sections: one in Reach-1 atParia River near Cannonville, <strong>Utah</strong>; and the second station on Reach-3 at Paria River nearKanab, <strong>Utah</strong>. The USGS gaging station number, name, and period <strong>of</strong> data coverage aresummarized in Table 1-5. The locations <strong>of</strong> these gaging stations are shown on Map 7. The PariaRiver near Kanab gage was restarted January, 2002. Data for the Paria River near Kanab gagewas initiated September, 2002, but the data is not yet available.Table 1-5USGS Stream Gaging StationsUSGS Gage Station # USGS Gage Name Data Coverage093381500 Paria River near Cannonville, <strong>Utah</strong> 12/1950 - 09/1955 and 01/2002 - Present093381800 Paria River near Kanab, <strong>Utah</strong> 09/2002 - Present3 Chapter 3, Affected Environment. EIS for the Grand Staircase-Escalante National Monument. (BLM 1999).Note: The 1959-1974 stream gage records are only peak stream flow measurements.11
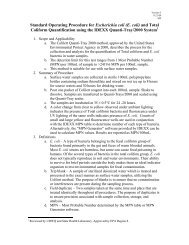
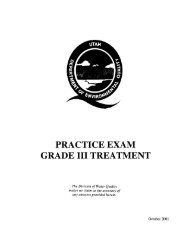
USGS Gage Paria River near Cannonville, <strong>Utah</strong>Flow (cfs)20181614121086420Jan Feb Mar Apr May Jun Jul Aug Sep Oct Nov Dec50th Percentile 20th Percentile 2002 2003Figure 1-3 Historical Flows Compared to 2002 and 2003 FlowsAverage monthly flow for 2002 and 2003, the period <strong>of</strong> analysis for this report, compared tohistorical monthly flows is shown in Figure 1-3. The historical record covers only the periodfrom January 1950 to September 1955, which is generally an insufficient period <strong>of</strong> time toestimate normal flow patterns; however, it is useful in placing the 2002 and 2003 flows intocontext. Years 2002 and 2003 experienced lower monthly flows than normal (50 th percentile)and below normal (20 th percentile) 4 flows in the winter and spring in 2002, and above averageflows in the fall. Year 2003 appeared to be comparable to the 1950’s record with above averageflow in September. It should be noted that USGS considers the period 1953-1965 as one <strong>of</strong> thecyclic drought periods in southeastern <strong>Utah</strong>.1.4.6 Groundwater HydrogeologyHydrogeology refers to the occurrence and movement <strong>of</strong> water below the Earth’s surface. Thesource <strong>of</strong> groundwater and its quality, and whether the Paria River loses or gains water along theListed Sections, are <strong>of</strong> particular importance. Surface water and groundwater interactions withsaline (marine) rocks and soils can significantly increase TDS concentrations in the Paria River.Groundwater is present in most <strong>of</strong> the consolidated rocks within the area. Freethy (1997)suggests that the period <strong>of</strong> major recharge for these aquifers was prior to 10,000 years ago duringthe waning stages <strong>of</strong> the last glacial period. Five regional aquifers occur within the watershed(Figure 1-4). In descending aquifer location, these are the:(1) Mesaverde aquifer, including Straight Cliffs and Wahweap Formations;(2) Dakota Formation aquifer;(3) Morrison Formation aquifer;(4) Entrada Formation aquifer; and(5) Glen Canyon aquifer including the Navajo, Kayenta, and Moenave (Wingate) Formations.4 The 50 th percentile is considered a “normal” year. The 20 th percentile is considered “below normal”.12
The Glen Canyon aquifer is the thickest and most extensive <strong>of</strong> the principal aquifers. The rocks<strong>of</strong> the Glen Canyon aquifer are exposed in the Grand Staircase and in the Escalante Canyonsregions <strong>of</strong> the Monument, but lie in the subsurface beneath the Kaiparowits Plateau to depthsapproaching 4,500 feet. The volume <strong>of</strong> water contained within the aquifer is estimated to begreater than 400,000,000 acre-feet (Freethy, 1997). In recharge areas <strong>of</strong> the Glen Canyonaquifer, or where water table conditions exist (unconfined parts <strong>of</strong> the aquifer), the water isgenerally fresh (
2.0 WATER QUALITY CRITERIA2.1 Beneficial Uses and 303(d) Listed SectionThe Paria River and its tributaries are identified as having the following beneficial uses: Class 2-B secondary contact recreation, Class 3C- non-game fishery, and Class 4 - agriculture (Standards<strong>of</strong> <strong>Quality</strong> for <strong>Water</strong>s <strong>of</strong> the State § R317-2, UAC).Two reaches <strong>of</strong> the Paria River are listed on <strong>Utah</strong>’s 2002 303(d) list (DWQ, 2002) for watersrequiring the development <strong>of</strong> a TMDL due to the exceedence <strong>of</strong> TDS criteria for beneficial useClass-4 (agriculture), including irrigation <strong>of</strong> crops and stock watering. The Listed Sections aredescribed in <strong>Utah</strong>'s Year 2000 303(d) list and summarized in Table 2-1. The 303(d) ListedSections, watershed boundaries, and other descriptive features are illustrated on Map 1.<strong>Water</strong>body ID <strong>Water</strong>bodyNameUT14070007-001 Paria River-1"Reach -1"UT14070007-005 Paria River-3"Reach-3"Table 2-1303(d) Listed Segments in the Paria River <strong>Water</strong>sheds<strong>Water</strong>body DescriptionParia River from confluence <strong>of</strong>Rock Springs Creek to headwatersParia River from Arizona-<strong>Utah</strong>Border to confluence <strong>of</strong>Cottonwood WashHUC Unit BeneficialUse ClassPerennialStreamMilesCause14070007 4 17.01 TDS14070007 4 12.09 TDS2.2 <strong>Water</strong> <strong>Quality</strong> Standards<strong>Utah</strong>’s Standards <strong>of</strong> <strong>Quality</strong> for <strong>Water</strong>s <strong>of</strong> the State (§R317-2, UAC) establishes the numericcriterion <strong>of</strong> 1,200 mg/L TDS for protection <strong>of</strong> beneficial use Class 4 (agricultural) waters. Inaddition, the <strong>Utah</strong> Standards <strong>of</strong> <strong>Quality</strong> for <strong>Water</strong>s <strong>of</strong> the State also provide numeric criteria forpH, boron, and metals as summarized in Table 2-2.Table 2-2<strong>Utah</strong> <strong>Water</strong> <strong>Quality</strong> Criteria for TDS and Related ParametersParameterTarget Parameters*Total Dissolved SolidsSecondary Parameters**pHBoronArsenicCadmiumChromiumCopperLeadSeleniumCriterion, Maximum Concentration1,200 mg/L6.5 - 9.0 pH units0.75 mg/L0.10 mg/L0.01 mg/L0.10 mg/L0.20 mg/L0.10 mg/L0.05 mg/L<strong>Utah</strong>'s <strong>Water</strong> <strong>Quality</strong> Standards clarify that TDS limits may be adjusted if such adjustment doesnot impair the designated beneficial use <strong>of</strong> the receiving water.14
Additional criteria are used to determine the degree <strong>of</strong> beneficial use support. <strong>Utah</strong>'s 2002 303dlist (DWQ, 2002) provides guidance on how to apply the numeric water quality criteria fordetermining the degree <strong>of</strong> beneficial use support. These criteria are used to evaluate the listingand delisting <strong>of</strong> a waterbody. The 303(d) criterion for assessing the degree <strong>of</strong> support forbeneficial use Class 4 is provided in Table 2-3.Table 2-3303(d) Criteria for Assessing Agricultural Beneficial Use Support - Class 4Degree <strong>of</strong>Use SupportFull SupportPartial SupportNon-SupportConventional Parameter(Total Dissolved Solids - 1,200 mg/L)Criterion exceeded in less than twosamples or in less than 10% <strong>of</strong> the samplesif there were two or more exceedances.Criterion was exceeded two times, andcriterion was exceeded in more than 10%but not more than 25% <strong>of</strong> the samples.Criterion was exceeded two times, andcriterion was exceeded in more than 25%<strong>of</strong> the samples.Toxic ParametersFor any one pollutant, no morethan one violation <strong>of</strong> criterion.For any one pollutant, two or moreviolations <strong>of</strong> the criterion, butviolations occurred in less than orequal to 10% <strong>of</strong> the samples.For any one pollutant, two or moreviolations <strong>of</strong> the criterion, andviolations occurred in more than10% <strong>of</strong> the samples.Based on the above criteria, <strong>Utah</strong>'s 2002 303(d) list identified two sections <strong>of</strong> the Paria River asnon-supporting based on exceedence <strong>of</strong> the TDS concentrations.Relation <strong>of</strong> Total Dissolved Solids to Beneficial UsesTDS is listed as a criterion for protection <strong>of</strong> agricultural uses because <strong>of</strong> the negative effect <strong>of</strong>high salinity on crop production. The major components <strong>of</strong> salinity are the cations: calcium,magnesium, and sodium; and the anions: chlorine, sulfate, and bicarbonate. Potassium andnitrate ions are minor components <strong>of</strong> salinity. Salinity reduces crop growth by reducing theability <strong>of</strong> plant roots to absorb water (known as salinity hazard), and is evaluated by therelationship <strong>of</strong> salt tolerance to crops. Unlike salinity hazard, excessive sodium does not impairthe uptake <strong>of</strong> water by plants, but does impair the infiltration <strong>of</strong> water into the soil. The growth<strong>of</strong> plants is, thus, affected by the availability <strong>of</strong> water. The reduction in infiltration <strong>of</strong> water canusually be attributed to surface crusting, the dispersion and migration <strong>of</strong> clay into the soil pores,and the swelling <strong>of</strong> expandable clays. The hazard from sodium is evaluated using the SodiumAbsorption Ratio (SAR), a ratio <strong>of</strong> sodium to calcium and magnesium in the irrigation water; inrelation to the irrigation water TDS (Tanji, 1990).Boron is the primary toxic element <strong>of</strong> concern in irrigation waters. Boron is an essential traceelement at low concentrations, but becomes toxic to crops at higher concentrations. Othertrace elements, as listed in Table 2-2 above, are potentially toxic to plants and animals. HighpH (pH > 9.0) directly and adversely affects infiltration as well as limiting calciumconcentrations and contributing to high SAR.15
3.0 IMPAIRMENT ANALYSIS3.1 Geographic Extent <strong>of</strong> the <strong>Water</strong> <strong>Quality</strong> Management PlanThe <strong>Water</strong> <strong>Quality</strong> Management Plan (WQMP) addresses only the 303(d) listed sections<strong>of</strong> the Paria River: Reach-1, Paria River from confluence <strong>of</strong> Rock Springs Creek toheadwaters, and Reach-3, Paria River from Arizona-<strong>Utah</strong> Border to confluence <strong>of</strong>Cottonwood Wash. These river sections are defined in the 303(d) listing (Table 2-1) andare shown on Figure 1-1 and Map 1.3.2 <strong>Water</strong> <strong>Quality</strong> Data in STORETThe most complete water quality monitoring station summaries and water quality observationdata for the Paria River exist in the STORET database. STORET, short for STOrage andRETrieval, is a repository for water quality, biological, and physical data and is used by stateenvironmental agencies, EPA and other federal agencies, universities, private citizens, and manyothers. Each data entry in the STORET database is accompanied by information on where thesample was taken (latitude, longitude, state, county, Hydrologic Unit Code, and a brief siteidentification), when the sample was gathered, the medium sampled (e.g., water, sediment, fishtissue), and the name <strong>of</strong> the organization that sponsored the monitoring.The STORET database for the Paria River contains 21 stations. These stations are listed inAppendix 3. Of these 21 stations, the Arizona Department <strong>of</strong> Environmental <strong>Quality</strong>, <strong>Water</strong><strong>Quality</strong> <strong>Division</strong>, provided data for seven stations. Of these seven stations, three are on the <strong>Utah</strong>border and within the Paria River Reach-3 Listed Section. DWQ and BLM collected data for theother 14 stations.There are 330 TDS measurements in the STORET database for the Paria River. The Arizonastations have specific conductance (SC) data, but no TDS data for the Paria River. There are 374SC measurements in the STORET database and 244 <strong>of</strong> these SC measurements have associatedTDS measurements for the Paria River. Therefore, TDS values were generated from the SC datausing a ratio between the measured TDS and SC data pairs. The conversion for TDS is 0.687times the SC (umhos/cm). It should be noted that a regression analysis was calculated, but was apoor predictor at lower values. For the Arizona data set, 76 TDS values were generated usingthe conversion factor. For the remaining STORET data, 130 TDS values were generated.The calculated TDS values were combined with the measured TDS values into one data series(marking the calculated values in bold text and using one decimal point to maintain thedistinction between calculated and measured values) as shown in Appendix 3. A summary <strong>of</strong>available TDS data for the Paria River, including the TDS values generated from SC data, aresummarized in Table 3-1.As shown in Table 3-1, seven <strong>of</strong> the 17 stations have more than 10% exceedence <strong>of</strong> the TDScriteria for the period <strong>of</strong> record. It should be noted that two <strong>of</strong> the STORET stations that exceedthe TDS criteria (599434 and 599435) are located on tributaries that flow to a segment <strong>of</strong> theParia River that are outside the Listed Sections.Statistical Assessment <strong>of</strong> DataA statistical summary <strong>of</strong> data for the 17 STORET stations listed in Table 3-1 is provided inAppendix 3. Although not all <strong>of</strong> these stations would likely be used in the TMDL calculations,they may shed some light on the distribution <strong>of</strong> TDS in the watershed and therefore aid inidentifying source contributions. For each station the data is tabulated and followed bydescriptive statistics. The statistics list the number, mean, median, standard deviation, minimum,maximum, number greater than the criteria, and percent exceedence.16
STORET Description MeanTDSTable 3-1Summary <strong>of</strong> STORET Stations and Available TDS DataMaxTDS% TDSExceedenceNo. <strong>of</strong>TDSValuesBeginDateEndDateNo. <strong>of</strong>TDSValues1993-2002Paria RiverReach -495191 Tropic Ditch at U12 229 267 0 11 09/17/97 09/25/02 20 1crossing495192 Paria River 3 Miles NNE 436 526 0 6 04/30/98 06/09/98 6 1<strong>of</strong> Tropic495187 Paria River at U12 923 1400 18 30 01/27/81 12/31/02 47 1crossing495190 Henrieville Wash at U- 387 530 0 27 08/20/98 12/30/02 38 112 crossing 8 Miles East<strong>of</strong> Cannonville495189 Henrieville Wash 3 914 2048 14 49 09/17/97 12/31/02 49 1Miles East <strong>of</strong>Cannonville495186 Paria River at1651 4030 50 16 10/04/00 12/31/02 18 1Kodachrome Basin Roadcrossing599434 Sheep Creek at 1553 2086 96 23 08/27/98 12/31/02 27 2Skutumpah Roadcrossing599435 Willis Creek at 1210 1642 80 10 09/21/98 11/27/02 15 2Skutumpah Roadcrossing599455 Paria River at Old Town 957 1640 7 54 08/13/98 08/12/02 85 2Site599471 Cottonwood Creek 657 1264 4 26 08/13/98 04/24/01 38 3Above Confluence withHackberry Canyon599454 Hackberry Canyon 287 481 0 43 10/06/98 04/24/01 48 3Above Confluence withCottonwood Creek495185 Paria River At US89 1174 2564 37 132 02/04/76 07/17/02 78 3crossing599465 Deer Spring Wash 822 1086 0 31 09/25/98 08/12/02 41 3Below Deer SpringRanch599461 Nephi Wash Spring 1062 1980 25 8 08/08/98 08/16/02 12 3Development101078 Paria River above 840 1156 0 10 10/01/98 07/28/00 10 3Buckskin Gulch101079 Buckskin Gulch 244 400 0 10 10/01/98 07/28/00 10 3101077 Paria River below 659 1116 0 9 03/03/99 07/28/00 9 3Buckskin GulchStations highlight in grey are located on tributaries to or on Paria River Reach-2, that is not on the 303(d) list.17
Reliability and Applicability <strong>of</strong> the TDS Data Set for the TMDLThe Paria River Listed Sections are comprised <strong>of</strong> two separate and disconnected stream reaches:Paria River Reach-1 the upper watershed, and Paria River Reach-3 the lower watershed. Themiddle reach (Paria River Reach-2), approximately 20 river miles in length, is not a 303(d) listedsection. The Listed Sections <strong>of</strong> the Paria River are discussed in detail below.Paria River Reach-1: From the Confluence <strong>of</strong> Rock Springs Creek to the Headwaters:Paria River Reach-1 is located near the communities <strong>of</strong> Tropic, Cannonville, and Henrieville inGarfield County. Tropic Ditch and Henrieville Wash are tributaries monitored within this ListedSection. TDS increases in concentration from the STORET stations higher in the watershed tothe Paria River at Kodachrome Basin Road (station 495186). The Paria River at this stationexceeds TDS criteria 50% <strong>of</strong> the time (see Table 3-1) indicating a source <strong>of</strong> salinity within thereach.Willis Creek enters below the Paria River Reach-1 Listed Section, near river mile 36 (see Map 7)and is therefore not a source for this Listed Section. Also, as an ephemeral stream, theconfluence <strong>of</strong> Willis Creek and Paria River Reach-2 is located more than 20 miles above theupper boundary <strong>of</strong> Paria River Reach-3, and is therefore not expected to be an important TDScontributor to the lower Listed Section. Willis Creek, and its tributary Sheep Creek, however,exhibit high TDS concentrations (see Table 3-1) indicating a salinity source on the west side <strong>of</strong>the watershed. These stations may be helpful in associating surface water and groundwater TDSwith saline rock types and soils.Paria River Reach-3: From the Arizona-<strong>Utah</strong> Border to Confluence <strong>of</strong> Cottonwood WashTwo STORET stations can be used to measure TDS entering the lower Paria River Reach-3Listed Section. Paria River at Old Town Site (599455) and Cottonwood Creek above confluencewith Hackberry Canyon (599471) exhibit fairly low TDS concentrations. The station inHackberry Canyon (599454), a tributary to Cottonwood Creek, has particularly low TDSconcentrations, indicating the variable pattern <strong>of</strong> TDS sources in this region. Ten milesdownstream from the Cottonwood Creek confluence with the Paria River the TDS concentrationsincrease again where Highway 89 crosses the Paria River (495185) and TDS exceeds the criteria37% <strong>of</strong> the time. This station on the Paria River at US89 (495185) represents the practicalboundary compliance point for TDS on the Paria River Reach-3 Listed Section.The remaining stations monitored in the watershed do not appear to contribute TDS to the ListedSections. Two stations located on tributaries to the Paria River, Deer Spring (599465) and NephiWash Spring (599461), are monitored on the west side <strong>of</strong> the watershed and are over 30 rivermiles from the confluence with the Paria River; and the Paria River station below theirconfluence (101078) has no TDS criteria exceedences. In addition, these small tributaries havevery low flows, generally less than 0.5 cfs.The lower three stations at the <strong>Utah</strong>-Arizona border illustrate again the extreme TDS variabilityalong the Paria River. The mean TDS concentration at the <strong>Utah</strong> border stations (101078, 101079and 101077) are 840 mg/L, 244 mg/L and 659 mg/L, respectively and well below the <strong>Utah</strong> TDScriteria.3.3 SOURCE ASSESSMENTIn evaluating the water quality data and land use patterns it is apparent that the predominantsource <strong>of</strong> TDS loading into the Paria River is from naturally occurring saline geologic formationsprevalent throughout the watershed, particularly Tropic shale. Therefore we are proposing thedevelopment <strong>of</strong> site specific criteria that reflects the natural background concentrations <strong>of</strong> TDSin the Paria River.18
4.0 TMDL/SITE-SPECIFIC CRITERIADevelopment <strong>of</strong> site-specific criteria is recommended for the Listed Sections <strong>of</strong> the Paria Riversince the information available indicates that the observed spike in TDS at the lower end <strong>of</strong> theParia River Reach-1 is due to inputs from a shallow alluvial aquifer. Paria River Reach-3 islocated in a sparsely populated and relatively undeveloped landscape with no knownanthropogenic sources <strong>of</strong> TDS.Guidance for developing site-specific criteria is summarized in two memorandums issued byEPA. A Region 8 Memorandum (Moon 1997) addressed procedures for Use AttainabilityAnalysis and Ambient Based Criteria, and a memorandum from EPA Office <strong>of</strong> Science andTechnology (Davies 1997) addressed the subject: Establishing Site-Specific Aquatic LifeCriteria Equal to Natural Background. These two memoranda were consulted for guidance anddirection in developing site-specific criteria for the Paria River. The applicable points from thesememoranda for developing site-specific criteria are:1. Site-specific criteria are allowed by regulation subject to EPA review and approval;2. Site-specific numeric aquatic life criteria may be set equal to natural background wherenatural background is defined as: background concentrations due only to nonanthropogenicsources; and3. Previous guidance provided the direction to use the 85 th percentile <strong>of</strong> the availablerepresentative data for natural ambient water quality conditions.The <strong>Utah</strong> Standards <strong>of</strong> <strong>Quality</strong> for <strong>Water</strong>s <strong>of</strong> the State provide for adjustment <strong>of</strong> site-specificstandards to background where the adjustment does not impair designated beneficial uses.“Total dissolved solids (TDS) limits may be adjusted if such adjustment does not impairthe designated beneficial use <strong>of</strong> the receiving water. The total dissolved solids (TDS)standards shall be at background where it can be shown that natural or un-alterableconditions prevent its attainment. In such cases rulemaking will be undertaken tomodify the standard accordingly.” 5Paria River Reach-1Two stations within Paria River Reach-1 were evaluated for setting site-specific criteria. TheParia River at Highway U12 Crossing station (495187) measures TDS in the Paria Riverupstream <strong>of</strong> Cannonville. The second station, Paria River at Kodachrome Basin Road crossing(495186) is located at the lower end <strong>of</strong> the reach and below Henrieville Wash.The data distribution for these two stations is illustrated using box and whisker plots (Figure 4-1). Box and whisker plots are commonly used for comparing distributions because the center,spread, and overall range <strong>of</strong> data are graphically apparent. In a box and whisker plot the ends <strong>of</strong>the box are the upper and lower quartiles, so the box spans the interquartile range, the median ismarked by a solid light line inside the box, the mean is marked as a solid heavy line, and thewhiskers are the two lines outside the box that extend to the highest and lowest observations.The TDS data used to construct the box and whisker plots for each station were collectedbetween August 2000 and December 2002. The box plot for the upper station (Paria River atHighway U12 Crossing - 495187) shows that the majority <strong>of</strong> data are below the statewide criteria5 Footnote to Table 2.1.4.1, Numeric Criteria for Domestic, Recreation, and Agricultural Uses, R317-2, Standards <strong>of</strong><strong>Quality</strong> for <strong>Water</strong>s <strong>of</strong> the State, UAC R-317-1, March 01, 2004, <strong>Utah</strong> Department <strong>of</strong> Administrative Rules.19
<strong>of</strong> 1,200 mg/L; however, at the downstream station (Paria River at Kodachrome Basin Roadcrossing - 495186) the TDS concentration increases, with 50% <strong>of</strong> the TDS samples exceedingthe 1,200 mg/L criteria.There are irrigation water withdrawals within the Paria River Reach-1; however, there is notsufficient agricultural use to explain the spike <strong>of</strong> TDS at the lower end <strong>of</strong> the reach. There isqualitative information on the high TDS associated with saline aquifers in the area, whichappears to be the most logical explanation for the increase in TDS concentrations observed.Paria River Reach-1 TDS Concentration (mg/L)40001- At U12 Xing 2- At Kodachrome Rd.TDS Concentration (mg/L)30002000<strong>Utah</strong> TDS Criteria1200 mg/L10000 1 2 3Figure 4-1 Concentration <strong>of</strong> TDS at Two Stations on Paria River Reach-1 Compared tothe <strong>Utah</strong> Standard for Irrigation <strong>of</strong> 1,200 mg/LStatistics for Paria River at Kodachrome Basin crossing (495186), the station with the highestTDS concentration, are summarized in Table 4-1. We recommend the site-specific criteria be2,500 mg/L. This will ensure that the site-specific standard is set at an appropriate level thatreflects the natural background concentrations <strong>of</strong> TDS.Table 4-1Statistics and Site-Specific Criteria for Paria River Reach-1Based on Station 495186 - Paria River at Kodachrome Basin Road CrossingStatisticTDS Concentration (mg/L)Count 15Mean 1,492Median 1,094Min 822Max 3,44485th Percentile 2,461State Criteria - Irrigation 1,200State Criteria - Stockwater 2,000Recommended Site-Specific Criteria 2,500Notes: Data period, October, 2000 to December 2002.20
Paria River Reach-3Two stations within Paria River Reach-3 were evaluated for setting site-specific criteria. PariaRiver at Old Town Site station (599455), measures TDS in the Paria River just above the ListedSection, at river mile 21.5. Cottonwood Creek flows into the river approximately two milesbelow this site. Cottonwood Creek has a low TDS concentration with a mean <strong>of</strong> 657 mg/L, lessthan in the Paria River at that point. The second river station, Paria River at US89 Crossing(495185), located at river mile 9.5 has the highest TDS concentration in the reach. As indicatedearlier, the TDS concentration decreases at the State line as measured by the Arizona statemonitoring stations (101078 and 101077). (Note: River Miles were measured from the <strong>Utah</strong>-Arizona state line to provide a point <strong>of</strong> reference.)The data distribution for these two stations are also illustrated in box and whisker plots (Figure4-2). The data used to construct these box plots included the entire data record at the stationsincluding the TDS values generated from correlation with specific conductance. The majority <strong>of</strong>data at the upper station, Old Town Site, is below the statewide criteria <strong>of</strong> 1,200 mg/L.Downstream 12 river miles the TDS concentration increases and 37% <strong>of</strong> the TDS samplesexceeded the 1,200 mg/L criteria.There are no current (or legacy) human activities in this primitive and mostly road-less reach thatwould explain this increase in TDS. There is evidence <strong>of</strong> some illicit <strong>of</strong>f road vehicle usethrough the river channel in this area but we feel through continued public education andenforcement it can be addressed before it becomes a significant problem in terms <strong>of</strong> TDS loadingThe source <strong>of</strong> TDS is considered a natural condition related to input to surface water from ahigher salinity aquifer as discussed in Section 1.4.6.Paria River Reach-3 TDS Concentration (mg/L)20001800TDS Concentration (mg/L)1600140012001000800600<strong>Utah</strong> TDS Criteria1200 mg/L4000 1 2 31- Old Town Site 2- at US 89 CrossingFigure 4-2 Concentration <strong>of</strong> TDS at Two Stations on Paria River Reach-3 Compared tothe <strong>Utah</strong> Standard for Irrigation <strong>of</strong> 1,200 mg/L21
Statistics for Paria River at US89 Crossing (495185), the station with the highest TDSconcentration, are summarized in Table 4-2. We recommend the site-specific criteria be 1,500mg/L. This will ensure that the site-specific standard is set at an appropriate level that reflectsthe natural background concentrations <strong>of</strong> TDS.Table 4-2Statistics and Site-Specific Criteria for Paria River Reach-3Based on Station 495185 - Paria River at US89 CrossingStatisticTDS Concentration (mg/L)Count 132Mean 1,174Median 1,121Min 325Max 2,56485th Percentile 1,467State CriteriaIrrigation 1,200Stockwater 2,000Recommended Site-Specific Criteria 1,500Notes: Data period, February 1976 to July 2002.22
5.0 PROJECT IMPLEMENTATION PLANS AND BMPsThe Canyonlands Soil Conservation District (CSCD) is coordinating with local stakeholders andagencies to develop Project Implementation Plans (PIPs) and a coordinated approach to improvewater quality within the watershed. The CSCD will establish criteria and select cooperators forimplementation <strong>of</strong> projects. These projects will be designed to minimize land use impacts onwater quality in the Paria River and its tributaries.The overall project goals are to reduce TDS loading in the Paria River watershed by improvingirrigation methods and conveyances, stabilizing stream channels and protecting stream banksfrom erosion. Surface run<strong>of</strong>f and percolation to the upper aquifers can be reduced or eliminatedthrough gated pipe, sprinkler or drip irrigation methods and/or by delivering irrigation waterthrough lined canals or pipe. Stream bank protection can be facilitated through ditch and canallining and establishing herbaceous cover along riparian corridors. Much <strong>of</strong> this work is currentlyunderway in other parts <strong>of</strong> the State under the auspices <strong>of</strong> the Salinity Control Programadministered by the Department <strong>of</strong> Interior (Bureau <strong>of</strong> Reclamation) and the Department <strong>of</strong>Agriculture (Natural Resources Conservation Service).The project goals are also intended to inform and educate the community concerning nonpointsource pollution and the importance <strong>of</strong> managing natural resources within the watershed. Toreach these goals, objectives and tasks are defined and a narrative description is provided foreach objective and task. At least one task is proposed to accomplish each objective. These tasksmay include specific activities such as milestones, outputs and identifying responsible parties.PIPs designed to reduce TDS concentrations in the Paria River incorporate Best ManagementPractices (BMPs) to address salt and sediment loading and improve the efficiency <strong>of</strong> irrigationmethods and conveyances, thereby minimizing surface run<strong>of</strong>f and percolation to the underlyingalluvial aquifer. By implementing appropriate BMPs, we hope to encourage adoption andimplementation <strong>of</strong> similar activities to address water quality problems throughout the entirewatershed.PIPs will be implemented throughout the next several years and will include water qualitymonitoring to evaluate their effectiveness. An evaluation and monitoring plan will also beimplemented to document progress in achieving improved water quality conditions, to revieweffectiveness <strong>of</strong> BMPs, and to provide feedback on the direction <strong>of</strong> overall watershed health.Based upon the results <strong>of</strong> this monitoring program, management strategies and implementationpriorities may change under the direction <strong>of</strong> the project sponsors.Successful projects combine a voluntary approach with cost-share assistance to identify keysystem components that improve irrigation water management and stream channel stabilization,while allowing management flexibility. A coordination plan is presented to identify the leadproject sponsor, describe local support for the projects, describe how the project will coordinatewith pertinent 319 and non-319 funded programs, and describe similar activities that are beingundertaken elsewhere in the watershed.No long-term funding is planned for operation or maintenance <strong>of</strong> these projects. Individuallandowners are responsible for operation and maintenance <strong>of</strong> BMPs throughout the projected life<strong>of</strong> the practices. Projects will be inspected by the project lead sponsor. The operation andmaintenance <strong>of</strong> the designed systems will be thoroughly explained to the landowner and theywill sign a document indicating their understanding and cooperation. If the landowner does notoperate or maintain the system according to NRCS protocols, they will be in violation <strong>of</strong> their319 contract and no longer eligible for NRCS assistance. Additionally they may risk having topay back the federally contributed portion <strong>of</strong> their project funding.23
5.1 Statement <strong>of</strong> NeedThe upper segment (Reach 1) <strong>of</strong> the Paria River is currently not meeting the designatedbeneficial uses for beneficial use 4 (agriculture) due to excessive TDS concentrations, which areattributed to natural and human sources. The middle reach <strong>of</strong> the Paria River is not listed as awater quality-limited segment. TDS concentrations in the lower segment (Reach 3) areattributed primarily to natural sources with no known human sources <strong>of</strong> salinity. This ProjectImplementation Plan addresses the primary human sources <strong>of</strong> dissolved solids identified withinthe TMDL analysis.<strong>Water</strong> from the Paria River is used for crop irrigation and stock watering. The small towneconomies <strong>of</strong> Tropic, Cannonville and Henrieville in the northern end <strong>of</strong> the basin rely onagriculture, which is dependent on irrigation from surface waters. Paria River flows are divertedto irrigation canals at numerous points along the river. The area is underlain by saline soils andgeologic formations and, as irrigation water is applied, the return flows convey dissolved solidsback into the river. Groundwater also contributes to an increase in TDS in some gainingsegments <strong>of</strong> the Paria River.The intent <strong>of</strong> the proposed program is to reduce nonpoint source pollution in the Paria Riverthrough application <strong>of</strong> improved irrigation methods and BMPs. By demonstrating thesepractices to area stakeholders, we hope to encourage them to adopt and implement similaractivities to address their own water quality problems. With the support and direction <strong>of</strong> theCSCD, priority will be given to implementation projects that feature efficient irrigation methodsand conveyances that minimize surface run<strong>of</strong>f and percolation into the underlying alluvialaquifer. Tours <strong>of</strong> these project sites, news articles and fact sheets will help encourage adoption<strong>of</strong> these practices elsewhere in the watershed.5.1.1 Project <strong>Water</strong> <strong>Quality</strong> PriorityAs required by 26-11-6 <strong>of</strong> the <strong>Utah</strong> Code Annotated 1953, waters <strong>of</strong> the State <strong>of</strong> <strong>Utah</strong> aregrouped into classes so as to protect State waters against controllable pollution. The designatedbeneficial uses for the Paria River are secondary contact recreation (Class 2-C), non-gamefishery (Class 3C), and agriculture (Class 4). The upper Paria River from its headwaters to theconfluence <strong>of</strong> Rock Springs Creek and the Lower Paria River from its confluence withCottonwood Creek to the <strong>Utah</strong>-Arizona border have been identified as impaired due toexceedence <strong>of</strong> <strong>Utah</strong>'s TDS criteria for protection <strong>of</strong> agricultural uses (Class 4 waters).The Paria River is divided into upper, middle, and lower segments. The upper Paria River(Reach-1) has its headwaters in Bryce Canyon National Park and Dixie National Forest thenflows south past the small towns <strong>of</strong> Tropic, Cannonville and Henrieville to the confluence withRock Springs Creek in the GSENM. The middle Paria River (Reach-2) runs from Rock SpringsCreek, south to its confluence with Cottonwood Creek and is entirely within the boundaries <strong>of</strong>the GSENM. The lower Paria River (Reach-3) flows from Cottonwood Creek south to the <strong>Utah</strong>-Arizona border. The middle reach <strong>of</strong> the Paria River has not been designated a 303(d) impairedwater for TDS and is not considered by this water quality management plan.5.1.2 Project GoalsThe overall project goals are to reduce nonpoint source TDS loading to the upper and lower PariaRiver watershed by decreasing the amount <strong>of</strong> salts entering the watershed from irrigated landsand stream channel erosion, in addition to informing and educating the community concerningnonpoint source pollution and the importance <strong>of</strong> managing natural resources within the24
watershed. TDS loading will be addressed through a combination <strong>of</strong> efficient irrigation andirrigation water management methods, and stream bank protection and channel stabilizationtechniques. Public education will be addressed by <strong>of</strong>fering tours <strong>of</strong> demonstration sites andpublishing news articles and fact sheets to encourage adoption <strong>of</strong> these practices elsewhere in thewatershed. Specific project goals are as follows:Goal #1: Reduce TDS and sediment loading to impaired reaches <strong>of</strong> the Paria River and itstributaries.Goal #2: Inform and educate the community concerning nonpoint source pollution and theimportance <strong>of</strong> maintaining and improving water quality within the watershed.Goal #3: Provide administrative services to project sponsors documenting matchingcontributions, tracking individual project progress, coordinating team efforts, andgenerating reports and data in a timely manner.5.1.3 Objectives and TasksGoal #1: Reduce TDS and sediment loading to impaired reaches <strong>of</strong> the Paria River and itstributaries.Objective 1: Improve irrigation techniques and irrigation water management practices.Task 1: Select and identify project cooperators.Output - Problem identification, cooperator selection. This will be lead by theCSCD cooperatively with the local work group and will be conducted in the earlyspring <strong>of</strong> the first contract year.Task 2: Develop irrigation water management plan using BMPs (irrigation watermanagement, improved irrigation systems and pipelines).Output - Irrigation water management plans. This will be conducted in spring <strong>of</strong>the first and third contract years. Design work will be performed by NRCS andCSCD staff.Task 3: Implement projects.Output - Implementation will occur between fall <strong>of</strong> the first and third contractyear through spring <strong>of</strong> the second and fourth contract year. Landowners willimplement projects. NRCS and CSCD staff will advise, review and certifyproject implementation.Task 4: Monitor according to methods described in Section 5.3.Output - <strong>Water</strong> quality data for project use and long-term monitoring. Data willbe collected four times; before implementation -once during spring run<strong>of</strong>f andonce during summer base flows; after project completion -once during springrun<strong>of</strong>f and once during summer base flow. These data will be collected by a team<strong>of</strong> agency pr<strong>of</strong>essionals made up <strong>of</strong> the landowner, NRCS, UACD, DWR, DEQ,USU extension, etc.25
Objective 2: Improve stability <strong>of</strong> the stream channel and minimize stream bank erosion inimpaired reaches <strong>of</strong> the Paria River and its tributaries.Task 5: Select and identify project cooperators.Output - Problem identification, cooperator selection. This will be lead by theCSCD cooperatively with the local work group and will be conducted in the earlyspring <strong>of</strong> the first contract year.Task 6: Develop stream bank protection plans using BMPs (ditch and canal lining, streamchannel stabilization and stream bank protection).Output - Stream bank protection plans. This will be conducted in spring <strong>of</strong> thefirst and third contract years. Design work will be performed by NRCS andCSCD staff.Task 7: Implement projects.Output - Implementation will occur between fall <strong>of</strong> the first and third contractyears through spring <strong>of</strong> the second and fourth contract years. Projects will beimplemented by landowners and NRCS and CSCD staff will advise, review andcertify project implementation.Task 8: Monitor according to methods described in Section 5.3.Output - <strong>Water</strong> quality data for project use and long-term monitoring. Data willbe collected four times; before implementation -once during spring run<strong>of</strong>f andonce during summer base flows; after project completion -once during springrun<strong>of</strong>f and once during summer base flow. These data will be collected by a team<strong>of</strong> agency pr<strong>of</strong>essionals made up <strong>of</strong> the landowner, NRCS, UACD, DWR, DEQ,USU extension, etc.Objective 3: Enhance the riparian corridor to reduce sediment run<strong>of</strong>f to the river and itstributaries.Task 9: Select and identify project cooperators.Output - Problem identification, cooperator selection. This will be led by theCSCD cooperatively with the local work group and will be conducted in the earlyspring <strong>of</strong> the first contract year.Task 10: Develop and riparian improvement plan using BMPs (tree/shrub establishment,establish herbaceous cover).Output - Riparian improvement plans. This will be conducted in spring <strong>of</strong> thefirst and third contract year. Design work will be performed by NRCS and CSCDstaff.Task 11: Implement projects.Output - Implementation will occur between fall <strong>of</strong> the first and third contractyear through spring <strong>of</strong> the second and fourth contract years. Projects will beimplemented by landowners and NRCS and Canyonlands Soil ConservationDistrict staff will advise, review and certify project implementation.26
Task 12: Monitor according to methods described in Section 5.3.Output - water quality data for project use and long-term monitoring. Data willbe collected four times; before implementation -once during spring run<strong>of</strong>f andonce during summer base flows; after project completion -once during springrun<strong>of</strong>f and once during summer base flow. This data will be collected by a team<strong>of</strong> agency pr<strong>of</strong>essionals made up <strong>of</strong> the landowner, NRCS, UACD, DWR, DEQ,USU extension, etc.Goal #2: Inform and educate the community concerning nonpoint source pollution and theimportance <strong>of</strong> maintaining and improving water quality within the watershed.Objective 1: Three tours will be conducted focusing on: 1) irrigation techniques, designs andproper management practices; 2) stable stream channels and stream bank erosionprotection; and 3) and enhanced riparian corridors.Task 13: Conduct improved irrigation technique and management tour.Output - The tour will be conducted either near project completion or shortlyafter. USU Extension, UACD, Canyonlands Soil Conservation District staff andlandowners will jointly plan this tour.Task 14: Conduct riparian area/stream bank tour.Output - The tour will be conducted either near project completion or shortlyafter. USU Extension, UACD, Canyonlands Soil Conservation District staff andthe landowner will jointly plan this tour.Objective 2: Share general and technical information with producers and area stakeholders.Task 15: Develop Fact Sheets and Newspaper ArticlesOutput - Fact Sheet series, Newspaper articles. These products will be completedduring implementation <strong>of</strong> the project and will be disseminated during tours afterproject completion and other times <strong>of</strong> the year. USU Extension, UACD, andNRCS will collaborate on the content <strong>of</strong> these products. USU Extension andUACD will jointly produce and disseminate them.Goal #3: Provide administrative services to project sponsors documenting matchingcontributions, tracking individual project progress, coordinating team efforts, andgenerating reports and data in a timely manner.Objective 1: Provide administrative services.Task 16: Track Match and Prepare ReportsOutput - Documented matching fund records and prepare Semiannual, Annualand Final reports. UACD staff will coordinate this effort. Completedsemiannually, at the end <strong>of</strong> the first contract year and again at the completion <strong>of</strong>the project. UACD staff will prepare these products.27
The following BMPs are considered for the Paria River <strong>Water</strong> <strong>Quality</strong> Management Plan andmay be used along with the information and education efforts to improve water quality in thewatershed. Numeric codes following each BMP indicate NRCS standards and specificationnumbers taken from the NRCS Field Office Technical Guide.1. Irrigation <strong>Water</strong> Management (449)2. Irrigation System (442, 443, 444)3. Pipeline (430)4. Ditch and Canal Lining (428)5. Stream Channel Stabilization (584)6. Stream bank Protection (580)7. Tree/Shrub Establishment (612)8. Riparian Herbaceous Cover (390)All projects will include BMP's and will be planned to the level <strong>of</strong> a total resource managementsystem in accordance with NRCS standards and specifications.The following procedures will be used to achieve Project Goals:1. Isolate water quality problem sources.2. Select and implement projects for watershed nonpoint source problems.3. Promote fair and cost effective nonpoint source pollution control.4. Monitor progress and evaluate economic benefits <strong>of</strong> implementing water qualityimprovements.5. Create a public awareness <strong>of</strong> water quality concerns and educate the public on how theycan protect water quality for themselves and the community. Promote communityinvolvement in project implementation activities by use <strong>of</strong> volunteer groups.5.1.4 PermitsAll appropriate permits will be secured as needed. Project sponsors will ensure compliance withall local, state, and federal regulations pertaining to project activities such as not disturbingsensitive habitats, not filling or degrading wetlands.5.1.5 Lead SponsorThe Canyonlands Soil Conservation District is the lead project sponsor. The CSCD isempowered by the State <strong>of</strong> <strong>Utah</strong> to devise and implement measures for the prevention <strong>of</strong>nonpoint source water pollution. Additionally the CSCD is able to enter into contracts, receiveand administer funds from agencies, and contract with other agencies and corporate entities topromote conservation and appropriate development <strong>of</strong> natural resources. Memoranda <strong>of</strong>Understanding with state, federal and local agencies along with individual cooperator agreementsempower the CSCD and individual cooperators to accomplish this work.5.1.6 Assurance <strong>of</strong> Project Operation and MaintenanceNo long-term funding is planned for operation or maintenance <strong>of</strong> these projects. Individuallandowners are responsible for operation and maintenance <strong>of</strong> BMPs throughout the projected life<strong>of</strong> the practices. Projects will be inspected by the project lead sponsor. The operation andmaintenance <strong>of</strong> the designed systems will be thoroughly explained to the landowner and they28
will sign a document indicating their comprehension. If the landowner does not operate ormaintain the system according to NRCS protocols, they will be in violation <strong>of</strong> their 319 contractand no longer eligible for NRCS assistance. Additionally they may risk having to pay back thefederally contributed portion <strong>of</strong> their project funding.5.2 Coordination Plan5.2.1 Lead Project SponsorThe CSCD will oversee detailed project development, planning, implementation, approval,creation <strong>of</strong> fact sheets and educational materials, administration and reporting. Some <strong>of</strong> theseduties will be transferred to UACD, NRCS, DEQ, USU Extension Service and others as perMemoranda <strong>of</strong> Understanding. The CSCD will be responsible for writing the final project reportpursuant to EPA and State requirements.UACD will oversee project administration, matching fund documentation, and contracting withagencies and individuals. They will also provide staffing assistance at the direction <strong>of</strong> theCSCD.5.2.2 Local SupportThe CSCD is coordinating with local stakeholders and agencies to develop a watershed plan t<strong>of</strong>urther define water quality problems in the Paria River watershed and to proceed with acoordinated approach to improve water quality within the watershed. The CSCD will establishcriteria and select cooperators for implementation <strong>of</strong> projects. This project will be used to showlandowners and cooperators BMPs for minimizing land use impacts on water quality in the PariaRiver and its tributaries.5.2.3 Coordination and LinkagesThe CSCD anticipates coordinating efforts with the following other entities, agencies, andorganizations:Cooperators - provide match for cost share, implementation <strong>of</strong> water quality plans<strong>Utah</strong> State University Extension - I&E, Technical assistanceNRCS - Technical planning design and oversight<strong>Utah</strong> Department <strong>of</strong> Agriculture & Food - Technical assistance, I&E assistance<strong>Utah</strong> <strong>Division</strong> <strong>of</strong> <strong>Water</strong> <strong>Quality</strong> - Standard program monitoring, Technical assistanceEPA - Financial assistance<strong>Utah</strong> Association <strong>of</strong> Conservation Districts - Administration, contracting, staff and technicalassistance<strong>Utah</strong> <strong>Division</strong> <strong>of</strong> <strong>Water</strong> Rights- Permits advisory and monitoring assistance<strong>Utah</strong> <strong>Division</strong> <strong>of</strong> <strong>Water</strong> Resources - Advisory5.2.4 Similar ActivitiesA stream bank stabilization demonstration project on the Paria River near Cannonville wasfunded with 319 funds in 2001. The project entailed sloping back the vertical stream bank,constructing six rock barbs and planting cottonwood poles. In addition, a canal-lining project forthe Tropic Ditch has been proposed and is likely to receive funding in the near future.29
5.3 Evaluation and Monitoring Plan5.3.1 Sampling and Analysis Plan GoalsMonitoring plan goals are to track BMP implementation and effectiveness, and evaluate progressin achieving improved water quality conditions as these nonpoint source controls areimplemented. The project lead sponsor has a strong commitment to demonstration <strong>of</strong> success <strong>of</strong>these pollution prevention and remediation strategies, but a limited monitoring budget, andtherefore the monitoring effort needs to be shared with DWQ and other agency cooperators.The monitoring goal is divided into two primary objectives:1) Implementation and effectiveness monitoring to evaluate project BMPs, and2) Trend monitoring to evaluate success in meeting water quality standards and goals.The lead sponsor, the CSCD, is the lead entity for carrying out the implementation andeffectiveness monitoring. The DWQ is the lead entity for completing trend monitoring.Implementation monitoring in comparison to effectiveness monitoring focuses on documentingthe number and location <strong>of</strong> practices or implementation projects applied to meet water qualitygoals. This requires developing an accounting system <strong>of</strong> practices, or using currently establishedreporting procedures familiar to the lead sponsor, to track project implementation.Effectiveness monitoring evaluates whether BMPs were successful at meeting their intendedpurpose, such as reducing water use, reducing infiltration or reducing bank erosion.Effectiveness monitoring does not require water quality sampling to be effective. Simplemethods, as described below, can be used to evaluate BMP effectiveness. Implementation andeffectiveness monitoring can be carried out by CSCD staff, volunteers, or associated personnel inthe agricultural community.Trend monitoring involves monitoring change in TDS and other parameters, such as discharge,over time. Detecting trends requires statistical design, commitment to long-term monitoring overtime and high sample frequency. Trend monitoring needs to be carried out by an organization,such as DWQ or USGS, with sufficient infrastructure and funding to assure long-termmonitoring.Work activities associated with these objectives include the following:1) Develop a project specific monitoring plan to evaluate BMP effectiveness as projects areapproved for monitoring. Since each project may be comprised <strong>of</strong> multiple BMPs ormultiple land-owners, only general monitoring approaches for effectiveness monitoring aredescribed in this document.2) Monitor water quality at long-term monitoring sites to demonstrate sustained and overallimprovements in water quality. This task will be completed by the DWQ or a team fromcooperating agencies.3) Maintain a common database <strong>of</strong> all data collected pertaining to the projects. The databasewill be developed and maintained by lead agency support staff at the <strong>Utah</strong> Association <strong>of</strong>Conservation Districts (UACD).4) Review data and include data summaries in annual reports. This activity will be performedas sub-tasks within tracking and reporting tasks.5.3.2 Implementation and Effectiveness MonitoringImplementation and effectiveness monitoring are the responsibility <strong>of</strong> the CSCD and cooperatingagencies such as NRCS, <strong>Utah</strong> State University Extension, and <strong>Utah</strong> Department <strong>of</strong> Agriculture.The monitoring methods therefore focus on those protocols that can be effectively carried out bynatural resource staff with an agricultural background.30
The Project Implementation Plan identifies three objectives with associated BMPs to achieveGoal #1, reducing TDS and sediment loading to the impaired water quality segments. Thegeneral monitoring approach that is appropriate for these objectives is described below.Objective #2 and #3 have been combined since the BMPs used to meet these objectives will besimilar or will directly overlap.Implementation MonitoringState and federal agricultural organizations affiliated with the CSCD have a number <strong>of</strong> standardreporting procedures that are used to track management practices. The Soil ConservationDistrict in consultation with these agencies is best suited to determine the tracking and reportingsystem that works for them. The kinds <strong>of</strong> information that the system should be capable <strong>of</strong>tracking are listed in Table 5-1, referenced in the EPA document "Techniques For Tracking,Evaluating, And Reporting The Implementation Of Nonpoint Source Control Measures" (EPA,1997).Table 5-1Example Variables for Tracking BMP implementationManagementMeasureErosion and SedimentControlFacility Wastewaterand Run<strong>of</strong>f fromConfined AnimalFacilitiesNutrient ManagementPesticideManagementGrazing ManagementUseful Variables Less Useful Variables AppropriateSamplingUnit•Area on which reduced tillage orterrace systems are installed•Area <strong>of</strong> run<strong>of</strong>f diversion systems orfilter strips per acre <strong>of</strong> cropland•Area <strong>of</strong> highly erodible croplandconverted to permanent cover•Quantity and percentage <strong>of</strong> totalfacility wastewater and run<strong>of</strong>f that iscollected by a waste storage ortreatment system•Number <strong>of</strong> farms following andacreage covered by approved nutrientmanagement plans•Percent <strong>of</strong> farmers keeping records andapplying nutrients at rates consistentwith management recommendations•Quantity and percent reduction infertilizer applied•Amount <strong>of</strong> fertilizer and manurespread between spreader calibrations•Number <strong>of</strong> farms with completerecords <strong>of</strong> field surveys and pesticideapplications following approved pestmanagement plans•Number <strong>of</strong> pest field surveysperformed on a weekly (or other timeframe) basis•Quantity and percent reduction inpesticides use•Number <strong>of</strong> cattle-hours <strong>of</strong> access toriparian areas per day•Miles <strong>of</strong> stream from which grazinganimals are excluded•Number <strong>of</strong> approved farmsoil and erosionmanagement plans•Number <strong>of</strong> grassedwaterways, gradestabilization structures,filter strips installed•Number <strong>of</strong> manurestorage facilities•Number <strong>of</strong> farms withapproved nutrientmanagement plans•Number <strong>of</strong> farms withapproved pesticidemanagement plans•Miles <strong>of</strong> fence installed•Field•Acre•Confinedanimal facility•Animal unit•Farm•Field•Application•Field•Farm•Application•Stream mile•Animal unit31
Effectiveness MonitoringWhere implementation monitoring is designed to answers the questions, “Were BMPs applied?Where and How Many?” Effectiveness monitoring should answer the question. “Were theBMPs effective at reducing pollutant inputs? Effectiveness monitoring is best carried out by thelocal sponsor because <strong>of</strong> their relationship with local growers and producers. Effectivenessmonitoring plans should be built into each implementation grant as a necessary part <strong>of</strong> doingbusiness. Although simple procedures can be used, effectiveness monitoring still requiresresources to design the project specific plan, make field measurements, and develop reports.The general monitoring approach is described below and organized by the ProjectImplementation Plan objectives listed under Goal # 1, reduction <strong>of</strong> TDS and sediment loading toimpaired reaches (Section 5.1.3). Below each objective are the BMPs that are assumed to meetthe objective, and the general monitoring approach which will accomplish effectivenessmonitoring. Objective #2 and #3 are grouped together since the monitoring approach needed toevaluate the objective are similar.Objective 1: Improve irrigation techniques and irrigation water management practices.Best Management Practices:1. Irrigation <strong>Water</strong> Management (449)2. Irrigation System (442, 443, 444)3. Pipeline (430)4. Ditch and Canal Lining (428)Monitoring Approach:These BMPs decrease salinity from irrigation by increasing the efficiency <strong>of</strong> irrigation systemsand thereby reducing the volume <strong>of</strong> surface run<strong>of</strong>f or infiltration through the saline soils.Implementation and effectiveness monitoring evaluates the quantity <strong>of</strong> water conserved and thedecrease in infiltration using these conservation practices compared to current methods.A simple monitoring approach is to calculate the quantity <strong>of</strong> water expected to be saved or thedecrease in infiltration that can be expected by applying the BMP to a specific project site. Amore quantitative approach is to measure infiltration rates before and after the practice todetermine the decrease in infiltration, however, the cost <strong>of</strong> monitoring becomes more expensiveand impractical for project sponsors.Objective 2: Improve stability <strong>of</strong> the stream channel and minimize stream bank erosion inimpaired reaches <strong>of</strong> the Paria River and its tributaries.Objective 3: Enhance the riparian corridor to reduce sediment run<strong>of</strong>f to the river and itstributaries.Best Management Practices:5. Stream Channel Stabilization (584)6. Stream bank Protection (580)7. Tree/Shrub Establishment (612)8. Riparian Herbaceous Cover (390)32
Monitoring Approach:BMPs for stream channel stabilization reduce inputs <strong>of</strong> sediment and salts by decreasing erosionwithin the near bank region <strong>of</strong> the stream channel. Since streambank erosion is a natural processBMPs should emphasize working with natural stream dynamics and avoid the use <strong>of</strong> hardenedstructures such as riprap that was used in the past. BMPs generally focus on revegetatingstreambanks by direct planting <strong>of</strong> riparian shrubs and forbs or bioengineering methods such asinstalling willow bundles.Implementation and effectiveness monitoring will evaluate the success in establishing a riparianbuffer and stabilizing the streambank. Planting success is evaluated by using a transect or gridmethod to count the number <strong>of</strong> live stems retained over time compared to that planted.Revegetation success for erosion control is evaluated by measuring soil cover, which can beestimated by measuring percent coverage at a portable plot (such as a 3 foot square) andrepeating the measurements over time along an established transect. Bank stabilization can bemeasured by using bank pins to directly measure bank erosion rates, establishing cross-sectionsthat can be accurately resurveyed over time, or by using photopoints.Details <strong>of</strong> methods for these approaches can be found in documents such as:• Bauer, S. B. and Burton, T. A. 1993. Monitoring protocols to evaluate water qualityeffects <strong>of</strong> grazing management <strong>of</strong> western rangeland streams. US EPA Region 10, <strong>Water</strong><strong>Division</strong>, Surface <strong>Water</strong> Branch. EPA 910/R-93-017.• Bedell, T. E., and Buckhouse, J. C. 1994. Monitoring primer for rangeland watersheds.US EPA Region 10, EPA 908-R-94-001.• Harrelson, C. C., Rawlins, C. L., and Potyondy, J.P. 1994. Stream channel referencesites: an illustrated guide to field technique. USDA Forest Service: General TechnicalReport RM-245.5.3.3 Trend MonitoringTrend monitoring is used to answer two primary questions: 1) Are water quality criteria beingmet; and 2) are TDS concentrations decreasing over time with implementation <strong>of</strong> BMPs? Sincesite-specific criteria were recommended as part <strong>of</strong> this <strong>Water</strong> <strong>Quality</strong> Management Plan, a thirdobjective should also be to determine if these revised criteria are appropriate for these riverreaches given more data over different climatic regimes.Trend monitoring for the purposes <strong>of</strong> this <strong>Water</strong> <strong>Quality</strong> Management Plan can be integrated intoDWQ’s on-going monitoring program by prioritizing critical stations and parameters. Existingmonitoring stations established by the DWQ and USGS can meet trend monitoring objectives ifsamples are collected with sufficient frequency. Generally DWQ currently collects samples atlong-term trend monitoring stations once every six weeks (eight times per year) to evaluatetrends in water quality.Sample LocationsThe four DWQ monitoring stations listed in Table 5-2 were selected since they provide an initialassessment <strong>of</strong> background conditions, they are the most data rich stations, and they are generallyaccessible, which increases the likelihood that the stations can be sampled with a greaterfrequency. The USGS flow gaging stations can provide long-term continuous flow records;33
however, these stations were reinitiated recently in 2002, and therefore are not sufficient toestablish flow statistics. Monitoring <strong>of</strong> flow at the DWQ stations will be required until such timethat a quantitative relationship (if any) can be established between the DWQ stations and theUSGS gages. Another option (if not already being done) is to request USGS to add TDSmonitoring to the parameters measured at the gaging stations.Table 5-2Suggested Monitoring Stations for Trend MonitoringStation ID Station Name Sampling LocationRationaleParia River Reach-1495187 Paria River at U12 crossing Located in the middle <strong>of</strong>Reach-1495186 Paria River at Kodachrome Basin Road Located at the bottom <strong>of</strong>Reach-1093381500 Paria River near Cannonville, <strong>Utah</strong> Stream flow gaging stationin Reach-1.Paria River Reach-3599455 Paria River at the Old Town Site Located upstream <strong>of</strong> Reach-3.495185 Paria River at US89 crossing Located lower section <strong>of</strong>Reach-3.093381800 Paria River near Kanab, <strong>Utah</strong> Stream flow gaging stationin Reach-3.Parameters <strong>of</strong>ConcernTDS & FlowTDS & FlowFlowTDS & FlowTDS & FlowFlowAgencyDWQDWQUSGSDWQDWQUSGSSample Parameters and FrequencyThe minimum list <strong>of</strong> parameters for trend monitoring at these stations is specific conductance(µmho/cm), total dissolved solids (mg/L), and flow (cfs). (Since USGS already monitorsdischarge continuously at the gaging stations it would be fairly simple to add continuous specificconductance monitoring, which can be used in lieu <strong>of</strong> TDS sampling. This would create anexcellent long-term data record for evaluating trends over time compared to using grab samples.)If grab samples are used at DWQ stations, sample frequency needs to be increased to a minimum<strong>of</strong> monthly frequency. The current target <strong>of</strong> every six weeks is not sufficient to evaluate trendsover time.5.3.4 Data Management, Storage, and ReportingThe data from this project will be maintained in an accessible common database. In addition,water quality and other relevant data will be transferred electronically to the DWQ database.Data will be compiled, analyzed and used in completing progress reports to the State NPScoordinator, DEQ, EPA and others. All water quality monitoring data will be transferredelectronically to the DWQ who regularly enter data into the STORET system. These data will beavailable to all interested parties and organizations. <strong>Quality</strong> Assurance and <strong>Quality</strong> Control willbe conducted according to the guidelines established in the <strong>Utah</strong> <strong>Water</strong> <strong>Quality</strong> Manual. Onlythose data that meet QA/QC standards will be entered into the project database.34
5.4 Long-Term Funding Plans for Operation and MaintenanceNo long-term funding is planned for operation or maintenance <strong>of</strong> these projects. Maintenance <strong>of</strong>these projects will be the responsibility <strong>of</strong> the private landowner. Projects will be inspected bythe project lead sponsor, UACD and NRCS staff. The operation and maintenance <strong>of</strong> thedesigned systems will be thoroughly explained to the landowner and they will sign a documentindicating their understanding and cooperation. If the landowner does not operate or maintainthe system according to NRCS protocols, they will be in violation <strong>of</strong> their 319 contract and nolonger eligible for NRCS assistance. Additionally they may risk having to pay back the federallycontributed portion <strong>of</strong> their project funding. We do anticipate increased interest in participation<strong>of</strong> BMP application and anticipate moving to a watershed-wide implementation phase in thefuture.5.5 Public InvolvementThere has been public involvement from the inception <strong>of</strong> the project, through proposaldevelopment, review, and submission. The CSCD will select project participants and giveoversight to project planning and implementation. This group actively seeks public input intothe prioritization <strong>of</strong> natural resource problems and concerns. We anticipate volunteer help to beprovided at many phases <strong>of</strong> the project.35
6.0 CONCLUSIONS AND RECOMMENDATIONSThe Paria River is located in Garfield and Kane Counties in southern <strong>Utah</strong> and flows from theheadwaters in Bryce Canyon National Park and Dixie National Forest through privateagricultural lands in the upper reach and south through the BLM administered Grand Staircase-Escalante National Monument (GSENM) into Arizona and the Colorado River below GlenCanyon Dam. The small towns <strong>of</strong> Tropic, Cannonville and Henrieville at the northern end <strong>of</strong> thebasin are based primarily on an agricultural economy dependent on irrigation from surfacewaters. Downstream from private lands near Henrieville Wash the river enters GSENM andflows through these primitive public lands for approximately 45 river miles to the Arizonaborder. The Paria River is situated in a dry desert climate and the majority <strong>of</strong> surface streamsand washes are intermittent. The Paria River is perennial for most but not all <strong>of</strong> its lengththrough the State <strong>of</strong> <strong>Utah</strong>.The <strong>Water</strong> <strong>Quality</strong> Management Plan addresses two distinct reaches <strong>of</strong> the Paria River. PariaRiver Reach-1 is the section from the confluence <strong>of</strong> Rock Springs Creek below the Henrieville tothe headwaters <strong>of</strong> the Paria River. Paria River Reach-3 extends from the Arizona-<strong>Utah</strong> Border tothe confluence with Cottonwood Wash. <strong>Utah</strong>'s Year 2002 303(d) list identifies Paria RiverReach-1 and Reach-3 as being impaired due to exceedence <strong>of</strong> <strong>Utah</strong>'s total dissolved solids (TDS)criteria for protection <strong>of</strong> agricultural uses, Class-4 waters. The middle section <strong>of</strong> the riverbetween these two reaches is not listed on the 303(d) list and is not addressed in the <strong>Water</strong><strong>Quality</strong> Management Plan. Based on the evaluation <strong>of</strong> available information on water quality,soils, rock types and groundwater aquifers we determined that the high TDS concentrations areprimarily a natural feature <strong>of</strong> the desert environment along the Paria River.In Paria River Reach-1 irrigated lands occur; however, the evaluation <strong>of</strong> water quality patternshas led us to conclude that exceedence <strong>of</strong> TDS criteria are primarily due to natural sources. Nospecific TDS load could be associated with irrigation practices. The Paria River Reach-3 isentirely contained within the Grand Staircase-Escalante National Monument and because <strong>of</strong> theremoteness and limited uses (primitive recreational activities), no human causes <strong>of</strong> impairmentcould be identified that contribute to TDS loading. Although illicit <strong>of</strong>f road vehicle use shouldbe addressed through continued public education and enforcement before it becomes asignificant problem. For these reasons, site-specific criteria as provided for by the Standards <strong>of</strong><strong>Water</strong> <strong>Quality</strong> for the <strong>Water</strong>s <strong>of</strong> the State (<strong>Utah</strong>) were recommended for the two listed reaches(Table 6-1).Table 6-1Recommended Site-Specific Criteria for TDS in the Paria River<strong>Water</strong>bodyIDUT14070007-001UT14070007-005<strong>Water</strong>bodyNameParia River Reach-1Paria River Reach-3<strong>Water</strong>body Description HUC Unit TDS Site-SpecificCriteria (mg/L)Paria River from confluence <strong>of</strong> 14070007 2,500Rock Springs Creek toheadwatersParia River from Arizona-<strong>Utah</strong> 14070007 1,500Border to confluence <strong>of</strong>Cottonwood WashAlthough no specific TDS loading were attributed to human sources, the Canyonlands SoilConservation District (CSCD) is taking the lead to reduce the possible sources <strong>of</strong> TDS loadingfrom agricultural activities. The CSCD will coordinate with local stakeholders and agencies to36
develop Project Implementation Plans to improve water quality within the watershed. TheCSCD has identified specific practices from the NRCS Field Office Technical Guide to reducepotential sources <strong>of</strong> salinity and sediments that change irrigation practices, provide streambankprotection, and enhance the riparian vegetation along the river and tributaries.An evaluation and monitoring program describes implementation, effectiveness and trendmonitoring to evaluate success in implementing BMPs and in reducing the concentration <strong>of</strong> TDSin the Paria River. The monitoring plan identifies implantation and effectiveness monitoringprocedures that can be completed by the Conservation District and affiliated agencies. The planalso describes the suggested approach for DWQ to measure trends in TDS concentrations overthe long term.37
7.0 REFERENCESBlanchard, P., 1986. Groundwater Conditions in the Kaiparowits Plateau Area, <strong>Utah</strong> andArizona, with Emphasis on the Navajo Sandstone. State <strong>of</strong> <strong>Utah</strong>, Department <strong>of</strong> NaturalResources Technical Publication 81, 87 p. (In BLM 1999).Bowers, W. E., 1972. The Canaan Peak, Pine Hollow and Wasatch Formations in the TableCliffs region, Garfield County, <strong>Utah</strong>. U.S. Geological Survey Bulletin 1331-B, 39 p.Bureau <strong>of</strong> Land Management (BLM), 1999. Grand Staircase-Escalante National MonumentApproved Management Plan Environmental Impact Statement. BLM, Cedar City, <strong>Utah</strong>.Bureau <strong>of</strong> Land Management (BLM), 2000. Grand Staircase-Escalante National MonumentApproved Management Plan and Record <strong>of</strong> Decision. BLM, Cedar City, <strong>Utah</strong>.Cobban, W. A., Dyman, T. S., Pollock, G. L., Takahashi1, K. I., Davis, L. E., and Riggin, D. B.,2000. Inventory <strong>of</strong> dominantly marine and brackish-water fossils from Late Cretaceousrocks in and near Grand Staircase-Escalante National Monument, <strong>Utah</strong>, in Sprinkel, D.A., Chidsey, T. C. and Anderson, P. B., editors, Geology <strong>of</strong> <strong>Utah</strong>'s Parks andMonuments: <strong>Utah</strong> Geological Association Publication 28, p. 579-589.Davies, Tudor, T., 1997. EPA Memorandum to <strong>Water</strong> Management <strong>Division</strong> Directors, Regions1-10. Establishing Site Specific Aquatic Life Criteira Equal to Natural Background.Nov. 5, 1997.Doelling, H. H., Blackett, R. E., Hamblin, A. H., Powell, J. D., and Pollock, G. L., 2000.Geology <strong>of</strong> the Grand Staircase-Escalante National Monument, <strong>Utah</strong>, in Sprinkel, D. A.,Chidsey, T. C. and Anderson, P. B., editors, Geology <strong>of</strong> <strong>Utah</strong>'s Parks and Monuments:<strong>Utah</strong> Geological Association Publication 28, p. 189-231.Environmental Protection Agency (EPA), 1999. Total Maximum Daily Load Program. Office<strong>of</strong> <strong>Water</strong>, Washington, D.C. http://www.epa.<strong>gov</strong>/owow/tmdl/intro.html. Last updatedAugust 12, 1999.Environmental Protection Agency (EPA), 1997. Techniques For Tracking, Evaluating, AndReporting The Implementation Of Nonpoint Source Control Measures, EPA 8410B-97-010, Office <strong>of</strong> <strong>Water</strong>, Washington, D.C. http://www.epa.<strong>gov</strong>/owow/nps/agfinal.pdfFreethy, G. W., 1997. Hydrogeology <strong>of</strong> the Grand Staircase-Escalante National Monument[Abs]: Learning From the Land, a science symposium sponsored by the BureauCretaceous Western Interior Seaway: Arizona, in Nations, J.D., and Eaton, J. G., <strong>of</strong> LandManagement and the Governor’s Office <strong>of</strong> Planning and Budget, November 4- 5, 1997,Cedar City, <strong>Utah</strong>. (In BLM 1999).Geological Society <strong>of</strong> America (GSA), 2002. The Geology <strong>of</strong> the Grand Staircase in Southern<strong>Utah</strong>: A Road Log and Guide for Public School Teachers. Geological Society <strong>of</strong>America 2002 Rocky Mountain Section Annual Meeting, Cedar City, <strong>Utah</strong> 10-11 May,2002.Hereford, R., 1997. Abstract - Environmental Change in Valleys <strong>of</strong> the Paria River. U.S.Department <strong>of</strong> Interior, Bureau <strong>of</strong> Land Management World Wide Web site:http://www.ut.blm.<strong>gov</strong>/monument/Science_and_Research/Science_Symposium/abstracts.html.38
Millennium Science & Engineering (MSE), 2003. Paria River Data Evaluation Report. Preparedfor <strong>Utah</strong> <strong>Division</strong> <strong>of</strong> <strong>Water</strong> <strong>Quality</strong>, Salt Lake City, <strong>Utah</strong>.Moon, Dave 1997. Memorandum on Use Attainability Analysis and Ambient Based Criteria,Ecosystem Protection and Remediation <strong>of</strong>fice, US Environmental Protection AgencyRegion 8, Denver Colorado.Peterson, M. V., 1994. Sand Dunes, sabkhas, streams and shallow seas: Jurassic paleogeographyin the southern part <strong>of</strong> the Western Interior Basin, in Caputo, M. V., Peterson, J. A., andFranczyk, K. J., editors, Mesozoic Systems <strong>of</strong> the Rocky Mountain Region, USA: RockyMountain Section, Society for Sedimentary Geology, p. 233-272.Pope, D. an Brough, C., Eds. 1994. <strong>Utah</strong>’s Weather and Climate. Publishers Press, Salt LakeCity, <strong>Utah</strong>.Stokes, W. L., 1988. Geology <strong>of</strong> <strong>Utah</strong>. <strong>Utah</strong> Museum <strong>of</strong> Natural History and <strong>Utah</strong> Geologicaland Mineral Survey. Salt Lake City, <strong>Utah</strong>.United States Geological Survey (USGS), 2003. Drought Conditions in <strong>Utah</strong> During 1999-2002:A Historical Perspective. U.S. Geological Survey, Salt Lake, <strong>Utah</strong>.<strong>Utah</strong> Administrative Code (UAC) R317-2. Standards <strong>of</strong> <strong>Quality</strong> for <strong>Water</strong>s <strong>of</strong> the State. August1, 2000.<strong>Utah</strong> <strong>Division</strong> <strong>of</strong> <strong>Water</strong> <strong>Quality</strong> (DWQ), 2000a. Standards <strong>of</strong> <strong>Water</strong> <strong>Quality</strong> for the <strong>Water</strong>s <strong>of</strong>the State. R317-2, <strong>Utah</strong> Administrative Code. <strong>Utah</strong> Department <strong>of</strong> Environmental<strong>Quality</strong> - <strong>Division</strong> <strong>of</strong> <strong>Water</strong> <strong>Quality</strong>. Revised March 17, 2000.<strong>Utah</strong> <strong>Division</strong> <strong>of</strong> <strong>Water</strong> <strong>Quality</strong> (DWQ), 2002. <strong>Utah</strong>’s Year 2002 303(d) List <strong>of</strong> <strong>Water</strong>s. <strong>Utah</strong>Department <strong>of</strong> Environmental <strong>Quality</strong> - <strong>Division</strong> <strong>of</strong> <strong>Water</strong> <strong>Quality</strong>. August 2002.Webb, R. H., 1985. Late Holocene flooding on the Escalante River, south-central <strong>Utah</strong>:University <strong>of</strong> Arizona, PhD Thesis, 204 p. (In BLM, 1999).39