Create successful ePaper yourself
Turn your PDF publications into a flip-book with our unique Google optimized e-Paper software.
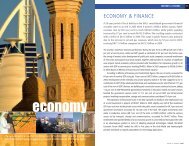
78 UNITED ARAB EMIRATES YEARBOOK 2006 <strong>ECONOMIC</strong> <strong>DEVELOPMENT</strong>79PUBLIC FINANCE 2004The Consolidated Government Finance AccountREVENUETotal revenues increased by 22.6 per cent in 2004 to Dh94.4 billion, against Dh77 billion in 2003, mainlydue to the increase in oil and gas earnings. Tax revenues (customs duties, other charges and revenues)increased by 31.4 per cent to Dh9.3 billion, compared to Dh7 billion in 2003, forming 9.8 per cent oftotal revenues. Customs revenues also rose by Dh591 million to reach Dh3 billion. Non-tax revenuesincreased by 21.7 per cent to Dh85.2 billion, against Dh70 billion in 2003, forming 90.2 per cent oftotal revenues. This was attributed to a rise of Dh16.6 billion (29.2 per cent) in receipts from oil andgas exports (Dh73.3 billion in 2004 against Dh56.7 billion in 2003). Likewise, profits of shareholdingcompanies rose by 13.2 per cent Dh3.3 billion in 2004, compared to Dh2.9 billion in 2003.EXPENDITUREExpenditure increased in 2004 by Dh3.8 billion (4.2 per cent) to Dh95.3 billion, against Dh91.4 billion in2003. Current expenditure constituted 84 per cent of total expenditure, realising Dh80 billion as opposedto Dh74.3 billion in 2003. Expenditure on salaries and wages rose by Dh325 million (2.1 per cent) toDh15.5 billion. Expenditure on goods and services also increased by Dh459 million to Dh24.3 billion.Expenditure on subsidies and transfers rose by Dh873 million (8.4 per cent) to Dh11.3 billion, and otherunclassified current expenditure increased by Dh4.1 billion (16.4 per cent) to Dh29 billion. Developmentexpenditure decreased by 3 per cent to Dh15.6 billion, against Dh16 billion in 2003. Meanwhile, at–Dh267 million, loans and equity participations declined by 123.2 per cent compared to 2003.THE DEFICITThe deficit narrowed by 94.1 per cent to Dh855 million in 2004, compared to a deficit of Dh14.4billion in 2003. This deficit was financed, in its entirety, by returns on government investments.MONETARY AND CREDIT POLICYDirham Exchange RateDue to its fixed peg to the US dollar, the dirham depreciated as a result of depreciation of the US dollaragainst most major currencies during 2004. Key depreciations were against the euro (9.2 per cent),the pound sterling (10.2 per cent), the Japanese yen (7.3 per cent), the Swiss franc (7.3 per cent) andthe SDR (IMF ‘Special Drawing Right’ basket of currencies) (5.5 per cent). The rate of exchange of thedirham remained unchanged against all GCC currencies at the end of 2004 compared to its rate atthe end of 2003.Dirham Exchange Rate Index(Foreign Currency Units Per Dirham) (2000=100)Currency 2000 2001 2002 2003 2004US Dollar 100.0 100.0 100.0 100.0 100.0Japanese Yen 105.0 123.0 121.8 112.9 104.7Euro 109.4 113.0 106.1 89.5 81.3Pound Sterling 106.3 112.0 106.8 98.7 88.6Swiss Franc 106.4 105.6 98.0 85.0 78.8SDR 104.0 107.8 106.0 98.1 92.7Millions of Dhs100,00080,00060,00040,00020,000TOTAL EXPENDITURETOTAL EXPENDITUREDEFICITTOTAL REVENUEDEFICIT02000 2001 2002 2003 2004Items In millions of Dh 2003* 2004**REVENUE 77,012 94,415Tax Revenue ...................................................................... 7,044 9,255Customs ........................................................................ 2,449 3,040Other ............................................................................ 4,595 6,215Non-Tax Revenue .............................................................. 69,968 85,160Oil and Gas ................................................................... 56,738 73,322Joint Stock Corporations ................................................ 2,935 3,322Other ............................................................................ 10,295 8,516EXPENDITURE 91,433 95,270Current Expenditure ............................................................ 74,253 79,986Salaries and Wages ........................................................ 15,159 15,484Goods and Services ........................................................ 23,801 24,260Subsidies and Transfers .................................................. 10,408 11,281Other Unclassified .......................................................... 24,885 28,961Development Expenditure ................................................... 16,028 15,551Loans and Equity Participation .......................................... 1,152 -267Local ............................................................................. -810 3,154Foreign .......................................................................... 1,962 -3,421Surplus (+) or Deficit (-) ............................................................. - 14,421 - 855Financing ............................................................................. 14,421 855Changes in net Government Deposits with Banks .......... 2,383 -1,574Other1 ........................................................................... 12,038 2,429Source: Central Bank Annual Report 2004 with data drawn from Ministry of Finance and Industry and Local Government Finance Departments*Adjusted data ** Preliminary data 1 Returns of government’s investments.