You also want an ePaper? Increase the reach of your titles
YUMPU automatically turns print PDFs into web optimized ePapers that Google loves.
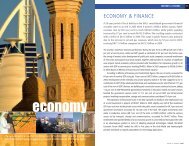
76 UNITED ARAB EMIRATES YEARBOOK 2006<strong>ECONOMIC</strong> <strong>DEVELOPMENT</strong>77But prosperity is not merely a national issue since the <strong>UAE</strong>’s growth is inextricablylinked to regional and global conditions and, increasingly, to the existence ofbeneficial trading conditions. Free trade agreements, such as the FTA that hasbeen under negotiation with the United States, are expected to yield benefitsacross a broad front, leading to freer access to key markets while promotingtechnology transfers to the <strong>UAE</strong>’s private sector, boosting domestic industrialgrowth and hastening further economic diversification, thus helping to broadenthe economy. Such FTAs depend upon synergies in national economic policies.Based on constant prices for 2000, oil and natural gas production output grewby a relatively modest 2.9 per cent (limited by OPEC quotas), reaching Dh93.63billion in 2004, compared to Dh91.03 billion in 2003. However, when viewedat current prices the sector jumped by 33.8 per cent, from Dh92.14 billion toDh123.26 billion, tracking a 33.8 per cent increase in average oil prices in thatperiod. Taking the economy as a whole, the 7.4 per cent increase in GDP, measuredat 2000 constant prices, translated into a 17.8 per cent increase at current prices,with the GDP figure rising to Dh378.76 billion (US$103.2 billion) in 2004, comparedto Dh321.75 billion in 2003.The weighted average oil price in 2004 was US$36.10 per barrel, compared toUS$28.11 in 2003. In line with this, the value of oil exports increased by 34 per cent,from Dh81.2 billion in 2003 to Dh108.8 billion in 2004, while gas exports grewby 19.9 per cent to reach Dh17.2 billion. The export value of petroleum productsincreased by 16.7 per cent, reaching Dh15.2 billion. These increases were majorfactors in improving the overall balance of payments, achieving a surplus ofDh12.8 billion, compared to a surplus of Dh4.73 billion in 2003. The currentaccount balance showed an equally impressive increase, reaching Dh47.51 billionin 2004, compared to Dh27.73 billion in 2003, a 71 per cent rise.Continued development of the non-oil sector (9.4 per cent increase at constantprices and 11.2 per cent increase at current prices), reflects the Government’ssuccessful focus on economic diversification. The sector’s overall contribution toGDP remains high (71.7 per cent at constant prices and 67.4 per cent at currentprices). Whilst its overall role shows a small gain at constant prices, it is notsurprising, considering the sharp rise in oil prices, that there is a small decreasein the non-oil sector’s overall role in GDP when compared to its 2003 level on thebasis of current prices.When measured at constant (2000) prices the manufacturing sector showedthe highest growth rate among the non-oil sectors, rising from Dh39.2 billion in2003 to Dh45 billion in 2004, a 15 per cent increase. This was also reflected bya rise in its overall contribution to GDP from 13 per cent in 2003 to 14 per centin 2004. The manufacturing sector is closely linked to the oil and gas sector sincea key element is liquified gas and petroleum products. Thus the increase in refiningcapacity made a vital contribution to the manufacturing sector.Source: Central Bank of the <strong>UAE</strong>; Ministry of Planning; Customs Departments of Local GovernmentsSelected Economic IndicatorsPopulation (000) GDP in Current Prices (Dh billion) GDP at Constant 2000 Prices (Dh billion)Real GDP Growth Rate (%) Consumer Price Index (%) Employees (000)Final Consumption (%) Fixed Capital Formation (%) Total Exports & Re-Exports (Dh billiuon)Crude Oil Exports (Dh billion) Total Re-Exports (Dh billion) Total Imports (Dh billion)Trade Balance (Dh billion) Current Account Balance (Dh billion) Capital Account Balance (Dh billion)Balance of Payments Overall (Dh billion) Average Oil Price US$ per barrel) Average AED Exchange Rate (Dh per US$)2003 2004Population (000) 4,041 4,320GDP, in Current Prices, (Dh billion) 321.8 378.8GDP, at constant 1995 prices, (Dh billion) 301.3 323.6Real GDP Growth Rate (%) 11.9 7.4Changes in Consumer Price Index (%) 109.1 114.2Employees (000) 2,334 2,459Nominal Rate of Growth of Final Consumption (%) 10.5 14.1Nominal Rate of Growth of Fixed Capital Formation (%) 17.1 11.1Total Exports & Re-Exports (Dh billion) 1 246.56 303.90Crude Oil Exports (Dh billion) 81.22 108.79Total Re-Exports (Dh billion) 2 86.06 101.78Total Imports (CIF) (Dh billion) 3 191.24 226.18Trade Balance (FOB) (Dh billion) 78.26 104.86Current Account Balance (Dh billion) 27.73 47.51Capital and Financial Account Balance (Dh billion) -19.58 -21.21Balance of Payments Overall (Dh billion) +4.73 +12.83Average Oil Price (US$ Per Barrel) 28.11 36.10Dh Exchange Rate for each US Dollar 4 3.6725 3.6725* Preliminary estimates quoted in Central Bank Statistical Bulletin 23/ 41 Including Exports from Free Zones and Re-Export of Non-Monetary Gold.2 Including Re-Export of Non-Monetary Gold.3 Including Free Zones Imports and Non-Monetary Gold Imports.4 Effective Nov. 1997, the Dh Exchange Rate Has Been Adjusted to Dh3.6725 for Each US Dollar.