
You also want an ePaper? Increase the reach of your titles
YUMPU automatically turns print PDFs into web optimized ePapers that Google loves.
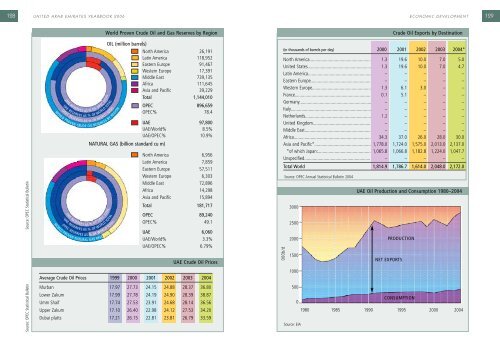
000b/d128 UNITED ARAB EMIRATES YEARBOOK 2006<strong>ECONOMIC</strong> <strong>DEVELOPMENT</strong> 129Source: OPEC Statistical Bulletin Source: OPEC Statistical Bulletin<strong>UAE</strong><strong>UAE</strong>OPECWORLD PROVEN CRUDE OIL<strong>UAE</strong><strong>UAE</strong>WORLD PROVENOPECRESERVESRESERVESRESERVESRESERVESRESERVESRESERVESAS %AS % OF WORLDAS %NATURALOFTOTALOPECRESERVESWorld Proven Crude Oil and Gas Reserves by RegionOIL (million barrels)BYOF WORLDTOTALTOTALREGIONNATURAL GAS (billion standard cu m)AS %AS %OFTOTALOPECAS % OF WORLDOF WORLDBYGAS RESERVESTOTALTOTALREGIONNorth America 26,191Latin America 118,952Eastern Europe 91,467Western Europe 17,391Middle East 739,135Africa 111,645Asia and Pacific 39,229Total 1,144,010OPEC 896,659OPEC% 78.4<strong>UAE</strong> 97,800<strong>UAE</strong>/World% 8.5%<strong>UAE</strong>/OPEC% 10.9%North America 6,956Latin America 7,859Eastern Europe 57,511Western Europe 6,303Middle East 72,896Africa 14,298Asia and Pacific 15,894Total 181,717OPEC 89,240OPEC% 49.1<strong>UAE</strong> 6,060<strong>UAE</strong>/World% 3.3%<strong>UAE</strong>/OPEC% 6.79%<strong>UAE</strong> Crude Oil PricesAverage Crude Oil Prices 1999 2000 2001 2002 2003 2004Murban 17.97 27.73 24.15 24.88 28.37 36.80Lower Zakum 17.99 27.78 24.19 24.90 28.39 38.87Umm Shaif 17.74 27.53 23.91 24.68 28.14 36.56Upper Zakum 17.10 26.40 22.98 24.12 27.53 34.20Dubai platts 17.21 26.15 22.81 23.81 26.79 33.59Crude Oil Exports by Destination(in thousands of barrels per day) 2000 2001 2002 2003 2004*North America................................................... 1.3 19.6 10.0 7.0 5.0United States..................................................... 1.3 19.6 10.0 7.0 4.7Latin America..................................................... – – – – –Eastern Europe.................................................. – – – – –Western Europe................................................. 1.3 6.1 3.0 – –France............................................................... 0.1 5.1 – – –Germany............................................................ – – – – –Italy................................................................... – – – – –Netherlands....................................................... 1.2 – – – –United Kingdom................................................ – – – – –Middle East....................................................... – – – – –Africa................................................................ 34.3 37.0 26.0 28.0 30.0Asia and Pacific*............................................... 1,778.0 1,724.0 1,575.0 2,013.0 2,137.0*of which Japan:............................................ 1,065.8 1,066.8 1,182.8 1,224.0 1,047.7Unspecified....................................................... – – – – –Total World 1,814.9 1,786.7 1,614.0 2,048.0 2,172.0Source: OPEC Annual Statistical Bulletin 200430002500200015001000500Source: EIA<strong>UAE</strong> Oil Production and Consumption 1980–2004PRODUCTIONNET EXPORTSCONSUMPTION01980 1985 1990 1995 2000 2004