
You also want an ePaper? Increase the reach of your titles
YUMPU automatically turns print PDFs into web optimized ePapers that Google loves.
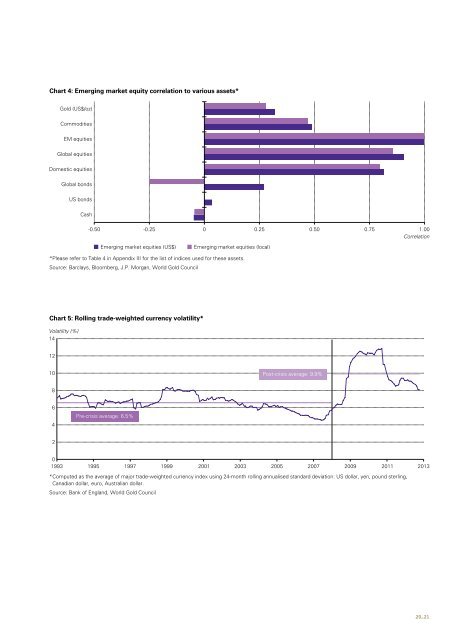
Chart 4: Emerging market equity correlation to various assets*<strong>Gold</strong> (US$/oz)CommoditiesEM equitiesGlobal equitiesDomestic equitiesGlobal bondsUS bondsCash-0.50 -0.25 0 0.25 0.50 0.75 1.00CorrelationEmerging market equities (US$)Emerging market equities (local)*Please refer to Table 4 in Appendix III for the list of indices used for these assets.Source: Barclays, Bloomberg, J.P. Morgan, World <strong>Gold</strong> CouncilChart 5: Rolling trade-weighted currency volatility*Volatility (%)141210Post-crisis average: 9.9%86Pre-crisis average: 6.5%4201993 1995 1997 1999 2001 2003 2005 2007 2009 2011 2013* Computed as the average of major trade-weighted currency index using 24-month rolling annualised standard deviation: US dollar, yen, pound sterling,Canadian dollar, euro, Australian dollar.Source: Bank of England, World <strong>Gold</strong> Council20_21