Santa Monica Bay Status Report - Bureau of Sanitation
Santa Monica Bay Status Report - Bureau of Sanitation
Santa Monica Bay Status Report - Bureau of Sanitation

You also want an ePaper? Increase the reach of your titles
YUMPU automatically turns print PDFs into web optimized ePapers that Google loves.
<strong>Santa</strong> <strong>Monica</strong> <strong>Bay</strong><strong>Status</strong> <strong>Report</strong>: December 2004Environmental Monitoring Division
SANTA MONICA BAY STATUS REPORTDECEMBER 2004Board <strong>of</strong> Public WorksCynthia Ruiz, PresidentDave Sickler, Vice PresidentPaula Daniels, President Pro TemporeYolanda Fuentes, CommissionerValerie Lynne Shaw, Commissioner<strong>Bureau</strong> <strong>of</strong> <strong>Sanitation</strong>Rita L. Robinson, DirectorJoseph E. Mundine, Assistant Director IIVarouj S. Abkian, Assistant Director ITraci J. Minamide, Assistant Director IEnrique C. Zaldivar, Assistant Director IEnvironmental Monitoring DivisionMas Dojiri, Division ManagerJon Ball, Water Biologist IIJeffrey Beller, Assistant Division Manager Curtis Cash, Water Biologist IILee Huang, Instrumental Chemistry Manager Ann Dalkey, Water Biologist IIIGerald McGowen, Biology ManagerGreg Deets, Water Biologist IIFarhana Mohamed,Ray Huang, Senior ChemistConventional Chemistry ManagerIoannice Lee, Water Microbiologist IISumi Roy-Burman,Leslie Sidio, Chemist IIData and Sample Management ManagerThis status report was produced using data, conclusions, and graphics reported in the City <strong>of</strong> Los Angeles, EnvironmentalMonitoring Division’s <strong>Santa</strong> <strong>Monica</strong> <strong>Bay</strong> Biennial Assessment <strong>Report</strong>, January 2003 – December 2004. The combined efforts <strong>of</strong>the Environmental Monitoring Division staff that produced the technical report enabled us to create this public edition.As a covered entity under Title II <strong>of</strong> the Americans with Disabilities Act, the City <strong>of</strong> Los Angeles does not discriminate on the basis <strong>of</strong>disability and, upon request, will provide reasonable accommodation to ensure equal access to its programs, services, and activities. Printed on recycled paper.
DEAR READERS:Each day, in laboratories, on research vessels, and alongour shoreline, the City <strong>of</strong> Los Angeles monitors the environmentalhealth <strong>of</strong> <strong>Santa</strong> <strong>Monica</strong> <strong>Bay</strong>. On the followingpages you will read about our monitoring efforts and ourassessment <strong>of</strong> the current conditions in the <strong>Bay</strong>.Additionally, we report how the City’s wastewater andstormwater flows are managed and how these flows haveimpacted the health <strong>of</strong> the <strong>Bay</strong> and the public. The conclusionsare based on thousands <strong>of</strong> samples and testswith a focus on those performed over the past 24 months.This report is a public edition <strong>of</strong> the City <strong>of</strong> Los Angeles,Environmental Monitoring Division’s <strong>Santa</strong> <strong>Monica</strong> <strong>Bay</strong>Biennial Assessment <strong>Report</strong>.The formal report provides extensive monitoring data toregulators and is required as a part <strong>of</strong> the permit whichallows the City <strong>of</strong> Los Angeles to discharge treated wastewaterinto the <strong>Bay</strong>. Agencies and organizations thatreceive the report include the U.S. EnvironmentalProtection Agency (U.S. EPA), the Los Angeles RegionalWater Quality Control Board, local municipalities, environmentalgroups, various <strong>Santa</strong> <strong>Monica</strong> <strong>Bay</strong> stakeholders,and other entities. The formal report can be obtained bycontacting the Environmental Monitoring Division, <strong>Bureau</strong><strong>of</strong> <strong>Sanitation</strong>, City <strong>of</strong> Los Angeles at 310-648-5716 or byvisiting www.lacity.org/san/emd and following the linksto the <strong>Santa</strong> <strong>Monica</strong> <strong>Bay</strong> Biennial Assessment <strong>Report</strong>.The monitoring data collected fromJanuary 2003 to December 2004reflect an encouraging trend: environmentalconditions in most parts <strong>of</strong>the <strong>Bay</strong> are good and getting better.The monitoring data collected from January 2003 toDecember 2004 reflect an encouraging trend: environmentalconditions in most parts <strong>of</strong> the <strong>Bay</strong> are good andgetting better. This shows that while there is still morethat can be done, the City’s efforts, along with those <strong>of</strong>other concerned agencies, organizations, and countlessresidents are making a quantifiable difference in the<strong>Bay</strong>’s health. We can’t afford to do less. A healthy <strong>Bay</strong>is a vital natural resource for everyone who visits, lives,and works in Southern California.Thank you for your interest in the health <strong>of</strong> <strong>Santa</strong><strong>Monica</strong> <strong>Bay</strong>. For more details on any information in thisdocument, please call 310-648-5716 or visitwww.lacity.org/san.Cynthia Ruiz, PresidentCity <strong>of</strong> Los Angeles / Board <strong>of</strong> Public WorksRita L. Robinson, DirectorDepartment <strong>of</strong> Public Works / <strong>Bureau</strong> <strong>of</strong> <strong>Sanitation</strong>Mas Dojiri, Division Manager<strong>Bureau</strong> <strong>of</strong> <strong>Sanitation</strong> / Environmental Monitoring Division
PROTECTING THE BAYTHE CITY’S ROLEThe City’s Environmental Monitoring Division analyzesthousands <strong>of</strong> samples each year from the HyperionTreatment Plant and <strong>Santa</strong> <strong>Monica</strong> <strong>Bay</strong>.Permits and the Environmental Monitoring DivisionThe City <strong>of</strong> Los Angeles, the U.S. EPA, and the LosAngeles Regional Water Quality Control Board are partnersin managing the water quality and general health <strong>of</strong><strong>Santa</strong> <strong>Monica</strong> <strong>Bay</strong>, in part by developing, complyingwith, and enforcing National Pollutant DischargeElimination System (NPDES) permits for the operation<strong>of</strong> the Hyperion Treatment Plant and for the discharge <strong>of</strong>the City’s stormwater and urban run<strong>of</strong>f.Testing plant processesand its effluent2The City has invested billions <strong>of</strong> dollars in new wastewatertreatment technologies and stormwater and urbanrun<strong>of</strong>f control measures. In addition, it has implementedthe most stringent operating procedures in Hyperion’shistory, including comprehensive monitoring protocols toprotect public health and the area’s natural resources.To ensure that the stringent permit standards are met, theplant’s treatment processes, final effluent, <strong>Santa</strong> <strong>Monica</strong><strong>Bay</strong> water, sediments, and marine organisms are continuouslytested and analyzed by marine biologists, microbiologists,chemists, and laboratory technicians from the<strong>Bureau</strong> <strong>of</strong> <strong>Sanitation</strong>’s Environmental Monitoring Division(EMD). EMD operates the most extensive monitoringprogram in <strong>Santa</strong> <strong>Monica</strong> <strong>Bay</strong>. The scientists have state<strong>of</strong>-the-artequipment to perform the full range <strong>of</strong> proceduresrequired by regulatory permits and other mandates.$1.6 billion was spent at the Hyperion Treatment Plant in Playadel Rey to create a world-class full secondary treatment facility.The City has invested billions <strong>of</strong>dollars in new wastewater treatmenttechnologies and stormwaterand urban run<strong>of</strong>f control measures.
Wastewater ManagementThe City’s wastewater system collects andtreats 550 million gallons per day from overfour million people within a 600 square mileservice area that includes Los Angeles and29 contracting cities and agencies.Los Angeles operates and maintains the largest wastewater collection systemin the United States. More than 6,700 miles <strong>of</strong> sewers connect residencesand businesses to the City’s four wastewater treatment plants,including the Hyperion Treatment Plant in Playa del Rey. In 2003 and 2004,an average <strong>of</strong> 342 million gallons <strong>of</strong> wastewater was treated to the full secondarylevel each day at Hyperion during dry weather. The final effluent isdischarged through a 5-Mile Outfall into <strong>Santa</strong> <strong>Monica</strong> <strong>Bay</strong>. Go online atwww.lasewers.org/treatment_plants/hyperion/tour/index.htm to learnmore about Hyperion's treatment processes.118San FernandoValley101<strong>Santa</strong> <strong>Monica</strong> MountainsPacificPalisadesDonald C.Tillman WaterReclamationPlant<strong>Santa</strong><strong>Monica</strong><strong>Bay</strong>Beverly Hills405<strong>Santa</strong> <strong>Monica</strong>HyperionTreatmentPlantTorranceLos Angeles110InglewoodPalos VerdesSan Gabriel Mountains210Pasadena5 GlendaleLos Angeles- 2Glendale WaterReclamation Plant10105101SanPedroCompton91405110710Terminal IslandTreatment PlantLong BeachWastewater ProcessingRaw SewageBarScreensGritRemovalPrimarySettling TankSecondaryOxygenReactorSecondaryClarifying TankEffluent Dischargeto Ocean andBeneficial ReuseTo SanitaryLandfillPrimary SludgeLiving Micro-Organisms/Activated SludgeBiosolids HandlingWaste ActivatedSludge ThickeningMethane GasAnaerobicDigestionTo Electrical Power GenerationCentrifugeDewateringBiosolids toDiverseBeneficialReuse OptionsPrimary Treatment - Most <strong>of</strong> thesolids are removed here after theysink to the bottom <strong>of</strong> covered, undergroundtanks and are pumped to theanaerobic digesters. The liquid isthen pumped to the secondary treatmentsystem for further treatment.Secondary Treatment - In covered, oxygen-richreactor tanks, microbes living in the wastewaterconsume most <strong>of</strong> the remaining solids. The microbesand solids are separated from the wastewater inclarifiers (shown above). Some <strong>of</strong> the biomass isrecycled back to the aeration tanks to performadditional biological/secondary treatment and someis thickened, then sent to the anaerobic digesters.5-Mile Outfall - After final settling in theclarifiers, the clear secondary effluent isdischarged out the 5-mile long outfall pipeinto <strong>Santa</strong> <strong>Monica</strong> <strong>Bay</strong>.(This video capture courtesy <strong>of</strong> Undersea Graphics, Inc.)3
MONITORING INSIDETHE HYPERIONTREATMENT PLANTAerial view <strong>of</strong> the Hyperion Treatment Plantat Playa del Rey. Below, EMD staff providevital data to assist in the optimization <strong>of</strong>daily treatment operations.Sewage moving through the plant’s processes is testeddaily to ensure that systems are operating properly toeffectively remove pollutants. The sewage is regularlyanalyzed for a variety <strong>of</strong> chemicals, many <strong>of</strong> which canbe toxic or carcinogenic at certain levels.During 2003 - 2004, the presence <strong>of</strong> toxic or carcinogenicchemicals was routinely monitored, but rarelydetected. With few exceptions in thousands <strong>of</strong> testsover this period, these chemicals <strong>of</strong> concern were eithernot present at all or were at such low levels that theycould not be detected by the most sensitive instrumentation.In the cases where equipment detected chemicals<strong>of</strong> concern, most were in concentrations well belowthe requirements <strong>of</strong> the Hyperion NPDES permit and theThe plant’s processes and itseffluent are tested daily toensure optimum treatment isattained.objectives <strong>of</strong> the California Ocean Plan. HyperionTreatment Plant has an outstanding record <strong>of</strong> complyingwith these important environmental standards. Asthe City’s largest treatment plant, it had only two minorpermit exceedances in 2003 - 2004.Key Facts:This historical plot for years 1986-2004 shows that three metals <strong>of</strong> concernto human health; arsenic, chromium, and lead, have been reducedto levels just above minimum detection limits for Hyperion effluent.• Hyperion’s full secondary treatmentprocess effectively removes mostpollutants from wastewater.• The concentrations <strong>of</strong> most carcinogenicand other toxic pollutants inHyperion’s effluent are too low tobe detected.• Only two minor permit exceedancesoccurred during 2003-2004.4
Conventional Constituents and NutrientsPriority Pollutant InorganicsPriority Pollutant OrganicsAcid Extractable CompoundsBase & Neutral Extractable CompoundsMost carcinogens andnearly all organic constituentswere either notdetected by EMD’s sophisticatedinstrumentation orbarely detected.Several factors are used todetermine which chemicalsare on the list to betested. Other criteria,based mainly on risk factors,have been developedto determine the limits,such as having carcinogenicor toxic properties.2004 Effluent Data <strong>Report</strong>ed to the RWQCBCurrent Concentrations in 5-Mile Effluent Concentrations After Initial Dilution b CA Ocean Plan (ug/L)Constituents NPDES Limits a Avg. Max. Min. Avg. Max. Min. Objectives c,jTotal Suspended Solids (mg/L) 30 20 38 12 0.24 0.45 0.14Biochemical Oxygen Demand (mg/L) 30 18.7 37 10 0.22 0.44 0.12Oil & Grease (mg/L) 25 ND 4.0 ND 0.0086 0.047 ND 25Settleable Solids (mL/L) 1.0 ND 0.40 ND ND 0.004 ND 1.0Total Organic Carbon (mg/L) NL 21.1 31.0 15.9 0.25 0.36 0.19Phosphorus (Total ) (mg/L) NL 2.9 3.5 2.1 0.034 0.041 0.025Ammonia-Nitrogen (mg/L) 51 35.1 39.6 32.5 0.41 0.47 0.38 0.6Organic-Nitrogen (mg/L) NL 3.8 4.5 2.9 0.045 0.053 0.034Nitrate-Nitrogen (mg/L) NL 0.022 0.10 ND 0.00026 0.0012 NDTurbidity (NTU) 75 9.3 17.3 5.5 0.11 0.20 0.065 75pH 6.0-9.0 6.8 7.2 6.5 d d dAntimony NL 1.21 1.88 0.91 0.014 0.022 0.010 1200Arsenic 12 2.69 4.0 DNQ(1.2) 0.032 0.047 DNQ(0.014) 8Beryllium 2.8 0.10 0.419 ND 0.0012 0.0049 ND 0.033Cadmium 21 DNQ(0.15) DNQ(0.7) ND DNQ(0.002) DNQ(0.008) ND 1Chromium (hexavalent) e 113 0.25 3.0 ND 0.003 0.035 ND 2Chromium (total) NL DNQ(1.46) DNQ(2.6) ND DNQ(0.017) DNQ(0.031) ND 190000 fCopper 87 19.5 38.7 13.1 0.229 0.455 0.154 3Lead 101 DNQ(3.22) DNQ(14.3) ND DNQ(0.038) DNQ(0.17) ND 2Mercury 1.1 ND DNQ(0.038) ND ND DNQ(0.000) ND 0.04Nickel 113 7.76 14 4 0.091 0.16 0.047 5Selenium 1275 DNQ(0.91) DNQ(1.4) DNQ(0.2) DNQ(0.011) DNQ(0.016) DNQ(0.002) 15Silver 26 1.48 2.40 DNQ(0.8) 0.017 0.028 DNQ(0.09) 0.7Thallium 1190 1.28 2.92 ND 0.015 0.034 ND 2Zinc 346 22.8 45.9 DNQ(15.0) 0.27 0.54 DNQ(0.18) 20Tributyltin (ng/L)* 119 ND ND ND ND ND ND 1.4Cyanide 85 ND DNQ(6) ND ND DNQ(0.07) ND 1PesticidesAldrin 0.002 ND ND ND ND ND ND 0.022 ng/LDieldrin 0.004 ND ND ND ND ND ND 0.040 ng/LEndrin 0.17 ND ND ND ND ND ND 0.002Toxaphene 0.018 ND ND ND ND ND ND 0.210 ng/LDDT & Derivates (ng/L) 14 ND ND ND ND ND ND 0.17HCH’s 0.34 ND ND ND ND ND ND 0.004Endosulfan 0.765 ND ND ND ND ND ND. 0.009PCB’s 0.002 ND ND ND ND ND ND 0.019 ng/LChlordane & Related Compounds 0.0019 ND ND ND ND ND ND 0.023 ng/LHeptachlor 0.061 g ND ND ND ND ND ND 0.05 ng/LHeptachlor Epoxide NL ND ND ND ND ND ND 0.02 ng/LVolatile Organic Compounds:Acrolein 18700 ND ND ND ND ND ND 220Acrylonitrile 9 ND ND ND ND ND ND 0.10Benzene NL ND ND ND ND ND ND 5.9Halomethanes NL 2.81 3.99 2.09 0.03 0.05 0.02 130Carbon tetrachloride 76 ND ND ND ND ND ND 0.9Chlorobenzene NL ND ND ND ND ND ND 570Chlor<strong>of</strong>orm NL 5.78 7.94 4.78 0.069 0.094 0.056 130Vinyl Chloride NL ND ND ND ND ND ND 361,3-Dichloropropene NL ND ND ND ND ND ND 8.9Ethylbenzene NL ND ND ND ND ND ND 4100Methylene chloride NL 8.8 23.2 2.16 0.104 0.273 0.025 4501,1,2,2-Tetrachloroethane NL ND ND ND ND ND ND 2.3Tetrachloroethene NL 1.83 4.17 0.80 0.022 0.049 0.009 2.0Toluene NL ND 0.176 ND ND 0.002 ND 850001,1,1-Trichloroethane NL ND ND ND ND ND ND 5400001,1,2-Trichloroethane NL ND ND ND ND ND ND 9.4Trichloroethene NL ND ND ND ND ND ND 271,1-Dichloroethylene NL ND ND ND ND ND ND 0.91,2-Dichloroethane NL ND ND ND ND ND ND 28Dichlorobromomethane NL 1.284 1.639 1.080 0.015 0.019 0.013 6.2ChloroDibromomethane NL 2.052 2.976 1.260 0.024 0.035 0.015 8.6Non-Chlorinated Phenolic Compounds NL ND ND ND ND ND ND 302,4-Dinitrophenol 340 ND ND ND ND ND ND 4.04,6-Dinitro-2-Methyl Phenol NL ND ND ND ND ND ND 220Chlorinated Phenolic Compounds 85 ND ND ND ND ND ND 12,4,6-Trichlorophenol 25 ND ND ND ND ND ND 0.29PAHs 0.748 ND ND ND ND ND ND 8.8 ng/LFluoranthene 1270 ND ND ND ND ND ND 15Benzidine 0.006 ND ND ND ND ND ND 0.069 ng/LBis (2-chloroethyl) ether 4 ND ND ND ND ND ND 0.045Bis (2-chloroethoxy) methane 374 ND ND ND ND ND ND 4.4Bis (2-chloroisopropyl) ether NL ND ND ND ND ND ND 1200Bis (2-ethylhexyl) phthalate 297 ND 3.0 ND ND 0.035 ND 3.5Di-n-butyl phthalate NL ND ND ND ND ND ND 35001,4-Dichlorobenzene NL 1.0 2.3 ND 0.012 0.027 ND 183,3-Dichlorobenzidine 0.688 ND ND ND ND ND ND 0.0081Diethyl phthalate NL ND ND ND ND ND ND 33000Dimethyl phthalate NL ND ND ND ND ND ND 8200002,4-Dinitrotoluene 221 ND ND ND ND ND ND 2.6Hexachlorobenzene 0.018 ND ND ND ND ND ND 0.21 ng/LHexachlorobutadiene NL ND ND ND ND ND ND 14Hexachlorocyclopentadiene 4930 ND ND ND ND ND ND 58Isophorone NL ND ND ND ND ND ND 730Nitrobenzene 416 ND ND ND ND ND ND 4.9N-Nitrosodimethylamine 620 ND ND ND ND ND ND 7.3N-Nitrosodiphenylamine 212 ND ND ND ND ND ND 2.5N-Nitrosodi-N-propylamine NL ND ND ND ND ND ND 0.38Hexachloroethane 212 ND ND ND ND ND ND 2.51,2-Diphenylhydrazine h 14 ND ND ND ND ND ND 0.16Dichlorobenzenes i NL ND ND ND ND ND ND 5100Others:2,3,7,8-Dioxin* * 0.4 pg/L ND ND ND ND ND ND 0.0039 pg/LResidual Chlorine (mg/L) 0.17 ND 0.1 ND ND ND ND 0.002All concentrations are in micrograms per liter (parts per billion) unless noted otherwise.a TSS, BOD, O&G and settleable solids limit based on 30-day average concentration. All others are based on monthly average concentration.b Calculated values based on a minimum initial dilution <strong>of</strong> 84 parts seawater + 1 part effluent.c For O&G and settleable solids based on 30-day avg. concentration. All others are based either on 30-day avg. or 6-month median.d Not applicable: The concept <strong>of</strong> dilutions does not apply to pH measurements.e Not listed as priority pollutants.f as Chromium (III)g “Heptachlor” means the sum <strong>of</strong> heptachlor and heptachlor epoxideh as Azobenzenei “Dichlorobenzenes” mean the sum <strong>of</strong> 1,2- and 1,3-dichlorobenzenej Based on 6-month median and 30-day average limiting concentrations* Tributyltin was analyzed by CRG Marine Laboratory, Torrance, CA.** Dioxin was analyzed by Severn Trent Laboratories, Carol Stream Ill.MDL = Method Detection Limit; NL = Not Listed; NA = Not Available; ND = Not Detected; DNQ=Detected but Not Quantified5
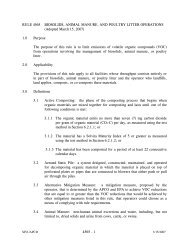
The City has two oceangoing vessels that take tothe <strong>Bay</strong> year round so thatscientists can collect samplesfrom 44 sites.MONITORINGSANTA MONICA BAYWATERSCity <strong>of</strong> Los Angeles’ marine biologists monitor water columnsin <strong>Santa</strong> <strong>Monica</strong> <strong>Bay</strong> – vertical cross-sections <strong>of</strong> ocean waterfrom the surface to the sea floor – to locate and analyze theeffluent plume (the effluent discharged from Hyperion’s 185foot deep, 5-Mile Outfall). They measure the plume’s compositionusing a Conductivity-Temperature-Depth (CTD) instrumentto measure certain physical characteristics <strong>of</strong> the waterin order to identify the location and magnitude <strong>of</strong> the effluentplume and to investigate how well it mixes with the receivingwaters <strong>of</strong> <strong>Santa</strong> <strong>Monica</strong> <strong>Bay</strong>.The CTD measures salinity, temperature, depth, transmissivity(how well light is transmitted though the water), dissolvedoxygen, pH, chlorophyll, and colored dissolvedorganic material (particles). The effluent plume is generallyfound within 2 km <strong>of</strong> the 5-Mile Outfall. In 2003-2004,Hyperion’s discharges met all NPDES permit requirementsfor <strong>Santa</strong> <strong>Monica</strong> <strong>Bay</strong> waters.Lower salinity is indicated by blue and signifiesfreshwater inputs. The effluent plume (in light blue),can be seen <strong>of</strong>fshore below the surface, and thestormwater (dark blue) at the shore on the surface.The CTD (above) takes nearlycontinuous measurementsfrom the surface to bottom <strong>of</strong><strong>Santa</strong> <strong>Monica</strong> <strong>Bay</strong>. Whenseveral stations are sampled,the City is able todevelop a 3-dimensionalimage (left) <strong>of</strong> water qualityin <strong>Santa</strong> <strong>Monica</strong> <strong>Bay</strong>.6
Key Facts:• Hyperion’s discharge meets all NPDES limits for<strong>Santa</strong> <strong>Monica</strong> <strong>Bay</strong> waters.• While the location <strong>of</strong> the effluent plume shifts inthe <strong>Bay</strong> depending on currents and water temperatures,it has never reached area beaches (basedon over 500 water quality surveys).• In 2003-2004, Hyperion’s effluent had no permitviolations for either acute or chronic toxicity.• The results <strong>of</strong> toxicity testing indicate that today’sHyperion effluent will not have harmful effects onaquatic life in <strong>Santa</strong> <strong>Monica</strong> <strong>Bay</strong>.Monitoring the Effects<strong>of</strong> Effluent on Marine OrganismsWhole Effluent Toxicity (WET) tests are performedmonthly in the laboratory to assess the potential toxicity<strong>of</strong> Hyperion’s effluent on the organisms that live in the<strong>Bay</strong>. Two different types <strong>of</strong> WET tests are required bythe HTP Permit:• Acute Toxicity Testing measures the concentration <strong>of</strong>effluent that would cause a reduction in survival <strong>of</strong>the test organisms.• Chronic Toxicity Testing measures the concentration<strong>of</strong> effluent that would cause a reduction <strong>of</strong> the organisms’growth, reproduction, or early development.Abalone (Haliotis rufescens) larvae used for chronic toxicity tests.WET tests are performed in the laboratory (in vitro)under controlled conditions using live organisms tomeasure the combined toxic effects <strong>of</strong> all effluent constituents(see Effluent Data Table on page 5). The City’sEnvironmental Monitoring Division provides criticalinformation from these tests to Hyperion Treatment Plantoperators to help maintain effluent discharges well belowtoxicity thresholds. Hyperion’s effluent must pass bothmonthly Acute Toxicity and Chronic Toxicity Tests.Young silverside minnow (Menidia beryllina) is used for chronic toxicitytests (below). This fish is approximately 5 mm in length. WET tests areperformed in the laboratory under controlled conditions (below left).7
The storm drainsystem runsthroughout ourwatersheds andempties into <strong>Santa</strong><strong>Monica</strong> <strong>Bay</strong>.BEACHESAND THE SHORELINEMonitoring the ShorelineHyperion’s NPDES permit and the municipal stormwaterpermit require that EMD monitor over 50 miles <strong>of</strong> shoreline,from El Pescador State Beach, north <strong>of</strong> Point Dume, toCabrillo Beach in Los Angeles Harbor, for the possible presence<strong>of</strong> pathogenic organisms. Water samples are analyzedfor indicator bacteria (total coliforms, fecal coliforms orE.coli, and enterococcus), which are not themselves pathogenic,but indicate the presence <strong>of</strong> pathogenic organisms.Tests have consistently shown no evidence <strong>of</strong> wastewater-borneindicator bacteria at the shoreline due todischarged Hyperion effluent.However, monitoring does show that stormwater andurban run<strong>of</strong>f, flowing out <strong>of</strong> stormdrains, contain significantcontaminants and bacterial organisms that are dischargedin measurable amounts at the shoreline.Managing Stormwater and Urban Run<strong>of</strong>fThe City consistently samplesand tests shoreline waters.Stormwater and run<strong>of</strong>f are the biggest contributors <strong>of</strong> pollutionand contamination to shoreline waters, especiallyduring storms. As a result, the Los Angeles RegionalWater Quality Control Board has issued a joint permit toseveral municipalities having watersheds that connect to<strong>Santa</strong> <strong>Monica</strong> <strong>Bay</strong>, including the City <strong>of</strong> Los Angeles, inorder to reduce the amount <strong>of</strong> contamination flowing tothe <strong>Bay</strong>. Results from the City’s monitoring efforts areused to track the effectiveness <strong>of</strong> the clean-up efforts aswell as to help create the Beach <strong>Report</strong> Card.The 414 square-mile <strong>Santa</strong> <strong>Monica</strong> <strong>Bay</strong> watershed is made up <strong>of</strong> numeroussmaller watersheds or sub-basins. A total <strong>of</strong> 28 sub-basins draininto <strong>Santa</strong> <strong>Monica</strong> <strong>Bay</strong>. The largest <strong>of</strong> these sub-basins are the 130square-mile Ballona Creek watershed, Malibu Creek at 110 squaremiles,and Topanga Creek watershed, draining 18 square-miles.Due to the <strong>Bureau</strong> <strong>of</strong> <strong>Sanitation</strong>’s extensive and proactiveefforts in sewer-line cleaning, closed-circuit televisedinspections, sewer upgrades, and the FOG (Fats,Oil, and Grease) program, the number <strong>of</strong> sewage spills,or sanitary sewer overflows, has been reduced by 45%in 2004-05 from those experienced in 2000-01. This, inturn, has reduced beach closures.<strong>Santa</strong><strong>Monica</strong><strong>Bay</strong>Ballona Sub-BasinsMalibu Sub-BasinsSMB Sub-BasinsTopanga Sub-BasinsWaterbodiesStreams8
The flows originate as run<strong>of</strong>f from ro<strong>of</strong>tops, residentialyards, parking lots, freeways, industrial and commercialfacilities, construction sites, golf courses, parks, andmany other surfaces. Unlike wastewater, most <strong>of</strong> theseflows are not treated prior to discharge near the shoreline.The City <strong>of</strong> Los Angeles is committed to protecting thepublic’s health and improving the water quality <strong>of</strong> ourcoastal waters by:Keep oil, pesticides,detergents, and otherpollutants out <strong>of</strong> thestorm drains.Dispose <strong>of</strong> themproperly.• Installing pollution control devices throughout LosAngeles.• Placing low-flow diversion structures into stormdrains that direct portions <strong>of</strong> dry-weather urbanrun<strong>of</strong>f to Hyperion for treatment, that otherwisewould discharge to the <strong>Santa</strong> <strong>Monica</strong> <strong>Bay</strong>.• Implementing other measures including catchbasin cleaning and labeling, urban lakes programs,and public education programs.• Engaging in cooperative efforts with other agenciessuch as sharing monitoring data with the LosAngeles County Department <strong>of</strong> Health Services,who then initiate beach closures when appropriate,and Heal the <strong>Bay</strong> to incorporate the data into theirBeach <strong>Report</strong> Card.The City is installing pollution controldevices throughout Los Angeles.Each <strong>of</strong> us can help reducethe amount <strong>of</strong> pollution in urban run<strong>of</strong>f.Fast food wrappers, cigarette butts, containers, oil,antifreeze, fertilizer, pesticides, and pet wastes can findtheir way from our neighborhoods to the shorelinethrough the storm drain system. Other stormwaterrelatedinformation can be found at:www.lasewers.org/CSSA/arno1.pdfwww.lacity.org/ead/eadweb-wnr/run<strong>of</strong>fstorm.htmwww.lastormwater.orgKey Facts:• Hyperion’s effluent has no measurable impacton the water quality <strong>of</strong> the shoreline area.• Stormwater and urban run<strong>of</strong>f are the biggestcontributors <strong>of</strong> pollution and contamination toshoreline waters.Trash and other pollutantsare deposited on ourshorelines through thestorm drains.• The County Department <strong>of</strong> Health Services recommendsswimming at least 100 feet from themouth <strong>of</strong> a storm drain and to wait at least threedays after a storm before going into the ocean.• Permit-driven stormwater and urban run<strong>of</strong>fpollution control devices and programs areimproving the shoreline environment.9
Pyromaia tuberculataMONITORINGTHE BAY’S SEDIMENTSediments retain higher levels <strong>of</strong> pollutantsnear the closed 7-Mile Sludge Outfall thannear the 5-Mile Effluent Outfall.Sediment is sampled from the bottom <strong>of</strong> the <strong>Bay</strong> at 44 <strong>of</strong>fshorestations. Laboratory and field testing measure howsediment composition and quality is affected byHyperion’s discharged wastewater and how the <strong>Bay</strong>’secosystem is affected by materials found in the sediment.The cessation <strong>of</strong> sludge disposal to the <strong>Bay</strong> in 1987 and theadvent <strong>of</strong> full secondary treatment at Hyperion in 1998resulted in a dramatic reduction in the discharge <strong>of</strong> solidsto the <strong>Bay</strong>. This coincided with an immediate increase inthe number and diversity <strong>of</strong> species near the 5-Mile Outfall.Today, the area around the 5-Mile Outfall has the greatestspecies diversity <strong>of</strong> any equivalent site in the <strong>Bay</strong>.Highest mercury concentrations were foundnear the closed 7-Mile Sludge Outfall.Sediment quality is evaluated using two statistical thresholds.The ERL (Effects Range - Low) test identifies thethreshold – or concentration – <strong>of</strong> metals or organic compoundsbelow which adverse impacts are rarely found.The ERM (Effects Range - Medium) identifies the concentrationabove which adverse impacts are frequently found.DDT levels have fluctuated over recent years.Settleable Solids (Lx10 6 )Settleable SolidsSpeciesAnimal populations have increased over time as solidshave decreased at the 5-Mile Outfall sampling station.10
The cladogram <strong>of</strong> community relationships (below) over time fromthe 5-Mile Outfall clearly reflects an increase in species diversity,represented by the longer branch lengths, due to improved effluentquality from 1986 to the present. Significant reductions in massemissions from the 5-Mile Outfall in 1986, followed by the termination<strong>of</strong> sludge discharge from the 7-Mile Outfall in 1987, resulted inimmediate increases in species diversity represented by the bluesubset <strong>of</strong> samples. An even more dramatic increase in speciesdiversity and abundance occurred after the Hyperion Treatment Plantupgraded to full secondary treatment in 1998, represented by thegreen subset <strong>of</strong> samples at the top <strong>of</strong> the cladogram.1998-FullSecondaryTreatment20041986-SignificantImprovents inTreatment andMass EmissionsReduction1987- Cessation<strong>of</strong> 7-Mile OutfallSludge Discharge1983Dramatic Increase inBiodiversity Resultingfrom Full SecondaryTreatment UpgradeIncreased BiodiversityResulting from ImprovementsMade in 1986 and 1987Increased Biodiversity Over TimeImproved Wastewater Treatment Over TimeThe health <strong>of</strong> this and otherbottom-dwelling organismsis determined, in part, by thesediments they live on.Key Facts:Sediment is sampled from the bottom <strong>of</strong> the <strong>Bay</strong> at 44 <strong>of</strong>fshore stations.• At all 44 stations in Fiscal Year 2003-2004, averagemetal concentrations were below ERL levels (whereadverse impacts are rare).• Silver exceeded the ERM value at the 5-Milestation.• The average total DDT concentration fell betweenthe ERL and the ERM values.• The average total PCB concentration at 43 stationsfell below the ERL value. At the 5-Mile Outfall, itwas above the ERL value but below the ERM value.• Tests indicate that DDT and PCBs found in sedimentsmay have caused some biological impacts atsome <strong>of</strong> the 44 sampling sites.• The primary source <strong>of</strong> these chemicals is oldwastewater discharges, prior to the passage <strong>of</strong> theClean Water Act (CWA) in 1972.11
MONITORINGamphipodBAY ORGANISMSTwo different types <strong>of</strong> monitoring are conducted by theCity’s Environmental Monitoring Division to determinethe levels <strong>of</strong> pollutants in fish tissue. As in the sedimentstudies, the primary pollutants <strong>of</strong> concern are organics(primarily DDT and PCBs) and metals (e.g., copper,mercury, and arsenic). The main sources <strong>of</strong> these contaminantsare the old effluent discharges (dischargedbefore the enactment <strong>of</strong> the CWA).In one type <strong>of</strong> monitoring, the City <strong>of</strong> Los Angeles analyzestissues <strong>of</strong> the hornyhead turbot, a bottom-dwellingfish that is caught using a net dragged on the oceanfloor. This study examines whether or not pollutantsfound in sediment are being absorbed and concentratedin aquatic organisms as they move up the food chain.In 2003-2004, the studies showed that, years after theywere discharged, these pollutants are still measured atelevated levels in some <strong>Bay</strong> organisms.The hornyhead turbot is targeted as the trawled fish for monitoringstudies because it feeds on bottom-dwelling macr<strong>of</strong>auna.The second type <strong>of</strong> monitoring is a rig-fishing (hook andline) survey. In the laboratory, muscle tissue from speciescaught during these surveys and caught by the public areanalyzed to determine if certain fish are safe to eat. A variety<strong>of</strong> fish are caught and tested. Most species <strong>of</strong> fish containvery low levels <strong>of</strong> pollutants <strong>of</strong> concern. However,scorpionfish and a few others consistently show levels <strong>of</strong>contamination that exceed the safe levels that have beenset by the State <strong>of</strong> California.The City’s 2003-2004 trawl and rig sampling studies supportthe State <strong>of</strong> California Office <strong>of</strong> Environmental HealthHazard Assessment (OEHHA) advisory that makes the followingrecommendations for fish caught locally in <strong>Santa</strong><strong>Monica</strong> <strong>Bay</strong>. The summary states:• Do not consume any white croaker from the <strong>Bay</strong>.• Limit consumption <strong>of</strong> scorpionfish, rockfish, and kelpbass to one meal* every two weeks.• Limit consumption <strong>of</strong> queenfish caught <strong>of</strong>f Malibu Pierto one meal a month.• Limit consumption <strong>of</strong> corbina caught <strong>of</strong>f Redondo Pierto one meal every two weeks.*A meal or serving is about six ounces <strong>of</strong> fish.Consumers are encouraged to reference the followingWebsites and other links provided by OEHHA:www.oehha.ca.gov/fish/nor_cal/index.htmlwww.oehha.ca.gov/fish/so_cal/socalpddp.htmlKey Facts:12• DDT, PCBs, and mercury from sediments are stillfound today in some <strong>Bay</strong> organisms.• The source <strong>of</strong> the contamination is old wastewaterdischarges (prior the enactment <strong>of</strong> the CWA).• The findings <strong>of</strong> the City’s Seafood MonitoringProgram support the recommendations <strong>of</strong> theOEHHA advisory for eating certain fish caught in<strong>Santa</strong> <strong>Monica</strong> <strong>Bay</strong>.