Field Value Title Barnsley In Depth Children & Young People's ...
Field Value Title Barnsley In Depth Children & Young People's ...
Field Value Title Barnsley In Depth Children & Young People's ...

Create successful ePaper yourself
Turn your PDF publications into a flip-book with our unique Google optimized e-Paper software.
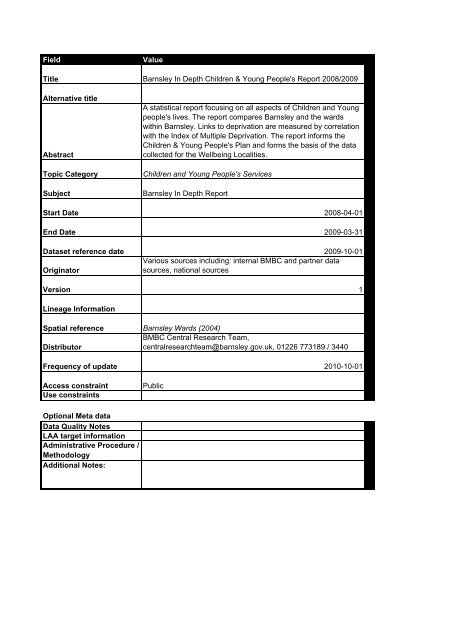
<strong>Field</strong><strong>Value</strong><strong>Title</strong> <strong>Barnsley</strong> <strong>In</strong> <strong>Depth</strong> <strong>Children</strong> & <strong>Young</strong> <strong>People's</strong> Report 2008/2009Alternative titleAbstractTopic CategorySubjectA statistical report focusing on all aspects of <strong>Children</strong> and <strong>Young</strong>people's lives. The report compares <strong>Barnsley</strong> and the wardswithin <strong>Barnsley</strong>. Links to deprivation are measured by correlationwith the <strong>In</strong>dex of Multiple Deprivation. The report informs the<strong>Children</strong> & <strong>Young</strong> <strong>People's</strong> Plan and forms the basis of the datacollected for the Wellbeing Localities.<strong>Children</strong> and <strong>Young</strong> <strong>People's</strong> Services<strong>Barnsley</strong> <strong>In</strong> <strong>Depth</strong> ReportStart Date 2008-04-01End Date 2009-03-31Dataset reference date 2009-10-01Various sources including: internal BMBC and partner dataOriginatorsources, national sourcesVersion 1Lineage <strong>In</strong>formationSpatial reference <strong>Barnsley</strong> Wards (2004)BMBC Central Research Team,Distributorcentralresearchteam@barnsley.gov.uk, 01226 773189 / 3440Frequency of update 2010-10-01Access constraintUse constraintsPublicOptional Meta dataData Quality NotesLAA target informationAdministrative Procedure /MethodologyAdditional Notes:
<strong>Barnsley</strong> in <strong>Depth</strong><strong>Children</strong> & <strong>Young</strong> People2008/09 <strong>In</strong>formationCompiled and Produced by:BMBC Central Research Teamwith assistance from Project Team of Strategic Research GroupContact: 01226 773189 / 01226 773440centralresearchteam@barnsley.gov.uk
<strong>Barnsley</strong> in <strong>Depth</strong> <strong>Children</strong>’s and <strong>Young</strong> People’s Report – 2008/9 <strong>In</strong>formationVersion: 1.0Date: Monday, 29 January 2010Filename: <strong>Barnsley</strong> in <strong>Depth</strong> <strong>Children</strong>’s and <strong>Young</strong> <strong>People's</strong> Report 2008/9Author: Elizabeth PittContact: Liz Pitt, 01226 773189 elizabethpitt@barnsley.gov.ukVersion ControlRevision Prepared By Reviewed By Approved By Date0.1 Liz Pitt, James15/10/2009Leach<strong>In</strong>itial Draft: circulation for accuracy and comments to Sue Hare & Sharon Cooke,…0.2-0.41 Liz Pitt, JamesLeach<strong>In</strong>ternal revisions0.42 Liz Pitt, JamesLeachChris Cope; SueNorris21/01/2010Circulated for accuracy and comments to all contributors, data owners and document owners(<strong>Children</strong>’s Services)1.0 Liz Pitt 29/01/2010Final version for publication on website
ForewordWelcome to <strong>Barnsley</strong> in <strong>Depth</strong>: <strong>Children</strong>, <strong>Young</strong> People and Families. It providesinformation about the needs of children, young people and families in <strong>Barnsley</strong> andhas been produced to help improve services for them.We want to forge new and improved relationships with children, young people,their families and the communities within which they live. Together with anintegrated approach to service delivery based on collaboration between allstatutory, voluntary and community sectors and with service delivery at local level,these relationships will support greater understanding of needs.The <strong>Barnsley</strong> in <strong>Depth</strong> series of reports complements the <strong>Children</strong> and <strong>Young</strong>People Plan and is a major part of the needs analysis for revising the plan andreviewing the Local Area Agreement with Central Government.Our thanks to the <strong>Barnsley</strong> Council Central Research Team, the One <strong>Barnsley</strong>Research Network and all the partner services of the <strong>Children</strong> and <strong>Young</strong> People’sTrust for compiling these reports and keeping them up to date.Their work demonstrates the commitment of the wider partnership for meeting theneeds of all children and young people and improving our services for them. Thenext few years will be really exciting as we develop integrated and joined upservices for children, young people and families. We are confident that everyoneinvolved is totally committed to improving the ‘wellbeing’ of all children and youngpeople living in <strong>Barnsley</strong>.Edna SuttonExecutive Director for <strong>Children</strong>, <strong>Young</strong> People and FamiliesLinda Burgess (Councillor)Cabinet Spokesperson for <strong>Children</strong> and <strong>Young</strong> People’s Services
ContentsForeword.........................................................................................................31 <strong>In</strong>troduction, Scope and Purpose..........................................................61.1 Background 61.2 Government Guidance & Legislation 71.3 <strong>Barnsley</strong> <strong>Children</strong>’s Services Authority and <strong>Barnsley</strong> <strong>Children</strong> and<strong>Young</strong> People’s Trust 82 Geography, Population & Deprivation ................................................122.1 Geography 122.2 Population 132.3 Ethnicity 152.4 Asylum Seekers 162.5 <strong>In</strong>dices of Deprivation 2007 162.6 Child Well-Being <strong>In</strong>dex 193 <strong>Children</strong> and <strong>Young</strong> People’s Health ..................................................213.1 Key Facts on <strong>Children</strong> and <strong>Young</strong> People’s Health 213.2 Births 213.3 Projected number of live births to 2031 223.4 <strong>In</strong>fant Mortality (deaths under one year of age) 233.5 Childhood Mortality 243.6 Low Birth Weight 243.7 Smoking during Pregnancy 253.8 <strong>In</strong>fant feeding 273.9 Dental Health 283.10 Registered as Deaf or Hard of Hearing (0-17yrs) 293.11 Registered Blind or Partially Sighted (0-17yrs) 293.12 Mental Health 303.13 Teenage Pregnancy 333.14 Childhood Immunisations 393.15 Sexually Transmitted <strong>In</strong>fections 403.16 Lifestyle <strong>In</strong>formation 413.17 Accident and Emergency Attendances 423.18 Childhood Obesity 434 Crime and Safety...................................................................................464.1 Key Facts on Crime and Safety 464.2 Youth Offending Team (YOT) 464.3 Substance Misuse (Data from the BARN) 50
4.4 Racial Harassment 534.5 Number of Reported Personal <strong>In</strong>jury Collisions (Under 19’s) 535 Youth and Social Services ...................................................................555.1 Key Facts on Youth and Social Services 555.2 Youth Service 555.3 <strong>Children</strong>, <strong>Young</strong> People and Families: Social Care services 585.4 Disabled <strong>Children</strong>’s Service 615.5 Childcare <strong>In</strong>formation 635.6 <strong>Young</strong> Carers 676 Education ..............................................................................................706.1 Key Facts on Education 706.2 Number of Pupils 706.3 Ethnicity 736.4 Special Educational Needs 746.5 Pupils Eligible for Free School Meals 766.6 Attendance 796.7 Early Years Foundation Stage 816.8 Key Stage 1 Assessment 826.9 Key Stage 2 846.10 GCSE (KS4) Achievements 886.11 Post 16 Learning and Skills (LSC Data) 926.12 <strong>Barnsley</strong> Neighbourhood Learning Net 1016.13 Education, Training or Employment Status of 16-18 year olds (NEETsdata from Connexions) 1057 Economic Well-being..........................................................................1097.1 Key Facts on Economic Well-being 1097.2 Labour Market for 16-24 year olds 1107.3 Social Security Benefits - <strong>Children</strong> & <strong>Young</strong> People 1137.4 <strong>In</strong>come – CACI PayCheck data 134
<strong>Barnsley</strong> in <strong>Depth</strong> <strong>Children</strong>’s and <strong>Young</strong> People’s Report – 2008/09 <strong>In</strong>formation1 <strong>In</strong>troduction, Scope and PurposeThis is the fifth edition of the of <strong>Barnsley</strong> in <strong>Depth</strong>: <strong>Children</strong>’s and <strong>Young</strong>People <strong>In</strong>formation” reports. This report draws together a wide range of datarelating to children and young people to provide a central resource forresearch and information purposes. The key objectives of this report are to:• <strong>In</strong>crease local awareness of the information that is now available;• Provide robust evidence that can be used to support policies andprogrammes;• Support the needs assessment underpinning planning andcommissioning;• Help in targeting resources, performance management and lobbyingfor funding;• Assist in monitoring the activities and initiatives of the locality-basedWellbeing Partnerships, the <strong>Children</strong> and <strong>Young</strong> People’s Plan and theLocal Area Agreement.This report aims to support the work of the Council as the <strong>Barnsley</strong> <strong>Children</strong>’sServices Authority, the work of the <strong>Barnsley</strong> <strong>Children</strong> and <strong>Young</strong> People’sTrust (formerly <strong>Children</strong> and <strong>Young</strong> People’s Strategic Partnership) and thework of partner organisations. These include local education, social care andhealth services, together with a wider range of agencies whose work impactson children within the Authority’s area.The report is also intended to feed into the One <strong>Barnsley</strong> SustainableCommunities Plan and Local Area Agreement, and assist with the Council’sand other partners’ planning strategies.1.1 BackgroundThe <strong>Barnsley</strong> in <strong>Depth</strong> <strong>Children</strong> and <strong>Young</strong> People’s Report combinesinformation from Council services and various local agencies. The informationin this report is presented mainly at ward level and includes maps, graphs andbasic statistical analysis. <strong>In</strong>formation has been provided for the new wards(post June 2004) however ‘Under 18 conceptions’ and data from the LearningSkills Council only reflect the old (pre June 2004) wards. This is becauseeither the information system has not been updated or the data is based on arate over a period of time and therefore needs to be calculated on the oldgeography. A systematic graphical analysis by ward quintiles (i.e. five blocksof wards ranging from most deprived to least deprived) has been adopted toillustrate the effects of deprivation.A number of agencies and members of the One <strong>Barnsley</strong> Research Networkhave worked together on this report to identify and provide available datasources relating to children and young people under the age of 24 (SeeAppendix A for contact details).The information contained in this report relates mainly to 2008/09. This will beupdated annually by the <strong>Barnsley</strong> MBC’s Central Research Team with the- 6 -
<strong>Barnsley</strong> in <strong>Depth</strong> <strong>Children</strong>’s and <strong>Young</strong> People’s Report – 2008/09 <strong>In</strong>formationassistance of the One <strong>Barnsley</strong> Research Network and the <strong>Children</strong> and<strong>Young</strong> People’s Trust. (CYPT).The allocation of postcodes to wards relies upon the ability to matchpostcodes from data sources to the geographically referenced postcodedirectory. <strong>In</strong> some cases it proved impossible to achieve a complete match,although over 90% was achieved in the majority of cases. There maytherefore be some minor inaccuracies in the data presented.1.2 Government Guidance & Legislation<strong>In</strong> 2003 the Government published Every Child Matters. Every Child Mattersfocused on four key themes:• <strong>In</strong>creasing the focus on supporting families - the most critical influenceon children's lives;• Ensuring necessary intervention takes place before children reachcrisis point and protecting children from falling through the net;• Addressing the underlying problems identified in the report into thedeath of Victoria Climbié - weak accountability and poor integration;and• Ensuring that the people working with children are valued, rewardedand trained.‘Every Child Matters: Change for <strong>Children</strong>’ is the approach to safeguardingand promoting the wellbeing of children and young people from birth to age19. The aim is for every child, and their parents, carers and families, whatevertheir background or their circumstances, to have the support they need to behealthy, stay safe, enjoy and achieve, make a positive contribution andachieve economic well-being, the ‘five outcomes’.There was a wide consultation with people working in children's services, andwith parents, children and young people. Following the consultation the<strong>Children</strong> Act 2004 was enacted, providing the legislative spine for developingmore effective and accessible services focused around the needs of children,young people and families.The <strong>Children</strong> Act 2004 requires agencies working with children and youngpeople, including those in the voluntary and community sector, to co-operateand draw together a <strong>Children</strong>’s Plan; to agree priorities, to meet need andmaximise outcomes; and to deliver services in integrated ways.This means that the organisations involved with providing services to children- from hospitals and schools, to police and voluntary groups - are teaming upin new ways, sharing information and working together; to protect children andyoung people from harm and help them achieve what they want in life.<strong>Children</strong> and young people will have far more say about issues that affectthem as individuals and collectively.- 7 -
<strong>Barnsley</strong> in <strong>Depth</strong> <strong>Children</strong>’s and <strong>Young</strong> People’s Report – 2008/09 <strong>In</strong>formation1.3 <strong>Barnsley</strong> <strong>Children</strong>’s Services Authority and <strong>Barnsley</strong> <strong>Children</strong>and <strong>Young</strong> People’s Trust<strong>Barnsley</strong> Metropolitan Borough Council (BMBC) is established as a <strong>Children</strong>’sServices Authority (CSA) by the <strong>Children</strong> Act 2004. There are wideresponsibilities for children, young people and family services set out in theAct and in statutory guidance.Section 10 of the Act places a duty on <strong>Children</strong>’s Service Authorities to makearrangements to promote co-operation between the authority and relevantpartners to improve the wellbeing of children in the Authority’s area. The‘wellbeing’ of children and young people is defined in the Act as theachievement of the Five Outcomes that is to say:• Physical & mental health andemotional wellbeing;• Protection from harm and neglect;• Education, training and recreation;• Contribution made by them to society;• Social and economic wellbeing.-Being healthy-Staying safe-Enjoying and achieving-Making a positive contribution-Achieving economic wellbeing<strong>Children</strong>’s Services Authorities must take a lead in making arrangements topromote co-operation between local agencies whose work impacts onchildren within the Authority’s area and there is a duty on key statutoryagencies to cooperate with the <strong>Children</strong>’s Services Authority in order to bringabout improvements in all areas of service delivery and in associatedoutcomes for children and young people.These arrangements are brought together in a <strong>Children</strong>’s Trust for each<strong>Children</strong>’s Services Authority. A key feature of an effective <strong>Children</strong> and<strong>Young</strong> People’s Trust is a strong child-centred, outcome-led vision for allchildren and young people, clearly informed by their views and those of theirfamilies.Other essential features include:• <strong>In</strong>tegrated front line delivery -organised around the child, young personor family;• <strong>In</strong>tegrated processes -including effective joint working sustained byshared systems and processes;• <strong>In</strong>tegrated strategy -including joint planning and commissioning basedon joint assessment of local needs and best utilisation of all availableresources to target needs;• <strong>In</strong>ter-agency governance -that ensures robust arrangements for interagencyco-operation.Effective inter-agency governance at all levels will give partners theconfidence and trust to engage in new ways of working and to shareresources across service boundaries.- 8 -
<strong>Barnsley</strong> in <strong>Depth</strong> <strong>Children</strong>’s and <strong>Young</strong> People’s Report – 2008/09 <strong>In</strong>formationBMBC has been leading on establishing such arrangements bringingorganisations together to work effectively to achieve agreed outcomes. Thisincludes the public, private, voluntary and community sectors. There is a highlevel of willingness to engage in this agenda in <strong>Barnsley</strong>.<strong>In</strong> 2008 the <strong>Children</strong>’s Trust was established. The Trust Forum meetings are avehicle for securing co-operation between the <strong>Children</strong>’s Services Authorityand its partners. The Forum provides opportunities for cross-Council andmulti-partner engagement in influencing strategy and service delivery. Itmeets in a workshop format to increase participation in the strategic aspectsof the commissioning cycle.The Trust Executive Group (TEG) is the commissioning body for services forchildren and young people and their families, recommending to the Councilthe adoption of the <strong>Children</strong> and <strong>Young</strong> People’s Plan and relatedcommissioning requirements. It oversees the deployment and management ofresources and ensures delivery of the <strong>Children</strong> and <strong>Young</strong> People’s Plan,including monitoring its implementation.This strong integrated governing board, representing all key delivery partnersat senior level, is determined to drive whole-system change through clearleadership and effective local change programmes.It ensures on behalf of the Council and its partners that the requirements ofthe <strong>Children</strong> Act and relevant legislation and statutory guidance are carriedout to the highest possible standards and will achieve the best outcomes forchildren and young people and their families.The TEG identifies and makes recommendations to the Partners on theresources required by the Trust to deliver the <strong>Children</strong> and <strong>Young</strong> People’sPlan. It also leads the strategic planning and delivery and oversees theperformance of <strong>Children</strong>, <strong>Young</strong> People and Family Wellbeing Partnershipsand Teams.The <strong>Children</strong> and <strong>Young</strong> People’s Trust also acts as a delivery partnership ofOne <strong>Barnsley</strong> and the TEG will ensure delivery of the <strong>Children</strong> and <strong>Young</strong>People components of the Sustainable Communities Strategy and the LocalArea Agreement.The TEG will ensure strong working relationships with the Adults andCommunities Wellbeing Partnership with particular attention to informationsharing, joint working to support children living with vulnerable adults andtransitional arrangements for young people moving into adult services.- 9 -
<strong>Barnsley</strong> in <strong>Depth</strong> <strong>Children</strong>’s and <strong>Young</strong> People’s Report – 2008/09 <strong>In</strong>formationThe work of the Trust includes:• Establishing better ways of working together to improve the wellbeingof <strong>Barnsley</strong>’s children and young people and supporting parents,carers, families and local communities;• Leading and co-ordinating the strategic development of fullycomprehensive and integrated services for children and young people,and their families;• Promoting the integration and alignment of the strategic direction,commissioning and operational delivery of services in <strong>Barnsley</strong> forchildren, young people and their families ;• Securing for all children and young people in <strong>Barnsley</strong>, the fiveoutcomes of the Every Child Matters framework and the <strong>Children</strong> Act;• Taking forward planning, implementation and performancemanagement of the Government’s ‘Change for <strong>Children</strong>’ programmeincorporated in the <strong>Children</strong> Act 2004 and the National ServiceFramework;• Undertaking needs analysis, developing and implementing the <strong>Children</strong>and <strong>Young</strong> People’s Plan and monitoring and evaluation performance;• Identifying the resources required to deliver the <strong>Children</strong> and <strong>Young</strong>People’s Plan, commissioning services and overseeing themanagement of pooled and aligned budgets;• Undertaking strategic workforce development;• Ensuring that the participation, voice and influence of children, youngpeople and their families are embedded in the work of the Trust;• Leading the strategic planning, delivery and overseeing theperformance of locality based <strong>Children</strong>, <strong>Young</strong> People and FamilyWellbeing Partnerships and Teams.Meeting the needs of all children and young people will require the long-termcommitment of everyone. The <strong>Children</strong> and <strong>Young</strong> People’s Plan is anexpression of <strong>Barnsley</strong>’s commitment to achieve strong partnerships andcollaboration at all levels. The plan has recently been revised (June 2009—March 2012).The Plan aims to forge new and improved relationships with children, youngpeople, their families and the communities within which they live. This,together with an integrated approach to service delivery based oncollaboration between all statutory, voluntary and community sectors andservice delivery at local level, will support greater understanding of needs.The Plan sets out an ambitious agenda for change, to be delivered byservices for children, young people and families, including schools, children’scentres, childcare, social services, community health services, hospitalservices, play and leisure services, voluntary and community sector servicesand many others.- 10 -
<strong>Barnsley</strong> in <strong>Depth</strong> <strong>Children</strong>’s and <strong>Young</strong> People’s Report – 2008/09 <strong>In</strong>formationTen <strong>Children</strong> and <strong>Young</strong> People’s Wellbeing Partnerships/Teams have beendeveloped and each have an established Leadership Group who are leadingon the development of a locality plan that outlines key priorities for the locality.By 2012 there will be nine Advanced Learning Centre (ALC) and clusters ofprimary learning centres and children centres. The aim is to build integrated,joined up, multi-disciplinary teams and services linking into these and otherlocally based community facilities. These will be fully supportive of all children,young people and families, and delivered at a local level wherever possible.- 11 -
<strong>Barnsley</strong> in <strong>Depth</strong> <strong>Children</strong>’s and <strong>Young</strong> People’s Report – 2008/09 <strong>In</strong>formation2 Geography, Population & Deprivation2.1 Geography<strong>Barnsley</strong> Metropolitan Borough is one of the four districts in the county ofSouth Yorkshire, lying about 15 miles North of Sheffield and 20 miles South ofLeeds. The Borough covers a diverse area stretching 24 miles from thePennines in the west to the Dearne Valley lowlands in the East. It covers anarea of 127 square miles and features a variety of landscapes ranging fromhigh moorlands to urban area and arable lowlands.<strong>In</strong> June 2004 the ward boundaries changed to create 21 new wards, theseare:Central Dodworth Penistone WestCudworth Hoyland Milton RockinghamDarfield Kingstone RoystonDarton East Monk Bretton St Helen’sDarton West North East StairfootDearne North Old Town WombwellDearne South Penistone East WorsbroughFigure 2.1.1 <strong>Barnsley</strong> Wards as of June 2004 (New Wards)- 12 -
<strong>Barnsley</strong> in <strong>Depth</strong> <strong>Children</strong>’s and <strong>Young</strong> People’s Report – 2008/09 <strong>In</strong>formationAt present not all information is available at ‘new ward’ level, some only existson the previous ward boundaries which existed from 1980 until 2004 whenthere were 22 wards within <strong>Barnsley</strong> these were:Ardsley Dearne Thurnscoe Penistone WestAthersley Dodworth RoystonBrierly Hoyland East South WestCentral Hoyland West Wombwell NorthCudworth Monk Bretton Wombwell SouthDarfield North West WorsbroughDartonParkDearne SouthPenistone EastFigure 2.1.2 <strong>Barnsley</strong> Wards pre-June 2004 (Old Wards)Reproduced from the Ordnance Survey mapping with the permission of the Controller of her Majesty's StationeryOffice © Crown copyright.Unauthorised reproduction infringes Crown copyright and may lead to prosecution or civil proceedings. <strong>Barnsley</strong>MBC Licence Number LA100022264 - 20092.2 PopulationPopulation estimates for local authorities refer to residents of the area.Population estimates for Primary Care Trusts (PCT) are based on thoseregistered with a GP or PCT, within the geographical area of the PCT. Theseestimates may differ considerably. It is important to recognise the differencesbetween the different populations and use the appropriate estimates in ratecalculations.- 13 -
<strong>Barnsley</strong> in <strong>Depth</strong> <strong>Children</strong>’s and <strong>Young</strong> People’s Report – 2008/09 <strong>In</strong>formationFrom the 2008 mid-year population estimates* produced by the Office ofNational Statistics (ONS) there are 54,600 children aged 0-19 resident in<strong>Barnsley</strong> – a slight decrease of 100 (0.2%) on the 2006 figure. Male childrenaccounted for 51.0% (or 27,800).The total population is broken down into:• 2,800 children in the under 1’s (up by 100 on 2007);• 10,600 children aged 1-4 (up by 400 from 2007);• 12,100 children aged 5-9 (down by 300 from 2007);• 14,200 children aged 10-14 (down by 300 from 2007), and;• 14,800 children aged 15-19 (same as 2007).Figure 2.2.1 below highlights that there were fewer children aged under 10years resident in the borough than aged 10 to 19; illustrating a decline in theunder 10s population. However, over time this may be reversed if the currentbirth rate continues: shown by the increases in numbers of under 2’s.* All Mid-Year Population figures have been rounded to the nearest 100 in line with Office for NationalStatistics’ Policy. As a result totals may not sum to their component partsFigure 2.2.1: Population Breakdown of 0-19s by Age and GenderPopulation Pyramid of 0-19 age group 2008Source: ONS Mid-2008 Population Estimate1,440191,2901,4701,5401,5801,5601,4401,4201,4801,5001,3601,37018171615141312111091,4501,5101,5401,3901,4601,4301,4501,3701,3101,2401,2201,1901,1801,2201,3201,3001,3701,4201,4808765432101,1801,1701,1801,1801,2301,3101,3301,3101,3401,800 1,600 1,400 1,200 1,000 800 600 400 200 0 200 400 600 800 1,000 1,200 1,400 1,600 1,800AgeThe Office of National Statistics has begun to provide accurate up to date‘ward level’ information for five-year (quinary) age groups. This informationreplaces the GP resident population data previously provided in thisdocument.Figure 2.2.2 shows ward 0-19 populations in rank order with the percentage ofthe total population shown too. Dearne South, Dearne North, North East, andSt Helen’s have the greatest number of 0-19 year olds; they also have thehighest concentrations of 0-19 year olds in <strong>Barnsley</strong> – more than one in four- 14 -
<strong>Barnsley</strong> in <strong>Depth</strong> <strong>Children</strong>’s and <strong>Young</strong> People’s Report – 2008/09 <strong>In</strong>formationof the population is under 20. Dodworth has the lowest percentage of itspopulation aged under 20 (slightly more than one-in-five or just under 2,000young people)Figure 2.2.2 Ward Population by Five-Year Age Groups 0-19 (2007)3500300027%26%27% 28%Ward Population by Five-Year Age Groups 2007Source: ONS Mid-2007 Population Estimates by Ward% value is the 0-19 population as a % of the total population26% 26%24%25% 24%24%24% 23% 22% 23%Population250020001500100087087073082083071083076065082075070077074065067072063067073061076069058068070061075066056069065055071070055062068061068070059024%59066069023% 24%24% 23%22%50063070061065058051063067049057064049059061021%52059015-1910-145007607607707006306906406006206006305505905205506005805406406004904005-90-40Dearne SouthNorth EastDearne NorthSt HelensWombwellCudworthHoyland MiltonRoystonDarton EastStairfootKingstoneRockinghamPenistone EastPenistone WestDarton WestMonk BrettonDarfieldWorsbroughCentralOld TownDodworth2.3 EthnicityThe Office for National Statistics (ONS) has published estimated residentpopulation figures by ethnic group using the mid 2007 population estimates.The table below illustrates that 95.1% of the <strong>Barnsley</strong> 0 to 15 population agegroup is White British.Figure 2.3.1: Percentage of Population by Ethnic GroupPERCENTAGE OF POPULATION 0-15Persons: White: British 95.1Persons: White: Irish 0.0Persons: White: Other White 0.7Persons: Mixed: White and Black Caribbean 0.7Persons: Mixed: White and Black African 0.2Persons: Mixed: White and Asian 0.5Persons: Mixed: Other Mixed 0.5Persons: Asian or Asian British: <strong>In</strong>dian 0.5Persons: Asian or Asian British: Pakistani 0.7Persons: Asian or Asian British: Bangladeshi 0.2Persons: Asian or Asian British: Other Asian 0.2Persons: Black or Black British: Black Caribbean 0.0Persons: Black or Black British: Black African 0.2Persons: Black or Black British: Other Black 0.0Persons: Chinese or Other Ethnic Group: Chinese 0.2Persons: Chinese or Other Ethnic Group: Other 0.2- 15 -
<strong>Barnsley</strong> in <strong>Depth</strong> <strong>Children</strong>’s and <strong>Young</strong> People’s Report – 2008/09 <strong>In</strong>formation2.4 Asylum SeekersAsylum seekers are individuals and/or families who are legally entitled toreside in the UK until their claim for asylum has been determined. Some ofthe reasons that people apply for asylum are on the grounds of escaping war,persecution, repression and human rights abuses; as a result, asylum seekerscan be very vulnerable. Further more, asylum seekers are more likely tosuffer from illnesses and diseases as a result of these issues.Figure 2.4.1 shows age and gender breakdown of asylum seekers living in<strong>Barnsley</strong> MBC accommodation. These statistics are only for the BMBCcommunity contract and do not include the numbers for the private providers.Neither does it include the 31 Unaccompanied Asylum Seeker <strong>Children</strong>(UASC) looked after by the social work team.Figure 2.4.1 Number of asylum seekers living in local authority accommodation in<strong>Barnsley</strong> as at 7th October 2009Source: <strong>Barnsley</strong> Asylum TeamAge Group Males Females Total0 to 4 44 40 845 to 11 8 16 2412 to 16 10 4 1417 to 24 33 21 5425 to 44 96 86 18245 to 64 21 17 3865+ 2 0 2Unknown 4 1 5Total 218 185 4032.5 <strong>In</strong>dices of Deprivation 2007<strong>In</strong> December 2007 the Department of Communities & Local Governmentreleased the new <strong>In</strong>dex of Multiple Deprivation 2007 (IMD 2007). Like theprevious <strong>In</strong>dices of Multiple Deprivation 2004, it is at Lower Layer SuperOutput Area (LSOA) level measure of multiple deprivation. Each of the 32,482LSOAs in England have been assigned a score and rank. The domainweights for the IMD 2007 are the same as previously used:<strong>In</strong>come Deprivation Domain 22.5%Employment Deprivation Domain 22.5%Health Deprivation and Disability Domain 13.5%Education, Skills and Training Deprivation Domain 13.5%Barriers to Housing and Services Domain 9.3%Crime Domain 9.3%Living Environment Deprivation Domain 9.3%The IMD 2007 is based on the same approach, structure and methodologythat were used to create the previous IMD 2004; however there have been afew slight indicator changes. Where possible, the indicators relate to 2005.- 16 -
<strong>Barnsley</strong> in <strong>Depth</strong> <strong>Children</strong>’s and <strong>Young</strong> People’s Report – 2008/09 <strong>In</strong>formationFor more informationhttp://www.barnsley.gov.uk/localinformationsystem2.5.1 Definition of Deprivation Quintiles for <strong>Barnsley</strong> WardsFor analysis purposes, it is easier to present the data for 21 or 22 wardsgrouped into 5 quintiles (or groups of five wards) whereby the relationship withdeprivation can be demonstrated. <strong>In</strong> theory, this should also smooth out therandom variations that may occur at ward level.The Central Research Team used the LSOA scores and population estimatesto produce population weighted ward estimates. (See Appendix B for thecalculation).The quintiles are defined using the <strong>In</strong>dex of Multiple Deprivation 2007.Quintile 1 contains the least deprived fifth of <strong>Barnsley</strong> wards and Quintile 5contains the most deprived fifth. (See Appendix B for the calculation).Figure 2.5.1 <strong>Barnsley</strong> 2007 Ward Quintiles base on estimates of IMD scores2.5.2 <strong>In</strong>come Deprivation Affecting <strong>Children</strong> <strong>In</strong>dex (IDAC)As part of the <strong>In</strong>dices of Deprivation, a supplementary <strong>In</strong>come DeprivationAffecting <strong>Children</strong> (IDAC) <strong>In</strong>dex was created. This is a subset of the <strong>In</strong>comeDeprivation Domain and comprises the percentage of an SOA’s children- 17 -
<strong>Barnsley</strong> in <strong>Depth</strong> <strong>Children</strong>’s and <strong>Young</strong> People’s Report – 2008/09 <strong>In</strong>formationunder 16 who were living in families in receipt of any of the following: <strong>In</strong>comeSupport (IS), Job Seekers Allowance (JSA) and <strong>In</strong>capacity Benefit (IB) or infamilies in receipt of Working Tax Credit (WTC)/ Disabled Person’s Tax Credit(DPTC) with equivalised income below 60% of median before housing costs.The national IDAC rankings have been used to identify how deprived childrenare in <strong>Barnsley</strong> SOAs compared with the rest of the country. Figure 2.5.2highlights that 21.1% of <strong>Barnsley</strong>’s SOAs fall into the 20% most deprivedSOAs in England – highlighting the extent of child poverty across the borough.Figure 2.5.2: Count of SOAs by <strong>In</strong>come Deprivation Affecting <strong>Children</strong> PercentileDeprivation Range Number of SOAs% of SOAs in <strong>Barnsley</strong>(most to least deprived)0-10% 12 8.2%10-20% 19 12.9%20-30% 19 12.9%30-40% 20 13.6%40-50% 27 18.4%50-60% 16 10.9%60-70% 15 10.2%70-80% 8 5.4%80-90% 9 6.1%90-100% 2 1.4%The number of children affected by income deprivation in an SOA can becalculated by multiplying the IDAC score by the number of children in eachSOA. Therefore it may be concluded that approximately 1 in 4 children in<strong>Barnsley</strong> are affected by <strong>In</strong>come Deprivation.- 18 -
<strong>Barnsley</strong> in <strong>Depth</strong> <strong>Children</strong>’s and <strong>Young</strong> People’s Report – 2008/09 <strong>In</strong>formationFigure 2.5.3 Estimates of <strong>In</strong>come Deprivation Affecting <strong>Children</strong> for Wards (2007)Source: BMBC Estimates 2007 based on <strong>In</strong>dex of Multiple Deprivation 20072.6 Child Well-Being <strong>In</strong>dexOn the 22 nd January 2009 the Department of Communities and LocalGovernment released the Local <strong>In</strong>dex of Child Well-Being (CWI) at LowerSuper Output Area Level (LSOA) and is made up of seven domains. Thereare also summary measures of the CWI presented at local authority level.The CWI is based on the approach, structure and methodology that wereused in the construction of the <strong>In</strong>dices of Deprivation 2007 and the indicatorsrelate to 2005. The seven domains included in the CWI are:• Material Well-being• Health• Education• Crime• Housing Environment• <strong>Children</strong> in Need.This is an index of child well-being rather than an index of deprivation,because it contains variables that are not strictly related to deprivation. Thisindex covers the major domains of a child’s life that have an impact on childwell-being.- 19 -
<strong>Barnsley</strong> in <strong>Depth</strong> <strong>Children</strong>’s and <strong>Young</strong> People’s Report – 2008/09 <strong>In</strong>formationFigure 2.6.1 : Local <strong>In</strong>dex of Child Well being in <strong>Barnsley</strong>The Child Well-being <strong>In</strong>dex map above shows that parts of Dearne, NorthEast, St Helens , Monk Bretton, Worsborough and Stairfoot wards consists ofthe areas with high levels of low child well-being.Using the Child Well-being <strong>In</strong>dex there are approximately 8,700 children in<strong>Barnsley</strong> who live among the 20% of areas in England with the lowest childwell-being, whereas 2,400 children live among the 20% of areas in Englandwith the highest child well-being.For more information: http://www.barnsley.gov.uk/localinformationsystem- 20 -
<strong>Barnsley</strong> in <strong>Depth</strong> <strong>Children</strong>’s and <strong>Young</strong> People’s Report – 2008/09 <strong>In</strong>formation3 <strong>Children</strong> and <strong>Young</strong> People’s HealthThere are a number of standard indicators of children and young people’shealth available from routine data sources, but these do not give a completepicture. For example, indicators of ill health are generally not sufficiently welldeveloped to be part of routine information systems. Ill health in children cantake many different forms, ranging from relatively minor self-limiting conditionsto chronic disabling and life threatening illnesses.3.1 Key Facts on <strong>Children</strong> and <strong>Young</strong> People’s Health• The number of births is increasing;• Breastfeeding initiation has increased from 50.1% in 2004/05 to63.0% in 2008/09, although fewer new mothers in <strong>Barnsley</strong> initiatebreastfeeding when compared to the national average;• 24.8% of new mothers smoke at time of discharge• The average number of decayed, missing and filled teeth isstarting to improve;• Conception Rates for both Under 18 yrs and 16 yrs are high;• Under 18’s conceptions leading to abortions is increasing• The proportion of children in reception and Year 6 who are obeseis decreasing;• The number of young people being treated for STI’s is increasing.3.2 BirthsDuring the period 2001 to 2008 there was a steady increase in the number ofbabies born in <strong>Barnsley</strong>. <strong>In</strong> the 8 year period the number of births increasedfrom 2,226 in 2001 to 2,777 in 2008, an increase of 25%.- 21 -
<strong>Barnsley</strong> in <strong>Depth</strong> <strong>Children</strong>’s and <strong>Young</strong> People’s Report – 2008/09 <strong>In</strong>formationFigure 3.2.1 Live Births to Mothers Resident in <strong>Barnsley</strong> 2001-2008Source: ONS300025002000Number of births1500100050002001 2002 2003 2004 2005 2006 2007 2008Year3.3 Projected number of live births to 2031<strong>In</strong>formation from the Office of National Statistics based on the 2006 mid yearpopulation estimates show that birth projection figures are expected toincrease and reach a peak around 2017. However if the 2008 projection iscompared to the number of births in 2008 from the mid 2008 populationestimates, the difference is 130 lower than were actually born; therefore thesefigures maybe higher.Figure 3.3.1 <strong>Barnsley</strong> Birth Rate Projections to 2031Source: ONS, Public HealthBirth Projections from 2007 to 2031(Source: 2006 Based Mid Year Estimates, ONS)280027502700Number2650260025502007 2008 2009 2010 2011 2012 2013 2014 2015 2016 2017 2018 2019 2020 2021 2022 2023 2024 2025 2026 2027 2028 2029 2030 2031Year- 22 -
<strong>Barnsley</strong> in <strong>Depth</strong> <strong>Children</strong>’s and <strong>Young</strong> People’s Report – 2008/09 <strong>In</strong>formation3.4 <strong>In</strong>fant Mortality (deaths under one year of age)<strong>In</strong>fant mortality is a key national and international measure of infant health.One of the key national targets for improving health and reducing healthinequalities relates to infant mortality. The national target is:Starting with children under one year, by 2010 to reduce the gap inmortality by at least 10% between ‘routine and manual’ groups andthe population as a whole.The national target is problematic at a borough level for two reasons:-• Due to the small number of infant deaths, it is difficult to interpretvariation in rates at a local level. Changes in trend rates may be due tochance rather than reflecting any real difference in rates.The target requires a reduction in the gap between social class bandings, which arenot routinely recorded.Figure 3.4.1 illustrates that <strong>Barnsley</strong> is experiencing slightly below the nationalaverage mortality and the regional average. <strong>In</strong> <strong>Barnsley</strong> for the 3 year period2006-08 there were 32 infant deaths (a drop of 4 from the 3 year period 2005-07). Although numbers are small, there is still potential scope to reduceinfant mortality rates further as a nation. Other countries such as Austria,Iceland and those in Scandinavia have rates of 3-4 deaths per 1,000 livebirths.Figure 3.4.1 <strong>In</strong>fant Mortality Rates 2006-08 (under one year of age)Source: Compendium of Clinical and Health <strong>In</strong>dicators7.06.05.0Rate per 1,000 live births4.03.02.01.00.0England Yorkshire and Humber <strong>Barnsley</strong>- 23 -
<strong>Barnsley</strong> in <strong>Depth</strong> <strong>Children</strong>’s and <strong>Young</strong> People’s Report – 2008/09 <strong>In</strong>formation3.5 Childhood Mortality<strong>In</strong> 2008, the number of deaths in children 1-19 years in <strong>Barnsley</strong> was verysmall. Accidents were the most common cause of death.3.6 Low Birth Weight<strong>In</strong> 2008 <strong>Barnsley</strong> had a slightly lower percentage of low birth weight (
<strong>Barnsley</strong> in <strong>Depth</strong> <strong>Children</strong>’s and <strong>Young</strong> People’s Report – 2008/09 <strong>In</strong>formationFigure 3.6.2 Low birth weight (
<strong>Barnsley</strong> in <strong>Depth</strong> <strong>Children</strong>’s and <strong>Young</strong> People’s Report – 2008/09 <strong>In</strong>formationFigure 3.7.1 Percentage of mothers smoking at time of discharge from <strong>Barnsley</strong>Hospital NHS Foundation Trust 2004/05 to 2008/09Source: Maternity System, BHNFT – All maternities35302528.6England Average 17%(<strong>In</strong>fant Feeding Survey 2005)24.526.423.924.8Percentage (%)201510502004/05 2005/06 2006/07 2007/08 2008/09YearFurther analysis of the 2007/08 and 2008/09 data by neighbourhood,illustrated in Figure 3.7.2 shows the percentage of women recorded assmoking during pregnancy by the <strong>In</strong>dex of Multiple Deprivation 2007. It canbe seen that a higher percentage were recorded as smoking duringpregnancy in the more deprived neighbourhoods.Figure 3.7.2 Percentage of Mothers Smoking at Discharge by Neighbourhood andDeprivation 2007/08 and 2008/0970.0%60.0%Percentage Smoking at Discharge50.0%40.0%30.0%20.0%10.0%R 2 = 0.69910.0%0 10 20 30 40 50 60 70Least deprivedMost deprivedEstimate <strong>In</strong>dex of Multiple Deprivation, 2007 ScoreNote: R is a figure to illustrate the correlation between two sets of data, with -1 being a perfectnegative correlation, and +1 being a perfect positive correlation. Usually, +0.7 or above isregarded a significant positive result.- 26 -
<strong>Barnsley</strong> in <strong>Depth</strong> <strong>Children</strong>’s and <strong>Young</strong> People’s Report – 2008/09 <strong>In</strong>formation3.8 <strong>In</strong>fant feedingLocal infant feeding data is available from the maternity database at the<strong>Barnsley</strong> Hospital NHS Foundation Trust for all mothers who have theirbabies at the hospital. Figure 3.8.1 illustrates the percentage of mothers whohad initiated breastfeeding at the time of discharge from hospital for the period2004/05 to 2008/09. The data shows that in 2008/09, 63.0% of new mothersinitiated breastfeeding at time of delivery.Figure 3.8.1 Proportion of <strong>Barnsley</strong> mothers initiating breast feeding at time ofdischarge 2004/05 to 2008/09Source: Maternity System, BHNFT – All maternities100.0%90.0%80.0%England Average 78%(<strong>In</strong>fant Feeding Survey 2005)Percentage <strong>In</strong>itiating Breastfeeding70.0%60.0%50.0%40.0%30.0%50.1%51.5% 51.2%57.0%63.0%20.0%10.0%0.0%2004/05 2005/06 2006/07 2007/08 2008/09YearIt is difficult to make direct comparisons between the England average and<strong>Barnsley</strong> figures as the rates have been measured at different time periods.However in 2005 the breastfeeding initiation rate in England was 78%, 15%higher than the <strong>Barnsley</strong> average for 2008/09.Further analysis of the 2007/08 and 2008/09 data by neighbourhoodillustrated in Figure 3.8.2 shows the percentage of women recorded asinitiating breastfeeding on discharge by the <strong>In</strong>dex of Multiple Deprivation2007. It can be seen that a lower percentage were recorded as initiatingbreastfeeding at discharge in the more deprived neighbourhoods.- 27 -
<strong>Barnsley</strong> in <strong>Depth</strong> <strong>Children</strong>’s and <strong>Young</strong> People’s Report – 2008/09 <strong>In</strong>formationFigure 3.8.2 Percentage of Mothers <strong>In</strong>itiating Breastfeeding Discharge byNeighbourhood and Deprivation 2007/08 and 2008/09100.0%90.0%80.0%Percentage Smoking at Discharge70.0%60.0%50.0%40.0%30.0%20.0%10.0%0.0%0 10 20 30 40 50 60Least deprivedEstimate <strong>In</strong>dex of Multiple Deprivation, 2007 ScoreR 2 = 0.5679Most deprived70Note: R is a figure to illustrate the correlation between two sets of data, with -1 being a perfectnegative correlation, and +1 being a perfect positive correlation. Usually, +0.7 or above isregarded a significant positive result.The prevalence of children breastfed at 6 to 8 weeks in 2008/09 was 29.5%,which achieved the Vital Signs Target of 21.5%. The figure for April toSeptember 2009 is 34.3%.3.9 Dental HealthDental decay is a common childhood disease which affects both deciduous(milk) and permanent teeth. The consequences of early dental decay can lastthroughout life and require ongoing care. The level of dental decay can bereduced through promoting good oral hygiene and encouraging a reduction inthe amount of and frequency of intake of sugar containing foods.Dental health is measured by the mean average number of teeth per childwhich are either actively decayed and require treatment or which were treatedfor decay either by extraction or filling (DMFT).The dental health of children is monitored by a rolling programme of surveysundertaken by the Community Dental Service in schools. <strong>In</strong> 2005/06 thesurvey was of 5 year old children. The results show that in England theaverage number of DMFT was 1.47 compared with an average of 2.03 in<strong>Barnsley</strong>, a difference of 0.56, which is too high. However, Figure 3.9.1demonstrates that there has been an improvement in the DMFT score from2.66 in 2003/04 to 2.03 in 2005/06.- 28 -
<strong>Barnsley</strong> in <strong>Depth</strong> <strong>Children</strong>’s and <strong>Young</strong> People’s Report – 2008/09 <strong>In</strong>formation3.12 Mental Health3.12.1 Assessment of Need in <strong>Barnsley</strong>Research evidence has produced known prevalence rates for specific mentalhealth problems and disorders. An assessment of need can be made byconsidering these, whilst taking into account the demographic andepidemiological information.The figures quoted below are therefore likely to represent a minimum level ofneed in <strong>Barnsley</strong>. Research studies give prevalence rates based on specificpopulations studied, i.e. by age groups. Consequently, comparable statisticsfor each problem are not available. It is also important to remember that thereare high rates of comorbidity (i.e. the same person may have more than oneproblem or disorder) therefore the same person may be counted severaltimes, under different categories. Nevertheless, to give an indication of likelynumbers affected in <strong>Barnsley</strong>, there follows some illustrative examples – seeFigure 3.12.1 below.It is important to bear in mind that these figures are only illustrative. Thusbecause of the problem of comorbidity mentioned above, the figures in thefinal column will not be added together to give a grand total. Some childrenwill have been counted twice, for example, under both conduct disorder andemotional disorder. Equally some studies provide data on all emotionaldisorders (prevalence 10% in 14 – 16 year olds) others give data on specifickinds of emotional disorder in specific age groups (e.g. ObsessiveCompulsive Disorder, 1% in 14-17 year olds).It should not be assumed that data for a particular problem in one age groupcan be extrapolated to other age groups. Thus, the figures for conductdisorder do not include data on 3 year olds (well recognised to havesignificant levels of behaviour problems) and represent a significantunderestimate. It is expected that all 3 year olds will have some behaviourproblems – so therefore are not measured. However, psychosis is extremelyrare under the age of 13 and therefore the figure quoted is unlikely to increaseby much if younger ages were taken into consideration.The figures in the Figure 3.12.1 have been arrived at by using the revisedmid- 2008 population estimates from ONS.- 30 -
<strong>Barnsley</strong> in <strong>Depth</strong> <strong>Children</strong>’s and <strong>Young</strong> People’s Report – 2008/09 <strong>In</strong>formationFigure 3.12.1: Prevalence of Some Specific Child and Adolescent Mental HealthProblemsSource: <strong>Barnsley</strong> MBC Social Services, Mental Health and ONS 2008 Mid Year PopulationEstimatesDiagnosis Age Prevalence % Approx.No’sAffectedConduct/Behavioural ProblemsConduct disorder 4-11 8.3 1,67812-16 14 2,063Attention Deficit Disorderwith Hyperactivity (DSM III) 4-16 5 1,748Substance Abuse 16 16 498Emotional ProblemsEmotional Disorder 4-16 10 3,496Obsessive Compulsive Disorder 4-17 1.0 380Over anxious Disorder 12-16 3.6 531Separation Anxiety Disorder 12-16 2.4 354Depressive Disorder 6-11 0.4-2 61-30612-19 0.4-6.4 94-1,501Suicide Attempts 12-15 1 116Developmental ProblemsEnuresis 10 2.5 67Encopresis 10 0.8 21Eating DisordersAnorexia Nervosa (DSM III) 14-17 0.3 36Bulimia Nervosa (DSM III) 14-17 2.5 300Pervasive Developmental Disorders andPsychosisAutism/Autism Spectrum 2-15 0.2 74Psychoses 13-19 0.5 1033.12.2 Referrals in <strong>Barnsley</strong>During 2008, there were 1,097 referrals to the Child and Adolescent MentalHealth Service (CAMHS), with an approximate 60:40 gender split with moreboys being referred. The majority of the children referred to CAMHS were ofWhite British ethnic origin. There were 4 discrepancies in the data thereforethe age of referral could not be obtained. Of 1,097 referrals, 2.5% were of pre- 31 -
<strong>Barnsley</strong> in <strong>Depth</strong> <strong>Children</strong>’s and <strong>Young</strong> People’s Report – 2008/09 <strong>In</strong>formationschool age (
<strong>Barnsley</strong> in <strong>Depth</strong> <strong>Children</strong>’s and <strong>Young</strong> People’s Report – 2008/09 <strong>In</strong>formationFigure 3.12.3 CAMHS Referrals per 1,000 <strong>Children</strong> Aged Under 17 yrs by Ward andDeprivationCAMHS Referrals per 1000 <strong>Children</strong> Aged Under 17 yrs by Ward and Deprivation(Source: CAMHS Database & BMBC Population Model)35.030.025.0Referrals Per 100020.015.010.02006200720085.00.0DearneNorthSt Helen'sDearneSouthNorth EastStairfootKingstoneWorsbroughMonkBrettonCentralCudworthWombwellHoylandMiltonDarfieldRoystonRockinghamOld TownDodworthDarton EastDartonWestPenistoneWestPenistoneEastMost Deprived Above Average Deprivation Average Below Above Deprivation Least DeprivedQunitile 1 Quintile 2 Quintile 3 Quintile 4 Quintile 5Of those young people referred to CAMHS most referrals have multipleproblems. However, during this period the most common diagnosis isbehaviour problems followed by education problems, family problems (e.g.conflict or health problems and deliberate self harm).3.13 Teenage Pregnancy<strong>In</strong> 2007 there were approximately 4% (40,298) conceptions to women agedunder 18 years in England, of which 0.5% (4,795) were in the Yorkshire andthe Humber Region.The Social Exclusion Unit report on Teenage Pregnancy and Parenthood,published in June 1999, set out a ten-year strategy which aims to:• Halve the rate of conceptions in the under 18’s by 2010 with an interimreduction of 15% by 2004;• Set a firmly established downward trend in the under-16 conception ratesby 2010;• <strong>In</strong>crease the participation of teenage parents in education and work to60%, to reduce the risk of long-term social exclusion.Tackling the causes and consequences of teenage pregnancy continues to bea high priority for the Government and is reflected in the cross-cutting targetsand indicators for teenage pregnancy.The under-18 rate is the most important one for the national TeenagePregnancy Strategy, which has targets to reduce this rate from its 1998 levelsby 15% in 2004 and by 50% in 2010.- 33 -
<strong>Barnsley</strong> in <strong>Depth</strong> <strong>Children</strong>’s and <strong>Young</strong> People’s Report – 2008/09 <strong>In</strong>formation3.13.1 Teenage Pregnancy - <strong>Barnsley</strong>The latest teenage pregnancy figures for <strong>Barnsley</strong> show a slight increase from49.7 (215 conceptions) to 50.4 (226 conceptions) per 1,000. As Figure 3.13.1and Figure 3.13.2 show there was a 0.7 point increase between 2006 and2007, although overall a downward trend from 1997 to 2007.Figure 3.13.1 Under 18 conception ratesSource: Teenage Pregnancy Unit70.060.0Under 18 conception rate per 100050.040.030.020.02010 target10.00.01997 1998 1999 2000 2001 2002 2003 2004 2005 2006 2007 2008 2009 2010Year<strong>Barnsley</strong> MCD Yorkshire & Humber EnglandFigure 3.13.2 Under 18 conception rates. <strong>Barnsley</strong>, Yorkshire and the Humber andEngland 1997-2007Source: Teenage Pregnancy UnitUnder 18 conception rates per 1,0001997 1998 1999 2000 2001 2002 2003 2004 2005 2006 2007<strong>Barnsley</strong>MCD64.63 60.24 57.43 52.08 51.85 52.26 57.95 50.82 54.1 49.7 50.4Yorkshireand the 51.80 53.08 51.04 47.95 47.09 46.97 46.76 47.29 47.7 46.6 47.6HumberEngland 45.55 46.64 44.75 43.64 42.48 42.59 42.06 41.49 41.3 40.4 41.7The forecast suggests that if current trends continue, the national strategy2010 target will not be met in <strong>Barnsley</strong>. <strong>In</strong> order to meet the 2010 target therewill need to be 114 fewer conceptions in women aged under 18 years in 2010than there were in 1998.A target for 2010 has not been set in the <strong>Barnsley</strong> Local Area Agreement(LAA). To be in line with the national 50% reduction target, the figure wouldhave to be 32.3 under-18 conceptions per 1,000 in 15-17 year old females.- 34 -
<strong>Barnsley</strong> in <strong>Depth</strong> <strong>Children</strong>’s and <strong>Young</strong> People’s Report – 2008/09 <strong>In</strong>formationThe LAA targets for 2008 and 2009 have been set in line with a trajectorywhich would achieve a 34% reduction from the 1998 figure by 2010, that is 40under-18 conceptions per 1000 15-17 year old females.3.13.2 Teenage Pregnancy - Distribution within <strong>Barnsley</strong>The <strong>In</strong>dex of Multiple Deprivation 2007 (IMD) score at 30.5 for <strong>Barnsley</strong> ishigh. <strong>Barnsley</strong> is the 43rd most deprived local authority out of 354. 17.7% ofthe borough population live in wards that are amongst the most 10% deprivedin England. High rates of teenage conceptions have been linked with highdeprivation.Figure 3.13.3 illustrates there is a statistical relationship between deprivationand teenage conception rates by electoral wards in <strong>Barnsley</strong>.Figure 3.13.3: Conception Rates by Deprivation Scores for Wards in <strong>Barnsley</strong> agedunder 18 2003 to 20061009080Rate per 1,000 population women aged 15-1770605040302010R 2 = 0.80300 10 20 30 40 50 60<strong>In</strong>dex of Multiple Deprivation 2007 ScoreNote: R is a figure to illustrate the correlation between two sets of data, with -1 being a perfectnegative correlation, and +1 being a perfect positive correlation. Usually, +0.7 or above isregarded a significant positive result.Figure 3.13.4 shows that this pattern of deprivation is similar to the pattern ofward teenage conception rates.- 35 -
<strong>Barnsley</strong> in <strong>Depth</strong> <strong>Children</strong>’s and <strong>Young</strong> People’s Report – 2008/09 <strong>In</strong>formationFigure 3.13.4: Under 18 Conceptions 2003 to 2005 (rate per 1,000 girls aged 15 to 17)- 36 -
<strong>Barnsley</strong> in <strong>Depth</strong> <strong>Children</strong>’s and <strong>Young</strong> People’s Report – 2008/09 <strong>In</strong>formationFigure 3.13.5 illustrates the teenage conception rates by ward in <strong>Barnsley</strong>averaged over 5 three-year periods 2000-2002, 2001-2003, 2002-2004, 2003-2005 and 2004-2006. The ward IMD 2007 scores are detailed in the finalcolumn of the table. There is a wide variation in rates between wards, as wellas between the time periods. It must be remembered that the numbersconcerned are small and this could account for these fluctuations.- 37 -
<strong>Barnsley</strong> in <strong>Depth</strong> <strong>Children</strong>’s and <strong>Young</strong> People’s Report – 2008/09 <strong>In</strong>formationFigure 3.13.5 Under 18 Teenage Conceptions by Ward (rate per 1,000 girls aged 15 to17) 2000-02, 2001-03, 2002-04, 2003-05 and 2004-06Ward Rate2000-02Rate2001-03Rate2002-04Rate2003-05Rate2004-06IMD2007ScoreDearne74.8 74.8 89.4 88.6 89.3 50.74ThurnscoeAthersley 58.1 60.1 65.9 69.7 70.6 44.01Dearne South 56.5 63.2 69.9 69.2 69.6 41.56Cudworth 77.6 79.2 75.9 87.5 68.3 32.38Park 71.8 62.5 57.9 56.4 64.5 42.86Ardsley 57 60.6 64.2 70.3 62.5 37.68Brierley 81.5 72.5 59.8 60.4 60.3 40.52South West 44.4 52.8 50.0 54.3 60.2 24.01Royston 35.6 30.7 40.5 48.7 58.7 27.65Worsbrough 54.6 72.1 76.0 63.9 58.2 40.01North West 59.1 67.5 71.7 58.2 57.2 31.03Wombwell 55.6 61.4 70.2 69.9 57.1 35.05NorthMonk Bretton 68.5 70 51.8 61.1 54.0 36.80Hoyland East 52.1 60.4 75.0 54.9 53.7 27.26Darfield 63.1 64.9 70.3 63.0 52.0 29.53Central 61 70.4 56.3 57.3 47.4 33.57Wombwell 46.1 51.4 53.2 49.5 45.2 27.88SouthHoyland West 50 61.1 69.4 53.9 43.4 25.82Darton 26.3 31.8 24.9 27.7 22.4 18.44Penistone East 19.2 19.2 16.8 13.8 19.7 11.68Dodworth 29.1 24.7 21.8 15.4 16.7 17.27Penistone West 15.7 17.3 18.9 17.6 13.5 13.60If we take the 5 wards with the highest rates (roughly 20%of the wards) in2003-05 shaded area in Figure 3.13.5 and calculate their rate together,compared with the rate of the remaining 17 wards, we find that there is a clearinequalities gap between them. The gap has widened slightly between 2002-04 and 2004-06. Figure 3.13.6 illustrates this:Figure 3.13.6 Under-18 Teenage Conception Rates per 1,000Average of the 5 Wards with thehighest conceptions rateAverage of the remaining 17Wards2000-02 2001-03 2002-04 2003-05 2004-0668.5 66.6 77.6 77.2 72.547.9 52.7 50.6 48.5 46.03.13.3 Abortion RatesNationally and regionally there is an upward trend since 1998 of an increasedproportion of under 18 conceptions ending in terminations, as can be seen in- 38 -
<strong>Barnsley</strong> in <strong>Depth</strong> <strong>Children</strong>’s and <strong>Young</strong> People’s Report – 2008/09 <strong>In</strong>formationFigure 3.13.7. High termination rates may reflect good provision of abortionservices or poor availability of contraception services. Attitudes tocontraception and the willingness to access services also affect terminationrates.Trend data for <strong>Barnsley</strong> (ONS figures) show an increase in the percentage ofconceptions leading to abortion since 1998, when 28.2% of under 18conceptions ended in terminations, compared to 42% in 2007. However thepercentage of conceptions leading to abortion in 2007 in <strong>Barnsley</strong> is lowerthan the Yorkshire and the Humber (46%) and England (51%) averages.Figure 3.13.7 Under 18s Abortion Rates 1998-2007Source: Office for National Statistics and Teenage Pregnancy Unit605040Percentage (%)30201001998 1999 2000 2001 2002 2003 2004 2005 2006 2007YearEngland Yorkshire and the Humber South Yorkshire <strong>Barnsley</strong>Figure 3.13.8 Under 18s Conceptions % leading to abortions 1998 to 20071998 1999 2000 2001 2002 2003 2004 2005 2006 2007England 42.4 43.5 44.8 46.1 45.8 46.0 46.0 46.9 48.9 51.0Yorkshire andthe Humber36.5 39.1 38.9 38.6 39.9 38.9 38.8 40.6 43.5 46.0South Yorkshire 37.2 39.5 39.6 39.5 41.9 38.0 39.7 41.0 45.9<strong>Barnsley</strong> 28.2 28.7 35.7 30.6 34.4 30.9 42.3 36.2 41.9 42.03.14 Childhood ImmunisationsThe immunisation programme is an essential part of protecting children'shealth. Rates of uptake in <strong>Barnsley</strong> are very high. Measles, Mumps andRubella (MMR) immunisation uptake rates are significantly higher than thenational average. Figure 3.14.1 illustrates that the Immunisation rates of theMMR vaccination of children by their 2 nd birthday in <strong>Barnsley</strong>.- 39 -
<strong>Barnsley</strong> in <strong>Depth</strong> <strong>Children</strong>’s and <strong>Young</strong> People’s Report – 2008/09 <strong>In</strong>formationFigure 3.14.1 Percentage of Two Year Old <strong>Children</strong> who have received the MMRVaccine100908070Percentage (%)60504030201002002/03 2003/04 2004/05 2005/06 2006/07 2007/08YearSource: COVER, Health Protection Agency<strong>Barnsley</strong>England3.15 Sexually Transmitted <strong>In</strong>fections<strong>In</strong> 2008/09, 466 young people aged 19 years and under attended theDepartment of Genito Urinary Medicine at <strong>Barnsley</strong> Hospital NHS FoundationHospital for treatment for the following sexually transmitted infections:-Figure 3.15.1 Numbers attending the Department of Genito Urinary Medicine at<strong>Barnsley</strong> Hospital NHS Foundation Hospital for treatment aged 19 years 2005/06 to2008/09Source: Department of Genito Urinary Medicine at <strong>Barnsley</strong> Hospital NHS FoundationHospitalSexually transmitted <strong>In</strong>fection 2005/06 2006/07 2007/08 2008/09Chlamydia 251 304 252 267Gonorrhoea 19 37 34 21HSV (herpes) treatments 16 16 18 27Wart treatments 99 120 114 151Total 385 477 418 466- 40 -
<strong>Barnsley</strong> in <strong>Depth</strong> <strong>Children</strong>’s and <strong>Young</strong> People’s Report – 2008/09 <strong>In</strong>formation3.16 Lifestyle <strong>In</strong>formationThe <strong>Barnsley</strong> <strong>Young</strong> People’s Health Survey is a unique survey that identifiesthe health needs and behaviours of Year 10 pupils across <strong>Barnsley</strong>. Thefollowing are the key headline figures from the analysis of the 2008 survey:-• 89.5% of the young people reported that their health was good, verygood or excellent;• 55.5% of the young people reported that they had never smoked;• Of the smokers, 34.4% reported that they smoked daily, 54.2%reported they smoked occasionally and 11.4% said they smokedoften;• 17.2% of young people had eaten no fruit and vegetables on theprevious day. 11.1% had eaten five or more portions of fruit andvegetables on the previous day;• 3.5% reported that they drank alcohol daily, 58.4% reported theydrank alcohol occasionally and 32.3% said they drank alcohol often;• 78.9% of the young people reported that they had never tried illegaldrugs.The following findings show improvements in some areas since the 2006survey and highlight key areas for further development.Improvements• <strong>Barnsley</strong> young people are reporting that their general health is betterthan in 2006;• More young people know how to contact their school nurse than in2006;• Physical activity levels have increased; almost 60% of young peopleare spending 1 to 6 hours per week doing physical activity compared to30% in 2006;• Fewer young people are regular smokers;• More young people are eating the recommended five portions of fruitand vegetables;• More young people report that they get on well with staff at theirschool;• More young people feel that sex education in school was the mosthelpful way to receive information;• More young people are aware of sexual health services in <strong>Barnsley</strong>.Areas for Action• Slightly more young people are drinking alcohol occasionally or daily.• Slightly more pupils are experiencing bullying.• More females are having sex and not using condoms.A PDF version of this report is available on the Fit for the Future website:www.barnsleyfit4thefuture.co.uk- 41 -
<strong>Barnsley</strong> in <strong>Depth</strong> <strong>Children</strong>’s and <strong>Young</strong> People’s Report – 2008/09 <strong>In</strong>formation3.17 Accident and Emergency AttendancesAccident and Emergency (A&E) attendance data can provide us withinformation about relative levels of morbidity in children and can be used asproxy measures for morbidity in general. <strong>In</strong> 2008/09 there were 22,502attendances at <strong>Barnsley</strong> Hospital NHS Foundation Trust A&E by youngpeople aged 0-19 years, this accounts for 28% of all attendances at A&Eduring 2008/09.A&E attendances were higher for males in all age groups. Highestattendances are in children under 5 years (32.3%) and 15 to 19 years (30.5%)– see Figure 3.17.1.Figure 3.17.1 Attendances at <strong>Barnsley</strong> Hospital NHS Foundation Trust A&E, 2008/09 (0to 19 year olds)Source: A&E Commissioning Dataset0 to 4 5 to 9 10 to 14 15 to 19 Grand TotalMale 4,032 1,899 2,859 3,724 12,514Female 3,238 1,535 2,077 3,134 9,984Not known 1 1 2 4Grand Total 7,271 3,434 4,937 6,860 22,502% 32.3 15.3 21.9 30.5 100.0The majority of incidents for 0-19 year olds occurred in the home (38.7%) –see Figure 3.17.2.Figure 3.17.2 <strong>In</strong>cident Location A&E Attendances at <strong>Barnsley</strong> Hospital NHS FoundationTrust A&E, 2008/09 0 to 19 year oldsSource: A&E Commissioning Dataset<strong>In</strong>cident Location Number %Home 8,709 38.7Other 6,666 29.6Public Place 4,539 20.2Educational establishment 1,924 8.6Work 418 1.9Not known 246 1.1Grand Total 22,502 100.0The majority of incidents for 0-19 year olds were categorised as ‘other’(49.9%) followed by accidents (44.3%) – see Figure 3.17.3.- 42 -
<strong>Barnsley</strong> in <strong>Depth</strong> <strong>Children</strong>’s and <strong>Young</strong> People’s Report – 2008/09 <strong>In</strong>formationFigure 3.17.3 Patient Group A&E Attendances at <strong>Barnsley</strong> Hospital NHS FoundationTrust A&E, 2008/09 (0 to 19 year olds)Source: A&E Commissioning DatasetPatient Group Number %Other 11,226 49.9Accident (non road traffic) 9,965 44.3Deliberate self-harm 409 1.8Assault 399 1.8Sports injury 262 1.2Not known 176 0.8Road traffic accident 65 0.3Grand Total 22,502 100.03.18 Childhood ObesityMonitoring children from a young age allows interventions such as healthyeating, and physical activity to be put to place in an effort to reduce theprevalence of obesity. Figure 3.18.1 shows the proportion of <strong>Barnsley</strong> childrenin Reception and Year 6 considered to be obese from the measurementstaken in 2005/06, 2006/07, 2007/08 and 2008/09. The data illustrates thatalthough there was an increase in the proportion of Reception and Year 6children who were obese in 2007/08, the proportion for both year groups hasdropped in 2008/09 from 10.4% to 9.5% of Reception children and from21.2% to 19.6% of Year 6 children.Figure 3.18.1 Proportion of obese children: Reception and Year 6, 2005/06 to 2008/09(VSB09 / NI55/56)2521.22019.919.618.0Percentage (%)151010.49.410.49.550Year R Year 6YearSource: National Child Measurement Programme2005/06 2006/07 2007/08 2008/09- 43 -
<strong>Barnsley</strong> in <strong>Depth</strong> <strong>Children</strong>’s and <strong>Young</strong> People’s Report – 2008/09 <strong>In</strong>formation3.18.1 Childhood Obesity within <strong>Barnsley</strong>Pupil postcode data from the 2007/08 National Childhood MeasurementProgramme has been geographically mapped to 1 of the 9 Well-beingPartnerships (pre May 2009).Figure 3.18.2 illustrates the prevalence of obese reception year children byWell-being Partnerships. Data shows that prevalence rates were higher thanthe England average for a number of the Well-being Partnerships, though notstatistically significant to the national average.Figure 3.18.2 Prevalence of obese reception year children in <strong>Barnsley</strong> Well-being areas,2007/08- 44 -
<strong>Barnsley</strong> in <strong>Depth</strong> <strong>Children</strong>’s and <strong>Young</strong> People’s Report – 2008/09 <strong>In</strong>formationFigure 3.18.3 Prevalence of obese year 6 children in <strong>Barnsley</strong> Well being areas, 2007/08Figure 3.18.3 illustrates the prevalence of obese year 6 children by wellbeingpartnerships. Data shows that 4 partnerships were significantly statisticallyhigher than the England average:• Darfield & Wombwell;• Dearne North & Dearne South;• Hoyland Milton & Rockingham;• Monk Bretton, Royston & St Helen’s.All other areas were not statistically different to the England average.- 45 -
<strong>Barnsley</strong> in <strong>Depth</strong> <strong>Children</strong>’s and <strong>Young</strong> People’s Report – 2008/09 <strong>In</strong>formation4 Crime and Safety4.1 Key Facts on Crime and Safety• The proportion of offences committed by girls is increasing.• Theft and handling stolen goods was the most common offencecommitted.• Offences by young people are predominantly committed by thoseaged 15 and over.• Alcohol and cannabis were the drugs most commonly used bythose referred to the BARN.• Of the reported personal injury collisions there were 5 fatalities tothe under 19’s but there were 32 serious incidents of which 71.9%involved young males.4.2 Youth Offending Team (YOT)The Youth Offending Team (YOT) works with both children and young peopleinvolved in the criminal justice system and increasingly – through itsprevention services (Youth <strong>In</strong>clusion and Support Panels [YISP] and SaferSchools Partnership [SSP]) – with those who have been identified andtargeted as being at risk of becoming involved in crime or anti-socialbehaviour.Data taken from the YOT data system showed:• <strong>In</strong> 2007/8 there were 961 offences by people aged under-18 who alsolive in <strong>Barnsley</strong>;• <strong>In</strong> 2008/9, this had decreased by 230 or 24% to 739.4.2.1 Age and GenderFigure 4.2.1 shows that offences by young people are predominantlycommitted by those aged 15 and over.- 46 -
<strong>Barnsley</strong> in <strong>Depth</strong> <strong>Children</strong>’s and <strong>Young</strong> People’s Report – 2008/09 <strong>In</strong>formationFigure 4.2.1 Number of Offences by <strong>Young</strong> People (under 18) by age of offenderTotal Offences by Age (under 18) known to YOT 2008-2009Source: BMBC Youth Offender Team200186180163160140139Total Number120100809510760404758200Age (Years)The proportion of offences committed by girls and young women hasincreased sharply from around 19% in Apr-Dec 2006 to around 23% for thewhole of 2007/08 and most recently to 29% for 2008/09. Within this group,79% of offences committed by girls and young women were by those agedunder 16. This is much higher than the proportion for male and femaletogether (66%).4.2.2 Offences & Disposals by Type- 47 -
<strong>Barnsley</strong> in <strong>Depth</strong> <strong>Children</strong>’s and <strong>Young</strong> People’s Report – 2008/09 <strong>In</strong>formationFigure 4.2.2 illustrates the number of offences by young people by the type ofoffence. Theft and Handling Stolen Goods was the most common offenceaccounting for almost one-third of offences (31%). This was followed byViolence against the person offences (23%) and Criminal Damage (14%).Public Order offences also had high numbers of offence.- 48 -
<strong>Barnsley</strong> in <strong>Depth</strong> <strong>Children</strong>’s and <strong>Young</strong> People’s Report – 2008/09 <strong>In</strong>formationFigure 4.2.2 Offences by <strong>Young</strong> People reported to YOT by Offence Type in 2008-09Source: Youth Offending TeamOffences by <strong>Young</strong> People reported to YOT by Offence Type in 2008-20091%1%1%0%0%1%0%12%6%1%2%2%3%3%31%THEFT AND HANDLINGViolence against the personCRIMINAL DAMAGEPUBLIC ORDERDRUGSOTHERVEHICLE THEFTNON DOMESTIC BURGLARYMOTORING OFFENCESBREACH OF STATUTORY ORDERDomestic burglaryBREACH OF BAILARSONRacially aggravatedSEXUAL OFFENCESFRAUD AND FORGERYROBBERY14%23%The most frequent disposals are:Charge 31%Final Warning 28%Police Reprimand 41%* figures do not sum due to rounding4.2.3 Youth <strong>In</strong>clusion Support PanelsEarly interventions are effective in preventing youth offending. A programmeof support tailored to the individual young person through Youth <strong>In</strong>clusionPanels is being developed across <strong>Barnsley</strong>.<strong>In</strong> 2008/9, 64 individuals who lived in <strong>Barnsley</strong> were involved with YISP:• Approximately three-quarters were male (77%) - a slightly higherproportion than for all young offenders (70%).• Just under two-thirds of the individuals involved in YISP are under 15years old. Only slightly more than 1 in 6 individuals then re-offendedafter YISP involvement.Whilst it is not possible to publish the ward breakdown of this information,analysis shows a concentration of YISP participants in the St Helen's ward.- 49 -
<strong>Barnsley</strong> in <strong>Depth</strong> <strong>Children</strong>’s and <strong>Young</strong> People’s Report – 2008/09 <strong>In</strong>formation4.3 Substance Misuse (Data from the BARN)The BARN is a dedicated young people’s service, offering services to under-18’s, their families and friends, who may be having problems with their own orothers drug / alcohol use. The service was set up by <strong>Barnsley</strong> Alcohol & DrugAdvisory Service (BADAS) in 1997 as a response to the growing numbers ofyoung people trying to access adult drug services.Total referrals<strong>In</strong> 2008/9 there were 283 referrals to the BARN. This includes 202 referrals tothe core team, of which 154 (130 individual young people) referrals forTYS/Treatment and 48 for drug/alcohol awareness group. There were 81referrals to the Youth Offending Team.Figure 4.3.1 Source of referrals to BARN 2008/09Source of Referrals to the BARN for TYS/TreatmentSource: BARN, 200911%1% 8%1%1%2%2%3%13%30%EducationYOTRelativeSelfSocial CareConnexionsLACDIPCAMHSPsychiatryOther28%Source: The BARN 2009There were slightly more male than female referrals to the BARN: Male 58%Female 42%. However in 2007/8 there had been a greater proportion ofmales than females (66% to 34%).The main age group for referrals to the BARN core team was the 14 and 15year old age group which accounted for 46% of referrals; 5% were under 13.- 50 -
<strong>Barnsley</strong> in <strong>Depth</strong> <strong>Children</strong>’s and <strong>Young</strong> People’s Report – 2008/09 <strong>In</strong>formationFigure 4.3.2 Age of Referrals to BARN Core Team 2008/09Age of Referrals to BARN Core Team 2008/09Source: BARN, 200914%5%19%16%under 1313141516over 1625%21%By far the greatest drugs for referrals were Alcohol and Cannabis which canbe seen from the chart below. All other drugs accounted for less than 5% ofthe total except for Ecstasy as a second drug (7%).Figure 4.3.3 Main and Second Drug for Referrals to BARN in 2008/0950%45%40%Main and Second Drug for Referrals to BARN in 2008/9MainSecond35%30%25%20%15%10%5%0%Alcohol Cannabis Solvents Ketamine Steroids Cocaine Amphet Crack Ecstasy Heroin NicotineParent supportThe BARN core team has received regular calls (31 calls since recording started1 st September-30 th April) from parents who do not want to refer themselves butreceived parenting support and drugs advice as a one-off session over the- 51 -
<strong>Barnsley</strong> in <strong>Depth</strong> <strong>Children</strong>’s and <strong>Young</strong> People’s Report – 2008/09 <strong>In</strong>formationphone. 14 parents referred themselves for longer term support. 9 of theseparents received individual support and family mediation as part of their child’scare plan. That these services have been well received is clear from all thepositive feedback the BARN has received both informally and through the Praiseand Grumble scheme.Professional Support ServicesOn average 1 professional support session per worker each month was prearrangedto either deliver general drugs awareness or support in working withyoung people with substance misuse issues. A lot of informal support is offeredto a wide range of universal/TYS professionals on a weekly basis. This workdoes not get recorded but is reflected in the many “Praises” from professionalsthat keep coming through to thank workers for their ongoing support. Aprofessional session in the central BARN Office is organised every 6 weeks forprofessionals to get an understanding of the work that is done in The BARN.There is a limit of 8 professionals on each session and most sessions are fullybooked.<strong>In</strong> total at least 18 meetings were organised/attended by the core team eachmonth. On average,. 9 multi-agency meetings and 9 meetings with individualagencies to plan working together and/or events were attended. The BARN hasan extensive network of contacts and many positive relationships through out thewhole of the Borough. The team is aware of the need for professionals to meetoccasionally face-to-face to help with referrals and general working togetherarrangements.Drop-insThe BARN established a series of community based drop-ins during Q2. <strong>In</strong> Q3and Q4 a total of 78 drop-ins where carried out. On average 9 (range 1-18)young people had an informal word with the worker per session. Although only 2actual referrals have come from these sessions, positive feedback has comefrom the young people and the professionals responsible for the drop-ins. It isthe plan for 09/10 to continue with the community drop-ins, with a possiblechange of venues depending on the needs of the areas.Venues for drop-ins 08/09 were:• Youth Centre (Dearne)• Royston Church St Clinic• St Helens community centre• Connexions Pitt Street• Connexions Wombwell• Priory School• New Street CASH clinic- 52 -
<strong>Barnsley</strong> in <strong>Depth</strong> <strong>Children</strong>’s and <strong>Young</strong> People’s Report – 2008/09 <strong>In</strong>formation4.4 Racial Harassment<strong>In</strong>formation from the <strong>Children</strong>’s, <strong>Young</strong> People’s & Families (CYPF)Directorate racial incident centre for 2008/09 show that 96 recorded incidentswere recorded relating to young people. Schools have a responsibility to logand record incidents, and are dealing with the incidents appropriately withinthe individual schools.<strong>In</strong>formation from <strong>Barnsley</strong> Racial Harassment Project ‘Annual Report’ showsthat during 20008/09 there were 17 Victims aged 0-16 and 9 Victims aged 17-24. The under 16’s and the 17-24’s were the age ranges of the predominantage ranges for offenders. The areas where the majority of these offencesoccurred were Central ward (probably around the town centre), Worsbroughand St Helens ward areas and consisted of mainly verbal abuse.(<strong>In</strong>formationreported to the CYPF Directorate has been excluded from this report).4.5 Number of Reported Personal <strong>In</strong>jury Collisions (Under 19’s)This information is based on where the collision occurred rather than wherethe young person was from. It also covers all roads in the borough includingthe nearby M1.<strong>In</strong> 2005 there were a total of 269 incidents involving young people under theage of 19 across the borough, in 2006 there were 253 and in 2007 there were213 reported incidents. <strong>In</strong> 2008 the number of incidents increased by 4.7%from previously year to 223.<strong>In</strong> 2008 there were 5 fatalities of under-19’s and there were 32 seriousincidents of which 71.9% involved young males. There were also 186 minorincidents, 59.7% involving young males.Figure 4.5.1 illustrates the number of reported collisions by ward over the lastfour years. Figures illustrate that during 2008 there were significantly moreincidents in Darton and the Dearne Area.- 53 -
<strong>Barnsley</strong> in <strong>Depth</strong> <strong>Children</strong>’s and <strong>Young</strong> People’s Report – 2008/09 <strong>In</strong>formationFigure 4.5.1 Number of Reported Personal <strong>In</strong>jury Collisions <strong>In</strong>volving Under 19'sNumber of Reported Personal <strong>In</strong>jury Collisions <strong>In</strong>volving Under 19's(Source: SYPTE)353025Number of <strong>In</strong>cidents2015102005 <strong>In</strong>cidents2006 <strong>In</strong>cidents2007 <strong>In</strong>cidents2008 <strong>In</strong>cidents50CentralCudworthDarfieldDarton EastDarton WestDearne NorthDearne SouthDodworthHoyland MiltonKingstoneMonk BrettonNorth EastOld TownPenistone EastPenistone WestRockinghamRoystonSt Helen'sStairfootWombwellWorsbroughWardFigure 4.5.2 illustrates the cumulative number of accidents by ward over thelast four years. Figures illustrate that during 2008 there has been slightly moreaccidents. More collisions have occurred in Central ward (probably around thetown centre) and Penistone East.Figure 4.5.2 Cumulative Number of Reported Personal <strong>In</strong>jury Collisions <strong>In</strong>volvingUnder 19'sCumulative Number of Reported Personal <strong>In</strong>jury Collisions <strong>In</strong>volving Under 19's(Source: SYPTE)100908070Number of <strong>In</strong>cidents605040302008 <strong>In</strong>cidents2007 <strong>In</strong>cidents2006 <strong>In</strong>cidents2005 <strong>In</strong>cidents20100CentralCudworthDarfieldDarton EastDarton WestDearne NorthDearne SouthDodworthHoyland MiltonKingstoneMonk BrettonNorth EastOld TownPenistone EastPenistone WestRockinghamRoystonSt Helen'sStairfootWombwellWorsbroughWardIt should be noted that these figures are influenced greatly by the size of theward, the population of the ward and whether the ward is mainly urban or ruralin area.- 54 -
<strong>Barnsley</strong> in <strong>Depth</strong> <strong>Children</strong>’s and <strong>Young</strong> People’s Report – 2008/09 <strong>In</strong>formation5 Youth and Social Services5.1 Key Facts on Youth and Social Services• 6,749 <strong>Young</strong> People were involved in activities organised byBMBC Youth Service.• The number of contacts to Social Care Services has increased.• The number active social care cases has increased.• The number of children with a child protection plan has increasedbut is less than four years ago.• There is an average of 15 childcare places per 100 children; this islower in deprived areas.• 69% of young carers live in single parent households.5.2 Youth ServiceThe Youth Service improves the wellbeing of young people and securesaccess to educational and recreational leisure activities and facilities. Its remitis to work with 13 to 19 year olds. Between 1 st April 2008 and 31 st March2009, 6,749 young people between 13 and 19 years of age were involved inactivities organised by the BMBC Youth Service across the whole of theborough. This amounts to 32.9% of the 13-19 year old population. (nationaltarget 25%). 3,416 young people participated in youth service activities for sixhours or more and of these, 1,098 gained an accredited award (32.1%) and2,193 achieved a recorded outcome (64.2%). <strong>In</strong> all sections <strong>Barnsley</strong>’sachievements and outcomes were higher than the National indicatorsThere is youth service provision in each forum area as well as provision whichdraws its young people from across the borough. This includes youth clubprovisions, detached work, special projects, alternative educationprogrammes and participation and inclusion work, and is shown in thefollowing table and graph.Please note that the figures are based on the forum area where the activity is held and notwhere the young person lives and that young people may attend activities in multiple forumareas as well as borough wide events.Across all the Forum Areas, the number of male youths outnumbered that ofthe female youths. <strong>In</strong> three of the nine Forum Areas, there were more thanone-fifth more males than females (Royston, Monk Bretton & St. Helen’s,Darton East & West, and Penistone East & West.Overall the numbers included 192 (2.8%) young people from an ethnicminority background.- 55 -
<strong>Barnsley</strong> in <strong>Depth</strong> <strong>Children</strong>’s and <strong>Young</strong> People’s Report – 2008/09 <strong>In</strong>formationThe Youth Service also works with young people with individual / specialeducational needs and disabilities up to the age of 25; this takes place inthree youth groups in <strong>Barnsley</strong> - Snoopy Club, Cudworth, Panda Club,Wombwell and The Options, YMCA, Town Centre as well as throughspecialist projects and integration into mainstream youth clubs; in 2008/09 thisinvolved 118 young people of which 93 were between 13 and19 years old and25 between 20 and 25 years old. There were 68 males and 50 females.The Youth service also worked with an additional 1,391 young people outsideits main age group (13-19).Figure 5.2.1 Number of <strong>Young</strong> People which Participated in Youth Club Activities byLocation of ClubSource: BMBC Youth Service 2008/09Number of <strong>Young</strong> People which Participated in ActivitiesArranged by the Youth Service During 2008/09(Source:BMBC Youth Service)2500Number of <strong>Young</strong> People200015001000500FemaleMale0Borough WideCentral, Kingstone & Old TownCudworth & North EastDarton East, Darton West & DodworthDearne North & SouthHoyland Milton & RockinghamPenistone East & WestRoyston, Monk Bretton & St HelensStairfoot & WorsbroughWombwell & DarfieldThe Youth Services offers activities around each of the five areas of the‘Every Child Matters’ framework. The five areas of the ‘Every Child Matters’framework are:• Being Healthy – able to live healthy lifestyles and receive high qualitytreatment and preventative services.• Staying Safe – able to live safely within their family and the communityallowing them to achieve their full potential.• Enjoying and Achieving – given maximum opportunities for successthrough play, leisure and learning.• Making a Positive Contribution – given opportunities to participate indecision that affect them personally and in the community where theylive, learn, work, play and grow up.- 56 -
<strong>Barnsley</strong> in <strong>Depth</strong> <strong>Children</strong>’s and <strong>Young</strong> People’s Report – 2008/09 <strong>In</strong>formation• Achieving Economic Wellbeing – able to contribute to and share inthe borough’s rising prosperity.Figure 5.2.2 shows the breakdown of the participation of young people ineach of the five areas of the ‘Every Child Matters’ framework.Figure 5.2.2: Participation of <strong>Young</strong> People in Each of the Five AreasSource: BMBC Youth Service 2008/09Number of <strong>Young</strong> People which Participated in Activities Arrangedby the Youth Service During 2008/09 by the Five Outcomes(Source: BMBC Youth Service)5000Be Healthy Enjoy & Achieve Make a Positive Contribution Stay Safe Achieve Economic Well Being45004000Number of <strong>Young</strong> People3500300025002000150010005000Borough WideCentral,Kingstone & OldTownCudworth &North EastDarton East,Darton West &DodworthDearne North &SouthHoyland Milton &RockinghamPenistone East& WestRoyston, MonkBretton & StHelensStairfoot &WorsbroughWombwell &DarfieldBeing Healthy has a specific focus on physical health, mental and emotionalhealth, sexual health, healthy lifestyles and drugs. So far 11 Sexual HealthCentres have been established across the nine Forum Areas.Figure 5.2.3 Location of the Sexual Health Centres by Area Forum AreaForum AreaLocationArea 1 - Royston, Monk Bretton & St Helens 1. St Helens CEC2. Athersley Kats Whiskers Youth ClubArea 2 – Stairfoot & Worsbrough 3. Worsbrough Youth Club4. Kendray Community HouseArea 3 – Wombwell & Darfield 5. Darfield Centre 17 Youth Club6. Wombwell Highfields Youth ClubArea 4 – Central, Kingstone & Old Town 6 M Zone at the MetrodomeArea 5 – Penistone East & WestPlanned for Penistone Youth ClubArea 6 – Dearne North & South7. Dearne Youth ClubArea 7 – Hoyland Milton & Rockingham8Komplex Youth ClubArea 8 – Cudworth & North East9Cudworth Youth ClubArea 9 – Darton East, Darton West & Dodworth10 Kexit House CEC- 57 -
<strong>Barnsley</strong> in <strong>Depth</strong> <strong>Children</strong>’s and <strong>Young</strong> People’s Report – 2008/09 <strong>In</strong>formation5.3 <strong>Children</strong>, <strong>Young</strong> People and Families: Social Care services5.3.1 Number of Referrals and Re-referrals<strong>Children</strong>, <strong>Young</strong> People and Families Social Care services received 8,013contacts in 2008/09 from which there were 2,251 referrals. This was aconsiderable increase in contacts from the 6,872 contacts in 2007/08 whereasthe numbers that converted into referrals went down from the 2,480 referralsin 2007/08.Figure 5.3.1 Referrals by Ward and Deprivation80Referrals Per 1000 Estimated Population Aged 0-18 by Ward and DeprivationDuring 2008/09(Source: BMBC <strong>Children</strong>'s Services & Central Research Team)70Number of Referrals Per 1000605040302010R 2 = 0.8302Rate Per1000Linear(Rate Per1000)0DearneNorthSt. Helen'sStairfootDearneSouthWorsbroughNorth EastMonkBrettonKingstoneCentralCudworthWombwellHoylandMiltonDarfieldRoystonRockinghamOld TownDodworthDarton EastDartonWestPenistoneWestPenistoneEastMost DeprivedAbove AverageDeprivationAverageBelow AverageDeprivationLeast DeprivedQuintile 1 Quintile 2 Quintile 3 Quintile 4 Quintile 5Note: R is a figure to illustrate the correlation between two sets of data, with -1 being a perfectnegative correlation, and +1 being a perfect positive correlation. Usually, +0.7 or above isregarded a significant positive result.Figure 5.3.1 illustrates that there are more referrals to Social Care Servicesfrom the more deprived areas compared to the more affluent areas.5.3.1 <strong>In</strong>itial Assessments & Core AssessmentsThe initial assessment is a brief assessment of each child or young personthat is referred to local authority <strong>Children</strong>’s Social Care Services. The initialassessment will find out whether the child is in need, the nature of anyservices required, and whether a further, more detailed core assessmentshould be undertaken. This should be completed by <strong>Children</strong>’s Social Caresocial workers who, by working with colleagues, should complete it within amaximum of seven working days of the date of referral. The initial assessmentperiod may be very brief if the criteria for initiating a Child Protectioninvestigation under Section 47 of the <strong>Children</strong> Act 1989 are met (see 5.3.2).- 58 -
<strong>Barnsley</strong> in <strong>Depth</strong> <strong>Children</strong>’s and <strong>Young</strong> People’s Report – 2008/09 <strong>In</strong>formationThe core assessment follows on from the initial assessment, and workingclosely with the child or young person, builds upon it. The prime considerationis whether the child or young person is suffering or is likely to suffer significantharm.There were 1,664 initial assessments and 414 core assessments completedin 2008/09, a decrease from the number of initial assessments (1,791) in2007/08 and an increase from the number of core assessments (352) in2007/08. Figure 5.3.2 illustrates that there is a significant (strong) statisticalrelationship between the number of <strong>In</strong>itial assessments and with deprivationfactors.Figure 5.3.2 Number of <strong>In</strong>itial and Core Assessments by Ward and Deprivation60Number of <strong>In</strong>itial & Core Assessments Per 1000 Estimated PopulationAged 0-18 by Ward and Deprivation During 2008/09(Source: BMBC <strong>Children</strong>'s Services & Central Research Team)Number of Assessments per 10005040302010Rate Per 1000IARate Per 1000CA0DearneNorthSt. Helen'sStairfootDearneSouthWorsbroughNorth EastMonkBrettonKingstoneCentralCudworthWombwellHoylandMiltonDarfieldRoystonRockinghamOld TownDodworthDarton EastDartonWestPenistoneWestPenistoneEastMost DeprivedAbove AverageDeprivationAverageBelow AverageDeprivationLeast DeprivedQuintile 1 Quintile 2 Quintile 3 Quintile 4 Quintile 55.3.2 Active Social Care CasesOn March 31 2009 there were 1,292 active children’s cases; this had grownfrom 1,167 in April 2008. This growth continued and peaked in July at 1,516, itis currently (as of October 2009) stable at just over 1,300 service users.These active cases include assessments as well as child protection, childrenin care and family support cases.5.3.3 Child in NeedThe number of children subject to a Child Protection Plan increased from 149to 169 during 2008/2009. Although this was an increase this is still less thanfour years ago.- 59 -
<strong>Barnsley</strong> in <strong>Depth</strong> <strong>Children</strong>’s and <strong>Young</strong> People’s Report – 2008/09 <strong>In</strong>formationA total of 168 children were made subject to a child protection plan during2008-9 compared to 157 the previous year. There were 22 (13.09%)individuals who became subject to a child protection plan for a second orsubsequent time in 2008/09, compared to 27 (17.2%) individuals in 2007/08.On 31st March 2009, 266 children and young people were looked after by theCouncil compared with 257 the previous year. The number of children whohad three or more placements during the year was 11.7% in 2008/09, thesame as the previous year.There are approximately 30 unaccompanied young asylum seekers in thecare system in 2009. This number has increased over the last three years. Itrepresents roughly 10% of the care population; they are largely housed inindependent living and due to the nature of shared living arrangements aremore likely to experience multiple placements within a single year.A snapshot of children in care shows 25% 0-5 years old, 18% 6-11 years oldand 57% 12 -18 years old. A similar snapshot of children subject to a childprotection plan shows 60% 0-5 years old, 31% 6-11 years old and 9% 12-18years old. 12.8% of children in care were fostered by relatives or friends and85.4% of children in care aged 10 to 15 were fostered or placed for adoption.Figure 5.3.3: The number of children in need rate per 1000 by ward and deprivation50Number of <strong>Children</strong> in Need Rate Per 1000 Estimated PopulationAged 0-18 by Ward and Deprivation During 2008/09(Source: BMBC <strong>Children</strong>'s Services and Central Research Team)Number of <strong>Children</strong> in Need Per 1000454035302520151050R 2 = 0.6897<strong>Children</strong> in NeedRate Per 1000Linear (<strong>Children</strong> inNeed Rate Per1000)DearneNorthSt. Helen'sStairfootDearneSouthWorsbroughNorth EastMonkBrettonKingstoneCentralCudworthWombwellHoylandMiltonDarfieldRoystonRockinghamOld TownDodworthDarton EastDartonWestPenistoneWestPenistoneEastMost DeprivedAbove AverageDeprivationAverageBelow AverageDeprivationLeast DeprivedQuintile 1 Quintile 2 Quintile 3 Quintile 4 Quintile 55.3.4 Disabled <strong>Children</strong> & <strong>Young</strong> PeopleAt July 2009, 209 disabled children and young people were in direct contactwith a social worker. Of these children, 37 have a family support worker, 4have short breaks with foster carers, 43 receive a direct payment and arrangetheir own care/services, 21 have care packages from an independent agency,- 60 -
<strong>Barnsley</strong> in <strong>Depth</strong> <strong>Children</strong>’s and <strong>Young</strong> People’s Report – 2008/09 <strong>In</strong>formation18 receive the sponsored childminding service and 72 have short breaks orday care on a residential basis. The numbers of children receiving shortbreaks and the type of provision is increasing due to additional investmentfrom the Aiming High for Disabled <strong>Children</strong> programme.5.3.5 Common Assessment FrameworkThe Common Assessment Framework (CAF) is a central part of theGovernment’s plan to make sure that different services work together tosupport children and young people by:• Making sure that children and young people who have ‘additionalneeds’ are identified as early as possible;• Reducing the number of assessments children and young people mightneed to undergo;• Improving the quality of assessments across all services for childrenand young people;• Supporting any referrals between different services that are necessaryabout children and young people.The Common Assessment Framework is also becoming embedded inpractice and the number of Common Assessments completed on youngpeople is 566 for 2008-09, which demonstrates a continuing growth overprevious years (374 in 2007/8 and 159 in 2006/7). All newborns in <strong>Barnsley</strong>have a pre CAF assessment by midwife. 356 staff across the borough weretrained during 2008/9 in completion of the assessments and this notablyincludes staff from adult services. Again this demonstrates advances onprevious years (470 in 2007/8 and 218 in 2006/7).The growth in the use of CAF increases the assurance that young people andtheir families are directed to the appropriate prevention agencies and sourcesof support, advice and guidance, and this is reflected in a reduction ofreferrals to social care. The “Team Around the Child” process ensures theinvolvement of all relevant agencies in a holistic manner.5.4 Disabled <strong>Children</strong>’s ServiceThe Disabled <strong>Children</strong>'s Service includes the Disabled <strong>Children</strong>’s Social WorkTeam, Occupational Therapists, Physiotherapists and Speech and LanguageTherapists. <strong>In</strong> addition, there are two residential short break units, Keresforthand Summerwell.The service supports children and young people with a learning or physicaldisability, sensory impairment and children with an autistic spectrumcondition.At any time, the Disabled <strong>Children</strong>'s Social Work Team work withapproximately 200 children from across the Borough providing social worksupport. They work closely with other agencies and services. The team- 61 -
<strong>Barnsley</strong> in <strong>Depth</strong> <strong>Children</strong>’s and <strong>Young</strong> People’s Report – 2008/09 <strong>In</strong>formationassess what types of support disabled children and their families may need.This can include information, home support, or short breaks provided, forexample, by a direct payment, child-minder support to access play and leisureopportunities or overnight short breaks at Summerwell or Keresforth.Summerwell Resource Centre and Keresforth <strong>Children</strong>’s Unit provided thefollowing services in 2008/09.Figure 5.4.1 Number of <strong>Children</strong> Accessing Disabled <strong>Children</strong>'s ServiceNumber of childrenaccessing serviceOvernight staysprovided over 12 monthperiodDay care sessionsprovided over 12 monthperiodKeresforth <strong>Children</strong>’sUnit29 1,065 60Summerwell <strong>Children</strong>’sUnit62 1,644 44Source: Disabled <strong>Children</strong> ServiceAlongside use of Summerwell Resource Centre and Keresforth <strong>Children</strong>’sUnit:• 8 children were cared for full-time on a residential basis;• 16 children were cared for full-time by foster carers;• 37 children had a family support worker;• 4 children had short breaks with a foster carer;• 43 children received receive a direct payment to arrange their owncare/services (an increase from 30 in 2007/8);• 21 children had care packages from an independent agency;• 18 children received the sponsored childminding service.Each year the Disabled <strong>Children</strong>'s Team, in conjunction with other agenciesruns a Summer “Fun Club”. <strong>In</strong> 2008, over 100 children accessed this service.<strong>In</strong> May 2007, the government published the Aiming High for Disabled <strong>Children</strong>programme which sets out how services should be working together toimprove outcomes for disabled children by providing better and timely supportto families. Additional funding has been made available to support a range ofimprovements; this includes better and more short breaks, access to childcare for working parents of disabled children, participation through parentsgroups and forums and improved transition for disabled young people to adultservices.Alongside the substantial funding for the programme the Government hasintroduced measures to make the system work better for disabled children,young people and their families. Key to the system transformation is the CoreOffer and the Disabled <strong>Children</strong>'s National <strong>In</strong>dicator. The Core Offer sets out anational statement of expectations for how disabled children and their familieswill be informed and involved as their needs are assessed and the necessaryservices are delivered. The Core Offer covers:- 62 -
<strong>Barnsley</strong> in <strong>Depth</strong> <strong>Children</strong>’s and <strong>Young</strong> People’s Report – 2008/09 <strong>In</strong>formation• Good provision of information;• Transparency in how the available levels of support are determined;• <strong>In</strong>tegrated assessment;• Participation of disabled children and their families in local services;• Accessible feedback and complaints procedures.The largest investment in the Aiming High programme is for thetransformation of short break services. BMBC receives funding of £259krevenue and £128k capital in 2009/10 and £836k revenue and £299k capitalin 2010/11 to support this transformation. Plans are progressing to use thisfunding to ensure there is a wide a range of quality short break provisionwhich includes a full spectrum of inclusion to play and leisure activities, tomore specialist short break residential provision. Funding is also being usedto develop key posts to ensure families have access to good information andare supported to be involved in service development.5.5 Childcare <strong>In</strong>formationSince the implementation of the 2006 Childcare Act, the local authority hashad a statutory duty to ensure that there are sufficient childcare places tomeet the needs of local people. Changes in unemployment levels, workingpatterns and affordability for local people are just some of the indicators thelocal authority has to consider when meeting its duty. <strong>In</strong> addition, they haveto manage the market, including the option of incentivising the private andvoluntary sector to provide sufficient childcare places.The following information has been supplied by the Early Childhood Servicewhich receives information relating to registered childcare via the Ofsteddatabase.5.5.1 Childcare Places by WardAs at 31 March 2009, <strong>Barnsley</strong> had 5,693 childcare places (age 0-14 years)compared to 6,711 the previous March. This reduction has beenpredominantly in the childminding sector, where over 50 childminders havede-registered over the past year, mainly due to Ofsted’s data cleanse wherechildminders are no longer operating. <strong>In</strong> addition, the Families <strong>In</strong>formationService cleansed their database to remove all playgroups that were dualregistered as day nurseries.Please note – The calculation for childcare places is based on counting out of schoolprovision as separate: breakfast/after school/holiday places, although they are all at thesame facility. For comparable calculations, the same format has been used this year, but ithas been recognised that this should be reviewed over the forthcoming year.- 63 -
<strong>Barnsley</strong> in <strong>Depth</strong> <strong>Children</strong>’s and <strong>Young</strong> People’s Report – 2008/09 <strong>In</strong>formationFigure 5.5.1:The actual number of Ofsted registered childcare places by ward.Total Number Ofsted Registered Childcare Places by Wardand Deprivation as at 31/03/2009(Source: Early Childhood Service)600500Number of Places4003002001000DearneNorthSt HelensStairfootDearneSouthWorsbroughNorth EastMonkBrettonKingstoneCentralCudworthWombwellHoylandMiltonDarfieldRoystonRockinghamOld TownDodworthDarton EastDartonWestPenistoneWestPenistoneEastMost Deprived Above Average Deprivation Average Below Above Deprivation Least DeprivedQuintile 1 Quintile 2 Quintile 3 Quintile 4 Quintile 5The chart above illustrates that Royston have the highest and Darton Westhave the lowest number of Ofsted registered childcare places.5.5.2 Childcare Penetration Rates<strong>In</strong> order for childcare places to be meaningful, they need to be measuredagainst the actual number of children by ward. Overall the borough has anaverage of 15 childcare places per 100 <strong>Children</strong>. Whilst Royston still has thehighest number of places, St Helen’s (rather than Darton West) now has thelowest number of Ofsted registered childcare places relative to the actualnumber of children by ward (rather than simply counting the places by ward).Figure 5.5.2: The Total Childcare Penetration Rates by WardTotal Childcare Penetration Rates by Ward and Deprivation as at 31/03/2009(Source: Early Childhood Service)35%30%Childcare Penetration Rates25%20%15%10%5%0%DearneNorthSt HelensStairfootDearneSouthWorsbroughNorth EastMonkBrettonKingstoneCentralCudworthWombwellHoylandMiltonDarfieldRoystonRockinghamOld TownDodworthDarton EastDartonWestPenistoneWestPenistoneEastMost Deprived Above Average Deprivation Average Below Above Deprivation Least DeprivedQuintile 1 Quintile 2 Quintile 3 Quintile 4 Quintile 5- 64 -
<strong>Barnsley</strong> in <strong>Depth</strong> <strong>Children</strong>’s and <strong>Young</strong> People’s Report – 2008/09 <strong>In</strong>formation5.5.5 Average Childcare CostsAs at March 2009, the average childcare costs were as follows:Full Day Care:• £148 a week £31 a day<strong>In</strong> the Non disadvantaged areas the average rates were:• £152 a week £32 a day<strong>In</strong> the Disadvantaged areas, the average rates were:• £146 a week £31 a dayThe above shows a difference of an average of £6 a week between nurserieslocated in disadvantaged areas and the remainder of the borough. However,a significant number of parents use part-time care, thereby the difference of£1 per day is minimal.Holiday Care• £92.81 a week for out-of-school holiday care – compared tothe regional average of £94.56.5.5.6 Take up of Formal ChildcareNo robust indicator is currently available to measure this target, i.e. it is notpossible to measure how many parents use childcare vouchers directly withtheir employers as opposed to tax credits. Therefore, local authoritiesmeasure the take up of formal childcare on the childcare element of theWorking Tax Credits. As at March 2009, 17.9 % of eligible families in<strong>Barnsley</strong> claimed the Childcare element of the tax credits. This is only 1%behind the national average and is the highest in the region.5.5.7 Quality of ChildcareFollowing the introduction of the new Early Years Foundation Stage (EYFS)Ofsted inspections, 53% of the 38 providers inspected between September2008 and March 2009 received a Good or Outstanding outcome. This is animprovement on the previous period April 2007 to March 2008, where 42%received the same grade. This has been a result of intensive joint workingand support by the Council’s Early Childhood Services team.As at March 2009, 93% of settings with a Quality Assurance Scheme orworking towards one had a Good Ofsted outcome.- 66 -
<strong>Barnsley</strong> in <strong>Depth</strong> <strong>Children</strong>’s and <strong>Young</strong> People’s Report – 2008/09 <strong>In</strong>formation5.6 <strong>Young</strong> CarersA <strong>Young</strong> Carer is defined as:“A child or young person (who is under the age of 18) who is carryingout significant caring tasks and assuming a level of responsibility foranother person, which would normally be taken by an adult”.(Department of Health 1995, Chief <strong>In</strong>spector letter C1 (95) 12)Support for young carers in <strong>Barnsley</strong> is provided by Action for <strong>Children</strong><strong>Barnsley</strong> <strong>Young</strong> Carers Project. <strong>In</strong> 2008 the project supported 65 youngpeople.The average age of a young carer in 2008 was 12 years of age, the youngestyoung carer was 5 years old and the oldest was 17 years of age.The majority of young carers lived in a single Parent household (69%). Otheryoung carers lived in household with two Parents or Grandparents; this isdetailed in the chart belowFigure 5.6.1 Family Structure of <strong>Young</strong> CarersFamily StructureSingle Parent 69%Two Parent 26%Grandparents 3%Source: BMBC CYP DirectorateThe areas where most young Carers were located in 2008 were localities:Athersley North/South, New Lodge, Lundwood, Darfield, Wombwell andBillingley.- 67 -
<strong>Barnsley</strong> in <strong>Depth</strong> <strong>Children</strong>’s and <strong>Young</strong> People’s Report – 2008/09 <strong>In</strong>formationFigure 5.6.2 Total Number of Carers During 2008Localities Areas Total No of Carers Localities(2008)1Athersley North/South, New Lodge, Lundwood,Royston, Carlton, Monk Bretton 16 123Bank End, Stairfoot, Ardsley, Worsborough,Ward Green, Kendray 3 2Darfield, Wombwell, Billingley, Middlecliff, LowValley, Little Houghton 16 345Kingstone, Wilthorpe, CentralCawthorne, Silkstone, Hoylandswaine,<strong>In</strong>gbirchworth, Penistone, Thurgoland, Oxspring,Thurlstone12 42 5678Thurnscoe, Bolton on Dearne, GoldthorpeHoyland, Elsecar, Birdwell, Jump5 66 7Brierley, Great Houghton, West Green,Cudworth, Shafton, Grimethorpe 4 89Gilroyd, Dodworth, Higham, Barugh Green,Redbrook, Gawber, Darton, Mapplewell,Kexborough, Staincross1 9TOTAL 65<strong>In</strong> 2008 the project received 50 referrals which came from the followingsources.Figure 5.6.3: <strong>Young</strong> Carers Referral SourcesReferral SourcesNoreferrals14of1210864201 2 3 4 5 6 7 8 9 10 111, Education2, Health3, Social Services4, Self5, Child and Adolescent Unit6, Community PsychiatricTeam7, Voluntary Sector8, Disabled <strong>Children</strong>’s Team9, Youth Offending TeamThe illness / disability of the people that young carers provide care for are asfollows.- 68 -
<strong>Barnsley</strong> in <strong>Depth</strong> <strong>Children</strong>’s and <strong>Young</strong> People’s Report – 2008/09 <strong>In</strong>formationFigure 5.6.4: The “Cared for” Person’s Disability / IllnessChart to show “cared for” person’s disability / illness.Physical Disability 52%Mental Health 27%Learning Disability 5%Substance Misuse 11%Sensory Disability 5%During 2008 the project supported young carers in the following ways.• Practical support e.g. domestic support, referrals to other agencies,coordinating and contributing to meetings with other professionals;• Leisure activities e.g. trips / activities in school holidays and afterschool;• Educational support e.g. liaising and supporting schools that areworking with young carers. Access to training courses e.g. First Aid,Moving and Handling;• Advocacy;• <strong>In</strong>volvement in shaping local policies and procedures e.g. <strong>Barnsley</strong>Carers Strategy;• Support young carers in applying for the Emergency Care Card.The project continues to raise the profile and awareness of the needs ofyoung carers in <strong>Barnsley</strong>, to allow greater insight and support for youngcarers. Also to enable us to identify and therefore provide support to youngcarers who are as yet not known to the authority.- 69 -
<strong>Barnsley</strong> in <strong>Depth</strong> <strong>Children</strong>’s and <strong>Young</strong> People’s Report – 2008/09 <strong>In</strong>formation6 EducationIt is a statutory requirement for <strong>Barnsley</strong> Local Authority (LA) to maintain aCentral Pupil Database, and also to facilitate the accurate capture of pupillevel data from maintained educational establishments through the tri-annualSchool Census. Analysis of this data set at Borough level gives us details forall pupils in <strong>Barnsley</strong> schools, including those whose address is outside of theauthority’s administrative boundaries. Ward analysis is based on the identifiedhome address of each pupil, and excludes pupils registered to a <strong>Barnsley</strong> LAmaintained school living outside the borough. Therefore, the sum of wardfigures will not match the Borough level figures (although differences areminor).6.1 Key Facts on Education• Number of pupils in both Primary and Secondary schools havedeclined.• 5.2% of Primary pupils and 2.9% of secondary pupils were ofethnic origin.• Approximately 7,000 pupils identified as SEN.• Number of pupils receiving FSM has increased.• Pupils at KS1, KS2 are below the national average• Achievement in both Maths and English at KS2 shows disparitybetween boys and girls.• FSM pupils are outperformed at KS2 by their counterparts.• 33.1% ofpupils achieved 5 A*-C passes at GCSE including English& Maths.• The number of Post 16 learners have increased (LSC data).• The number of young people undertaking work based learninghas increased.• 8.7% of 16-18 year olds were NEET.6.2 Number of PupilsThe January 2009, School Census identified 32,000 pupils of all agesregistered to <strong>Barnsley</strong> schools that could be allocated to a ward. The chartsbelow show that the number of pupils in both Primary and Secondary schoolsacross <strong>Barnsley</strong> has declined over the last three years in the majority of thewards. This is a significant trend for <strong>Barnsley</strong>, as services and provision needto be planned and delivered within this context.- 70 -
<strong>Barnsley</strong> in <strong>Depth</strong> <strong>Children</strong>’s and <strong>Young</strong> People’s Report – 2008/09 <strong>In</strong>formationFigure 6.2.1: Numbers of Primary School Pupils by WardSource: DCSF School Census, January 2009Number of Primary School Pupils by Ward(Source: <strong>Barnsley</strong> LEA)140012001000Number of Pupils8006002007200820094002000CentralCudworthDarfieldDarton EastDarton WestDearne NorthDearne SouthDodworthHoyland MiltonKingstoneMonk BrettonNorth EastOld TownPenistone EastPenistone WestRockinghamRoystonSt Helen'sStairfootWombwellWorsbroughFigure 6.2.2 Gain/Loss of Primary School Pupils by Ward 2007-2009Source: DCSF School Census, January 2009Gain/Loss of Primary School Pupils by Ward(Source: <strong>Barnsley</strong> LA)40CentralCudworthDarfieldDarton EastDarton WestDearne NorthDearne SouthDodworthHoyland MiltonKingstoneMonk BrettonNorth EastOld TownPenistone EastPenistone WestRockinghamRoystonSt Helen'sStairfootWombwellWorsbrough200-20Number of Pupils-40-60-80-100-120-140-160- 71 -
<strong>Barnsley</strong> in <strong>Depth</strong> <strong>Children</strong>’s and <strong>Young</strong> People’s Report – 2008/09 <strong>In</strong>formationFigure 6.2.3 Numbers of Secondary School Pupils by WardSource: DCSF School Census, January 2009Number of Secondary School Pupils by Ward(Source: <strong>Barnsley</strong> LA)800700600Number of Pupils5004003002007200820092001000CentralCudworthDarfieldDarton EastDarton WestDearne NorthDearne SouthDodworthHoyland MiltonKingstoneMonk BrettonNorth EastOld TownPenistone EastPenistone WestRockinghamRoystonSt Helen'sStairfootWombwellWorsbroughFigure 6.2.4 Gain/Loss of Secondary School Pupils by Ward 2007 - 2009Source: DCSF School Census, January 2009Gain/Loss of Secondary School Pupils by Ward(Source: <strong>Barnsley</strong> LA)50CentralCudworthDarfieldDarton EastDarton WestDearne NorthDearne SouthDodworthHoyland MiltonKingstoneMonk BrettonNorth EastOld TownPenistone EastPenistone WestRockinghamRoystonSt Helen'sStairfootWombwellWorsbrough3010Number of Pupils-10-30-50-70-90- 72 -
<strong>Barnsley</strong> in <strong>Depth</strong> <strong>Children</strong>’s and <strong>Young</strong> People’s Report – 2008/09 <strong>In</strong>formation6.3 Ethnicity<strong>In</strong> January 2009, 5.2% of Primary school pupils were of ethnic origins otherthan White British or English, while the same figure for Secondary schoolswas 2.9%. Both figures have increased from 2007 to 2009, with the primaryfigure (increase of 0.4% since 2008 and 1.2% since 2007) higher than theincrease for secondary pupils (increase of 0.3% from 2008 and 0.5% from2007).Figure 6.3.1 illustrates that Kingstone Ward (15.4%) has the highestproportion of Ethnic Minority pupils in Primary Schools. Kingstone Ward alsohas had the largest percentage increase in Ethnic Minority pupils between2007 and 2009, an increase of 6.3%. Central Ward has the second highestproportion of Ethnic Minority pupils (9.2%), whilst Cudworth has seen thesecond highest percentage increase, 2.8% between 2007 and 2009.Figure 6.3.1: Percentage of Primary School Pupils from an Ethnic Group by WardSource: DCSF School Census, January 2009Percentage of Primary School Pupils from an Ethnic Group by Ward(Source: <strong>Barnsley</strong> LA)18.016.014.012.0% of Pupils10.08.06.02007200820094.02.00.0DearneNorthSt Helen'sStairfootDearneSouthWorsbroughNorth EastMonkBrettonKingstoneCentralCudworthWombwellHoylandMiltonDarfieldRoystonRockinghamOld TownDodworthDarton EastDartonWestPenistoneWestPenistoneEastMost DeprivedAbove AverageDeprivationAverageBelow AverageDeprivationLeast DeprivedQuintile 1 Quintile 2 Quintile 3 Quintile 4 Quintile 5Figure 6.3.2 illustrates that in Kingstone, Rockingham and St. Helen’s wardsthere was an increase of 2% or more in the number of Ethnic Minoritysecondary school pupils between January 2007 and 2009.- 73 -
<strong>Barnsley</strong> in <strong>Depth</strong> <strong>Children</strong>’s and <strong>Young</strong> People’s Report – 2008/09 <strong>In</strong>formationFigure 6.3.2: Percentage of Secondary School Pupils from an Ethnic Group by WardSource: DCSF School Census, January 2009Percentage of Secondary School Pupils from an Ethnic Group by Ward(Source: <strong>Barnsley</strong> LA)8.07.06.0% of Pupils5.04.03.02007200820092.01.00.0DearneNorthSt Helen'sStairfootDearneSouthWorsbroughNorth EastMonkBrettonKingstoneCentralCudworthWombwellHoylandMiltonDarfieldRoystonRockinghamOld TownDodworthDarton EastDartonWestPenistoneWestPenistoneEastMost DeprivedAbove AverageDeprivationAverageBelow AverageDeprivationLeast DeprivedQuintile 1 Quintile 2 Quintile 3 Quintile 4 Quintile 56.4 Special Educational NeedsThe term Special Educational Needs (SEN) has a legal definition. <strong>Children</strong>with special educational needs all have learning difficulties or disabilities thatmake it harder for them to learn or access education than most children of thesame age. These children may need extra or different help from that given toother children of the same age.SEN can be further divided into three areas of support: School Action, SchoolAction Plus and Pupils with Educational Statements. Across <strong>Barnsley</strong> inJanuary 2009, there were approximately 7,000 pupils identified as SEN(18.8% of all primary pupils and 24.4% of all secondary).Figures show that there are variations in the number of SEN pupils across all<strong>Barnsley</strong> wards. For example, the primary data shows that in January 2009there is over a 20% difference between the percentages of SEN pupils livingin Penistone East ward (10.1%) compared to those living in Dearne Northward (31.0%).- 74 -
<strong>Barnsley</strong> in <strong>Depth</strong> <strong>Children</strong>’s and <strong>Young</strong> People’s Report – 2008/09 <strong>In</strong>formationFigure 6.4.1 below shows that there is a positive relationship between thepercentage of pupils with SEN and deprivation.Figure 6.4.1: Percentage of Primary Pupils with Special Educational Needs by WardSource: DCSF School Census, January 2009Percentage of Primary School Pupils with Special Educational Needs by Ward(Source: <strong>Barnsley</strong> LA)35.030.025.0%20.015.0200720082009Linear (2009)10.0R 2 = 0.74295.00.0DearneNorthSt Helen'sStairfootDearneSouthWorsbroughNorth EastMonkBrettonKingstoneCentralCudworthWombwellHoylandMiltonDarfieldRoystonRockinghamOld TownDodworthDarton EastDartonWestPenistoneWestPenistoneEastMost DeprivedAbove AverageDeprivationAverageBelow AverageDeprivationLeast DeprivedQuintile 1 Quintile 2 Quintile 3 Quintile 4 Quintile 5Note: R is a figure to illustrate the correlation between two sets of data, with -1 being a perfectnegative correlation, and +1 being a perfect positive correlation. Usually, +0.7 or above isregarded a significant positive result.Figure 6.4.2 Percentage of Secondary Pupils with Special Educational Needs by WardSource: DCSF School Census, January 2009- 75 -
<strong>Barnsley</strong> in <strong>Depth</strong> <strong>Children</strong>’s and <strong>Young</strong> People’s Report – 2008/09 <strong>In</strong>formationPercentage of Secondary School Pupils with Special Educational Needs by Ward(Source: <strong>Barnsley</strong> LA)40.035.030.0%25.020.015.0200720082009Linear (2009)R 2 = 0.342110.05.00.0DearneNorthSt Helen'sStairfootDearneSouthWorsbroughNorth EastMonkBrettonKingstoneCentralCudworthWombwellHoylandMiltonDarfieldRoystonRockinghamOld TownDodworthDarton EastDartonWestPenistoneWestPenistoneEastMost DeprivedAbove AverageDeprivationAverageBelow AverageDeprivationLeast DeprivedQuintile 1 Quintile 2 Quintile 3 Quintile 4 Quintile 5<strong>In</strong> the secondary sector there is a higher level of Special Educational Needscompared to the primary sector (24.4% compared to 18.8%). There are fourwards that have over 30% of their pupil population identified as SEN: DearneNorth, Hoyland Milton, Rockingham and Worsborough. Again the ward withleast pupils with SEN is Penistone East.6.5 Pupils Eligible for Free School MealsFree School Meals (FSM) are available to pupils in families on low incomesand/or benefits that fulfil the relevant criteria. Therefore, the percentage ofpupils eligible for FSM has been used within education as a proxy indicator fordeprivation for many years. Research also shows that pupils on FSM usuallyachieve to a lower standard and make less progress than all pupils overall.<strong>In</strong> January 2009 across <strong>Barnsley</strong> as a whole, there were approximately 5,800pupils eligible for FSM: 21.3% of all pupils in primary schools (an increase of1.0% from 2008) and 16.8% in secondary schools (an increase of 0.6% from2008). The figures below illustrate that Dearne North has the highest rate ofFSM within <strong>Barnsley</strong>, whereas Penistone East has the lowest. There is astrong statistical relationship between FSM and deprivation.Figure 6.5.1 Percentage of Free School Meals in Primary Schools by WardSource: DCSF School Census, January 2009- 76 -
<strong>Barnsley</strong> in <strong>Depth</strong> <strong>Children</strong>’s and <strong>Young</strong> People’s Report – 2008/09 <strong>In</strong>formationPercentage of Free School Meals in Primary Schools by Ward(Source: <strong>Barnsley</strong> LA)50.045.040.035.0%30.025.020.0200720082009Linear (2009)15.010.05.0R 2 = 0.90270.0DearneNorthSt Helen'sStairfootDearneSouthWorsbroughNorth EastMonkBrettonKingstoneCentralCudworthWombwellHoylandMiltonDarfieldRoystonRockinghamOld TownDodworthDarton EastDartonWestPenistoneWestPenistoneEastMost DeprivedAbove AverageDeprivationAverageBelow AverageDeprivationLeast DeprivedQuintile 1 Quintile 2 Quintile 3 Quintile 4 Quintile 5Note: R is a figure to illustrate the correlation between two sets of data, with -1 being a perfectnegative correlation, and +1 being a perfect positive correlation. Usually, +0.7 or above isregarded a significant positive result.Figure 6.5.2 Percentage of Free School Meals in Primary Schools by Ward- 77 -
<strong>Barnsley</strong> in <strong>Depth</strong> <strong>Children</strong>’s and <strong>Young</strong> People’s Report – 2008/09 <strong>In</strong>formationFigure 6.5.3 Percentage of Free School Meals in Secondary Schools by WardSource: DCSF School Census, January 2009Percentage of Free School Meals in Secondary Schools by Ward(Source: <strong>Barnsley</strong> LA)35.030.025.0%20.015.0200720082009Linear (2009)10.05.0R 2 = 0.77890.0DearneNorthSt Helen'sStairfootDearneSouthWorsbroughNorth EastMonkBrettonKingstoneCentralCudworthWombwellHoylandMiltonDarfieldRoystonRockinghamOld TownDodworthDarton EastDartonWestPenistoneWestPenistoneEastMost DeprivedAbove AverageDeprivationAverageBelow AverageDeprivationLeast DeprivedQuintile 1 Quintile 2 Quintile 3 Quintile 4 Quintile 5Note: R is a figure to illustrate the correlation between two sets of data, with -1 being a perfectnegative correlation, and +1 being a perfect positive correlation. Usually, +0.7 or above isregarded a significant positive result.- 78 -
<strong>Barnsley</strong> in <strong>Depth</strong> <strong>Children</strong>’s and <strong>Young</strong> People’s Report – 2008/09 <strong>In</strong>formationFigure 6.5.4 Percentage of Free School Meals in Secondary Schools byWard6.6 AttendanceA persistent absentee is a pupil who misses at least a fifth of the availablesessions in a school for any reason or combination of reasons (whether theabsence is authorised or unauthorised). For example, it can be a pupil whohas a chronic or recurring illness or a pupil who has missed 20% of availablesessions because of a combination of authorised and unauthorised absence.<strong>In</strong> many schools persistent absence represents missing 64 sessions (halfdays)between September and May or 52 sessions between September andEaster.Further information can be found on the DCSF website at:http://www.dfes.gov.uk/schoolattendanceThe persistent absence data within this document relates to the Autumn Term2007/08.The Dearne North ward has the highest percentage of primary school pupilswho demonstrate persistent absenteeism with 5.8% of pupils missing morethan 20% of school sessions (note: 20% absence equates to, on average, aday a week missed). At the other end of the scale in Darton East andPenistone East only 1.3% of pupils missed more than 20% of schoolsessions.Figure 6.6.1 shows that as the level of deprivation in a Ward increases sodoes the percentage of pupils deemed to be persistent absentees.- 79 -
<strong>Barnsley</strong> in <strong>Depth</strong> <strong>Children</strong>’s and <strong>Young</strong> People’s Report – 2008/09 <strong>In</strong>formationFigure 6.6.1 Percentage of primary pupils with less than 80% attendance record bywardSource: DCSF School Census, January 20087.0Percentage of Primary school Pupils classified as being persistent absentees (below 80%attendance) - Autumn Term 2007/08(Source: <strong>Barnsley</strong> LA 2008)6.05.0% of Pupils4.03.0> 80 AttendanceLinear (> 80Attendance)2.01.0R 2 = 0.68620.0DearneNorthSt Helen'sStairfootDearneSouthWorsbroughNorth EastMonkBrettonKingstoneCentralCudworthWombwellHoylandMiltonDarfieldRoystonRockinghamOld TownDodworthDarton EastDartonWestPenistoneWestPenistoneEastMost DeprivedAbove AverageDeprivationAverageBelow AverageDeprivationLeast DeprivedQuintile 1 Quintile 2 Quintile 3 Quintile 4 Quintile 5Again, at secondary school level the Dearne North ward has the highestpercentage of school pupils who demonstrate persistent absenteeism with12.6% of pupils missing more than 20% of school sessions. The ward with thelowest percentage of persistently absent pupils is Old Town ward.Figure 6.6.2 Percentage of secondary pupils with less than 80% attendance record bywardSource: DCSF School Census, January 200814.0Percentage of Secondary school Pupils classified as being persistent absentees (below 80%attendance) - Autumn Term 2007/08(Source: <strong>Barnsley</strong> LA 2008)12.010.0% of Pupils8.06.0> 80 AttendanceLinear (> 80Attendance)4.0R 2 = 0.47512.00.0DearneNorthSt Helen'sStairfootDearneSouthWorsbroughNorth EastMonkBrettonKingstoneCentralCudworthWombwellHoylandMiltonDarfieldRoystonRockinghamOld TownDodworthDarton EastDartonWestPenistoneWestPenistoneEastMost DeprivedAbove AverageDeprivationAverageBelow AverageDeprivationLeast DeprivedQuintile 1 Quintile 2 Quintile 3 Quintile 4 Quintile 5- 80 -
<strong>Barnsley</strong> in <strong>Depth</strong> <strong>Children</strong>’s and <strong>Young</strong> People’s Report – 2008/09 <strong>In</strong>formation6.7 Early Years Foundation StageThe Early Years Foundation Stage (EYFS) is a framework which waslaunched on 13 March 2007 and came into force in September 2008. It is thenew regulatory and quality framework for the provision of learning,development and care for children between birth and the academic year inwhich they turn five.From September 2008 the Foundation Stage Profile was renamed the EarlyYears Foundation Stage Profile but the content remained the same. Allregistered early years providers were required to use the EYFS frameworkfrom September 2008 and to complete an EYFS profile for each child at theend of the academic year in which they reach the age of five.The primary purpose of the EYFS profile is to provide year 1 teachers andparents with reliable and accurate information about each child's level ofdevelopment as they reach the end of the EYFS. This will enable the teacherto plan an effective, responsive and appropriate curriculum that will meet allchildren's needs, to support their continued achievement more fully.Each child's development is recorded against 13 assessment scales, basedon the early learning goals and divided between the six areas of learning anddevelopment:• Personal, Social and Emotional Development (3 scales)• Communication, Language and Literacy (4 scales)• Problem-solving, reasoning and numeracy (3 scales)• Knowledge and understanding of the world (1 scale)• Physical Development (1 scale)• Creative Development (1 scale)Judgments against these scales are made from observation of consistent andindependent behavior, predominantly from children's self-initiated activities.The main National <strong>In</strong>dicator for the EYFS is N.I. 72 which measures thepercentage of children achieving at least 78 points across the Early YearsFoundation Stage with at least 6 in each of the scales in Personal Social andEmotional Development and Communication, Language and Literacy.Figure 6.7.1 shows that there is considerable disparity between wards interms of children who achieve 6 or above in all PSE and CLL scales and 78points in total. St. Helen’s ward has the children with the lowest proportionachieving this indicator with 6.1%. The ward with the highest proportion ofchildren achieving this indicator is Penistone East with 45.2%- 81 -
<strong>Barnsley</strong> in <strong>Depth</strong> <strong>Children</strong>’s and <strong>Young</strong> People’s Report – 2008/09 <strong>In</strong>formationFigure 6.7.1: Percentage of children achieving 6 or above in all PSE and CLL scalesand 78 points across all scales (National <strong>In</strong>dicator 72)Source: BMBC EMS 2008Percentage of children achieving 6 or above in all PSE and CLL scales and 78 points across allscales (N.I. 72)(Source: <strong>Barnsley</strong> LA 2008)% 6+ in PSE and CLL and 78 points across the Profile50.045.040.035.030.025.020.015.010.05.00.0DearneNorthSt Helen'sStairfootDearneSouthWorsbroughNorth EastMonkBrettonKingstoneCentralCudworthWombwellHoylandMiltonDarfieldRoystonRockinghamOld TownDodworthDarton EastDartonWestPenistoneWestPenistoneEastMost Deprived Above Average Deprivation Average Below Average Deprivation Least DeprivedQuintile 1 Quintile 2 Quintile 3 Quintile 4 Quintile 56.8 Key Stage 1 Assessment<strong>Children</strong> will normally be aged seven at the end of key stage 1, and thenational expectation is that they will have reached level 2B. Teacherassessment is used to report pupil’s progress in Reading, Writing,Mathematics, Science and Speaking & Listening; although in many casestasks and tests will have been undertaken to help the teacher reach theirassessment. Pupils assessed as working below level 1 (usually, but notexclusively SEN) are tested against ‘P Scales’, which allow the demonstrationof progress for lower achieving pupils.Within Mathematics, 86.8% of pupils achieved Level 2 or higher in 2008,compared to 86.9% in 2007 representing a fall of -0.1%. Compared to thenational average of 89%, <strong>Barnsley</strong> falls below by 2.2%. There was somevariation across the wards, with Old Town pupils achieving the highestsuccess rate, whereas St Helen’s achieved the lowest. <strong>In</strong>terestingly, DartonEast is a weak performer compared to Wards of similar deprivation. Figure6.8.1 illustrates that deprivation has very little affect on pupil performance inMathematics.- 82 -
<strong>Barnsley</strong> in <strong>Depth</strong> <strong>Children</strong>’s and <strong>Young</strong> People’s Report – 2008/09 <strong>In</strong>formationFigure 6.8.1: Percentage of Pupils Achieving Level 2+ in Maths at Key Stage 1Source: EMS, 2008Percentage of Pupils Achieving Level 2+ at Key stage 1 in Maths(Source: <strong>Barnsley</strong> LA 2008)120.0100.080.0R 2 = 0.3657% of Pupils60.040.0%L2+<strong>Barnsley</strong> LALinear (%L2+)20.00.0DearneNorthSt Helen'sStairfootDearneSouthWorsbroughNorth EastMonkBrettonKingstoneCentralCudworthWombwellHoylandMiltonDarfieldRoystonRockinghamOld TownDodworthDarton EastDartonWestPenistoneWestPenistoneEastMost DeprivedAbove AverageDeprivationAverageBelow AverageDeprivationLeast DeprivedQuintile 1 Quintile 2 Quintile 3 Quintile 4 Quintile 5Note: R is a figure to illustrate the correlation between two sets of data, with -1 being a perfectnegative correlation, and +1 being a perfect positive correlation. Usually, +0.7 or above isregarded a significant positive result.Figure 6.8.2: Percentage of Pupils Achieving Level 2+ in Reading at Key Stage 1Source: EMS, 2008Percentage of Pupils Achieving Level 2+ at Key Stage 1 in Reading(Source: <strong>Barnsley</strong> LA 2008)100.090.080.0R 2 = 0.798270.0% of Pupils60.050.040.0%L2+<strong>Barnsley</strong> LALinear (%L2+)30.020.010.00.0DearneNorthSt Helen'sStairfootDearneSouthWorsbroughNorth EastMonkBrettonKingstoneCentralCudworthWombwellHoylandMiltonDarfieldRoystonRockinghamOld TownDodworthDarton EastDartonWestPenistoneWestPenistoneEastMost DeprivedAbove AverageDeprivationAverageBelow AverageDeprivationLeast DeprivedQuintile 1 Quintile 2 Quintile 3 Quintile 4 Quintile 5Note: R is a figure to illustrate the correlation between two sets of data, with -1 being a perfectnegative correlation, and +1 being a perfect positive correlation. Usually, +0.7 or above isregarded a significant positive result.- 83 -
<strong>Barnsley</strong> in <strong>Depth</strong> <strong>Children</strong>’s and <strong>Young</strong> People’s Report – 2008/09 <strong>In</strong>formationFor Reading (see Figure 6.8.2), 79.4% of KS1 pupils achieved level 2 orhigher representing an increase 0.4% compared to the year 2007 but still over4% lower than nationally. The variation in standards between wards wasgreater than Mathematics (19.3%), showing a 22.5% difference between thelowest and highest ward.<strong>In</strong> Writing, 75.6% of pupils achieved Level 2, compared to 80% of pupilsnationally. At local authority level this represents a fall of -0.3% compared tothe year 2007. The variation between wards was much higher than that for theother subjects showing a difference of 32% between the lowest ward (St.Helen’s) and the highest (Penistone East). Again, Figure 6.8.3 demonstratesthat, as a rule, better results are achieved in the less deprived wards thanthose in the more deprived wards.Figure 6.8.3: Percentage of Pupils Achieving Level 2+ in Writing at Key Stage 1Source: EMS, 2008Percentage of Pupils Achieving Level 2+ Key Stage 1 in Writing(Source: <strong>Barnsley</strong> LA 2008)100.090.0R 2 = 0.573680.070.0% of Pupils60.050.040.0%L2+<strong>Barnsley</strong> LALinear (%L2+)30.020.010.00.0DearneNorthSt Helen'sStairfootDearneSouthWorsbroughNorth EastMonkBrettonKingstoneCentralCudworthWombwellHoylandMiltonDarfieldRoystonRockinghamOld TownDodworthDarton EastDartonWestPenistoneWestPenistoneEastMost DeprivedAbove AverageDeprivationAverageBelow AverageDeprivationLeast DeprivedQuintile 1 Quintile 2 Quintile 3 Quintile 4 Quintile 5Note: R is a figure to illustrate the correlation between two sets of data, with -1 being a perfectnegative correlation, and +1 being a perfect positive correlation. Usually, +0.7 or above isregarded a significant positive result.6.9 Key Stage 2<strong>Children</strong> will normally be aged 11 at the end of Key Stage 2, taking anationally scripted test at the end of their primary education. A typical 11-yearoldwill normally be expected to be working at level 4. <strong>In</strong> <strong>Barnsley</strong>, 2,620primary school pupils took KS2 tests in 2008.- 84 -
<strong>Barnsley</strong> in <strong>Depth</strong> <strong>Children</strong>’s and <strong>Young</strong> People’s Report – 2008/09 <strong>In</strong>formationFrom 2008, in line with commitments in the <strong>Children</strong>’s Plan and to reflect newtargets for raising attainment in English and maths, the Secretary of Statedecided that the KS2 Tables will focus on the percentage of eligible pupilsachieving Level 4 or above in both English and maths.<strong>In</strong> this new combined measure, 68.2% of the pupils in <strong>Barnsley</strong> schoolsachieved level 4 or above (the national level being 73%). There was adifference of 36.1% in pupil’s achievement between the highest (PenistoneEast) and lowest (St. Helen’s) wards.Figure 6.9.1: Percentage of Pupils Achieving Level 4+ in English and maths combinedat Key Stage 2Source: EMS, 2008Percentage of Pupils Achieving Level 4+ at Key Stage 2 in BOTH English and Maths(Source: <strong>Barnsley</strong> LA 2008)100.090.080.0R 2 = 0.6532% of Pupils70.060.050.040.030.0%L4+<strong>Barnsley</strong> LEALinear (%L4+)20.010.00.0DearneNorthSt Helen'sStairfootDearneSouthWorsbroughNorth EastMonkBrettonKingstoneCentralCudworthWombwellHoylandMiltonDarfieldRoystonRockinghamOld TownDodworthDarton EastDartonWestPenistoneWestPenistoneEastMost DeprivedAbove AverageDeprivationAverageBelow AverageDeprivationLeast DeprivedQuintile 1 Quintile 2 Quintile 3 Quintile 4 Quintile 5Note: R is a figure to illustrate the correlation between two sets of data, with -1 being a perfectnegative correlation, and +1 being a perfect positive correlation. Usually, +0.7 or above isregarded a significant positive result.- 85 -
<strong>Barnsley</strong> in <strong>Depth</strong> <strong>Children</strong>’s and <strong>Young</strong> People’s Report – 2008/09 <strong>In</strong>formationFigure 6.9.2 Percentage of Pupils Achieving KS2 L4+ in English and maths combinedby WardAchievement in both English and Maths at Level 4 shows a clear disparitybetween boys and girls. Overall, 65.5% of boys attained Level 4 or abovecompared to 70.9% of girls in 2008. <strong>In</strong> 16 out of 21 wards, the girls attainedmore Level 4’s than the boys and in a handful of wards (Rockingham, NorthEast, Cudworth, Darfield and Royston) the girls outperformed the boys by wellover 10%. <strong>In</strong> just one ward (Hoyland Milton) did the boys out perform the girlsby the same margin. The boy’s strongest performance was in Old Town wardwhere 87.8% achieved Level 4. Conversely their weakest performance was inDearne North, where just 50% achieved the benchmark. Girl’s attainment washighest in Penistone East (91.1%) and lowest in St. Helen’s (54.3%).- 86 -
<strong>Barnsley</strong> in <strong>Depth</strong> <strong>Children</strong>’s and <strong>Young</strong> People’s Report – 2008/09 <strong>In</strong>formationFigure 6.9.3: Percentage of Boys and Girls Achieving Level 4+ in English and mathscombinedSource: EMS, 2008Percentage of Boys and Girls Achieving Level 4+ at Key Stage 2 in BOTH English and Maths(Source: <strong>Barnsley</strong> LA 2008)100.090.080.070.0% of Pupils60.050.040.030.0BoysGirls20.010.00.0DearneNorthSt Helen'sStairfootDearneSouthWorsbroughNorth EastMonkBrettonKingstoneCentralCudworthWombwellHoylandMiltonDarfieldRoystonRockinghamOld TownDodworthDarton EastDartonWestPenistoneWestPenistoneEastMost DeprivedAbove AverageDeprivationAverage Below Average Deprivation Least DeprivedQuintile 1 Quintile 2 Quintile 3 Quintile 4 Quintile 5Note: R is a figure to illustrate the correlation between two sets of data, with -1 being a perfectnegative correlation, and +1 being a perfect positive correlation. Usually, +0.7 or above isregarded a significant positive result.Achievement between Free School Meal Eligible (FSM) and <strong>In</strong>eligible pupilsshows an even starker contrast than that seen for gender. Overall, for thepercentage of pupils achieving Level 4 or above in English and Mathscombined, FSM pupils achieve around 30% lower than the pupils who are noteligible for FSM. <strong>In</strong> 20 out of the 21 wards, FSM pupils are outperformed bytheir counterparts, and the performance of Penistone East is skewed by lowpupil numbers. The poorest performance of FSM pupils is in St. Helen’s Ward(29.3%) followed by Penistone West (30%)- 87 -
<strong>Barnsley</strong> in <strong>Depth</strong> <strong>Children</strong>’s and <strong>Young</strong> People’s Report – 2008/09 <strong>In</strong>formationFigure 6.9.4: Percentage of Pupils Achieving Level 4+ in English and maths combinedby Free School Meal EligibilitySource: EMS, 2007Percentage of FSM <strong>In</strong>eligible and FSM Eligible Pupils Achieving Level 4+ at Key Stage 2 in BOTHEnglish and Maths(Source: <strong>Barnsley</strong> LA 2008)120.0100.080.0% of Pupils60.040.0Fsm <strong>In</strong>eligibleFSM Eligible20.00.0DearneNorthSt Helen'sStairfootDearneSouthWorsbroughNorth EastMonkBrettonKingstoneCentralCudworthWombwellHoylandMiltonDarfieldRoystonRockinghamOld TownDodworthDarton EastDartonWestPenistoneWestPenistoneEastMost DeprivedAbove AverageDeprivationAverageBelow AverageDeprivationLeast DeprivedQuintile 1 Quintile 2 Quintile 3 Quintile 4 Quintile 5Note: R is a figure to illustrate the correlation between two sets of data, with -1 being a perfectnegative correlation, and +1 being a perfect positive correlation. Usually, +0.7 or above isregarded a significant positive result.6.10 GCSE (KS4) AchievementsThe General Certificate of Secondary Education (GCSE) was introduced in1986 with first examinations in 1988. It is the principal means of assessingpupil attainment at the end of compulsory secondary education.All GCSE syllabuses used in maintained schools must be formally approvedby the Qualifications and Curriculum Authority. A quality assurance frameworkensures standards are maintained between awarding bodies and syllabusesyear on year.GCSEs are not compulsory examinations, although schools enter the majorityof their pupils for this examination. Schools are normally required to teach theNational Curriculum programmes of study at Key Stage 4 in English,Mathematics, Science, ICT, PE, as well as RE, Careers Education, SexEducation, and Citizenship. GCSE passes are awarded a grade ranging fromA* to G.The key indicator at KS4 shows the percentage of pupils at the end of keystage 4 achieving 5 or more GCSEs (or equivalent) at grades A*-C includingEnglish and Mathematics GCSEs.- 88 -
<strong>Barnsley</strong> in <strong>Depth</strong> <strong>Children</strong>’s and <strong>Young</strong> People’s Report – 2008/09 <strong>In</strong>formationFigure 6.10.1 Percentage of <strong>Barnsley</strong> Pupils Achieving 5+ A*-C GCSEs includingEnglish and maths or equivalentSource EMS 2008Year Total Male Female2008 33.1% 30.2 36.22007 31.5% 29.3 33.6The percentage of young people achieving 5 A*-C passes that include GCSEEnglish and Mathematics is the main indicator for KS4 attainment. Overall,33.1% of pupils achieved this measure in 2008. At ward level, Dearne North(18.3%), Darfield (21.2%) and St. Helen’s (21.5%) had the lowest percentageof pupils achieving 5+ A*-C passes including GCSE English and Mathematics,two of which are in the most deprived quintile and the other one in the‘average’ quintile. Penistone East (56.3%) had the highest attainment andbelongs to the least deprived quintile.Figure 6.10.2: Percentage of Pupils Achieving 5+ A*-C GCSEs including English andmaths or equivalentSource EMS 2008Percentage Achieving 5+ A*- C inc. English and Mathematics at Key Stage 4(Source: <strong>Barnsley</strong> LA 2008)60.050.0% of Pupils40.030.020.0All Pupils<strong>Barnsley</strong> LA10.00.0Dearne NorthSt Helen'sStairfootDearne SouthWorsbroughNorth EastMonk BrettonKingstoneCentralCudworthWombwellHoyland MiltonDarfieldRoystonRockinghamOld TownDodworthDarton EastDarton WestPenistone WestPenistone EastMost Deprived Above Average Deprivation Average Below Average Deprivation Least DeprivedQuintile 1 Quintile 2 Quintile 3 Quintile 4 Quintile 5- 89 -
<strong>Barnsley</strong> in <strong>Depth</strong> <strong>Children</strong>’s and <strong>Young</strong> People’s Report – 2008/09 <strong>In</strong>formationFigure 6.10.3 Percentage of Pupils Achieving 5+ GCSEs at grade A* to C by Ward<strong>In</strong> <strong>Barnsley</strong>, 36.2% of girls achieved 5+ A*-C GCSEs including English andMathematics or equivalent compared to 30.2% of boys. <strong>In</strong> 17 out of 21 wards,the girls outperformed the boys. The biggest attainment gaps were seen inRoyston (20.1%), Cudworth (18.8%) and Darfield (17.9%). Strongestperformance for both boys and girls was in Penistone East where both groupsachieved over 50%.Figure 6.10.4 Percentage of Boys and Girls Achieving 5+ A*-C GCSEs includingEnglish and maths or equivalentPercentage of Boys and Girls Achieving 5+ A*- C inc. English and Mathematics at Key Stage 4(Source: <strong>Barnsley</strong> LA 2008)60.050.040.0% of Pupils30.020.0BoysGirls10.00.0Dearne NorthSt Helen'sStairfootDearne SouthWorsbroughNorth EastMonk BrettonKingstoneCentralCudworthWombwellHoyland MiltonDarfieldRoystonRockinghamOld TownDodworthDarton EastDarton WestPenistone WestPenistone EastMost Deprived Above Average Deprivation Average Below Average Deprivation Least DeprivedQuintile 1 Quintile 2 Quintile 3 Quintile 4 Quintile 5- 90 -
<strong>Barnsley</strong> in <strong>Depth</strong> <strong>Children</strong>’s and <strong>Young</strong> People’s Report – 2008/09 <strong>In</strong>formationSimilar to Key Stage 2 the attainment gap for Free School Meal Eligible pupilsis even greater than it is for Gender. Only 12.4% of Free School Meal Pupilsachieve 5+ A*-C GCSEs including English and Mathematics or equivalent. <strong>In</strong>2008, none of the FSM pupils living in Penistone West achieved the measure.Seven other wards also had achievement rates of fewer than 10% for theirFSM cohorts. The best performance of FSM pupils came in Central Wardwhere 53.8% of pupils achieved the indicator. This however, was theexception rather than the norm, as it was the only ward where FSM pupilsoutperformed the other pupils.Figure 6.10.5 Percentage of Free School Meal Eligible and <strong>In</strong>eligible pupils achieving5+ A*-C GCSEs including English and maths or equivalentPercentage of FSM <strong>In</strong>eligible and FSM Eligible Pupils Achieving 5+ A*- C inc. English andMathematics at Key Stage 4 (Source: <strong>Barnsley</strong> LA 2008)60.050.040.0FSM <strong>In</strong>eligible% of Pupils30.020.0FSM Eligible10.00.0Dearne NorthSt Helen'sStairfootDearne SouthWorsbroughNorth EastMonk BrettonKingstoneCentralCudworthWombwellHoyland MiltonDarfieldRoystonRockinghamOld TownDodworthDarton EastDarton WestPenistone WestPenistone EastMost Deprived Above Average Deprivation Average Below Average Deprivation Least DeprivedQuintile 1 Quintile 2 Quintile 3 Quintile 4 Quintile 5<strong>In</strong> <strong>Barnsley</strong>, 98.4% of young people achieved at least one entry levelqualification. At ward level, Hoyland Milton (92.2%) and Rockingham (96.1%)had the lowest percentage of pupils achieving this measure. Perhapssurprisingly neither of these wards is in the most deprived quintiles. <strong>In</strong> severalwards all the pupils attained at least one entry level qualification.- 91 -
<strong>Barnsley</strong> in <strong>Depth</strong> <strong>Children</strong>’s and <strong>Young</strong> People’s Report – 2008/09 <strong>In</strong>formationFigure 6.10.6 Percentage of pupils achieving 1+ Entry Level qualification Key Stage 4Percentage of pupils Achieving 1+ Entry Level Qualification at Key Stage 4(Source: <strong>Barnsley</strong> LA 2008)100.098.096.094.0% of Pupils92.090.088.0All Pupils<strong>Barnsley</strong> LA86.084.082.080.0Dearne NorthSt Helen'sStairfootDearne SouthWorsbroughNorth EastMonk BrettonKingstoneCentralCudworthWombwellHoyland MiltonDarfieldRoystonRockinghamOld TownDodworthDarton EastDarton WestPenistone WestPenistone EastMost Deprived Above Average Deprivation Average Below Average Deprivation Least DeprivedQuintile 1 Quintile 2 Quintile 3 Quintile 4 Quintile 56.11 Post 16 Learning and Skills (LSC Data)The Learning and Skills Council (LSC) is responsible for all post-16 educationand training other than in universities. Their work covers:• Further education;• Work-based training and young people;• School sixth forms;• Workforce development;• Adult and community learning;• <strong>In</strong>formation, advice and guidance for adults;• Education business links.IMPORTANT NOTE: The information at <strong>Barnsley</strong> level for Participation Ratescomes from the 14-19 Data Pack provided by the LSC to <strong>Children</strong>, <strong>Young</strong>People & Families Service. <strong>In</strong>formation for the Old Wards (pre-2004) and forall geographical levels for the Success Rates comes from the LSC’sdatabases and has not been through the same data cleansing processes asthe published data, i.e. the impact of learners completing courses anddropping out during the academic year is not dealt with in the same way asthe published results. There will therefore be a difference between the<strong>Barnsley</strong> level Success Rate data published here (for comparison) and that ofthe official data released by the LSC.- 92 -
<strong>Barnsley</strong> in <strong>Depth</strong> <strong>Children</strong>’s and <strong>Young</strong> People’s Report – 2008/09 <strong>In</strong>formationFigure 6.11.1 Summary of Post-16 Education Learners 2006/7 – 2008/9 (part year)Source: <strong>Barnsley</strong> 14-19 Data Pack2006-07(FullYear)2007-08(FullYear)2008-09(PartYear)% Change2006-07 to2007-08DeliveryFurther Education 3,758 3,888 4,124 3.5%Schools 494 519 530 5.1%Apprenticeships 1,340 1,427 1,282 6.5%Entry to Employment 399 502 392 25.8%Total 5,991 6,336 6,328 5.8%Figure 6.11.1 shows a summary of the numbers of <strong>Barnsley</strong> resident learnersby year and by learner route. Overall between 2006/7 and 2007/8 the numberof Learners has increased by 5.8%. Entry to Employment (25.8%) andApprenticeships (6.5%) have shown the greatest increase over the period.Non-school further education is by far the most common route for post-16further education: 61.4% of all learners in 2007/8.Figure 6.11.2: All <strong>Barnsley</strong> Resident StudentsSource: Dept for <strong>Children</strong>, Schools and Families2006 2007 2008 2009All Resident Pupils 447 490 492 508- at <strong>Barnsley</strong> Sixth Form 219 231 263 271- at other LA Sixth Form 228 259 229 237<strong>In</strong>formation from the Pupil Level Annual School Census (PLASC) shows thatas at January 2009 there were 508 students from <strong>Barnsley</strong> who were aged16-19 studying in school sixth forms. There is only one school in <strong>Barnsley</strong>which has a sixth form; therefore young people tend to extend their learning atnearby colleges or cross the LEA border: as of January 2009 there were 237students who live in <strong>Barnsley</strong> but go to Sixth Forms in other local authorityareas.Further EducationA total of 3,888 young people were registered as participating at FurtherEducation Colleges during 2007/8. Compared with the previous academicyear, there was a 3.5% increase in the number of learners.At the time of analysis no directly comparable information at regional andnational level was available. The information below shows Further Educationparticipation based on the area of residence for 16-18 year olds but it comesfrom a slightly different source.- 93 -
<strong>Barnsley</strong> in <strong>Depth</strong> <strong>Children</strong>’s and <strong>Young</strong> People’s Report – 2008/09 <strong>In</strong>formationFigure 6.11.3: Participation in Further Education (Level 2 and 3) by 16-18 year olds byarea of residence 2004/5 to 2007/8Source: The Data Service, Statistical First Release June 09 Table S3.12005/06 2006/07 2007/08% change:2005/6 to2007/8<strong>Barnsley</strong> 3,900 4,000 4,100 5.1South Yorkshire 18,200 18,300 18,900 3.8Yorkshire and The Humber 74,100 75,700 77,000 3.9England 622,600 639,100 653,900 5.0Figure 6.11.4 Participation rates of 16-19 year olds in School or College FurtherEducation in 2007/8 by WardSource: The Data Service, Statistical First Release June 09 Table S3.1600Rate of 16-19 year olds in Further Education (including Schools) in<strong>Barnsley</strong> by ward of residence 2007/8Source: LSCRate per 000 aged 16-195004003002001000Penistone WestDodworthNorth WestCentralDartonPenistone EastRoystonHoyland EastParkSouth WestAthersleyWombwell NorthHoyland WestMonk BrettonWombwell SouthDearne ThurnscoeCudworthArdsleyDearne SouthDarfieldBrierleyWorsbroughFigure 6.11.5 shows the proportion of the 16-19 year old population that are inFurther Education. The influence of Education Maintenance Allowances 1which are concentrated in areas of lowest household income (and thereforedeprivation) might level out the participation rates in wards.Figure 6.11.5: Number of learners receiving at least one Education MaintenanceAllowance payment 2004/5 to 2007/8Source: http://www.lsc.gov.uk/providers/Data/statistics/learner/EMA_take_up.htm<strong>Barnsley</strong>(number)Yorkshire & Humber(number)England2004/5* 2005/6** 2006/7 2007/81,821 2,071 2,61936,466 47,413 57,676297,259 429,627 527,3192,81160,239546,472(number)Note: * = 16 year olds only (except pilot areas which are 16-18; <strong>Barnsley</strong> not a pilot)1EMA provides financial support to learners from low income households to continue in learning. It is aweekly allowance of up to £30, payable to young people in the 16-19 age group who participate in a valid programmeof Further Education or LSC-funded Entry to Employment or Programme Led Apprenticeship.- 94 -
<strong>Barnsley</strong> in <strong>Depth</strong> <strong>Children</strong>’s and <strong>Young</strong> People’s Report – 2008/09 <strong>In</strong>formation** = 16 and 17 year olds (except pilot areas which are 16-18; <strong>Barnsley</strong> not a pilot)*** = 16 to 18 year oldsFigure 6.11.6 Percentage of 16-19 year olds in LSC funded Further Education by OldWard 2007/8NB. It has become clear that comparing change year on year from the datareceived at Old Ward level can be misleading. This is why the charts andcommentary on this have been removed. For the general picture for <strong>Barnsley</strong>,please see Figure 6.11.1.Figure 6.11.7 illustrates the success rate of 16-19 year olds at NVQ Level 1.<strong>In</strong>the 2007/8 year, there were 1,040 learners engaged in Level 1 or Entry levelqualifications (slightly down from 1,113 in 2006/7 or -6.5%).The borough average success rate was 72% (down by 4% in 2006/7).Success at ward level varied significantly: Penistone East was the highestwith 93% whereas Hoyland East was the lowest with 58%. The gap betweenthe highest and lowest wards decreased from 36% in 2005/6 to 15% in 2006/7but has increased again to 35% in 2007/8.- 95 -
<strong>Barnsley</strong> in <strong>Depth</strong> <strong>Children</strong>’s and <strong>Young</strong> People’s Report – 2008/09 <strong>In</strong>formationFigure 6.11.7: Success Rate of 16-19 year olds in Further Education in 2007/8 at Level1 for Old Wards100Further Education 2007/8: Success Rate of Learners at Level 1 by Ward (pre-2004) ofResidence (Source: LSC)% learners who were successful908070605040302010<strong>Barnsley</strong>0Penistone EastCudworthCentralArdsleyParkPenistone WestDodworthMonk BrettonNorth WestWorsbroughBrierleyWombwell SouthDartonRoystonSouth WestDarfieldHoyland WestAthersleyWombwell NorthDearne SouthDearne ThurnscoeHoyland EastFigure 6.11.8 shows the success rate at ward level of students taking Level 2courses in 2007/8. There were 1,457 learners engaged in Level 2qualifications (up by 8% from 2006/7). The borough average success rate was72% - an increase of 10% on the 2006/7 figure. Success at ward level rangedfrom Wombwell North with the lowest (58%) to Cudworth with the highest(84%). The gap between the highest and lowest success rates has increasedslightly since 2005/6 (20%) but fallen from 34% in 2006/7.Figure 6.11.8: Success Rate of 16-19 year olds in Further Education in 2007/8 at Level 2for Old WardsFurther Education 2007/8: Success Rate of Learners at Level 2 by Ward (pre-2004) ofResidence (Source: LSC)9080% learners who were successful70605040302010- 96 -
<strong>Barnsley</strong> in <strong>Depth</strong> <strong>Children</strong>’s and <strong>Young</strong> People’s Report – 2008/09 <strong>In</strong>formationFigure 6.11.9 shows learner success rates by ward of residence (pre-2004) atLevel 3 (equivalent to A levels). There were 1,625 learners at the Level 3stage (up by 12% on the 2006/7 figures). The borough average success ratewas 75% (up by 8% on last year). Success at ward level varied by 22% (lessthan the 32% for 2005/6 and 26% for 2006/7). The most successful ward wasSouthwest with 86% whereas Dearne Thurnscoe had the lowest with 64% -significantly higher than the lowest ward in 2005/6 (42%) and 2006/7 (56%).Figure 6.11.9: Success Rate of 16-19 year olds in Further Education in 2007/8 at Level 3for Old Wards100Further Education 2007/8: Success Rate of Learners at Level 2 by Ward (pre-2004) ofResidence (Source: LSC)90% learners who were successful8070605040302010There were 51 people engaged in learning at Levels 4 & 5 in <strong>Barnsley</strong> and ofthese 48 % were successful. There were insufficient numbers to analyse atward level.An additional 357 <strong>Barnsley</strong> people were on other courses – a fall of 55% on2006/7. However, the success rate shot up from 21% in 2006/7 to 43% in2007/8. Again, Dearne Thurnscoe and Dearne South had the highest successrates (60% and 88%, respectively) and the lowest was in Cudworth (13%).Work-based Learning (WbL)<strong>In</strong> 2007/8 there were 1,929 young people aged 16-19 undertaking work basedlearning – an increase of 190 on the 2006/7 figure 2 . The highest rates ofparticipation in Work-based Learning were in Cudworth (211 per ’000population) and Brierley (209 per ‘000). The lowest rates were in DearneSouth (138 per ‘000) and Penistone East (117 per ‘000). Figure 6.11.11shows the differences across the wards: in areas such as Penistone East thenumber of young people participating in this type of learning is low, probablydue to young people taking more academic courses such as A Levels.2Based on the LSC's publication <strong>Barnsley</strong> 14-19 LA Data Pack May 2009- 97 -
<strong>Barnsley</strong> in <strong>Depth</strong> <strong>Children</strong>’s and <strong>Young</strong> People’s Report – 2008/09 <strong>In</strong>formationThere are not any directly comparable regional and national figures but thefollowing table shows the average number of students through the year aged16-18 years old engaged in Work-based Learning.Figure 6.11.10: Number of 16-18 year olds engaged in Work-based Learning by LearnerResidence 2005/6-2007/8Source: The Data Service, Statistical First ReleaseLevels 2 and 3 2005/06 2006/07 2007/08% change2005/6 -2007/8<strong>Barnsley</strong> 3,900 4,000 4,100 5.1South Yorkshire 18,200 18,300 18,900 3.8Yorkshire and The Humber 74,100 75,700 77,000 3.9England 622,600 639,100 653,900 5.0Note: These numbers are not comparable with the other <strong>Barnsley</strong> and ward data in this reportFigure 6.11.11: Number of 16-19 years olds undertaking Work-based Learning by Ward2007/8Source: The Data Service, Statistical First Release250Work-based Learning 2007/8: Participation rate per '000 population aged 16-19 by Ward (pre-2004) of learnerresidence (Source: LSC)200Rate per '000 population aged 16-19150100500There were 1,062 young people 16-19 in 2007/8 taking Apprenticeships: arate of 92 per 1,000 people aged 16-19. This is a 9% decrease on 2006/7.Cudworth (122 per 1,000), Dodworth (120), and Brierley (114) had the highestrates of people taking Apprenticeships. Ardsley (59 per 1,000), PenistoneEast (63 per 1,000) and Worsbrough (72 per 1,000) had the lowest rates –almost half that of the highest rates. Figure 6.11.12 shows the spread acrossthe wards.- 98 -
<strong>Barnsley</strong> in <strong>Depth</strong> <strong>Children</strong>’s and <strong>Young</strong> People’s Report – 2008/09 <strong>In</strong>formationFigure 6.11.12: Participation Rates for Work-based Learning Apprenticeships for Wards(pre-2004) in 2007/8140Work-based Learning 2007/8: Apprenticeship Participation rate per '000 population aged 16-19 by Ward (pre-2004) of learner residence120Rate per '000 population aged 16-19100806040200A total of 367 16-19 year olds were taking Advanced Apprenticeships (32 per1,000) – maintaining the long term trend. Across the wards, rates range fromthe highest: Wombwell North (45 per 1,000), Penistone West, (44) andPenistone East. (43) The lowest rates were in Park (16), Hoyland East (17)and Dearne South (18). Figure 6.11.13 shows the spread across wards.Figure 6.11.13: Number of 16-19 years olds undertaking Advanced Apprenticeships byWard 2006/750Work-based Learning 2007/8: Advanced Apprenticeship Participation rate per '000population aged 16-19 by Ward (pre-2004) of learner residence (Source: LSC)45Rate per '000 population aged 16-194035302520151050Figure 6.11.14 shows the change in the rate of people taking Apprenticeshipsat ward level between 2003/4 and 2007/8. All but three wards showedincreases in rates: Worsbrough, Penistone East and Ardsley.- 99 -
<strong>Barnsley</strong> in <strong>Depth</strong> <strong>Children</strong>’s and <strong>Young</strong> People’s Report – 2008/09 <strong>In</strong>formationFigure 6.11.14: Change in Rate of 16-19 years olds undertaking Apprenticeships byWard 2003/4 to 2007/8Change in Work-based Learning: Apprenticeship Participation Rate 2003/04 to 2007/8(Source: Learning & Skills Council)WorsbroughWombw ell SouthWombw ell NorthSouth WestRoystonPenistone WestPenistone EastParkNorth We stMonk BrettonHoyland WestHoyland EastDodworthDearne ThurnscoeDearne SouthDartonDarfieldCudworthCentralBrierleyAthersleyArdsley-27-13-9671217181310152128333030414443525465-40 -20 0 20 40 60 80Change in Rate per 1,000Figure 6.11.15 below illustrates the success rate of all types of work basedlearning for young people aged 16-19 in 2007/8. For <strong>Barnsley</strong> as a whole,52% were successful which is higher than for 2006/7 (48.5%). South Westhas the highest rate (74%) and Ardsley has the lowest rate (44%). Thedifference between the lowest ward and the highest has fallen back to 30%from 50% in 2006/7.Figure 6.11.15: Success Rate of 16-19 year olds undertaking All Types of Work-basedTraining in 2007/8 for Wards80Success Rate of 16-18 year olds undertaking Work-based Learning by Ward(pre-2004) in 2007/8 (Source: LSC 2007/8)7060% success rate50403020100- 100 -
<strong>Barnsley</strong> in <strong>Depth</strong> <strong>Children</strong>’s and <strong>Young</strong> People’s Report – 2008/09 <strong>In</strong>formationFigure 6.11.16: Change in Success Rate of 16-19 year olds undertaking All Types ofWork-based Training between 2004/05 and 2007/8 for WardsChange in the Work-based Learning Success Rate from 2004/5 to 2007/8(Source: Learning & Skills Council)WorsbroughWombw ell SouthWombw ell NorthSouth WestRoystonPenistone WestPenistone EastParkNorth WestMonk BrettonHoyland WestHoyland EastDodworthDearne ThurnscoeDearne SouthDartonDarfieldCudworthCentralBrierleyAthersleyArdsley-13.5-14.6-7.4-7.9-0.87.75.65.55.02.56.24.21.010.311.611.210.211.221.120.923.031.2-20 -10 0 10 20 30 40Change in Success RateAgain there are no available regional and national comparator figures.6.12 <strong>Barnsley</strong> Neighbourhood Learning NetThe ‘active ingredient’ in the success of the <strong>Barnsley</strong> Neighbourhood LearningNet (BLNL) is its grass roots approach to project management and delivery,which is commissioned from Community Partnerships. It is strategicallydirected and coordinated centrally through the Association of CommunityPartnerships and <strong>Barnsley</strong> MBC <strong>Children</strong>, <strong>Young</strong> People and FamiliesDirectorate, Family, Adult & Extended Learning.BNLN model provides a responsive and flexible conduit that connects a widerange of agencies and organisations with those people with the most at risk ofsocial exclusion. Since 2004 the focus has been on progressing existinglearners onto courses.The Learning Net maintains a database of people it helps, includinginformation about referrals to courses, levels of the courses as well asdemographic information 3 .3Access to this information is strictly limited. The information passed to us contained no records that wouldallow the Central Research Team to identify an individual. The information was used only to aggregate to highergeographical levels (Wards and Area Forums) and these figures will not be released if they are less than 5 and ifexpressed as a rate, not released if the denominator is less than 20.- 101 -
<strong>Barnsley</strong> in <strong>Depth</strong> <strong>Children</strong>’s and <strong>Young</strong> People’s Report – 2008/09 <strong>In</strong>formation6.12.1 <strong>Barnsley</strong> level analysis of Learning Net clients<strong>In</strong> <strong>Barnsley</strong> as a whole, there were 868 4 individuals aged under-25 who hadbeen engaged in the Learning Net from September 2004 to August 2009. Thenumber has increased from 758 (or 14.5%) from the last snapshot as atSeptember 2008. This accounts for 7.3% 5 of the people on the database(about the same as the September 2008 snapshot). These individuals wereengaged in 1,496 interventions (average of 1.7 per individual) – about thesame as last report.The number of individuals under 25 using the Learning Net has increasedfrom 146 starting in 2005 (first full year) 6 to 199 starting in 2008 – an increaseof 6%. This is to be expected as more people are already on the database.Figure 6.12.1: <strong>Barnsley</strong> Learning Net clients aged under 25 by start year250<strong>In</strong>dividuals from <strong>Barnsley</strong> aged under 25 who have used the <strong>Barnsley</strong> Learning Net by year of firstintervention(Source: <strong>Barnsley</strong> Learning Net Database August 2009)NB: some records have been excluded i.e.where there were errors in the date ofintervention field, where the postcode couldnot be geocoded or if the person was residentoutside <strong>Barnsley</strong>.200Number of <strong>In</strong>dividuals150100218199146133(to 4/8/2009)50102700Start Year: 2004 Start Year: 2005 Start Year: 2006 Start Year: 2007 Start Year 2008 Start Year: 2009There were 28 people who lived in <strong>Barnsley</strong>, who were aged under 25 andfrom an ethnicity other than White British – accounting for 3.2% of the under25s 5 on the Learning Net database (compared with 1.4% of Learning Netclients of all ages living in <strong>Barnsley</strong>). A clean up of the Learning Net databasehas removed duplicate records which may account for the decrease in thenumber of people under-25 from ethnic minority backgrounds.Learners living in <strong>Barnsley</strong> with a disability accounted for 7.6% of the under-25 clients (11.2% for all age groups). For both age groups this is a slightdecrease on the snapshot as at June 2007. As at August 2009, there were456There are 914 on the database but only 868 had a valid postcode within <strong>Barnsley</strong>.All percentages are of the known population i.e. the base population excludes records with unknown / notgiven or blank entries in the relevant field.The live nature of the database means and revisions to the database over time means that the totals statedhere are likely to be different from those previously reported.- 102 -
<strong>Barnsley</strong> in <strong>Depth</strong> <strong>Children</strong>’s and <strong>Young</strong> People’s Report – 2008/09 <strong>In</strong>formation11.4% of the under 25 clients who had a learning disability; similar to the12.8% for all age groups .The majority of clients who were under-25 and were not in employment(62.3% - no change from June 2007). This is higher than the percentage forclients of all ages (49.3% - similar to September 2008) 7 .The under-25 group was more likely to be engaged in accredited training thanthe All Age group: 49.4% and 37.8% respectively. <strong>In</strong> terms of the topics of theinterventions, under 25s had greater involvement (compared with all clients) inLiteracy & Numeracy, Food and Other courses and activities. They had lessinvolvment in ICT courses, craft skills, languages and Creative and DigitalArts.6.12.2 Learning Net clients by geographical areasPostcodes of learners’ residences were geocoded and then aggregated byelectoral ward. There were 914 individuals aged under-25 on the Learning Netdatabase; 868 of these could be allocated to a ward (95%) and the rest wereeither from outside <strong>Barnsley</strong> or the postcode was missing / incomplete.There is a correlation between the ward deprivation and the number ofindividuals on the Learning Net database aged under-25 as a rate per 1,000people under-25 but it is not very strong (some wards have higher thanexpected rates for their level of deprivation). St. Helen’s ward had the highestrate at 24.4 per 1,000 (it was also highest as at June 2007 and September2008) followed by Cudworth (17.9), Monk Bretton (16) and Darton East (15.6).Penistone East (1.7), Penistone West (4.1) and Dodworth (6.1) had the lowestrates: not surprising given Learning Net’s remit, its activities and the higherlevels of education in these areas.7These are estimates based on the number of interventions not the number of individuals- 103 -
<strong>Barnsley</strong> in <strong>Depth</strong> <strong>Children</strong>’s and <strong>Young</strong> People’s Report – 2008/09 <strong>In</strong>formationFigure 6.12.2: <strong>Barnsley</strong> Learning Net clients aged under 25 as a rate per 1,000population by ward deprivation as at August 200930.0<strong>Barnsley</strong> Learning Net Clients aged under 25 as a rate per 1,000 population at ward level by warddeprivation(Source: <strong>Barnsley</strong> Learning Net Database as at Sept 2008)Rate per 1,000 population aged under 2525.020.015.010.05.0R 2 = 0.40680.0Dearne NorthSt HelensStairfootDearne SouthWorsbroughNorth EastMonk BrettonKingstoneCentralCudworthWombwellHoyland MiltonDarfieldRoystonRockinghamOld TownDodworthDarton EastDarton WestPenistone WestPenistone EastMost Deprived Above Average Deprivation Average Below Above Deprivation Least DeprivedFigure 6.12.3: People aged under 25 who have used Learning Net by WardFigure 6.12.4 below shows the number of people aged Under-25 using theLearning Net by the Area Forum / Well-being Partnership area and by theyear they started.- 104 -
<strong>Barnsley</strong> in <strong>Depth</strong> <strong>Children</strong>’s and <strong>Young</strong> People’s Report – 2008/09 <strong>In</strong>formation<strong>In</strong> most Area Forums / Well-being Partnerships, there was a steady increasefrom 2004 to 2006. After this the numbers registering each year have levelledoff or fallen but this is to be expected as people who wish to register will havedone so in earlier years.• Monk Bretton, Royston & St. Helen’s has had the largest number ofpeople registering each year except the latest year (2009); althoughthis may be a reflection of the size of its population.• Cudworth & North East has had, on average, between 20 and 25 newregistrations per year.• Darton East, West and Dodworth and Dearne North & South haveshown significant increases in each year except 2006Figure 6.12.4: People using Learning Net by Area Forum / Well-being Partnership byyear of start60Number of people using <strong>Barnsley</strong> Learning Net aged under 25 by start year by Area Forum(Source: <strong>Barnsley</strong> Learning Net, August 2009)50Start Year: 2004Start Year: 2005Start Year: 2006Start Year: 2007Start Year: 2008Start Year: 2009= suppressed due tosmall numbersNB 2004 is from 2/9/20042009 is to 4/8/200840Number of people3020100Central, Kingstone& Old TownCudworth & NorthEastDarfield &WombwellDarton East, DartonWest & DodworthDearne North &Dearne SouthHoyland Milton &RockinghamMonk Bretton,Royston & StHelen'sPenistone East &Penistone WestStairfoot &Worsbrough6.13 Education, Training or Employment Status of 16-18 year olds(NEETs data from Connexions)The children and young people not in education, employment and training(NEETs) information is only based on the young people aged 16-18 and theinformation is only of those young people on the Connexions database whichincludes a postcode within the borough.- 105 -
<strong>Barnsley</strong> in <strong>Depth</strong> <strong>Children</strong>’s and <strong>Young</strong> People’s Report – 2008/09 <strong>In</strong>formationFigure 6.13.1 NEET's DefinitionsNEET Available (Active) – Those seeking Education, Employment or Training.NEET Not Available (Not Active) – <strong>In</strong>cludes those who are pregnant, looking after achild or dependent relative (<strong>Young</strong> Carers), who are not available to because of sickness,religious grounds – in other words they are not activity seeking Education, Employmentor Training.PDO – Personal Development OpportunitiesEET – Those in Education, Employment or TrainingCohort – All young people Aged 16-18 on Connexions databaseAt the end of March 2009 there were 6,806 young people in the NEET cohortof which 5,931 (87.1%) were in Education, Employment and Training (EET).This represents a rise of 0.5% on last years total. There were 8.7% NEET4.4% ‘NEET not known’ and 0.2% Other. Those unknown would includeyoung people who have moved away from the area.Figure 6.13.2 Percentage of 16-18 year olds NEET Available as at 31st March 2009NEET Available by Ward and Deprivation(Source: Connections March 2009)14.012.010.0% of Cohort8.06.04.02.0R 2 = 0.5902neet availableLinear (neetavailable)0.0DearneNorthSt HelensStairfootDearneSouthWorsbroughNorth EastMonkBrettonKingstoneCentralCudworthWombwellHoylandMiltonDarfieldRoystonRockinghamOld TownDodworthDarton EastDartonWestPenistoneWestPenistoneEastMost DeprivedAbove AverageDeprivationAverageBelow AboveDeprivationLeast DeprivedQuintile 1 Quintile 2 Quintile 3 Quintile 4 Quintile 5Note: R is a figure to illustrate the correlation between two sets of data, with -1 being a perfectnegative correlation, and +1 being a perfect positive correlation. Usually, +0.7 or above isregarded a significant positive result.The chart above illustrates that the Dearne, Darfield, St Helens and Stairfootare areas with high number of young people seeking education, employmentor training.- 106 -
<strong>Barnsley</strong> in <strong>Depth</strong> <strong>Children</strong>’s and <strong>Young</strong> People’s Report – 2008/09 <strong>In</strong>formationFigure 6.13.3: Percentage of 16-18 year olds Total NEET Group at 31 March 2009Total NEET Group by Ward and Deprivation(Connexions March 2009)18.016.014.012.0% of Cohort10.08.06.04.0total neetgroupLinear (totalneet group)R 2 = 0.67062.00.0DearneNorthSt HelensStairfootDearneSouthWorsbroughNorth EastMonkBrettonKingstoneCentralCudworthWombwellHoylandMiltonDarfieldRoystonRockinghamOld TownDodworthDarton EastDartonWestPenistoneWestPenistoneEastMost Deprived Above Average Deprivation Average Below Above Deprivation Least DeprivedQuintile 1 Quintile 2 Quintile 3 Quintile 4 Quintile 5Note: R is a figure to illustrate the correlation between two sets of data, with -1 being a perfectnegative correlation, and +1 being a perfect positive correlation. Usually, +0.7 or above isregarded a significant positive result.Figure 6.13.4: Percentage of 16-18 year olds <strong>In</strong> Education, Employment or Training asat 31st March 2009EETs by Ward and Deprivation(Source: Connexions March 2009)120.0100.0R 2 = 0.6704% of Cohort80.060.040.0EETsLinear (EETs)20.00.0DearneNorthSt HelensStairfootDearneSouthWorsbroughNorth EastMonkBrettonKingstoneCentralCudworthWombwellHoylandMiltonDarfieldRoystonRockinghamOld TownDodworthDarton EastDartonWestPenistoneWestPenistoneEastMost DeprivedAbove AverageDeprivationAverageBelow AboveDeprivationLeast DeprivedQuintile 1 Quintile 2 Quintile 3 Quintile 4 Quintile 5Note: R is a figure to illustrate the correlation between two sets of data, with -1 being a perfectnegative correlation, and +1 being a perfect positive correlation. Usually, +0.7 or above isregarded a significant positive result.Figure 6.13.3 and Figure 6.13.4 above clearly illustrate that there is astatistical relationship with <strong>Young</strong> people aged 16 to 18 not in Education,Employment or Training and deprivation.- 107 -
<strong>Barnsley</strong> in <strong>Depth</strong> <strong>Children</strong>’s and <strong>Young</strong> People’s Report – 2008/09 <strong>In</strong>formationFigure 6.13.5 Percentage of 16-18 year olds NEETs Not Available as at 31st March 20096.0NEETs Not Available by Ward and Deprivation(Source: Connexions March 2009)5.04.0% of Cohort3.02.0neet not availableLinear (neet notavailable)1.0R 2 = 0.60970.0DearneNorthSt HelensStairfootDearneSouthWorsbroughNorth EastMonkBrettonKingstoneCentralCudworthWombwellHoylandMiltonDarfieldRoystonRockinghamOld TownDodworthDarton EastDartonWestPenistoneWestPenistoneEastMost Deprived Above Average Deprivation Average Below Above Deprivation Least DeprivedQuintile 1 Quintile 2 Quintile 3 Quintile 4 Quintile 5Note: R is a figure to illustrate the correlation between two sets of data, with -1 being a perfectnegative correlation, and +1 being a perfect positive correlation. Usually, +0.7 or above isregarded a significant positive result.Figure 3.13.5 above illustrates the wards where young people are not seekingeducation, employment and training because they are pregnant, young carersor not seeking due to sickness is higher in the more deprived areas comparedto more affluent areas.- 108 -
<strong>Barnsley</strong> in <strong>Depth</strong> <strong>Children</strong>’s and <strong>Young</strong> People’s Report – 2008/09 <strong>In</strong>formation7 Economic Well-beingEconomic well-being is usually derived from income to a person or household.Usually this income is from employment or self-employment. For those whoare unable to work, are looking for work or need extra income to support themdue to sickness or disability, social security benefits are paid. Economic wellbeingis linked closely to the previous section on education - especially 16-18year olds who are Not in Employment, Education or Training: a target groupfor the Every Child Matters strategy.7.1 Key Facts on Economic Well-being• Unemployment rate for 16-24 year olds in England has increasedslightly whereas in <strong>Barnsley</strong> it remained about the same until2008/9 when it rapidly increased due to the economic downturn.• Almost 10,400 <strong>Barnsley</strong> children (24%) are living in poverty (basedon Government definition).• The number of children & young people in receipt of <strong>In</strong>comeSupport fell slightly between 2004 and 2007 but increased slightlyin 2008 (still lower than 2004).• 760 claimants aged 16-24 are in receipt of Disability LivingAllowance.• The number of Job Seekers Allowance claimants increased by2.3% between 2004 and 2008.• The number of <strong>In</strong>capacity Benefit / Severe Disablement allowanceclaimants fell by 24% between 2004 and 2008.• <strong>Barnsley</strong> has twice as many young people aged under-24 yearsclaiming Carer’s Allowance than the national average.• Over 4,650 people in receipt of <strong>In</strong>come Support had at least onechild in 2008.• As at August 2005 25,290 families and 43,065 children receivedChild Tax credit payments.• There are concentrations of WTC & CTC recipient families (lowincome families) across <strong>Barnsley</strong> and not just deprived areas.• <strong>Barnsley</strong> has a mean household income of £30,320 but the medianwas £26,070.- 109 -
<strong>Barnsley</strong> in <strong>Depth</strong> <strong>Children</strong>’s and <strong>Young</strong> People’s Report – 2008/09 <strong>In</strong>formation7.2 Labour Market for 16-24 year oldsThe Annual Population Survey is a new survey which includes the annualLabour Force Survey (LFS) plus a new sample boost aimed at achieving aminimum sample of 500 economically active adults in local authority districtsin England. The size of the total APS sample is approximately 500,000people.As the data is from a survey, care must be taken with interpretation of thestatistics especially over time. Confidence intervals are published with mostdata which give an indication of the reliability of the individual data points.The following data relates to the labour market situation of those aged 16-24in <strong>Barnsley</strong> and compares this with the picture in England as a whole.Breaking down the already small sample into age groups further reduces thereliability of individual figures.7.2.1 Economic ActivityPeople who are economically active are either in employment, self-employed,unemployed (i.e. looking for work) or in full-time education but are employed(e.g. full-time students working part-time in a shop/pub). For this age groupthe Economic Activity rate (% of those of the age group who are EconomicActive) tends to be lower than for the working age population as a whole dueto those in further education either at school or in college.Figure 7.2.1 shows the Economic Activity rate for 16-24 year olds in <strong>Barnsley</strong>and England for 2001/2 to 2008/9.Figure 7.2.1 Economic Activity Rate of 16-24 year olds 2001/2 to 2008/99085EnglandEngland CI-<strong>Barnsley</strong>Economic activity rate - 16-24 year olds 2001/2 to 2008/9(Source: Labour Force Survey 2001-2004, Annual Population Survey 2004/5-2007/8)<strong>Barnsley</strong> CI-81.98075.4 75.2% of 16-24 year olds7570656070.1 69.565.368.671.668.867.668.869.866.4 66.7 66.2 66.1555045402001/2 2002/3 2003/4 2004/5 2005/6 2006/7 2007/8 2008/9- 110 -
<strong>Barnsley</strong> in <strong>Depth</strong> <strong>Children</strong>’s and <strong>Young</strong> People’s Report – 2008/09 <strong>In</strong>formationWhile the England rate has remained fairly stable (declining slightly), the ratefor <strong>Barnsley</strong> increased between 2001/2 and 2004/5 but since then theeconomic activity rate of 16-24 year olds has fallen. As already mentionedcaution is required when looking at these figures due to the small samples.The chart shows the confidence intervals at the 95% level i.e. we are 95%certain that the figure lies between the highest and lowest of the dotted lineson the chart.7.2.2 Employment RatePeople who are economically active are mostly in employment (either fulltime,part-time or self-employed). The employment rate is the percentage ofthe age group in employment.As before, Figure 7.2.2 shows the data and the confidence intervals – the<strong>Barnsley</strong> data has fairly wide intervals so caution is needed when dealing withthe actual data.As with the economic activity rate, the employment rate for 16-24 year olds inEngland appears to be declining slightly becoming steeper since the recenteconomic downturn. <strong>Barnsley</strong>’s rate increased until 2004/5 from then the ratehas been falling – dropping rapidly from 2006/7 onwards.Figure 7.2.2: Employment Rate of 16-24 year olds 2001/2 to 2008/9807570EnglandEngland CI-<strong>Barnsley</strong>Employment rate - 16-24 year olds 2001/2 to 2008/9(Source: Labour Force Survey 2001-2004, Annual Population Survey 2004/5-2008/9)<strong>Barnsley</strong> CI-71.166.0% of 16-24 year olds65605562.255.461.256.062.560.559.363.057.457.260.257.155.553.75045402001/2 2002/3 2003/4 2004/5 2005/6 2006/7 2007/8 2008/97.2.3 Economic <strong>In</strong>activity RateThis is the inverse of the economic activity rate – it measures those peoplewho are too sick to work, are disabled and not working, are caring for family- 111 -
<strong>Barnsley</strong> in <strong>Depth</strong> <strong>Children</strong>’s and <strong>Young</strong> People’s Report – 2008/09 <strong>In</strong>formationmembers (children or sick), are full-time students not in employment or areretired. The England economic inactivity rate has increased slightly while the<strong>Barnsley</strong> rate decreased until 2004/5 since then it has increased. Again, theseresults should be used with caution as the sample is small and the confidenceintervals large.Figure 7.2.3: Economic <strong>In</strong>activity Rate of 16-24 year olds 2001/2 to 2007/84540EnglandEngland CI-<strong>Barnsley</strong>Economic <strong>In</strong>activity rate - 16-24 year olds 2001/2 to 2008/9(Source: Labour Force Survey 2001-2004, Annual Population Survey 2004/5-2008/9)<strong>Barnsley</strong> CI-3534.731.431.232.433.6 33.333.8 33.9% of 16-24 year olds30252029.930.528.418.124.624.831.230.21510502001/2 2002/3 2003/4 2004/5 2005/6 2006/7 2007/8 2008/97.2.4 Unemployment RateFigure 7.2.4: Unemployment Rate of 16-24 year olds 2003/04 to 2008/935EnglandEngland CI-<strong>Barnsley</strong>Unemployment rate - 16-24 year olds 2001/2 to 2008/9(Source: Labour Force Survey 2001-2004, Annual Population Survey 2004/5-2008/9)<strong>Barnsley</strong> CI-302523.1% of 16-24 year olds201515.118.312.713.216.614.2 13.816.01011.312.0 12.1 12.313.512.312.4502001/2 2002/3 2003/4 2004/5 2005/6 2006/7 2007/8 2008/9- 112 -
<strong>Barnsley</strong> in <strong>Depth</strong> <strong>Children</strong>’s and <strong>Young</strong> People’s Report – 2008/09 <strong>In</strong>formation<strong>In</strong> Figure 7.2.4, note the large Confidence <strong>In</strong>terval due to the small sample asillustrated by the vertical lines. Since 2003/4 the unemployment rate inEngland has increased slightly whereas in <strong>Barnsley</strong> it remained at about thesame rate until 2008/9 when it increased rapidly as expected from theeconomic downturn.7.3 Social Security Benefits - <strong>Children</strong> & <strong>Young</strong> People 8Various benefits are paid to families and children. Much of the data is onlyavailable at Lower Super Output Area (LOSA) level. For the purposes of thisreport, it has been estimated for the post-2004 wards using a populationweighting. The figures at ward level are therefore only estimates.7.3.1 <strong>Children</strong> and <strong>Young</strong> People in receipt of Benefits<strong>In</strong>come Support<strong>In</strong>come Support (IS) is paid to a person who is (a) a resident of Great Britain(b) aged 16 or over (c) is not working 16 hours or more a week, and (d) hasless money coming in than the law says they need to live on. <strong>In</strong> general, IS isonly available to people who are not required to be available for work such ascarers, lone parents and sick and disabled people.As at August 2008 there were 1,600 recipients of IS in <strong>Barnsley</strong> who wereaged 16-24 (6.4% of the 16-24 population). The percentage has fallenconsistently since August 2004 when it was 7.4% (see Figure 7.3.1). Thewards with the highest and lowest rates have remained at the same level andthe gap between the upper and lower quartiles has also been the same.Figure 7.3.1: Change in percentage of 16-24 year olds in receipt of <strong>In</strong>come Support(2004-2008)14.0Change in percentage of 16-24 year olds claiming <strong>In</strong>come Support in <strong>Barnsley</strong> -August 2004 to August 2008Dearne North<strong>In</strong>come SupportIS MaxIS Min12.0St Helen'sDearne NorthDearne NorthDearne North10.0% of 16-24 year olds8.06.04.0IS Upper QuartileIS Lower Quartile2.00.0Penistone EastPenistone EastPenistone EastPenistone WestPenistone East2004 2005 2006 2007 20088 Some figures will differ from those reported in previous versions of <strong>Barnsley</strong> <strong>In</strong> <strong>Depth</strong> dues to revisions of theBenefits figures and changes to Super Output Area data to bring it into line with local authority level data.- 113 -
<strong>Barnsley</strong> in <strong>Depth</strong> <strong>Children</strong>’s and <strong>Young</strong> People’s Report – 2008/09 <strong>In</strong>formationFigure 7.3.2 shows estimates of recipients of IS aged 16-24 as a percentageof the ward population of that age. The wards are grouped into theirdeprivation quintiles – there is a strong statistical relationship between warddeprivation and the percentage of 16-24 year olds receiving IS.Figure 7.3.2: Percentage of 16-24 Population Receiving <strong>In</strong>come Support - August 2008Source: BMBC Ward estimates 2007 derived from DWP <strong>In</strong>formation Analysis Directorate data12.0Estimated Percentage of 16-24 year old population claiming <strong>In</strong>come Support - <strong>Barnsley</strong> Wards August 2008(Source: Department for Work & Pensions - <strong>In</strong>formation Analysis Directorate)11.310.0Percentage of 16-24 year old population8.06.04.09.37.8 7.9 8.0 7.9 7.97.46.36.56.95.97.56.94.64.93.03.3<strong>Barnsley</strong> Ave.3.0R 2 = 0.862.01.0 1.10.0Dearne NorthSt Helen'sStairfootDearne SouthWorsbroughNorth EastMonk BrettonKingstoneCentralCudworthWombwellHoyland MiltonDarfieldRoystonRockinghamOld TownDodworthDarton EastDarton WestPenistone WestPenistone EastMost Deprived Above Average Deprivation Average Below Average Deprivation Least DeprivedQuintile 1 Quintile 2 Quintile 3 Quintile 4 Quintile 5Note: R is a figure to illustrate the correlation between two sets of data, with -1 being a perfectnegative correlation, and +1 being a perfect positive correlation. Usually, +0.7 or above isregarded a significant positive result.Figure 7.3.3: Percentage of 16-24 year olds in Receipt of <strong>In</strong>come Support by Ward as atAugust 2008- 114 -
<strong>Barnsley</strong> in <strong>Depth</strong> <strong>Children</strong>’s and <strong>Young</strong> People’s Report – 2008/09 <strong>In</strong>formationFigure 7.3.4 shows that Dearne North has had the highest rate over the past 5years; Stairfoot and St Helen’s have had highest rates in four of the last fiveyears. Stairfoot (-3%) and St Helen’s (-2.5%) showed significant falls inclaimants over the period but Dearne North showed little change over thesame period (-0.2%). The IS claimant rate in Royston ward has increased themost (+1.2%).Figure 7.3.4: Percentage Change in 16-24 Population Receiving <strong>In</strong>come Support -August 2004-2008Change in % of 16-24 year olds claiming <strong>In</strong>come Support between August 2004 and 2008(Source: Department for Work & Pensions)<strong>Barnsley</strong>WorsbroughWombwellStairfootSt Helen'sRoystonRockinghamPenistone WestPenistone EastOld TownNorth EastMonk BrettonKingstoneHoyland MiltonDodworthDearne SouthDearne NorthDarton WestDarton EastDarfieldCudworthCentral-3.5-3.0-2.7-2.5-2.3-2.1-1.6-1.4-1.1-0.9-0.4-0.5-0.4-0.2-0.2-0.60.00.10.00.00.31.2-4.0 -3.5 -3.0 -2.5 -2.0 -1.5 -1.0 -0.5 0.0 0.5 1.0 1.5% ChangeDisability Living Allowance (to under 16s)Disability Living Allowance is payable to people who are disabled before theage of 65 and need help with personal care, getting around or both. To getDLA the claimant must have needed help for three months (the qualifyingperiod) and be expected to need help for at least a further six months (theprospective test). People who could not qualify for Mobility Allowance orAttendance Allowance can get the lower rates of Disability Living Allowance.As at August 2008, there were 1,270 children under 16 in receipt of DisabilityLiving Allowance (2.8% of under-16 population), a slight increase (+0.4%) onthe August 2004 rate. There has been little change in this group: the highestward rate, the lowest ward rate and the upper and lower quartiles haveremained about the same over the 2004-2008 period (see Figure 7.3.5)- 115 -
<strong>Barnsley</strong> in <strong>Depth</strong> <strong>Children</strong>’s and <strong>Young</strong> People’s Report – 2008/09 <strong>In</strong>formationFigure 7.3.5: Change in % of under 16 year olds in receipt of Disability LivingAllowance by Ward (2004-2008)4.54.0Change in percentage of under 16 year olds claiming Disability Living Allowance in <strong>Barnsley</strong>- August 2004 to August 2008WorsbroughWorsbroughDearne NorthDearne NorthDisability Living Allowance U16DLAU16 MaxDLAU16 MinDearne North3.53.0DLAU16 Upper Quartile% of 16-24 year olds2.52.0DLAU16 Lower Quartile1.51.0Penistone WestPenistone WestPenistone EastPenistone WestPenistone West0.50.02004 2005 2006 2007 2008Dearne North (3.8%), Stairfoot (4.0%) and Dearne South (3.5%) have thehighest rates (see Figure 7.3.6). Dearne North has had the highest rate for allfive years 2004-2008 and has shown a small increase of 0.6% over theperiod.Figure 7.3.6: Percentage of Under-16 Population Receiving Disability Living Allowance- August 2008Source: BMBC Ward estimates 2008 derived from DWP <strong>In</strong>formation Analysis Directorate data5.0Estimated Percentage of Under 16 population claiming Disability Living Allowance<strong>Barnsley</strong> wards as at August 2008(Source: Department for Work & Pensions - <strong>In</strong>formation Analysis Directorate)Percentage of under 16 population4.03.02.04.23.24.03.52.53.32.9 2.82.33.52.53.12.93.22.73.22.8<strong>Barnsley</strong> Ave.2.9R 2 = 0.452.41.81.51.00.0Dearne NorthSt Helen'sStairfootDearne SouthWorsbroughNorth EastMonk BrettonKingstoneCentralCudworthWombwellHoyland MiltonDarfieldRoystonRockinghamOld TownDodworthDarton EastDarton WestPenistone WestPenistone EastMost Deprived Above Average Deprivation Average Below Average Deprivation Least DeprivedQuintile 1 Quintile 2 Quintile 3 Quintile 4 Quintile 5Note: R is a figure to illustrate the correlation between two sets of data, with -1 being a perfectnegative correlation, and +1 being a perfect positive correlation. Usually, +0.7 or above isregarded a significant positive result.- 116 -
<strong>Barnsley</strong> in <strong>Depth</strong> <strong>Children</strong>’s and <strong>Young</strong> People’s Report – 2008/09 <strong>In</strong>formationFigure 7.3.7: Percentage Change in under-16 Population Receiving Disability LivingAllowance - August 2004-2008Source: BMBC Ward estimates 2008 derived from DWP <strong>In</strong>formation Analysis Directorate data5.0Estimated Percentage of Under 16 population claiming Disability Living Allowance<strong>Barnsley</strong> wards as at August 2008(Source: Department for Work & Pensions - <strong>In</strong>formation Analysis Directorate)Percentage of under 16 population4.03.02.04.23.24.03.52.53.32.9 2.82.33.52.53.12.93.22.73.22.8<strong>Barnsley</strong> Ave.2.9R 2 = 0.452.41.81.51.00.0Dearne NorthSt Helen'sStairfootDearne SouthWorsbroughNorth EastMonk BrettonKingstoneCentralCudworthWombwellHoyland MiltonDarfieldRoystonRockinghamOld TownDodworthDarton EastDarton WestPenistone WestPenistone EastMost Deprived Above Average Deprivation Average Below Average Deprivation Least DeprivedQuintile 1 Quintile 2 Quintile 3 Quintile 4 Quintile 5Note: R is a figure to illustrate the correlation between two sets of data, with -1 being a perfectnegative correlation, and +1 being a perfect positive correlation. Usually, +0.7 or above isregarded a significant positive result.Figure 7.3.8: Percentage of under-16 year olds in receipt of Disability Living Allowanceby Ward as at August 2008- 117 -
<strong>Barnsley</strong> in <strong>Depth</strong> <strong>Children</strong>’s and <strong>Young</strong> People’s Report – 2008/09 <strong>In</strong>formationDisability Living Allowance (16-24 year olds)<strong>In</strong> <strong>Barnsley</strong>, as at August 2008 there were 760 DLA claimants aged 16-24(3% of the 16-24 population) – a slight increase on the 2004 figure (2.8%).Figure 7.3.9 shows the trend over the past four years: the upper and lowerquartiles have followed the main trend.Figure 7.3.9: Change in % of 16-24 year olds in receipt of Disability Living Allowance byWard (2004-2008)6.0Change in percentage of 16-24 year olds claiming Disability Living Allowance in <strong>Barnsley</strong>- August 2004 to August 2008Disability Living Allowance 16-24DLA16-24 MaxDLA16-24 MinNorth East5.0WorsbroughDearne NorthDearne NorthWorsbrough% of 16-24 year olds4.03.02.0DLA16-24 UpperDLA16-24 Lower1.0Penistone WestPenistone WestPenistone EastPenistone WestOld Town0.02004 2005 2006 2007 2008The DLA claimant rate does not correlate strongly with the IMD 2007. NorthEast (5.2%), Central (4.6%) and Dearne North (4%) had the highest rates.North East and Central have been in the top three highest wards for the pastfive years: they also have amongst the highest rates of increase in claimantsover the 2004-2008 period (see Figure 7.3.11)Figure 7.3.10: Percentage of 16-24 Population Receiving Disability Living Allowance -August 2008Source: BMBC Ward estimates 2008 derived from DWP <strong>In</strong>formation Analysis Directorate data6Percentage of 16-24 year old population claiming Disability Living Allowance<strong>Barnsley</strong> wards August 2008(Source: Department for Work & Pensions - <strong>In</strong>formation Analysis Directorate)55.2Percentage of 16-24 year old population4324.02.12.73.53.83.82.94.62.52.32.93.23.43.31.83.3<strong>Barnsley</strong> Ave.2.8 R 2 = 0.212.22.02.010Dearne NorthSt Helen'sStairfootDearne SouthWorsbroughNorth EastMonk BrettonKingstoneCentralCudworthWombwellHoylandMiltonDarfieldRoystonRockinghamOld TownDodworthDarton EastDarton WestPenistoneWestPenistoneEastMost DeprivedAbove AverageDeprivation` Average Below Average Deprivation Least DeprivedQuintile 1 Quintile 2 Quintile 3 Quintile 4 Quintile 5- 118 -
<strong>Barnsley</strong> in <strong>Depth</strong> <strong>Children</strong>’s and <strong>Young</strong> People’s Report – 2008/09 <strong>In</strong>formationNote: R is a figure to illustrate the correlation between two sets of data, with -1 being a perfectnegative correlation, and +1 being a perfect positive correlation. Usually, +0.7 or above isregarded a significant positive result.Figure 7.3.11: Percentage Change in under 16 Population Receiving Disability LivingAllowance - August 2004-2008Change in % of 16-24 year olds claiming Disability Living Allowance between August 2004 and 2008(Source: Department for Work & Pensions - <strong>In</strong>formation Analysis Directorate)<strong>Barnsley</strong>WorsbroughWombwellStairfootSt Helen'sRoystonRockinghamPenistone WestPenistone EastOld TownNorth EastMonk BrettonKingstoneHoyland MiltonDodworthDearne SouthDearne NorthDarton WestDarton EastDarfieldCudworthCentral-1.5-0.7-0.6-0.8-0.7-0.5-0.10.00.20.20.10.10.20.20.40.51.01.11.21.31.21.6-2.0 -1.5 -1.0 -0.5 0.0 0.5 1.0 1.5 2.0% ChangeJobseeker’s Allowance (16-24 year olds)JSA is payable to people under pensionable age who are (a) available for,and actively seeking, work of at least 40 hours a week; (b) in Great Britain; (c)capable of work; (d) not in relevant education, and (e) working less than 16hours a week on average. <strong>In</strong> April 2004 Child Tax Credit replaced the childelements of Jobseekers Allowance.Those who have paid sufficient National <strong>In</strong>surance contributions receivecontribution-based JSA for up to six months. Those who do not qualify for, orwhose needs are not met by, contribution-based JSA, may qualify for incomebasedhelp on condition that a working partner must work less than 24 hoursa week on average. <strong>In</strong>come-based JSA is similar to <strong>In</strong>come Support and themajority of JSA recipients are expected to qualify through this route.Jobseeker’s Allowance claimant figures are subject to significant short-termchanges in the economy particularly in areas where large numbers of peopleare in low-paid and temporary jobs.<strong>In</strong> <strong>Barnsley</strong>, as at August 2008 there were 1,510 JSA claimants of 16-24years old (6% of the 16-24 year old population). This is an increase of 2.3% ofthe population from August 2004 (a 76% increase in numbers). Figure 7.3.12shows that the wards with the highest rates have shown the greatest increase(the upper quartile has increased faster than the <strong>Barnsley</strong> rate and lowerquartiles).- 119 -
<strong>Barnsley</strong> in <strong>Depth</strong> <strong>Children</strong>’s and <strong>Young</strong> People’s Report – 2008/09 <strong>In</strong>formationFigure 7.3.12: Change in % of 16-24 year olds claiming Jobseeker's Allowance in<strong>Barnsley</strong> (2004-2008)12.0Change in percentage of 16-24 year olds claiming Jobseeker's Allowance in <strong>Barnsley</strong> -August 2004 to August 2008Jobseekers AllowanceJSA MaxJSA MinSt Helen's10.0% of 16-24 year olds8.06.0St Helen'sKingstoneDearne NorthDearne NorthJSA Upper QuartileJSA Lower Quartile4.0Penistone East2.0Penistone EastPenistone EastPenistone EastPenistone East0.02004 2005 2006 2007 2008St. Helen’s (10.9%), Worsbrough (9%) and Stairfoot (8.4%) have the highestrates. St. Helen’s ward has been in the top three wards with highest rates ofJSA claimants for the 2004-2008 period and it has increased by nearly 6%over that period. Figure 7.3.13 shows the strong correlation between JSAclaimants and deprivation. Hoyland Milton and Darfield stand out as havinghigher than expected JSA claimant rates. All wards have shown increases inthe number of JSA claimants. Worsbrough (+5.5%) and Hoyland Milton(+4.7%) wards have shown the greatest increase in JSA claimant rates overthe 2004-2008 period).Figure 7.3.13: Percentage of 16-24 Population Receiving Jobseeker’s Allowance -August 2008Source: BMBC Ward estimates 2006 derived from DWP <strong>In</strong>formation Analysis Directorate data12Estimated Percentage of 16-24 year old population claiming Jobseeker's Allowance<strong>Barnsley</strong> Wards August 2008(Source: Department for Work & Pensions - <strong>In</strong>formation Analysis Directorate)1010.9Percentage of 16-24 year old population8648.18.46.49.06.06.96.05.86.25.57.97.64.64.45.03.45.4<strong>Barnsley</strong> Ave.R 2 = 0.654.73.5 3.420Dearne NorthSt Helen'sStairfootDearne SouthWorsbroughNorth EastMonk BrettonKingstoneCentralCudworthWombwellHoyland MiltonDarfieldRoystonRockinghamOld TownDodworthDarton EastDarton WestPenistone WestPenistone EastMost Deprived Above Average Deprivation Average Below Average Deprivation Least DeprivedQuintile 1 Quintile 2 Quintile 3 Quintile 4 Quintile 5- 120 -
<strong>Barnsley</strong> in <strong>Depth</strong> <strong>Children</strong>’s and <strong>Young</strong> People’s Report – 2008/09 <strong>In</strong>formationNote: R is a figure to illustrate the correlation between two sets of data, with -1 being a perfectnegative correlation, and +1 being a perfect positive correlation. Usually, +0.7 or above isregarded a significant positive result.Figure 7.3.14: Percentage change in 16-24 Population Receiving Jobseeker’sAllowance - August 2004-2008Change in % of 16-24 year olds claiming Jobseeker's Allowance between August 2004 and 2008(Source: Department for Work & Pensions)<strong>Barnsley</strong>WorsbroughWombwellStairfootSt Helen'sRoystonRockinghamPenistone WestPenistone EastOld TownNorth EastMonk BrettonKingstoneHoyland MiltonDodworthDearne SouthDearne NorthDarton WestDarton EastDarfieldCudworthCentral0.30.70.81.71.81.71.62.32.42.62.42.52.93.03.63.43.73.34.04.75.55.80.0 0.5 1.0 1.5 2.0 2.5 3.0 3.5 4.0 4.5 5.0 5.5 6.0 6.5% ChangeFigure 7.3.15: Percentage of 16-24 year olds in Receipt of Jobseeker's Allowance byWard as at August 2008- 121 -
<strong>Barnsley</strong> in <strong>Depth</strong> <strong>Children</strong>’s and <strong>Young</strong> People’s Report – 2008/09 <strong>In</strong>formationNew Deal (ND)Linked with job seeking is the New Deal programme: three types can affectyoung people – ND for <strong>Young</strong> People (NDYP), ND for Lone Parents (NDLP)and ND for Disabled People (NDDP).As at August 2008 9 , in <strong>Barnsley</strong> there were:• 550 people aged 16-24 on NDYP – 220 were under 19 (40% of total);• There has been a 96% increase in numbers since August 2005 and a +7%change since August 2007.During 2008, 890 individuals started on the New Deal for Lone Parentsprogramme (NDLP). Based on the age profile since 1998, about 20% (c. 180people) aged under 24 started in 2008.Since 2004 the total number of participants of all ages increased by 112%(greater than the increase in Great Britain overall). However, the changebetween 2007 and 2008 was only 24% (compared with 40% for GB).Between 2004 and 2008 the total number of people registering for New Dealfor Disabled People (NDDP) in the South Yorkshire districts increased by 40%(compared to a 28% drop in GB).Based on the age profile in South Yorkshire since 2001, it is estimated that7% (c. 130 people) are aged 18-24.<strong>In</strong>capacity Benefit (IB)/ Severe Disablement Allowance (SDA) 10NB Employment and Support Allowance (ESA) replaced <strong>In</strong>capacity Benefitand <strong>In</strong>come Support paid on the grounds of incapacity for new claims from27th October 2008. From April 2009, IB claimants have been moved across tothe ESA. There is insufficient data at present to show any trends.IB is paid to people who are assessed as being incapable of work. After thefirst 28 weeks of incapacity, for people previously in work “incapacity”, is theclaimant’s ability to do their own job; for all other cases the ‘PersonalCapability Assessment’ which assesses ability to carry out a range of workrelatedactivities.Between August 2004 and August 2008, the number of IB claimants whowere 16-24 years of age fell by 24% from 1,100 (4.7% of the 16-24population) to 840 (3.3%). Figure 7.3.16 shows the rates in wards with thehighest rates have fallen most over the period.9 All figures rounded to nearest 1010 New claims for SDA were stopped after April 2001 – but continues to be paid to thosealready in receipt- 122 -
<strong>Barnsley</strong> in <strong>Depth</strong> <strong>Children</strong>’s and <strong>Young</strong> People’s Report – 2008/09 <strong>In</strong>formationFigure 7.3.16: Change in % of 16-24 year olds claiming <strong>In</strong>capacity Benefit / SevereDisablement Allowance in <strong>Barnsley</strong> August 2004-2008Change in percentage of 16-24 year olds claiming <strong>In</strong>capacity Benefit / Severe Disablement Allowance in<strong>Barnsley</strong> - August 2004 to August 200810.0<strong>In</strong>capacity BenefitIBSDA MaxIBSDA Min9.0Dearne North8.0Dearne North7.0Dearne North% of 16-24 year olds6.05.04.0WorsbroughDearne NorthIBSDA Upper Quartile3.0IBSDA Lower Quartile2.01.00.0Penistone EastDarton WestPenistone WestDodworthDarton West2004 2005 2006 2007 2008Dearne North (5.7%), Worsbrough (4.8%) and Dearne South (4.6%) have thehighest rates of IBSDA claimants aged 16-24. Dearne North has seen asignificant fall in the IB/SDA claimant rate (- 3.3%). Cudworth (- 2.5%) andKingstone (- 3.2%) have seen notable falls but all other wards have remainedthe same or have shown modest falls over the 2004-2008 period.Figure 7.3.17: Percentage of 16-24 Population Receiving <strong>In</strong>capacity Benefit or SevereDisability Allowance - August 2008Source: BMBC Ward estimates 2008 derived from DWP <strong>In</strong>formation Analysis Directorate data6.0Estimated Percentage of 16-24 year old population claiming <strong>In</strong>capacity Benefit / Severe Disablement Allowance - <strong>Barnsley</strong>Wards August 2008(Source: Department for Work and Pensions)5.75.0Percentage of 16-24 year old population4.03.02.01.03.83.94.64.84.44.13.64.42.53.62.84.52.53.22.21.0<strong>Barnsley</strong> Ave.3.0R 2 = 0.662.21.61.30.0Dearne NorthSt Helen'sStairfootDearne SouthWorsbroughNorth EastMonk BrettonKingstoneCentralCudworthWombwellHoyland MiltonDarfieldRoystonRockinghamOld TownDodworthDarton EastDarton WestPenistone WestPenistone EastMost Deprived Above Average Deprivation Average Below Average Deprivation Least DeprivedQuintile 1 Quintile 2 Quintile 3 Quintile 4 Quintile 5Note: R is a figure to illustrate the correlation between two sets of data, with -1 being a perfectnegative correlation, and +1 being a perfect positive correlation. Usually, +0.7 or above isregarded a significant positive result.- 123 -
<strong>Barnsley</strong> in <strong>Depth</strong> <strong>Children</strong>’s and <strong>Young</strong> People’s Report – 2008/09 <strong>In</strong>formationFigure 7.3.17 shows the strong correlation between the ward deprivation andthe IB/SDA claimant rate – although Central and Worsbrough wards have thehighest rates but are not in the most deprived quintile.Figure 7.3.18: Percentage of 16-24 year olds in Receipt of <strong>In</strong>capacity Benefit / SDA byWard as at August 2008Figure 7.3.19: Change in Percentage of 16-24 Population Receiving <strong>In</strong>capacity Benefit /Severe Disablement Allowance - August 2004-2008Change in % of 16-24 year olds claiming <strong>In</strong>capacity Benefits / Severe Disablement Allowance between August2004 and 2008(Source: Department for Work & Pensions - <strong>In</strong>formation Analysis Directorate)<strong>Barnsley</strong>WorsbroughWombwellStairfootSt Helen'sRoystonRockinghamPenistone WestPenistone EastOld TownNorth EastMonk BrettonKingstoneHoyland MiltonDodworthDearne SouthDearne NorthDarton WestDarton EastDarfieldCudworthCentral-3.2-3.3-2.5-2.4-2.4-1.9-1.4-1.4-1.4-1.2-1.0-0.4-0.6-0.4-0.5-0.10.10.10.10.10.31.0-3.5 -3.0 -2.5 -2.0 -1.5 -1.0 -0.5 0.0 0.5 1.0 1.5% Change- 124 -
<strong>Barnsley</strong> in <strong>Depth</strong> <strong>Children</strong>’s and <strong>Young</strong> People’s Report – 2008/09 <strong>In</strong>formationCarer’s Allowance (to under 24s)Carers Allowance (CA) is a non-contributory benefit for those who:• Look after a severely disabled person for at least 35 hours a week;• Are eligible before their 65th birthday;• Are not gainfully employed (i.e. not earning more than £79 per weekafter certain deductions);• Are not in full-time education.The severely disabled person whom they care for must be getting either:• The highest or middle rate of Disability Living Allowance carecomponent, or Attendance Allowance, or;• Constant Attendance Allowance paid at the normal maximum rate.The statistics for all tables are based on a 100% extract from the Carer’sAllowance computer system. The numbers for carers under 18 are small sounder-24 has been used and the data is only available at Local Authoritylevel.As at August 2008, there were 160 people under 24 caring for a severelydisabled person in <strong>Barnsley</strong>. This is 3.2% of the total number of carers in<strong>Barnsley</strong> – greater than the GB average (2.5%) but about the same as theSouth Yorkshire average (3.1%). However, expressed as a rate per 1,000population aged 16-24, <strong>Barnsley</strong> has a rate (6.2 per ‘000) more than twice thenational average (3.2 per ‘000) and the highest in South Yorkshire.7.3.2 Families and DependantsChild BenefitNB There has been no update released by HM Revenue & Customs for Child Benefit dataChild Benefit is normally paid for children up to the age of 16 or 19 if the childis in full-time non-advanced education (i.e. up to A-level or NVQ level 3standard) at a recognised educational establishment. Child Benefit can alsobe paid for a short period for 16 or 17 year olds who have just left school andare registered for work or work based training for young people. It is noncontributoryand not <strong>In</strong>come related – which essentially means nearly allfamilies are eligible for it.Data is only available at the Local Authority level. Figure 7.3.20 shows thenumber of families in receipt of Child Benefit by the size of the family for allthe South Yorkshire local authorities in 2006/07.- 125 -
<strong>Barnsley</strong> in <strong>Depth</strong> <strong>Children</strong>’s and <strong>Young</strong> People’s Report – 2008/09 <strong>In</strong>formationFigure 7.3.20 Number of Families Receiving Child Benefit by Family Size 2005/06Source: HMRC 2006 Child Benefit DataNumber of families, by sizeTotalOnechildTwochildrenThreechildrenSouth Yorkshire 159,540 73,140 62,045 18,010 6,340<strong>Barnsley</strong> 29,055 13,905 11,285 3,050 810Doncaster 37,555 17,415 14,455 4,275 1,410Rotherham 32,745 14,920 12,880 3,650 1,295Sheffield 60,185 26,905 23,425 7,035 2,820Four or morechildrenFigure 7.3.21: Percentage change in Number of Families Receiving Child Benefit byFamily Size 2004/5-2006/7Source: HMRC 2006 Child Benefit DataNumber of families, by sizeTotalOnechildTwochildrenThreechildrenSouth Yorkshire 0.7 2.5 -1.1 -1.2 3.3<strong>Barnsley</strong> 1.3 2.6 -0.3 -0.2 6.6Doncaster 0.3 2.4 -1.3 -3.3 1.8Rotherham 0.2 2.1 -1.0 -3.2 1.6Sheffield 1.0 2.9 -1.4 0.7 3.9Four ormorechildrenFigure 7.3.22 shows the number of children in receipt of Child Benefit by ageband.Figure 7.3.22: Number of <strong>Children</strong> For Which Child Benefit is Paid by Age 2006/7Source: HMRC 2006 Child Benefit DataNumber of <strong>Children</strong>, by AgeTotal Under 5 5-10 11-1516 andoverSouth Yorkshire 279,100 71,365 89,320 82,745 35,665<strong>Barnsley</strong> 49,130 12,370 15,815 14,865 6,085Doncaster 65,245 16,470 20,705 19,610 8,465Rotherham 57,315 14,210 18,385 17,285 7,435Sheffield 107,405 28,320 34,415 30,990 13,680Figure 7.3.23: Percentage change in Number of <strong>Children</strong> For Which Child Benefit isPaid by Age 2004/5-2006/7Source: HMRC 2006 Child Benefit DataNumber of children in these families by age.16 andTotal Under 5 5-10 11-15overSouth Yorkshire 0.3 2.7 -3.4 -1.0 8.5<strong>Barnsley</strong> 1.0 4.7 -4.3 0.4 10.7Doncaster -0.5 3.3 -4.5 -2.3 8.2Rotherham -0.4 1.0 -3.9 -1.7 9.7Sheffield 0.7 2.4 -2.0 -0.5 7.1- 126 -
<strong>Barnsley</strong> in <strong>Depth</strong> <strong>Children</strong>’s and <strong>Young</strong> People’s Report – 2008/09 <strong>In</strong>formationNew Deal for Lone Parents (children of recipients)New Deal is a Government programme that aims to give unemployed peoplethe help and support they need to get into work. New Deal for Lone Parents isa voluntary programme specifically designed to help lone parents into work.Lone Parents who are not working, or working less than 16 hours per week(and their partner is not working) and bringing up children where youngestchild is under-16 years old can join New Deal for Lone Parents.The table below shows the number of participants in New Deal for LoneParents by the age of their youngest child for each South Yorkshire localauthority and the GB total as at August 2008.Figure 7.3.24: Number of Participants on New Deal for Lone Parents by Age of<strong>Young</strong>est Child as at August 2008Source: DWP <strong>In</strong>formation Analysis Directorate 2008Total Age group of youngest child (age at entry to New Deal)0-2 3-5 6-8 9-12 13-15 UnknownParticipantsGreat Britain 964,190 207,61 212,40 162,06 179,85 133,330 68,9400 0 0 0<strong>Barnsley</strong> 4,910 1,070 1,060 860 950 690 290Doncaster 6,260 1,420 1,360 1,080 1,180 820 410Rotherham 5,120 1,080 1,110 860 1,010 710 350Sheffield 8,840 1,880 2,000 1,470 1,630 1,270 590<strong>In</strong>come Support (age of youngest dependent)Data is available at Local Authority level showing the age of the youngestdependent of those in receipt of <strong>In</strong>come Support. Figure 7.3.25 shows that asat August 2008 there were 4,650 people in receipt of <strong>In</strong>come Support whohad at least one child (47% of all IS claimants). For 46% of claimants withchildren, their youngest child was under 5 – the largest group. Those wherethe youngest child was 5 to 11 accounted for 29% of claimants with children;those where the youngest was 11-16 for 19% and those where the youngestwas 16 or over for 5.6%.The number of IS claimants with children in <strong>Barnsley</strong> decreased between2004 and 2008 by 11.8%. This is a greater fall than the GB average (-8.5%).- 127 -
<strong>Barnsley</strong> in <strong>Depth</strong> <strong>Children</strong>’s and <strong>Young</strong> People’s Report – 2008/09 <strong>In</strong>formationFigure 7.3.25: Number (in thousands) of <strong>In</strong>come Support Claimants by Age of <strong>Young</strong>estChild August 2008Source: DWP <strong>In</strong>formation Analysis Directorate 2008Age of youngest child dependantTotal (inthousands)Unknownchild ageor nochildrenUnder55 tounder1111 tounder1616 oroverTotalwith<strong>Children</strong>GreatBritain 2,111.61 1,094.67 449.55 318.73 196.51 52.15 1,016.94<strong>Barnsley</strong> 9.92 5.27 2.13 1.37 0.89 0.26 4.65Doncaster 11.88 6.22 2.72 1.67 1 0.26 5.65Rotherham 10.37 5.39 2.25 1.51 0.96 0.27 4.99Sheffield 20.87 11.27 4.55 2.76 1.84 0.44 9.59Jobseeker’s Allowance (age of youngest dependent)Data available at Local Authority level shows the number of claimants brokendown by the age of their youngest child. Figure 7.3.26 shows this data forGreat Britain and the four South Yorkshire Local Authorities as at August2008.<strong>In</strong> <strong>Barnsley</strong>, of the 4,090 JSA claimants, 490 (12%) had children – 51% ofwhom were under 5 years old. The number of people claiming JSA withchildren has increased by 113% from August 2004 to August 2008.Figure 7.3.26: Number (in thousands) of JSA Claimants by Age of <strong>Young</strong>est ChildAugust 2008Source: DWP <strong>In</strong>formation Analysis Directorate 2007Age of youngest child dependantUnknownTotalchild age orno children Under 55 tounder 1111 tounder 1616 oroverGreat Britain 868.73 776.47 46.57 18.54 9.87 17.28<strong>Barnsley</strong> 4.09 3.6 0.25 0.13 0.05 0.06Doncaster 5.73 5.06 0.38 0.13 0.07 0.1Rotherham 4.47 3.94 0.26 0.13 0.06 0.08Sheffield 9.32 8.29 0.58 0.21 0.1 0.157.3.3 Child Poverty estimatesNB There has been no update released by DWP for this dataDepartment for Work and Pensions (DWP) calculates the number of childrenin households where at least one adult is claiming a working age benefit(either <strong>In</strong>capacity benefit, Severe Disablement Allowance, JobseekersAllowance, <strong>In</strong>come Support or Pension Credit). The ward values in Figure7.3.27 are estimates derived from LSOA data released by DWP – apopulation weighting has been used. These are therefore not officialestimates.- 128 -
<strong>Barnsley</strong> in <strong>Depth</strong> <strong>Children</strong>’s and <strong>Young</strong> People’s Report – 2008/09 <strong>In</strong>formationAs at April 2007, <strong>Barnsley</strong> had 10,375 children living in households meetingthe child poverty condition above (23.9% of the under 16 population). Thiswas a decrease of 4.6% on the numbers as at April 2006.Figure 7.3.27: Percentage of under-16s in households where at least one adult isreceiving a working age benefit by old <strong>Barnsley</strong> ward - April 2005 and 2006Source: Department for Work and Pensions <strong>In</strong>formation Analysis Directorate5045Perce nta ge of Childre n (unde r 16) in households cla iming out of w orkbenefits as at Apr 2006 and Apr 2007 (S ourc e: DW P)Ra te 200 6Ra te 200 740% of under 16 population35302520151050Dearne NorthSt Helen'sDearne SouthWorsbroughStairfootMonk BrettonNorth EastCudworthKi ngs toneWo mbwellDarfieldCentralHoyland M iltonRoystonRockinghamOld TownDarton Ea stDodworthDarton WestPen istone WestPen istone EastFigure 7.3.28: Percentage of under 16s in households claiming workless benefits byLSOA with <strong>Barnsley</strong> ward as at August 2007- 129 -
<strong>Barnsley</strong> in <strong>Depth</strong> <strong>Children</strong>’s and <strong>Young</strong> People’s Report – 2008/09 <strong>In</strong>formation7.3.4 Child Tax CreditsNB. At the time of publication, there has been no update to the smallgeographical area data from HMRC. Once this information is available we willupdate the documentChild Tax Credit (CTC) is the main way that families get money for theirchildren, and for 16-18 year olds in education. The amount received is basedon income and can be claimed whether or not you are in work. It has replacedthe old Tax Credits and benefits with a single system - so all families withchildren, with an income up to £58,000 a year (or up to £66,000 a year if thereis a child under one year old), can claim in the same way.Working Tax Credit (WTC) is a payment to top-up the earnings of low paidworking people (whether employed or self-employed), including those who donot have children. The 'childcare element' of Working Tax Credit is paiddirectly to the main carer of the child or children along with Child Tax Credit.Working Tax Credit contains several elements, including additional amountsfor: working people with a disability, people with a severe disability, and thecosts of registered or approved child care.More information on eligibility is availiable here:http://www.hmrc.gov.uk/taxcredits/forms-and-leaflets/leaflets.htmMore information on the Lower Super Output Area data used in the analysisbelow is available from this document:http://www.hmrc.gov.uk/stats/personal-tax-credits/intro-ctc-small-area-stats.pdfand from the Excel files on this webpage:http://www.hmrc.gov.uk/stats/personal-tax-credits/ctc-small-areas.htmIt is important to note that the data used here are experimental and notNational Statistics. The Lower Super Output Area level data has beenweighted based on population to the <strong>Barnsley</strong> wards to calculate the wardfigures.<strong>In</strong> <strong>Barnsley</strong>, 25,290 families and 43,065 children receive Child Tax creditpayments (87.9% and 88.3% of all families and children, respectively). <strong>In</strong> workfamilies account for 75.7% of all recipient families and of these 16.4% receivemore than the Family Element (i.e. more than the basic level of payment).Lone parents families make up 32.4% of all families (in and out of work) andaccount for 13,460 children.- 130 -
<strong>Barnsley</strong> in <strong>Depth</strong> <strong>Children</strong>’s and <strong>Young</strong> People’s Report – 2008/09 <strong>In</strong>formationFigure 7.3.29: Child Tax Credit recipients: key data as at August 2005%Familiesinreceiptof CTC%<strong>Children</strong>inreceiptof CTC% <strong>In</strong>workfamiliesof allCTCfamilies% Outof workfamiliesof allCTCfamilies% <strong>In</strong> workfamiliesreceivingmorethanFamilyElement%<strong>Children</strong>in ‘<strong>In</strong>work’familiesreceivingmorethanFamilyElement% ofCTCfamiliesthat areLoneParentfamilies% of<strong>Children</strong>in CTCfamiliesthat areLoneParentfamilies<strong>Barnsley</strong> 87.9 88.3 75.7 24.3 16.4 19.6 32.4 31.3Yorkshire &Humber83.6 83.7 77.4 22.6 15.7 18.8 33.3 31.4Great Britain 78.1 90.0 75.3 24.7 15.7 19.1 35.3 33.5Source: HM Revenue & CustomsWithin <strong>Barnsley</strong> there is little variation in the percentage of children in familiesin receipt of Child Tax Credit across the wards. This is because families canstill claim the basic level of CTC while earning up to £58,000 (higher forfamilies with a child under 1). Most families in <strong>Barnsley</strong> earn below thisamount and are therefore eligible to claim CTC.As would be expected there is a strong statistical relationship between thepercentage of children in ‘out-of-work’ families in the ward receiving CTC andthe deprivation of the ward. The percentage of children in families in receipt ofCTC that are in lone-parent families also shows a strong statisticalrelationship with deprivation at ward level (see Figure 7.3.30 and Figure7.3.31 below). The highest percentages were in St. Helen’s (38.6%), Stairfoot(36.5%), Worsbrough (36.3%) and Kingstone (36.2%).Figure 7.3.30: <strong>Children</strong> in Lone Parent families receiving Child Tax Credit as a % of All<strong>Children</strong> in Families receiving CTC as at August 2005 by ward.45<strong>Children</strong> in Lone Parent Families receiving Child Tax Credit as a % of All <strong>Children</strong> in Families receiving CTCas at August 2005(Source: HM Revenue & Customs)40% of all children in families receiving CTC35302520151035.438.632.431.636.5 36.2 36.331.630.932.930.932.0 32.430.929.627.221.725.4 25.7R 2 = 0.7623.221.150Dearne NorthSt Helen'sDearne SouthNorth EastStairfootKingstoneWorsbroughMonk BrettonCentralCudworthWombwellHoylandMiltonDarfieldRoystonRockinghamOld TownDodworthDarton EastDarton WestPenistoneWestPenistoneEastMost Deprived Above Average Deprivation Average Below Average Deprivation Least DeprivedQuintile 1 Quintile 2 Quintile 3 Quintile 4 Quintile 5- 131 -
<strong>Barnsley</strong> in <strong>Depth</strong> <strong>Children</strong>’s and <strong>Young</strong> People’s Report – 2008/09 <strong>In</strong>formationNote: R is a figure to illustrate the correlation between two sets of data, with -1 being a perfectnegative correlation, and +1 being a perfect positive correlation. Usually, +0.7 or above isregarded a significant positive result.Figure 7.3.31: Percentage of children in Lone Parent families receiving Child TaxCredits at Lower Super Output Area level as at August 2005Families eligible for Working Tax Credit (WTC) are working but on lowincomes. The percentage of children in families receiving both WTC and ChildTax Credit (CTC) showed slight variation across the wards (see Figure7.3.32). The ward with the highest rate was St. Helen’s (34.8%) and thelowest was Penistone East (21.1%) – however there was a very weakstatistical correlation with deprivation scores.- 132 -
<strong>Barnsley</strong> in <strong>Depth</strong> <strong>Children</strong>’s and <strong>Young</strong> People’s Report – 2008/09 <strong>In</strong>formationFigure 7.3.32: <strong>Children</strong> in ‘<strong>In</strong> work’ families receiving Working Tax Credit and Child TaxCredit as a % of All <strong>Children</strong> in Families receiving CTC as at August 2005 byward.40.0<strong>Children</strong> in '<strong>In</strong> Work' Families receiving Working Tax Credit and Child Tax Credit as a % of all <strong>Children</strong> in familiesreceiving CTC as at August 2005(Source: HM Revenue & Customs)35.034.8% of children in families30.025.020.015.027.829.831.825.429.729.130.227.728.229.330.628.927.730.028.427.8 28.123.6 23.521.110.05.00.0Dearne NorthSt Helen'sDearne SouthNorth EastStairfootKingstoneWorsbroughMonk BrettonCentralCudworthWombwellHoyland MiltonDarfieldRoystonRockinghamOld TownDodworthDarton EastDarton WestPenistone WestPenistone EastMost Deprived Above Average Deprivation Average Below Average Deprivation Least DeprivedQuintile 1 Quintile 2 Quintile 3 Quintile 4 Quintile 5Geographical analysis at SOA level shows that there are areas across thewhole of the Borough where the percentage is high (reds and oranges inFigure 7.3.33). This highlights that low income families live in areas that arenot normally classed as deprived.Figure 7.3.33: Percentage of children in families receiving Working Tax Credit andChild Tax Credit at Lower Super Output Area level as at August 2005- 133 -
<strong>Barnsley</strong> in <strong>Depth</strong> <strong>Children</strong>’s and <strong>Young</strong> People’s Report – 2008/09 <strong>In</strong>formation7.4 <strong>In</strong>come – CACI PayCheck dataAccording to the latest PayCheck data (January 2009), <strong>Barnsley</strong> had a meanhousehold income of £30,320 but the median was £26,070.7.4.1 <strong>In</strong>come Ward analysisFigure 7.4.1 shows the mean and median household income at ward level.Aggregation to this level of geography does remove some of the moredetailed intra-area differences.As would be expected the wards with the highest average incomes are thosewith the lowest deprivation scores and the correlation between averageincome and deprivation at ward level is strong. The same pattern occurs withthe median income, although it is clear that the median incomes are all lowerthan the mean.Figure 7.4.1: Average (Mean & Median) household income by ward deprivation quintile45Average Mean & Median <strong>In</strong>come per Household (£000s) by Ward DeprivationQuintiles (2009)Average <strong>In</strong>come per Household (£000s) Median (£000s) Linear (Average <strong>In</strong>come per Household (£000s))4035R 2 = 0.8630£000s2520151050DearneNorthSt Helen'sStairfootDearneSouthWorsbroughNorth EastMonkBrettonKingstoneCentralCudworthWombwellHoylandMiltonDarfieldRoystonRockinghamOld TownDodworthDarton EastDartonWestPenistoneWestPenistoneEastMost DeprivedAbove AverageDeprivationAverageBelow AverageDeprivationLeast DeprivedQuintile 1 Quintile 2 Quintile 3 Quintile 4 Quintile 5Note: R is a figure to illustrate the correlation between two sets of data, with -1 being a perfectnegative correlation, and +1 being a perfect positive correlation. Usually, +0.7 or above isregarded a significant positive result.It is also worth noting that there is a trend in the difference between themedian and the mean averages: it increases as deprivation decreases(r 2 =0.86).- 134 -
<strong>Barnsley</strong> in <strong>Depth</strong> <strong>Children</strong>’s and <strong>Young</strong> People’s Report – 2008/09 <strong>In</strong>formationAPPENDIX A: Contributors to the ReportIf you would like to contact any of the people below, please contact the Central ResearchTeam in the first instance on either: 01226 773189 or 773440 or by email atcentralresearchteam@barnsley.gov.ukCentral Research TeamElizabeth Pitt, James LeachAsylum SeekersJulie WingfieldHealthRebecca Sherry, Louise Wake, Helen HicksonMental HealthCharlotte Schofield, Janet FosterThe BARNAngela Van Den BergRoad AccidentsPete ClaytonYouth ServiceAndrea KaySocial Care ServicesDominic Ambler, Peter RobertsEducationSimon Snowden, Peter AthertonLSC DataIan SwainConnexionsTracey HerbertChildcareLinda CrummackCrime & Racial HarassmentMax Senior<strong>Young</strong> CarersTracy NewmanYouth Offending Team (YOT)Colin Barnes, Tina LangleyLNETHelen Shaw- 135 -
<strong>Barnsley</strong> in <strong>Depth</strong> <strong>Children</strong>’s and <strong>Young</strong> People’s Report – 2008/09 <strong>In</strong>formationAPPENDIX BMethod for Developing Ward Quintile GroupsThe wards were grouped into the quintiles based on their estimated scorefrom the <strong>In</strong>dex of Multiple Deprivation 2004. This involved two stages: 1) toestimate the ward deprivation scores for the new wards (2004 to present) and2) the most appropriate grouping of 21 wards into five categories.1) New ward estimates.The IMD scores were developed based on Lower Layer Super Output Areas –a statistical geography developed by the Office for National Statistics toenable development of statistics in areas of equal population. The superoutput areas were constrained to the pre-2004 electoral ward boundarieswhich allowed the development of unofficial IMD scores for pre-2004 wardsbased on an 2001 census population-weighted average of the SOA IMDscores within the ward.<strong>In</strong> 2004, the ward boundaries changed and no longer were co-terminus withthe SOA boundaries. <strong>In</strong> order to create IMD score estimates for the newwards the population weightings had to account for SOAs straddlingboundaries of wards. Those entirely within a ward were treated before i.e.their whole population was used for the weighting. Those SOAs with less thana 3% / 97% split across wards were treated as 100% within the ward it wasmostly in.For the other SOAs (i.e. those crossing ward boundaries) a GIS was used toshow a map of non-commercial addresses from the Royal Mail PostalAddress File – as this is the most accurate locator of addresses available.From this it was possible to calculate the number of non-commercialproperties within a particular SOA and ward (i.e. where they overlap). Thiswas then shown as a percentage of all non-commercial properties within thewhole SOA. This gave an approximate percentage of the SOA populationwithin the ward. It is this population within SOA and ward that is used toweight the IMD scores for SOAs to the new wards.2) Five ward quintileWith 21 wards, one quintile would have to have five wards (the rest fourwards). The remaining ward should go into the quintile (to make a group offive) where it has least effect on the average IMD score for that quintile. Aseries of calculations were made showing the impact on the average IMDscore of the next ward in the ranking being included to make a group of five.The one where this had least impact on the average was the middle quintile.- 136 -