Investigating Effect of Machining Parameters of CNC ... - IRD India
Investigating Effect of Machining Parameters of CNC ... - IRD India
Investigating Effect of Machining Parameters of CNC ... - IRD India

Create successful ePaper yourself
Turn your PDF publications into a flip-book with our unique Google optimized e-Paper software.
<strong>Investigating</strong> <strong>Effect</strong> <strong>of</strong> <strong>Machining</strong> <strong>Parameters</strong> <strong>of</strong> <strong>CNC</strong>Milling on Surface Finish by Taguchi MethodAmit Joshi & Pradeep KothiyalMechanical Engg. Deptt., G.B.Pant Engineering College, Pauri Garhwal, <strong>India</strong>E-mail : amitjoshi_81@yahoo.co.in & pradeep201183@gmail.comAbstract - <strong>CNC</strong> End milling is a unique adaption <strong>of</strong> theconventional milling process which uses an end mill toolfor the machining process. <strong>CNC</strong> Vertical End Milling<strong>Machining</strong> is a widely accepted material removal processused to manufacture components with complicated shapesand pr<strong>of</strong>iles. During the End milling process, the material isremoved by the end mill cutter. The effects <strong>of</strong> variousparameters <strong>of</strong> end milling process like spindle speed, depth<strong>of</strong> cut, feed rate have been investigated to reveal theirImpact on surface finish using Taguchi Methodology.Experimental plan is performed by a Standard OrthogonalArray. The results <strong>of</strong> analysis <strong>of</strong> variance (ANOVA) indicatethat the feed Rate is most influencing factor for modelingsurface finish. The graph <strong>of</strong> S-N Ratio indicates the optimalsetting <strong>of</strong> the machining parameter which gives theoptimum value <strong>of</strong> surface finish. The optimal set <strong>of</strong> processparameters has also been predicted to maximize thesurface finish.Among several <strong>CNC</strong> industrial machiningprocesses, milling is a fundamental machiningoperation. End milling is the most common metalremoval operation encountered. It is widely used in avariety <strong>of</strong> manufacturing in industries. The quality <strong>of</strong>the surface plays a very important role in theperformance <strong>of</strong> milling as a good-quality milledsurface significantly improves fatigue strength,corrosion resistance, or creep life. The surfacegenerated during milling is affected by different factorssuch as vibration, spindle run–out, temperature, toolgeometry, feed, cross-feed, tool path and otherparameters.Keywords— surface finish, orthogonal array, taguchimethod, ANOVA, SN ratio.I. INTRODUCTIONIn present time the technology <strong>of</strong> <strong>CNC</strong> verticalmilling machine has been improved significantly tomeet the advance requirements in variousmanufacturing fields, especially in the precision metalcutting industry. This experiment gives the effect <strong>of</strong>different machining parameters (spindle speed, feed,and depth <strong>of</strong> cut) on material removal rate in endmilling. The demand for high quality and fullyautomated production focus attention on the surfacecondition <strong>of</strong> the product, surface finish <strong>of</strong> the machinedsurface is most important due to its effect on productappearance, function, and reliability. For these reasonsit is important to maintain consistent tolerances andsurface finish.During finish milling, the depth <strong>of</strong> cut is small.Technological parameter range plays a very importantrole on surface roughness. In end milling, use <strong>of</strong> highcutting speed, low feed rate and low depth <strong>of</strong> cut arerecommended to obtained better surface finish for thespecific test range in a specified material. Materialremoval rate (MRR) is an important control factor <strong>of</strong>machining operation and the control <strong>of</strong> machining rateISSN : 2319 – 3182, Volume-1, Issue-2, 201260
International Journal on Theoretical and Applied Research in Mechanical Engineering (IJTARME)is also critical for production planners. MRR is ameasurement <strong>of</strong> productivity & it can be expressed byanalytical derivation as the product <strong>of</strong> the width <strong>of</strong> cut,the feed velocity <strong>of</strong> milling cutter and depth <strong>of</strong> cut.Cutting feed is the most dominated factor for surfacefinish. The most important interactions, that effectsurface roughness <strong>of</strong> machined surfaces, are betweenthe cutting feed and depth <strong>of</strong> cut, and between cuttingfeed and spindle speed. Surface Roughness is affectednegatively if the applied force is increased. Surfaceroughness at the same feed rate becomes higher when asmall nose radius is used. Effort to increaseproductivity and MRR was maximized by optimalselection <strong>of</strong> feed rate, geometric boundary conditions].With the more precise demands <strong>of</strong> modernengineering products, the control <strong>of</strong> surface texturetogether with dimensional accuracy has become moreimportant. This experimental investigation outlines theTaguchi optimization methodology, which is applied tooptimize MRR in end milling operation. Theexperiment is conducted on aluminium cast heattreatablealloy the processing <strong>of</strong> the job is done byHigh Speed Steel (HSS) end-mill tool under finishingconditions. The machining parameters evaluated arespindle speed, feed rate and depth <strong>of</strong> cut. Theexperiments are conducted by using Taguchi L 9orthogonal array as suggested by Taguchi. Signal-to-Noise (S/N) ratio and Analysis <strong>of</strong> vVariance(ANOVA) is employed to analyse the effect <strong>of</strong> millingparameters on material removal rate.II. EXPERIMENT AND DATA COLLECTIONExperiments are designed with the help <strong>of</strong> usingtaguchi L 9 orthogonal array. The s<strong>of</strong>tware used forDOE (Design <strong>of</strong> experiment) is Minitab15. Experimentis divided into three main phases. These three phasesare the planning phase, the conducting phase, theanalysis phase.A) Planning phase2.1 input parameters & there levels for End MillingTable 1Control factorSpindle speedFeed RateDepth <strong>of</strong> cut<strong>Parameters</strong> <strong>of</strong> the settingSymbolFactor AFactor BFactor CTable 2Controlfactors/levelsSelected input ParameterLevel1 Level2 Level3 UnitsFactor A 800 1000 1200 rpmFactor B 60 80 100 mm/minFactor C 0.2 0.3 0.4 mm2.2 Design <strong>of</strong> experiments (DOE)For selected input parameters experiments aredesigned using Taguchi L 9 orthogonal standard array.For this purpose s<strong>of</strong>tware Minitab 15 is usedExperimentno1(A)Spindle speed(RPM)TABLE-3 (DOE)2(B)Feed Rate(mm/min)3(C)Depth <strong>of</strong> cut(mm)1 800 60 0.22 800 80 0.33 800 100 0.44 1000 60 0.35 1000 80 0.46 1000 100 0.47 1200 60 0.48 1200 80 0.29 1200 100 0.3The set <strong>of</strong> 9 experiments are shown in table-3.2.3 Workpiece materialThe material used for the experiment is (100 x 34x 20 mm) 5 blocks <strong>of</strong> aluminium cast heat-treatablealloy. Whose compositions are as follows.COMPOSITION(% By Weight)Yield Strength (MPa) 110Tensile Strength(MPa) 221Ductility (%EL in 50 mm) 8.5Cu 4.5%Si 1.1%Rest AlApplications Flywheel and rear axlehousing, Bus and aircraftwheels, Crankcases61ISSN : 2319 – 3182, Volume-1, Issue-2, 2012
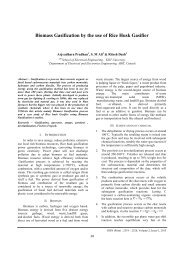
International Journal on Theoretical and Applied Research in Mechanical Engineering (IJTARME)B. Conducting phase2.4 ExperimentationAfter DOE, 9 experiments are carried out in <strong>CNC</strong>vertical End milling. After each experiment SURFACEROUGHNESS is calculated. A quality characteristicfor SURFACE ROUGHNESS is smaller is the better.The signal-to-noise ratios <strong>of</strong> each experimental run arecalculated based on the following equation, which arelisted in corresponding tables with the data.The equation is:-The specification <strong>of</strong> this instrument are given inbelow.Specification <strong>of</strong> surftest SJ201P:DetectorDetection methodMeasurement rangedifferential inductancemethod350µm(-200µm to +150µm)13780µin (-7880µin to+5900µin)Where SNi is the signal to noise ratio <strong>of</strong> ith term,n = number <strong>of</strong> measurements in a trial/row, in thiscase, n=3 and Yi is the i th measured value in a run/row.Instruments used for measuring surface roughnessOne <strong>of</strong> the measurable output characteristics issurface Roughness. Instrument used in this paper formeasurement <strong>of</strong> surface Roughness is MitutoyoSurftest SJ-201P. The surftest SJ-201P (mitutoyo) is ashop–floor type surface-roughness measuringinstrument, which traces the surface various machineparts and calculates the surface roughness based onroughness standards, and displays the results. Theworkpiece is attached to the detector unit <strong>of</strong> the SJ-201P will trace the minute irregularities <strong>of</strong> theworkpiece surface. The vertical stylus displacementduring the trace is processed and digitally displayed onthe liquid crystal display <strong>of</strong> the SJ-201P.Stylus materialTip radiusMeasuring forceRadius <strong>of</strong> skidcurvatureDiamond5µm (2900µin), 2µm (8µin)0.75mN (measuring forcetype)4mN (0.4gf), 0.75mN(0.75gf)(0.75mN measuring forcetype)40mm (1.57 in)Drive unitMeasurement range and resolutionFig 1 Mitutoyo Surftest SJ-201P InstrumentDetector drive rangeTraversing speedmeasurementReturnDetector retractionfunctionBottom configuration21 mm (.82 in)0.25mm/s, 0.5mm/s(.01in/s, .02in/s)0.8mm/s (.03in/s)Stylus upV-way62ISSN : 2319 – 3182, Volume-1, Issue-2, 2012
International Journal on Theoretical and Applied Research in Mechanical Engineering (IJTARME)Measurement rangeResolutionAutoo.o1 µm to .04 µm dependingon the measurementrange350 µm (14000 µin) 0.4 µm (12.8 µin )100 µm (4000 µin) 0.1 µm (3.2 µin)50 µm (2000 µin) 0.05 µm (1.6 µin)10 µm (400 µin) 0.01 µm (.4 µin)Table for response (surface roughness) and S-Nratio is shown in table-4FeedrateDepth <strong>of</strong>cutResidualerror2 0.2231 0.2231 0.1115 7.02 0.1252 29.0653 29.0653 14.5327 915.28 0.0012 0.0318 0.0318 0.0159total 8 29.7445From above table it can be seen that all the threefactors are significantly affect the response. Feed ratehas highest effect on the response spindle speed hassecond highest effect on response and depth <strong>of</strong> cut hasleast effect on response.(A)Spindlespeed(rpm)TABLE-4(B) (C)Feed rate Depth(mm/min) <strong>of</strong> cut(mm)ResponseSurfaceroughness(µm)S-NRatio(dbi)1 800 60 0.2 1.37000 -2.735032 800 80 0.3 1.80000 -5.105813 800 100 0.4 2.10000 -6.444654 1000 60 0.3 0.77000 2.268235 1000 80 0.4 0.79000 2.045606 1000 100 0.2 0.89000 1.010747 1200 60 0.4 0.35000 9.109208 1200 80 0.2 0.52000 5.675659 1200 100 0.3 3.09000 -2.32437C) Analysing Phase2.5 Analysis <strong>of</strong> variance (ANOVA)The output characteristic, surface finish isanalysed by s<strong>of</strong>tware Minitab 15 and ANOVA isformed, which shows the percentage contribution <strong>of</strong>each influencing factor on surface roughness. This alsosignifies that which factor is more predominant in <strong>CNC</strong>END MILLING. Main effect plots for means and Maineffect plots for SN ratios are plotted by help <strong>of</strong>s<strong>of</strong>tware Minitab 15.TABLE 5 Analysis <strong>of</strong> variance for meanssource DF Seq SS Adj SS Adj MS F PSpindlespeed2 0.4243 0.4243 0.2121 13.36 0.070The figure 2 contains the graph between SN ratiodata and input parameter. The figure 3 contain thegraph between mean and control factors. The objective<strong>of</strong> using the SN ratio as a performance measurement isto develop product and processes in sensitive to noise63ISSN : 2319 – 3182, Volume-1, Issue-2, 2012
International Journal on Theoretical and Applied Research in Mechanical Engineering (IJTARME)factor. The optimal combination <strong>of</strong> input machiningparameter can be observed from fig 2 i.e. graphbetween S-N ratio and input parameter, The optimalsetting <strong>of</strong> input parameter is(A 1 B 3 C 2 ). The processparameter setting with the highest SN ratio alwaysyields the optimum quality with minimum variation(Antony & Kaye, 1999).2.6 COMPUTATION OF AVERAGEPERFORMANCEAverage performance <strong>of</strong> each factor on surfaceroughness is calculated byFollowing expressionTABLE 7 Response table for MeanLEVEL SPINDLESPEEDFEEDRATEDEPTHOF CUT1 1.7567 0.8300 0.92672 0.8167 1.0367 1.29223 0.7256 1.4322 1.0800DELTA 1.0311 0.6022 0.3656RANK 1 2 32.7 CALCULATION OF OPTIMUM SURFACEFINISH.Let T ’ = average result for 9 runs <strong>of</strong> SURFACEFINISH=1.2977Similar expression can be written for calculating theaverage performance <strong>of</strong> factor B & C.Notations:-A’ 1 , A’ 2 , A’ 3 = average performance <strong>of</strong> factor A at level1, 2, 3 respectivelyB’ 1 , B’ 2 , B’ 3 = average performance <strong>of</strong> factor B at level1, 2, 3 respectivelyC’ 1 , C’ 2 , C’ 3 = average performance <strong>of</strong> factor C at level1, 2, 3 respectivelyTable for factors A, B, C & their levels 1, 2, 3 withSurface Roughness is shown below.A’ 1 = 1.75A’ 2 = 0.81A’ 3 = 1.32B’ 1 = 0.83B’ 2 = 1.04B’ 3 = 2.03C’ 1 = 0.93C’ 2 = 1.88C’ 3 = 1.08TABLE 6 Response table for Signal to Noise RatioLEVEL SPINDLESPEEDFEEDRATEDEPTHOF CUT1 -4.7618 2.8808 1.31712 1.7749 0.8718 -1.72063 4.1535 -2.5861 1.5700DELTA 8.9153 5.4669 3.2907RANK 1 2 3SF OPT = T’+ (A 1 – T’) + (B 3 -T’) + (C 2 -T’)=3.0723 µm3. RESULT AND DISCUSSION1) From the graph <strong>of</strong> S-N ratio it can be observed thatoptimal value <strong>of</strong> surface finish is obtained at firstlevel <strong>of</strong> factor A, third level <strong>of</strong> factor B and secondlevel <strong>of</strong> factor C.2) Optimal value <strong>of</strong> surface finish is 3.0723 µm.3) From the ANOVA it can be seen that percentagecontribution <strong>of</strong> feed rate is maximum and it meansFeed rate is the most dominating factor formodelling surface finish.4) Taguchi robust design is suitable for modellingsurface finish in <strong>CNC</strong> milling.REFERENCES1] Dalgobind Mahto And Anjani Kumar,” Optimization <strong>of</strong>Process <strong>Parameters</strong> in Vertical <strong>CNC</strong> Mill MachinesUsing Taguchi’s Design <strong>of</strong> Experiments”, Ariser Vol. 4No. 2 (61-75,20082] Tao Ye, Cai-Hua Xiong,” Geometric ParameterOptimization In Multi-Axis <strong>Machining</strong>”, Computer-Aided Design 40 (2008) 879–890,20083] S. Doruk Merdol, Yusuf Alt,” Virtual Cutting AndOptimization Of Three-Axis Milling Processes”,International Journal Of Machine Tools & Manufacture48 1063– 1071,20084] H.-S. Lu, J.-Y. Chen, Ch.-T. Chung,” The OptimalCutting Parameter Design Of Rough Cutting Process InSide Milling”, Volume 29 Issue 2 , 20085] M.A. Lajis, A.N. Mustafizul Karim, A.K.M. NurulAmin, A.M.K. Hafiz, L.G. Turnad,” Prediction Of Tool64ISSN : 2319 – 3182, Volume-1, Issue-2, 2012
International Journal on Theoretical and Applied Research in Mechanical Engineering (IJTARME)Life In End Milling Of Hardened Steel Aisi D2”, Issn1450-216x Vol.21 No.4, Pp.592-602,20086] J. V. Abellan, F. Romero, H. R. Siller, A. Estruch And C.Vila,” Adaptive Control Optimization Of Cutting<strong>Parameters</strong> For High Quality <strong>Machining</strong> OperationsBased On Neural Networks And Search Algorithms”,Isbn 78-953-7619-16-9, Pp. 472, I-Tech, Vienna,Austria,20087] Guillem Quintana, Joaquim Ciurana , Daniel Teixidor,”A New Experimental Methodology For Identification OfStability Lobes Diagram In Milling Operations“,International Journal Of Machine Tools & Manufacture48 (2008) 1637–1645,20088] S. Khachan, F. Ismail,” <strong>Machining</strong> Chatter Simulation InMulti-Axis Milling Using GraphicalMethod”,International Journal Of Machine Tools AndManufacture, (2008),9] Ping-Han Wu, Yu-Wei Li, Chih-Hsing Chu,” OptimizedTool Path Generation Based On Dynamic ProgrammingFor Five-Axis Flank Milling Of Rule Surface”,International Journal Of Machine Tools & Manufacture48 , 1224– 1233,2008.10] M.T. Hayajneh, M.S. Tahat, J. Bluhm , “Study Of The<strong>Effect</strong>s Of <strong>Machining</strong> <strong>Parameters</strong> On The SurfaceRoughness In The End-Milling Process”, Jordan JournalOf Mechanical And Industrial Engineering,(2007).11] H.Cao, X.Chen, Y.Zia, F.Ding,H.Chen, J.Tan, Z.He,”End Milling Tool Breakage Detection Using LiftingScheme And Mahalanobis Distance”, InternationalJournal Of Machine Tools & Manufacture 48, 141–151,(2008)12] A.Javidi, U.Rieger, W.Eichlseder,” The <strong>Effect</strong> Of<strong>Machining</strong> On The Surface Integrity And Fatigue Life”,International Journal Of Fatigue 30, 2050–2055, (2007).13] H.Basak, H. H.Goktas,” Burnishing Process on Al-Alloyand Optimization <strong>of</strong> Surface Roughness and SurfaceHardness by Fuzzy Logic”, Technical Education Faculty,Mechanical Education Department, Bes_Evler, 06500Ankara, Turkey, (2008).14] J. Wang, Q. Zhang, “Study <strong>of</strong> High-Performance PlaneRake Faced Twist Drills. Geometrical Analysis andExperimental Investigation”, International Journal <strong>of</strong>Machine Tools & Manufacture 48, 1276– 1285, (2008).15] M.Kurt & E.Bagci & Y.Kaynak, “Application <strong>of</strong>Taguchi Methods in the Optimization <strong>of</strong> Cutting<strong>Parameters</strong> for Surface Finish and Hole DiameterAccuracy in Dry Drilling Processes”, Int. J Adv.Manufacturing Technology -1368-2, (2007).16] D. Baji, B. Lela, D.Ivkovi, “Modelling Of MachinedSurface Roughness And Optimization Of Cutting<strong>Parameters</strong> In Face Milling”, Original Scientific Paper –Izvorni Znanstveni Rad (2008).17] A.F.Desouza. R.T.Coelho, “Experimental Investigation<strong>of</strong> Feed Rate Limitations On High Speed Milling AimedAt Industrial Applications”, Springer-Verlag LondonLimited (2006).18] Chang Ching-Kao & H. S. Lu , “The Optimal Cutting-Parameter Selection Of Heavy Cutting Process In SideMilling For Sus304 Stainless Steel” Int J Adv ManufTechnol 34:440–447, (2007).19] Hari Singh And Pradeep Kumar “Optimizing Feed ForceFor Turned Parts Through The Taguchi Technique”,S¯Adhan¯A Vol. 31, Part 6, Pp. 671–681, 2006.20] A.M. Bassiuny, Xiaoli Li, “Flute Breakage DetectionDuring End Milling Using Hilbert–Huang TransformAnd Smoothed Nonlinear Energy Operator”,International Journal Of Machine Tools & Manufacture47 1011–1020 (2007).21] X. Liu, K. Cheng, “Modelling The <strong>Machining</strong> DynamicsOf Peripheral Milling”, International Journal Of MachineTools & Manufacture 45, 1301–1320 (2005).22] Warner J.C. & Connor J.O. “Molding Process IsImproved By Using The Taguchi Method”, ModernPlastics, 65-68, (1989).23] Lieh-Dai Yang, Joseph C. Chen, “ Statistical AssistedFuzzy-Nets Based In-Process Surface RoughnessPrediction (S-Fn-Ipsrp) System In End MillingOperations ”, Statistical Fuzzy-Nets Based In-ProcessSurface Roughness Prediction 494-511, ( 2003)24] Benardos P.G. & Vosniakos G.C. “Prediction <strong>of</strong> SurfaceRoughness in <strong>CNC</strong> Face Milling Using Neural Networksand Taguchi’s Design <strong>of</strong> Experiments”, Robotics AndComputer-Integrated Manufacturing, 18(5-6), 343-354.(2002).25] Kromanis, A.; Krizbergs, “3d Surface RoughnessPrediction Technique in End Milling Using RegressionAnalysis”, Tallinn, Estonia Industrial Engineering, 200865ISSN : 2319 – 3182, Volume-1, Issue-2, 2012