elemental analysis of engine oils using energy dispersive x-ray ...
elemental analysis of engine oils using energy dispersive x-ray ...
elemental analysis of engine oils using energy dispersive x-ray ...

Create successful ePaper yourself
Turn your PDF publications into a flip-book with our unique Google optimized e-Paper software.
Petroleum & CoalISSN 1337-7027Available online at www.vurup.sk/pcPetroleum & Coal 50 (1), 1-10, 2008ELEMENTAL ANALYSIS OF ENGINE OILS USING ENERGYDISPERSIVE X-RAY FLUORESCENCE SPECTROSCOPY(EDXRFS) AND INDUCTIVELY COUPLED PLASMAATOMIC EMISSION SPECTROSCOPY (ICP-AES)Richard Sági a * , Norbert Miskolczi a , László Bartha a , Pál Halmos ba University <strong>of</strong> Pannonia, Faculty <strong>of</strong> Engineering, Institute <strong>of</strong> Chemical and ProcessEngineering, Department <strong>of</strong> Hydrocarbon and Coal Processing, H-8201 Veszprém,P.O. Box 158, HUNGARYb University <strong>of</strong> Pannonia, Research Group for Analytical Chemistry <strong>of</strong> the HungarianAcademy <strong>of</strong> Science, H-8200 Veszprém, Egyetem Street 10, HUNGARYReceived October 19, 2007, accepted March 15, 2008AbstractElemental composition <strong>of</strong> various <strong>engine</strong> <strong>oils</strong> was measured by different analytical methods: <strong>energy</strong><strong>dispersive</strong> X-<strong>ray</strong> fluorescence spectroscopy (EDXRFS) and inductively coupled plasma atomic emissionspectroscopy (ICP-AES). Considerable differences were observed between the two methods. In case <strong>of</strong>EDXRFS strong matrix effects were detected on the calibration graphs. It was found that the preliminarysample preparation (digestion) before ICP-AES <strong>analysis</strong> resulted in the poorer accuracy <strong>of</strong> this method.Taking into consideration its matrix effect the quick, simple and cost-effective EDXRFS technique, withoutthe necessity <strong>of</strong> sample preparation, was selected for <strong>analysis</strong> <strong>of</strong> <strong>engine</strong> <strong>oils</strong> during and after differentscreening tests. Complementing the screening tests <strong>of</strong> <strong>engine</strong> <strong>oils</strong> (e. g. the high temperature depositpreventing, antiwear and antifriction properties) with properly calibrated EDXFRS <strong>analysis</strong> more andimportant information could be obtained about the degradation and the efficiency <strong>of</strong> the additives.Keywords: Energy <strong>dispersive</strong> X-<strong>ray</strong> fluorescence spectroscopy; Inductively coupled plasma atomic emissionspectroscopy; Engine oil; Screening test1. INTRODUCTIONDevelopment tendencies <strong>of</strong> <strong>engine</strong> constructions, emission after-treatment systems, fuelsand lubricants are determined by the ever stricter environmental regulations. In the EuropeanUnion the sulphur content <strong>of</strong> fuels has been reduced to 50 mg/kg and fuels with 10 mg/kgsulphur content have to be available regionally [1-5] . The other source <strong>of</strong> emission is the <strong>engine</strong>oil because a little bit <strong>of</strong> it always burns in the combustion chamber <strong>of</strong> the <strong>engine</strong>s and thusdeteriorates the exhaust gas after-treatment systems <strong>of</strong> vehicles. Regarding the latest technical,economical and environmental requirements <strong>engine</strong> <strong>oils</strong> with longer drain intervals have to beused with the lowest possible content <strong>of</strong> metals, sulphur and phosphorus. Also theconcentration <strong>of</strong> these elements is limited in regulations <strong>of</strong> performance levels <strong>of</strong> catalystcompatible <strong>engine</strong> <strong>oils</strong> (e. g. ACEA C levels, API CJ-4, ILSAC GF-4) [6-8] .During the use <strong>of</strong> <strong>engine</strong> <strong>oils</strong> changes in their <strong>elemental</strong> composition can be observed,which generally correlates with the decrease <strong>of</strong> the concentration <strong>of</strong> <strong>engine</strong> oil additives.References to the possible dynamics <strong>of</strong> the change in <strong>elemental</strong> composition <strong>of</strong> lubricants andits correlation with the most important properties (e.g. tribological, detergent-dispersant, etc.)were not found. However, a fast and cheap analytical method for investigating the changes in*Corresponding author: rsagi@almos.uni-pannon.hu (Richard Sági)
Richard Sági et al./Petroleum & Coal 50(1) 1-10 (2008) 2<strong>elemental</strong> composition <strong>of</strong> <strong>engine</strong> <strong>oils</strong> during and after screening tests would beadvantageous both in developing and formulation <strong>of</strong> lubricants.There are several methods for the quantitative and qualitative <strong>analysis</strong> <strong>of</strong> elements in newand used <strong>engine</strong> <strong>oils</strong>: inductively coupled plasma atomic/optical emission spectroscopy or massspectroscopy (ICP-AES/OES, ICP-MS), flame or graphite furnace atomic absorptionspectroscopy (FF-AAS/GF-AAS) or <strong>energy</strong>/wavelength <strong>dispersive</strong> X-<strong>ray</strong> fluorescencespectroscopy (ED/WDXRFS). For the determination <strong>of</strong> the composition <strong>of</strong> trib<strong>of</strong>ilms on differenttest-pieces methods based on transmission or scanning electron microscopy (TEM/SEM), ultrahigh vacuum tribometer (UHVT), Auger electron spectroscopy or scanning Auger microscopy(AES/SAM), electron <strong>energy</strong> loss spectroscopy (EELS), X-<strong>ray</strong> or UV photoelectronspectroscopy (XPS/UPS) are used [9-15] . ICP and EDXRFS techniques are commonly used fordetermining elements both in liquid and solid samples. In case <strong>of</strong> these methods calibrationcurves are mainly linear in a concentration range <strong>of</strong> 2-3 orders <strong>of</strong> magnitude. With special ICPapparatus many elements can be detected simultaneously in a few minutes, provided thatsample preparation is not required, e. g. after a simple dilution in kerosene. So it can be a fastanalytical method but generally preliminary sample preparation is required. This samplepreparation (e.g. digestion) is quite <strong>of</strong>ten complicated, time-consuming and its precision isessential to obtain accurate and reliable results. On the contrary sample preparation is notrequired in case <strong>of</strong> EDXRFS which is moreover a non-destructive, quick, easy and cost-effectivemethod for <strong>elemental</strong> <strong>analysis</strong> <strong>of</strong> samples. Taking into consideration the matrix effect, havingthe optimized exciting and measuring parameters and the proper calibration curves manyelements can be traced quickly and simultaneously by EDXRFS [15, 16] .In this work our objectives were investigating the adaptability <strong>of</strong> EDXRFS for <strong>elemental</strong><strong>analysis</strong> <strong>of</strong> different <strong>engine</strong> <strong>oils</strong> and comparing these EDXRFS results with the data obtained byinductively coupled plasma spectroscopy. By measuring two <strong>engine</strong> oil series (<strong>engine</strong> <strong>oils</strong> forDiesel and gasoline <strong>engine</strong>s) correlations were investigated between the changes <strong>of</strong> the<strong>elemental</strong> composition <strong>of</strong> <strong>engine</strong> <strong>oils</strong> during their degradation and the results <strong>of</strong> the screeningtests.2. EXPERIMENTAL2.1. Engine oil samplesThe original commercial <strong>engine</strong> oil compositions were marked with “REF” and containedcommercial dispersant additives produced by MOL-LUB Ltd. (Almásfüzitő, Hungary). Diesel<strong>engine</strong> oil compositions <strong>of</strong> SAE 15W-40 viscosity grade and API CH-4/SJ performance levelwere marked with letter “D”, while partly synthetic gasoline <strong>engine</strong> <strong>oils</strong> <strong>of</strong> SAE 10W-40 and APISJ/CF with letter “G”. The ones indicated with 1-2-3-4 were experimental <strong>engine</strong> <strong>oils</strong> containingvarious experimental dispersant additives which were synthesized in our Department.Properties <strong>of</strong> experimental <strong>engine</strong> <strong>oils</strong> and the traced elements are given in Table 1. Accordingto the data some differences were observed in the rheological properties <strong>of</strong> the experimental<strong>engine</strong> <strong>oils</strong>.Table 1. Properties <strong>of</strong> the experimental <strong>engine</strong> <strong>oils</strong> and the traced elementsPropertiesREFREFD1 D2 D3 D4DGG1 G2 G3 G4Viscosity at 40°C, 115. 92.8mm 2 /s8 494.2 96.5 97.9 88.1 86.5 83.1 83.9 84.2Viscosity at 40°C,mm 2 /s16.2413.4113.3713.8013.9513.5912.9612.5112.6612.83V.I. E 151 145 142 145 145 157 149 147 149 152Density at 20°C, g/cm 3 0.89 0.89 0.89 0.89 0.89 0.85 0.85 0.85 0.85 0.855 1 2 2 3 5 4 2 3 3Mo-containingdispersant- - - + - - - - + -Mo- and S-cont.dispersant- - - - + - - - - +Ca-containing detergent + + + + + + + + + +Zn-, S- and P-cont.ZnDDP+ + + + + + + + + ++ contained - did not contain
Richard Sági et al./Petroleum & Coal 50(1) 1-10 (2008) 32.2. Instruments2.2.1. EDXRFSOur analyses were carried out with a non-polarized <strong>energy</strong> <strong>dispersive</strong> X-<strong>ray</strong> fluorescencespectrometer (PHILIPS MiniPal PW 4025/02) which was controlled by PW 4051MiniPal/MiniMate S<strong>of</strong>tware V 2.0A. The s<strong>of</strong>tware also performed an integrated deconvolutionfunction that could separate closely spaced peaks in the spectrum which otherwise could not beseparated. The spectrometer was equipped with a 9 W Rh side-window tube anode, which was90° with respect to the central <strong>ray</strong>. The fluorescence X-<strong>ray</strong>s were detected with a Si-PINdetector with beryllium window and the raw signal was counted with a counter fitted with 2048channel. The special de Kat sample holder and thin polypropylene f<strong>oils</strong> were obtained fromPhilips Analytical B.V. In each case 5 g oil sample was dropped onto the thin polypropylene foiland the plastic sample holder was closed with the cover. Operating conditions <strong>of</strong> thisexperiment are summarized in Table 2. Samples did not need pre-treatment in this case.2.2.2. ICP-AES SpectrometerAs we wanted to compare the results obtained by EDXRFS to those obtained by ICP-AES,the <strong>elemental</strong> composition <strong>of</strong> <strong>engine</strong> <strong>oils</strong> were analyzed also by GBC Integra XM type ICP-AESapparatus. The applied operating conditions are presented in Table 3.2.2.3. High-pressure AsherThe sample preparation for the ICP <strong>analysis</strong> was made by a high-pressure asher (HPA,Austria) device. For each sample 3 repetitions were done. 0.4 g oil sample was dropped into aquartz vessel with 0.1mg accuracy. After adding 5 ml nitric acid (analytical grade, Sigma-Aldrich) the vessel was closed and put into the high-pressure asher in which the decompositiontemperature program was run (T 1 = 120°C, t 1 = 60 min; T 2 = 220°C, t 2 = 90 min, while thepressure raise from the initial 80 bar to 120 bar). The content <strong>of</strong> vessel was washed into a 25 mlflask after cooling and the volume was adjusted to the mark with deionised water.Table 2. EDXRFS operating conditionsProperties S P Ca Zn MoTarget S K a line P K a line Ca K a line Zn K a line Mo L a lineDetector Si-PIN Si-PIN Si-PIN Si-PIN Si-PINVoltage, kV 5 5 8 15 30Current, μA 500 800 30 300 1Filter None Kapton None None NoneMedium Helium Helium Helium Helium HeliumMeasuring time, s 180 180 180 180 180Table 3. Properties <strong>of</strong> the GBC Integra XM sequential type ICP-AES apparatusNebulizerConcentric Meinhard type with a cyclonic sp<strong>ray</strong> chamberRF-generator40.68 MHz crystal-controlledPower1200 W (optimal)Reflected power20 WTorchDismountable, quartzUse <strong>of</strong> Argon gasexternal (cooler) gas: 10 l/min, plasma gas: 0.5 l/min, sp<strong>ray</strong>er gas: 0.5 l/minHeight <strong>of</strong> observation6 mm above the induction coilOptical systemCzerny-Turner vacuum-monochromatorGratingHolographic, 1800 grooves/mmFocal length0.75 mResolution0.018 nm 1st order, 0.009 nm 2nd orderOptical range160-800 nmDetectorPhotoelectron multiplierElements (I: atom-, II: ion lines) Wavelength <strong>of</strong> emission lines used for <strong>analysis</strong>, nmMo II 202.031S I 182.563Zn I 213.857P I 213.617Ca II 317.933Ca I 422.673
Richard Sági et al./Petroleum & Coal 50(1) 1-10 (2008) 4Table 4. Properties <strong>of</strong> calibration curvesMethod Element Equation Conf. interval Lin. regr. coeff.Mo y = 0.095x + 1.79 ± 5.47 0.997Zn y = 0.241x + 3.02 ± 6.95 0.998EDXRFS P y = 0.102x + 2.22 ± 7.75 0.995Ca y = 0.090x + 2.28 ± 6.74 0.995S y = 0.516x + 5.13 ± 19.10 0.995Mo y = 0.199x + 1.93 ± 24.38 0.990Zn y = 0.193x + 2.15 ± 18.56 0.995ICP-AES P y = 0.185x + 5.30 ± 25.11 0.998Ca y = 0.184x + 5.77 ± 25.64 0.991S y = 0.189x + 4.61 ± 19.10 0.995Table 5. Concentrations <strong>of</strong> the elements in the standard solution measured by differentmethods (mg/kg)Method Mo Zn P Ca STheoretical 489 1520 1503 1517 1511EDXRS* 487 ± 0.7 1519 ± 1.6 1499 ± 1.3 1516 ± 1.1 1507 ± 0.9ICP-AES* 480 ± 19.9 1515 ± 25.4 1494 ± 23.0 1527 ± 25.9 1495 ± 30.1* 3 independent measurements2.3. Screening methods <strong>of</strong> <strong>engine</strong> <strong>oils</strong>The high temperature deposit preventing effect <strong>of</strong> experimental <strong>engine</strong> <strong>oils</strong> was determinedby a panel coker. According to the test method the <strong>engine</strong> oil was periodically splashed bya stirrer to an aluminium plate, which was heated to 300°C. During the 9 hours the apparatuswas dismounted in every 3 hours, the deposit formed on the plates was measured with 0.1 mgaccuracy and in a special lighted box a photo was taken by a digital camera [17] .The antiwear and antifriction effects <strong>of</strong> the <strong>engine</strong> <strong>oils</strong> were tested by a modified StanhopeSeta four-ball tester according to the ASTM D2783-88 standard test method. Starting andstopping <strong>of</strong> the apparatus and the measurement <strong>of</strong> oil temperature in the sample holder in everysecond were done by a computer. Antifriction efficiency was characterized by the average finaltemperature at the end <strong>of</strong> the test (T max ). Antiwear efficiency was evaluated by the average wearscar diameter measured on the stationary balls [18] .3. RESULTS AND DISCUSSION3.1. Calibration curvesFor the calibration <strong>of</strong> both apparatus standard solutions <strong>of</strong> sulphur (LOT No. 1002112),calcium (LOT No. 507921), zinc (LOT No. 507417), phosphorus (LOT No. 503515) andmolybdenum (LOT No. 506620) (supplier: Conostan Ltd.) were used in oil matrix (containedonly hydrocarbon molecules). The series <strong>of</strong> standard samples containing five different elementsin oil matrix (with regard to the <strong>engine</strong> oil samples which contained mainly base <strong>oils</strong>) were usedto determine the five point calibration graphs in the concentration range <strong>of</strong> 0-3000 mg/kg. It wasnecessary to select a suitable analytical line by the measurement <strong>of</strong> <strong>elemental</strong> concentration<strong>of</strong> samples with X-<strong>ray</strong> method. In case <strong>of</strong> this experiment the K a line <strong>of</strong> sulphur, phosphorus,calcium, zinc and the L a line <strong>of</strong> molybdenum were used. In case <strong>of</strong> EDXRFS the concentration<strong>of</strong> samples was calculated from measured raw intensities and the intensities <strong>of</strong> relevantanalytical lines were corrected for the background intensity employing the MiniPal/MiniMateS<strong>of</strong>tware V 2.0A, which applied an α-correction method. In case <strong>of</strong> ICP-AES matrix matchesmethod was used during calibration and raw signals were not corrected. The main properties<strong>of</strong> calibration graphs obtained by both methods are given in Table 4.According to data in Table 4 significant differences were observed between calibrationgraphs measured with different instruments and analytical methods because no matrix effectwas observed in case <strong>of</strong> ICP-AES technique while considerable effect <strong>of</strong> the other elementson the properties <strong>of</strong> calibration graphs was found when EDXRFS method was used. This is theconsequence <strong>of</strong> the well known phenomena that the chemical environment is an importantparameter in case <strong>of</strong> X-<strong>ray</strong> spectrometry. The linearity <strong>of</strong> calibration graphs was proved bythe <strong>analysis</strong> <strong>of</strong> linear regression coefficients. They are also shown in Table 4. According to the resultsvery good regression coefficients (>0.99) and no bias were observed in case <strong>of</strong> both methods.
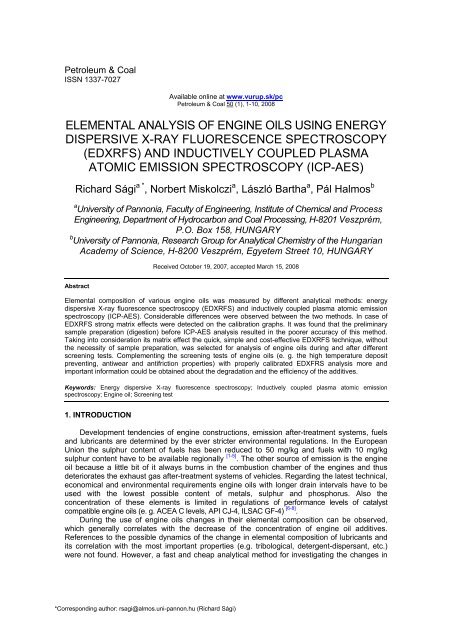
Richard Sági et al./Petroleum & Coal 50(1) 1-10 (2008) 5Table 4 shows also the mathematical equation <strong>of</strong> the calibration curves and their confidenceintervals.For checking the application possibility <strong>of</strong> calibration graphs the standard solutions werediluted in oil matrix and their solution with known concentration was produced (Table 5). Thenthe <strong>elemental</strong> concentrations <strong>of</strong> this sample were measured by both analytical techniques.According to data the accuracy <strong>of</strong> <strong>analysis</strong> <strong>of</strong> each element was much better in case<strong>of</strong> EDXRFS (RSD=0.15-0.47%), than in case <strong>of</strong> ICP-AES method (RSD=5.60-7.25%). Probablythe differences in the sample preparation <strong>of</strong> the methods caused the better correlation<strong>of</strong> EDXRFS. EDXRFS technique is a non-destructive analytical method, which did not requiresample preparation before measuring, whereas samples had to be digested in case <strong>of</strong> ICP-AES<strong>analysis</strong> and thence less precision could be reached.3.2.Elemental <strong>analysis</strong> <strong>of</strong> <strong>engine</strong> <strong>oils</strong> before screening testsFor the selection <strong>of</strong> the method for further <strong>analysis</strong> the original <strong>engine</strong> <strong>oils</strong> were analyzedwith EDXRFS and ICP-AES apparatus, too. The results and the differences in percentage areshown in Table 6.Comparing the results it was pointed out that the differences in the range <strong>of</strong> 270-4400mg/kg were inside the margin <strong>of</strong> error. Considering all detected elements the average<strong>of</strong> differences was only 1% and 3.9% in absolute value. EDXRFS results for phosphorus andsulphur were always lower than results obtained by ICP-AES. The differences between the twomethods for phosphorus and sulphur were 2.1-7.3% and 0.5-6.4%, respectively. Greatermolybdenum concentrations were always measured with the EDXRFS and the differences werein the range <strong>of</strong> 1.4-7.7%, while in case <strong>of</strong> zinc the <strong>elemental</strong> content measured with ICP-AEStechnique was only one time greater (this was only 16 mg/kg) and the differences were between1.3 and 7.0%. When concentration <strong>of</strong> calcium was measured usually (seven out <strong>of</strong> ten times)greater values <strong>of</strong> the <strong>elemental</strong> content were observed in case <strong>of</strong> ICP-AES technique,furthermore the interval <strong>of</strong> the deviation was 0.8-6.8%. In case <strong>of</strong> the three exceptions,observed at the calcium determination, the concentrations measured with ICP-AES methodwere only 31 mg/kg less than those measured with the EDXRFS technique. It was found thatthe differences between the results could be derived from the uncertainty <strong>of</strong> the two methods(digestion, greater deviation <strong>of</strong> ICP-AES results) and these differences (average 41 mg/kg,maximum 198 mg/kg) were acceptable. Taking our experimental results into consideration itwas found that the EDXRFS method can be capable for quick, simple and cost-effective<strong>elemental</strong> <strong>analysis</strong> <strong>of</strong> <strong>engine</strong> <strong>oils</strong>.3.3. Elemental <strong>analysis</strong> <strong>of</strong> <strong>engine</strong> <strong>oils</strong> after screening tests3.3.1. Analysis during and after Panel Coking TestThe change <strong>of</strong> chemical composition <strong>of</strong> experimental <strong>engine</strong> <strong>oils</strong> was traced during the hightemperature deposit preventing effect tests [17] . After 3, 6 and 9 hours samples were taken fromthe investigated <strong>engine</strong> <strong>oils</strong> and their <strong>elemental</strong> contents were analyzed by EDXRFS. Resultsare shown in Table 6. The deposits formed on the plates were basically derived fromthe oxidation <strong>of</strong> the hydrocarbon molecules <strong>of</strong> the base <strong>oils</strong> and a smaller part fromthe decomposition <strong>of</strong> the additives. As it is known, <strong>engine</strong> <strong>oils</strong> consist <strong>of</strong> mainly base <strong>oils</strong> (about85%) and different types <strong>of</strong> additives in smaller concentration (less than about 15%). From thepoint <strong>of</strong> view <strong>of</strong> the application <strong>of</strong> <strong>engine</strong> <strong>oils</strong> it is important, among other things, that theseadditives could prevent or reduce the deposit formation and the oxidation <strong>of</strong> base <strong>oils</strong>. Usingthe EDXFRS method important information about the efficiency <strong>of</strong> the additives could beobtained.It was found that the concentration <strong>of</strong> the investigated elements, due to the decomposition<strong>of</strong> the additives, always decreased during the panel coking test (Figure 1) and molybdenum-,calcium-, zinc-, phosphorus- and sulphur containing compounds formed deposits on the surface<strong>of</strong> panels. These elements could only be derived from the additives and their presence in thesolid deposits was proved by scanning electron microscopy (SEM).
Richard Sági et al./Petroleum & Coal 50(1) 1-10 (2008) 6Table 6. Elemental composition <strong>of</strong> <strong>engine</strong> <strong>oils</strong> before and after screening testsEngine <strong>oils</strong> after screening tests (EDXRFS), mg/kgEngineFresh <strong>engine</strong> <strong>oils</strong>, mg/kgElementPanel coking test durationoilAfter four-ballICP-AES EDXRFS Diff.*, % 3 h 6 h 9 h testREFD Zn 1174 1196 1.87 1068 1037 1028 1118P 1463 1432 2.12 1338 1301 1282 1353Ca 4267 4225 0.98 4098 4073 4057 4152S 3027 2958 2.28 2903 2883 2867 2891D1 Zn 1232 1216 1.30 1084 1049 1038 1167P 1537 1453 5.47 1295 1267 1255 1429Ca 4204 4235 0.74 4127 4076 4059 4230S 2973 2912 2.05 2864 2855 2846 2901D2 Zn 1166 1206 3.43 1124 1111 1108 1140P 1366 1285 5.93 1179 1159 1145 1273Ca 4101 4132 0.76 4041 4033 4024 4117S 3048 3034 0.46 2964 2917 2899 2939D3 Mo 404 421 4.13 381 359 345 399Zn 1246 1327 6.50 1195 1170 1163 1300P 1513 1416 6.41 1321 1284 1261 1408Ca 4235 4129 2.50 3999 3975 3958 3892S 3061 2895 5.42 2842 2818 2801 2856D4 Mo 429 462 7.69 422 409 405 447Zn 1201 1285 6.99 1174 1158 1154 1202P 1450 1367 5.72 1245 1230 1221 1304Ca 4379 4305 1.69 4195 4176 4179 4245S 3015 2870 4.81 2793 2775 2770 2804REFG Zn 1156 1191 3.03 1095 1063 1052 1172P 1421 1389 2.25 1307 1267 1254 1341Ca 2502 2476 1.04 2401 2381 2374 2465S 2996 2892 3.47 2850 2841 2838 2772G1 Zn 1138 1187 4.31 1089 1079 1072 1182P 1495 1453 2.81 1343 1308 1296 1241Ca 2465 2410 2.23 2294 2259 2251 2268S 3037 2918 3.92 2859 2830 2813 2849G2 Zn 1131 1191 5.31 1087 1052 1041 1155P 1420 1338 5.77 1254 1205 1193 1309Ca 2509 2430 3.15 2334 2317 2310 2418S 3052 2905 4.82 2854 2848 2843 2867G3 Mo 283 287 1.41 241 228 217 251Zn 1142 1220 6.83 1128 1112 1110 1206P 1432 1328 7.26 1217 1185 1171 1284Ca 2414 2251 6.75 2124 2100 2088 2248S 3082 2884 6.42 2821 2799 2784 2762G4 Mo 274 285 4.01 242 229 225 256Zn 1136 1216 7.04 1084 1056 1045 1194P 1347 1275 5.35 1141 1108 1101 1139Ca 2240 2254 0.63 2155 2112 2110 2136S 2912 2730 6.25 2654 2612 2607 2663* absolute value
Richard Sági et al./Petroleum & Coal 50(1) 1-10 (2008) 7REFDDecrease in concentration, mg/kgD1Decrease in concentration, mg/kgD2Decrease in concentration, mg/kgD3Decrease in concentration, mg/kgD4Decrease in concentration, mg/kg200160120804000 3 6 9Time in panel coker, h200160120804000 3 6 9Time in panel coker, h200160120804000 3 6 9Time in panel coker, h200160120804000 3 6 9Time in panel coker, h200160120804000 3 6 9Time in panel coker, hREFGDecrease in concentration, mg/kgG1Decrease in concentration, mg/kgG2Decrease in concentration, mg/kgG3Decrease in concentration, mg/kgG4Decrease in concentration, mg/kg200160120804000 3 6 9Time in panel coker, h200160120804000 3 6 9Time in panel coker, h200160120804000 3 6 9Time in panel coker, h200160120804000 3 6 9Time in panel coker, h200160120804000 3 6 9Time in panel coker, hFigure 1. Decreases in concentrations during panel coking test
Richard Sági et al./Petroleum & Coal 50(1) 1-10 (2008) 8According to our results the concentration <strong>of</strong> molybdenum decreased by the highestpercentage. After the 9 hour test the original concentration <strong>of</strong> the molybdenum (420-460 mg/kgin Diesel <strong>engine</strong> <strong>oils</strong>, 285 mg/kg in gasoline <strong>engine</strong> <strong>oils</strong>) decreased by 12-24%, whichdemonstrated that the molybdenum containing experimental additive was prone todecomposition. The decrease <strong>of</strong> the concentration <strong>of</strong> zinc and phosphorus was usually smaller(9-14%) furthermore the differences between the changes <strong>of</strong> these two elements were only 2-3%. This could be caused by the ZnDDP additive, which concentration was about 1% in each<strong>engine</strong> oil, and its zinc and phosphorus content was nearly equal. Therefore it is not surprisingthat during the degradation <strong>of</strong> ZnDDP nearly equivalent quantity <strong>of</strong> zinc and phosphorus wereaccumulated in the deposits because no other additives contained these two elements. Duringour tests the calcium and sulphur content <strong>of</strong> the <strong>engine</strong> <strong>oils</strong> decreased only by 2-7%, due to the highoxidation stability <strong>of</strong> the calcium-salicylate type detergent, which was present in the compositions.The decomposition <strong>of</strong> the sulphur containing additives (ZnDDP and experimental dispersant)and also the sulphur compounds <strong>of</strong> base <strong>oils</strong> resulted in significant decrease <strong>of</strong> sulphurcontents.Decreases <strong>of</strong> concentrations were the greatest in the first 3 hours while in the second andthird periods the concentration changes lessened (Figure 1).Table 7. Deposits on panels in panel coking testEngine oilDeposits, mg3 h 6 h 9 hREFD 12.6 20.3 29.0D1 22.5 24.9 34.0D2 8.9 10.1 22.8D3 20.2 25.8 28.3D4 23.6 30.2 41.2REFG 5.9 7.4 9.8G1 12.3 14.3 16.0G2 6.5 14.2 14.3G3 11.9 14.0 18.3G4 14.4 19.2 21.1According to our previous experiments, it was found that the first 3 hour period was the mostcritical from the point <strong>of</strong> view <strong>of</strong> the quantities <strong>of</strong> deposits (Table 7). In the first 3 hour period thequantities <strong>of</strong> deposits were in good correlation with the decreases <strong>of</strong> concentrations measuredwith EDXRFS (Figure 1 and Table 7). In the second and third time periods it could not beobserved. Its reason could be that the other non-detected elements (from hydrocarbons <strong>of</strong> baseoil) formed deposits. Based on our results in the first 3 hours the decomposition <strong>of</strong> additives wasdominant because decreases <strong>of</strong> concentrations were the greatest while in the other two periodsmainly the oxidation <strong>of</strong> hydrocarbons <strong>of</strong> base oil took place.3.3.2. Analysis after Four-ball Wear TestChanges in the <strong>elemental</strong> contents <strong>of</strong> investigated <strong>engine</strong> <strong>oils</strong> were detected afterthe antifriction and antiwear tests carried out with the Stanhope Seta four-ball instrument [18] .These results can also be seen in Table 6. The data showed that – as it was observed also inpanel coking tests – the concentration <strong>of</strong> all elements decreased during the four-ball wear test.The decrease <strong>of</strong> calcium and sulphur sometimes exceeded 100 mg/kg (2.5-3.5 %). Probably, as result<strong>of</strong> tribochemical reactions, FeS 2 and MoS 2 were formed on the sliding surfaces which causedthe decrease <strong>of</strong> the concentration <strong>of</strong> sulphur, furthermore the degradation <strong>of</strong> the calciumcontaining detergent could occur, too. The change <strong>of</strong> molybdenum concentration in Diesel<strong>engine</strong> <strong>oils</strong> (marked with D) was only a few percent while in case <strong>of</strong> gasoline <strong>engine</strong> <strong>oils</strong>(marked with G) it was around 10 %.The percentage <strong>of</strong> the decrease <strong>of</strong> zinc and phosphorus contents changed in a widerrange. The maximum value <strong>of</strong> the decrease was 6% and 15 % in case <strong>of</strong> zinc and phosphorus,respectively (G1 oil). In contrast to the results obtained during panel coking in some cases 10%differences were found between the concentration changes <strong>of</strong> these two elements. After fourballwear test these phenomena could also be well detected by the EDXRFS technique. Basedon the results obtained by various tests we supposed that under the different experimental
Richard Sági et al./Petroleum & Coal 50(1) 1-10 (2008) 9conditions the degradation <strong>of</strong> ZnDDP occurred in different ways. In the panel coking testthe temperature <strong>of</strong> the panel and the oil, which was splashed onto it, were 300°C, whilethe temperature <strong>of</strong> rest <strong>of</strong> the oil in the apparatus was around 150°C. In the sample holder<strong>of</strong> the four-ball apparatus the temperature <strong>of</strong> the oil was about 70-80°C during the tests, whileclose to the sliding surfaces higher temperature (some hundred °C heat flashes) and higherpressure occurred which led to the selective degradation <strong>of</strong> the additives and to the formation<strong>of</strong> a tribolayer.In case <strong>of</strong> <strong>engine</strong> <strong>oils</strong> with poorer antiwear (higher wear scar diameter) or antifrictionefficiencies (higher T max ) the overall changes in the concentrations <strong>of</strong> effective tribolayer formingelements were the smallest (Figure 2 and Table 8). Engine <strong>oils</strong> with good antiwear or antifrictionproperties showed the greatest overall decreases in concentrations. Thus it was found that incase <strong>of</strong> <strong>engine</strong> <strong>oils</strong> with poor or good antifriction and antiwear properties extreme concentrationchanges could be measured with the EDXRFS method.Table 8. Results <strong>of</strong> four-ball testsEngine Wear scaroil diameter, mmT max , °CREFD 0.69 72D1 0.94 77D2 0.71 73D3 0.70 74D4 0.76 72REFG 0.82 75G1 0.65 72G2 0.77 75G3 0.78 75G4 0.67 72450400Mo Zn P Ca S Overall change350Decrease in concentration, mg/kg300250200150100500REFD D1 D2 D3 D4 REFG G1 G2 G3 G4Figure 2. Decreases in concentrations after four-ball test4. CONCLUSIONDue to the ever stricter environmental regulations <strong>of</strong> <strong>engine</strong> <strong>oils</strong> there is an increasingdemand on the determination <strong>of</strong> their <strong>elemental</strong> content. For <strong>analysis</strong> X-<strong>ray</strong> fluorescence,atomic emission and absorption spectroscopy techniques are most commonly used. In ourexperimental work the <strong>elemental</strong> composition (sulphur, calcium, zinc, phosphorus and
Richard Sági et al./Petroleum & Coal 50(1) 1-10 (2008) 10molybdenum) <strong>of</strong> various <strong>engine</strong> <strong>oils</strong> (<strong>engine</strong> <strong>oils</strong> for Diesel and gasoline <strong>engine</strong>s) was measuredby different analytical methods: <strong>energy</strong> <strong>dispersive</strong> X-<strong>ray</strong> fluorescence spectroscopy (EDXRFS)and inductively coupled plasma atomic emission spectroscopy (ICP-AES). Comparing the dataconsiderable differences were observed between the two methods. In case <strong>of</strong> EDXRFS strongmatrix effects on the calibration graphs could be detected. Additionally it was found thatthe preliminary sample preparation (digestion) before ICP-AES <strong>analysis</strong> resulted in the pooreraccuracy <strong>of</strong> this method. Taking into consideration its matrix effect the quick, simple and costeffectiveEDXRFS technique without the necessity <strong>of</strong> sample preparation was selectedfor further <strong>analysis</strong> <strong>of</strong> <strong>engine</strong> <strong>oils</strong> during and after different screening tests. Complementingthe determination <strong>of</strong> the high temperature deposit preventing, antiwear and antifriction effects<strong>of</strong> <strong>engine</strong> <strong>oils</strong> with the EDXFRS <strong>analysis</strong> more and important information could be obtainedabout the deterioration and the efficiency <strong>of</strong> the additives. It was also found that after propercalibration the EDXRFS method can be advantageously used in the <strong>analysis</strong> <strong>of</strong> <strong>engine</strong> <strong>oils</strong>before and after screening tests.REFERENCES[1] EN 228:2004.[2] EN 590:2004.[3] E. Ito and J.A.R. van Veen, Catalysis Today 116 (2006) 446.[4] C. Song, Catalysis Today 86 (2003) 211.[5] Sz. Magyar, J. Hancsók and D. Kalló, Fuel Processing Technology 86 (2005) 1151.[6] H. Spikes, Lubrication Science 18 (2006) 223.[7] M. Ribeaud, Lubrication Science 18 (2006) 231.[8] R. Sági, L. Bartha, Á. Beck and J. Baladincz, Int. J. <strong>of</strong> Appl. Mech. and Eng. 11 (2006) 507.[9] J.K. Vilhunen, A. von Bohlen, M. Schmeling, R. Klockenkämper and D. Klockow,Spectrochimica Acta Part B, 52 (1997) 953.[10] I.M. Goncalves, M. Murillo and A.M. Gonzalez, Talanta 47 (1998) 1033.[11] M. Pouzar, T. Černohorskỷ and A. Krecjčová, Talanta 54 (2001) 829.[12] A. Zararsiz, R. Kirmaz and P. Arikan, Nucl. Instr. Methods Phys. Res., B, 108 (1996) 385.[13] L. Burguera et al., Talanta 68 (2005) 179.[14] G.C. Smith, Journal <strong>of</strong> Physics D 33 (2000) R187.[15] N. Miskolczi, L. Bartha, J. Borszéki and P. Halmos, Talanta 69 (2006) 776.[16] N. Miskolczi, L. Bartha, F. Antal and Cs. Dudás, Talanta 66 (2005) 1264.[17] G. Kis, L. Bartha, J. Baladincz and G. Varga, Petroleum and Coal 43 (2003) 106.[18] M. Bubálik, J. Hancsók, L. Bartha, R. Sági and G. Kis, 8 th Int. Conf. on Tribology,Veszprém, Hungary, (2004) Proceedings 198.