Nr.2 - ALPA - Albanian Papers
Nr.2 - ALPA - Albanian Papers Nr.2 - ALPA - Albanian Papers
Lamanithe material under biaxial loading, similar to thatof pressure vessels. The safety requests of thesevessels have been strengthened significantly, andtherefore the assessment of the suitability ofmaterials used in such applications is notconsidered sufficiently reliable if based only oninformation received from traditional tensiletesting [4, 5]. In this paper is presented amodification made to the disk test to enable thecharacterization of the mechanical behavior ofthin sheets of an austenitic steel, subject tobiaxial loading.MATERIAL AND METHODSThe study was performed on an AISI 321 stainlesssteel, cold-rolled to the thickness of 0.8 mm andheat treated to obtain the austenitic structure atroom temperature. Specimens, in the form of flatdisks, with a diameter of 58 mm, were cut from asheet of this steel, and were pressed underhelium, while maintaining the original thickness(i.e., without any surface machining). Standardtest cell was slightly modified to enable thecharacterization of the steel behavior during abiaxial loading (Fig.1). For this, the radius r wasincreased from 0.5 to 4 mm to avoid the stressconcentration in the embedding zone and toensure a uniform dome-shaped deformation ofthe disk.Figure 1. Geometry of the modified disk pressurecellThe main information obtained from the disktests (with the standard cell, as well as with themodified one), is the curve of the gas pressureversus deformation, which is automaticallyrecorded until the disk rupture. Deformation ismeasured as the cupola deflection H.Tests were conducted at different temperatures,from 18 to 650°C, with duration of severalminutes to 7 hours. The results of testsperformed at 18 and 400ºC are shown in Fig. 2.For purposes of comparison, the studied steelwas also subjected to the traditional tensile testat room temperature.Figure 2 Pressure-deflection curves at 18ºC and400°C.RESULTS AND DISCUSSIONSCalculation modelGas pressure-deformation relationships providevaluable information about the load-bearingcapacity of a pressure vessel with parameterssimilar to that of the disk deformed during thetesting, but not directly reflect the behavioralcharacteristics of the material. This behavior canbe assessed objectively only on the basis of truestresses and strains. For their calculation we haveused an analytical model, which assumes that thedisk is deformed as a membrane, taking also intoaccount the geometric parameters of the test cell[4]. With this model are calculated the radius R ofthe spherical dome, the engineering strain, ε, inthe lateral directions (x and y), and the actualthickness, e, for any measured value of the diskdeflection, H:22A HR r(1) H 2sin arctg A AKTET Vol. IV, Nr 2, 2011 189
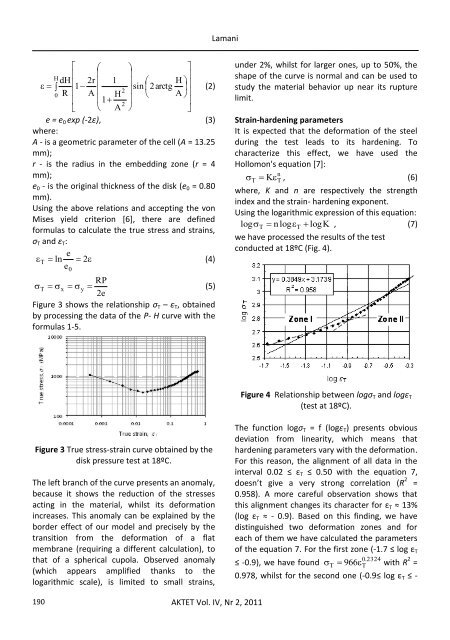
Lamani HdH 2r 1 H 1 sin 2arctg (2)20 R A H A 12 A e = e 0 exp (-2ε), (3)where:A - is a geometric parameter of the cell (A = 13.25mm);r - is the radius in the embedding zone (r = 4mm);e 0 - is the original thickness of the disk (e 0 = 0.80mm).Using the above relations and accepting the vonMises yield criterion [6], there are definedformulas to calculate the true stress and strains,σ T and ε T :eT ln 2(4)e0RP T x y(5)2eFigure 3 shows the relationship σ T – ε T , obtainedby processing the data of the P- H curve with theformulas 1-5.under 2%, whilst for larger ones, up to 50%, theshape of the curve is normal and can be used tostudy the material behavior up near its rupturelimit.Strain-hardening parametersIt is expected that the deformation of the steelduring the test leads to its hardening. Tocharacterize this effect, we have used theHollomon's equation [7]:nT K T , (6)where, K and n are respectively the strengthindex and the strain- hardening exponent.Using the logarithmic expression of this equation:log nlog logK , (7)TTwe have processed the results of the testconducted at 18ºC (Fig. 4).Figure 4 Relationship between logσ T and logε T(test at 18ºC).Figure 3 True stress-strain curve obtained by thedisk pressure test at 18ºC.The left branch of the curve presents an anomaly,because it shows the reduction of the stressesacting in the material, whilst its deformationincreases. This anomaly can be explained by theborder effect of our model and precisely by thetransition from the deformation of a flatmembrane (requiring a different calculation), tothat of a spherical cupola. Observed anomaly(which appears amplified thanks to thelogarithmic scale), is limited to small strains,The function logσ T = f (logε T ) presents obviousdeviation from linearity, which means thathardening parameters vary with the deformation.For this reason, the alignment of all data in theinterval 0.02 ≤ ε T ≤ 0.50 with the equation 7,doesn’t give a very strong correlation (R 2 =0.958). A more careful observation shows thatthis alignment changes its character for ε T ≈ 13%(log ε T ≈ - 0.9). Based on this finding, we havedistinguished two deformation zones and foreach of them we have calculated the parametersof the equation 7. For the first zone (-1.7 ≤ log ε T0.2324≤ -0.9), we have found T 966 T with R 2 =0.978, whilst for the second one (-0.9≤ log ε T ≤ -190AKTET Vol. IV, Nr 2, 2011
- Page 1 and 2: AKTETJournal of Institute Alb-Shken
- Page 4 and 5: WASTE BREWERS YEAST - A SIGNIFICANT
- Page 6: GUIDE FOR AUTHORSAKTET publishes pa
- Page 9: Kokaj et alacidic solution has also
- Page 12 and 13: Kokaj et al+on the diffusion proces
- Page 14 and 15: Krasniqi & KokaDefinitions and Acro
- Page 16 and 17: Krasniqi & Kokabuses 1 and 4 while
- Page 18 and 19: The number of iterations required b
- Page 20: Krasniqi & KokaFigure 8: Starting t
- Page 27 and 28: Lamaniaccompanied by the increasing
- Page 29 and 30: AKTET ISSN 2073-2244Journal of Inst
- Page 31: DushiBazuar në kushtet e dhëna ë
- Page 35 and 36: AKTET ISSN 2073-2244Journal of Inst
- Page 38 and 39: Caslli et al.way that will serve us
- Page 40 and 41: Caslli et al.weight. This approach
- Page 42 and 43: AKTET ISSN 2073-2244Journal of Inst
- Page 44 and 45: Karaj et alvlerat përkatëse të R
- Page 46 and 47: Rryma (nA)Rryma (nA)Karaj et al.Opt
- Page 48 and 49: Karaj et al Metodat optimale për p
- Page 50 and 51: Kullolli et almekanizma të tjerë
- Page 52 and 53: Kullolli et alF3 er1n*cos1 2esin1
- Page 54 and 55: AKTET ISSN 2073-2244Journal of Inst
- Page 56 and 57: Lajqi et alFig. 3. Paraqitja skemat
- Page 58 and 59: Lajqi et aledhe te automjetet që k
- Page 60 and 61: Lajqi et alNë fig. 10. dhe 11 jan
- Page 62 and 63: AKTET ISSN 2073-2244Journal of Inst
- Page 64 and 65: Durmishaj & HyseniElementikimikPër
- Page 66 and 67: Durmishaj & Hysenie Fe në sfalerit
- Page 68 and 69: Durmishaj & Hysenikarakterizohen m
- Page 70 and 71: Dushi & LameThe goal of this paper
Lamani HdH 2r 1 H 1 sin 2arctg (2)20 R A H A 12 A e = e 0 exp (-2ε), (3)where:A - is a geometric parameter of the cell (A = 13.25mm);r - is the radius in the embedding zone (r = 4mm);e 0 - is the original thickness of the disk (e 0 = 0.80mm).Using the above relations and accepting the vonMises yield criterion [6], there are definedformulas to calculate the true stress and strains,σ T and ε T :eT ln 2(4)e0RP T x y(5)2eFigure 3 shows the relationship σ T – ε T , obtainedby processing the data of the P- H curve with theformulas 1-5.under 2%, whilst for larger ones, up to 50%, theshape of the curve is normal and can be used tostudy the material behavior up near its rupturelimit.Strain-hardening parametersIt is expected that the deformation of the steelduring the test leads to its hardening. Tocharacterize this effect, we have used theHollomon's equation [7]:nT K T , (6)where, K and n are respectively the strengthindex and the strain- hardening exponent.Using the logarithmic expression of this equation:log nlog logK , (7)TTwe have processed the results of the testconducted at 18ºC (Fig. 4).Figure 4 Relationship between logσ T and logε T(test at 18ºC).Figure 3 True stress-strain curve obtained by thedisk pressure test at 18ºC.The left branch of the curve presents an anomaly,because it shows the reduction of the stressesacting in the material, whilst its deformationincreases. This anomaly can be explained by theborder effect of our model and precisely by thetransition from the deformation of a flatmembrane (requiring a different calculation), tothat of a spherical cupola. Observed anomaly(which appears amplified thanks to thelogarithmic scale), is limited to small strains,The function logσ T = f (logε T ) presents obviousdeviation from linearity, which means thathardening parameters vary with the deformation.For this reason, the alignment of all data in theinterval 0.02 ≤ ε T ≤ 0.50 with the equation 7,doesn’t give a very strong correlation (R 2 =0.958). A more careful observation shows thatthis alignment changes its character for ε T ≈ 13%(log ε T ≈ - 0.9). Based on this finding, we havedistinguished two deformation zones and foreach of them we have calculated the parametersof the equation 7. For the first zone (-1.7 ≤ log ε T0.2324≤ -0.9), we have found T 966 T with R 2 =0.978, whilst for the second one (-0.9≤ log ε T ≤ -190AKTET Vol. IV, Nr 2, 2011


