Monthly Notifiable Disease Surveillance Report - Public Health ...
Monthly Notifiable Disease Surveillance Report - Public Health ...
Monthly Notifiable Disease Surveillance Report - Public Health ...

Create successful ePaper yourself
Turn your PDF publications into a flip-book with our unique Google optimized e-Paper software.
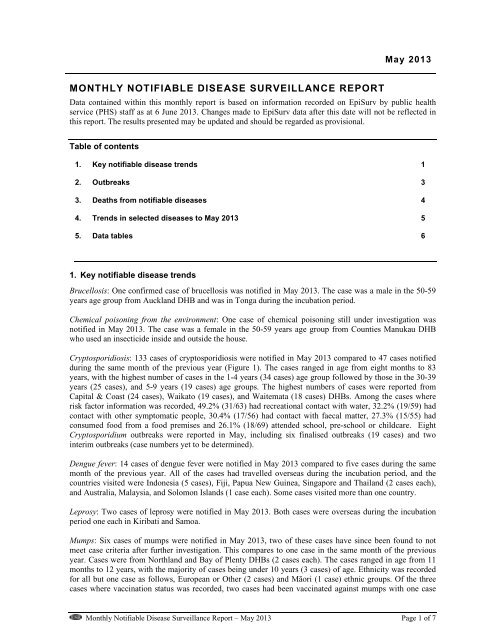
May 2013MONTHLY NOTIFIABLE DISEASE SURVEILLANCE REPORTData contained within this monthly report is based on information recorded on EpiSurv by public healthservice (PHS) staff as at 6 June 2013. Changes made to EpiSurv data after this date will not be reflected inthis report. The results presented may be updated and should be regarded as provisional.Table of contents1. Key notifiable disease trends 12. Outbreaks 33. Deaths from notifiable diseases 44. Trends in selected diseases to May 2013 55. Data tables 61. Key notifiable disease trendsBrucellosis: One confirmed case of brucellosis was notified in May 2013. The case was a male in the 50-59years age group from Auckland DHB and was in Tonga during the incubation period.Chemical poisoning from the environment: One case of chemical poisoning still under investigation wasnotified in May 2013. The case was a female in the 50-59 years age group from Counties Manukau DHBwho used an insecticide inside and outside the house.Cryptosporidiosis: 133 cases of cryptosporidiosis were notified in May 2013 compared to 47 cases notifiedduring the same month of the previous year (Figure 1). The cases ranged in age from eight months to 83years, with the highest number of cases in the 1-4 years (34 cases) age group followed by those in the 30-39years (25 cases), and 5-9 years (19 cases) age groups. The highest numbers of cases were reported fromCapital & Coast (24 cases), Waikato (19 cases), and Waitemata (18 cases) DHBs. Among the cases whererisk factor information was recorded, 49.2% (31/63) had recreational contact with water, 32.2% (19/59) hadcontact with other symptomatic people, 30.4% (17/56) had contact with faecal matter, 27.3% (15/55) hadconsumed food from a food premises and 26.1% (18/69) attended school, pre-school or childcare. EightCryptosporidium outbreaks were reported in May, including six finalised outbreaks (19 cases) and twointerim outbreaks (case numbers yet to be determined).Dengue fever: 14 cases of dengue fever were notified in May 2013 compared to five cases during the samemonth of the previous year. All of the cases had travelled overseas during the incubation period, and thecountries visited were Indonesia (5 cases), Fiji, Papua New Guinea, Singapore and Thailand (2 cases each),and Australia, Malaysia, and Solomon Islands (1 case each). Some cases visited more than one country.Leprosy: Two cases of leprosy were notified in May 2013. Both cases were overseas during the incubationperiod one each in Kiribati and Samoa.Mumps: Six cases of mumps were notified in May 2013, two of these cases have since been found to notmeet case criteria after further investigation. This compares to one case in the same month of the previousyear. Cases were from Northland and Bay of Plenty DHBs (2 cases each). The cases ranged in age from 11months to 12 years, with the majority of cases being under 10 years (3 cases) of age. Ethnicity was recordedfor all but one case as follows, European or Other (2 cases) and Māori (1 case) ethnic groups. Of the threecases where vaccination status was recorded, two cases had been vaccinated against mumps with one case<strong>Monthly</strong> <strong>Notifiable</strong> <strong>Disease</strong> <strong>Surveillance</strong> <strong>Report</strong> – May 2013 Page 1 of 7
having only received one dose of vaccine, and the other reported having been vaccinated, but no doseinformation was available.Pertussis: 304 cases of pertussis were notified in May 2013 compared to 545 cases in the same month of theprevious year (Figure 2). Seven cases were hospitalised and no deaths were reported. There were 63 (20.7%)cases laboratory-confirmed by isolation of Bordetella pertussis from the nasopharynx. A further 43 (14.1%)cases were laboratory-confirmed by PCR. The highest numbers of cases were reported from NelsonMarlborough (52 cases), Canterbury (50 cases), and Auckland (26 cases) DHBs. The cases ranged in agefrom 25 days to 88 years, with 21.8% under 5 years old (including 18 cases aged less than 1 year). Thehighest number of cases occurred in the 1-4 years age group (48 cases) followed by the 40-49 years (42cases), and 30-39 years (39 cases) age groups. The vaccination status was recorded for 166 (54.6%) of cases.Of these, 65 were reported as not vaccinated, 16 received one dose of vaccine, three received two doses ofvaccine, 58 received three or more doses (including 10 who had received all five doses), and 24 werereported as being vaccinated but no dose information was available. Of the cases where the relevantinformation was recorded 37.3% (81/217) attended school, pre-school or childcare, and 35.6% (42/118) hadcontact with a laboratory-confirmed pertussis case. Two B. pertussis outbreaks were reported in May,including one finalised outbreak (3 cases) and one interim outbreak (case numbers yet to be determined).Rickettsial disease: One case of rickettsial disease, scrub typhus, was notified in May 2013. The case was amale in the 60-69 years age group from Waikato DHB and was in Indonesia during the incubation period.Taeniasis: One confirmed case of taeniasis was notified in May 2013. The case was a female in the 20-29years age group from Counties Manukau DHB and was in Afghanistan during the incubation period.VTEC/STEC infection: 35 cases of VTEC/STEC infection were notified in May 2013, two of these caseshave since been found to not meet case criteria after further investigation. Seven cases were notified in thesame month of the previous year. The highest numbers of cases was reported from Waitemata (9 cases),Auckland (5 cases), and Canterbury (4 cases) DHBs. The highest number of cases occurred in the 1-4 yearsage group (14 cases). Fifteen cases were hospitalised of which two had haemolytic uraemic syndrome. 32cases were confirmed by the Enteric Reference Laboratory as being infected with VTEC/STEC. Theserotype was identified as O157:H7 (29 cases) and non-O157 (3 cases). Among the cases for whom riskfactor was recorded, 72.7% (8/11) had contact with animals, 50.0% (5/10) had consumed water from a nonhabitualsupply, and 41.7% (5/12) had attended school, pre-school or childcare. Two finalised E. coliO157:H7 outbreaks were reported in May involving eight cases.<strong>Monthly</strong> <strong>Notifiable</strong> <strong>Disease</strong> <strong>Surveillance</strong> <strong>Report</strong> – May 2013 Page 2 of 7
2. OutbreaksTable 1. Summary of finalised outbreaks created in EpiSurv during May 2013Organism/Toxin/IllnessDHB(s) where exposure occurredNumber ofoutbreaksTotalnumber ofcasesBordetella pertussis Southern 1 3Campylobacter Auckland, Waikato 2 4Cryptosporidium Waikato 6 19Escherichia coli O157:H7 1 Waitemata 2 8GastroenteritisNorthland, Auckland, Taranaki,5 18MidCentralGiardia 2 Waikato 3 12MycobacteriumCapital & Coast 1 3tuberculosisNorovirusTaranaki, MidCentral3 101Capital & CoastSalmonella MidCentral 1 2Total 24 1701 Includes two E. coli O157:H7 outbreaks reported to PHSs prior to May 2013, both reported in April.2Includes one Giardia outbreak with an overseas transmission (Fiji).Table 2. Summary of interim outbreaks created in EpiSurv during May 2013Organism/Toxin/IllnessDHB(s) where exposure occurredNumber ofoutbreaksTotalnumber ofcasesBordetella pertussis 1 Capital & Coast 1 -Campylobacter 1 Waikato, Capital & Coast 2 -Cryptosporidium 2 Auckland, Waikato 2 4Gastroenteritis 2Waitemata, Auckland,Waikato, MidCentral, Southern,Capital & Coast19 103Giardia Auckland 1 3Norovirus Northland 1 22Shigella Waitemata 1 3Total 27 1351 Interim outbreak where total number of cases had not been completed.2 Includes interim outbreak(s) where total number of cases had not been completed.<strong>Monthly</strong> <strong>Notifiable</strong> <strong>Disease</strong> <strong>Surveillance</strong> <strong>Report</strong> – May 2013 Page 3 of 7
5. Data tablesNational <strong>Notifiable</strong> <strong>Disease</strong> <strong>Surveillance</strong> Data May 2013Current Year - 2013¹ Previous Year - 2012Cumulative Current 12Cumulative Current 12<strong>Disease</strong>May 2013Casestotal since 1JanuaryMonthRate²May 2012Casestotal since 1JanuaryMonthRate²Campylobacteriosis 400 2357 139.5 521 3192 170.4Cryptosporidiosis 133 647 29.8 47 203 15.3Dengue fever 14 46 2.1 5 28 1.2Gastroenteritis³ 39 215 15.7 46 255 13.4Giardiasis 162 755 37.1 160 824 41.3Haemophilus influenzae type b 3 5 0.2 0 1 0.2Hepatitis A 3 37 1.3 4 61 1.7Hepatitis B⁴ 6 13 0.9 3 11 0.9Hepatitis C⁴ 3 17 0.7 2 18 0.8Invasive pneumococcal disease 34 141 11.2 30 132 12.3Lead absorption 14 111 5.4 46 143 5.7Legionellosis 11 63 3.3 4 66 3.6Leptospirosis 15 37 2.2 13 46 2.0Listeriosis 1 11 0.6 2 8 0.5Malaria 2 21 1.1 1 10 1.0Measles 1 2 0.1 1 67 13.8Meningococcal disease 4 25 1.9 4 24 2.5Mumps 6 19 0.8 1 9 0.9Paratyphoid fever 5 15 0.6 0 11 0.4Pertussis 304 1935 129.3 545 2105 86.7Rheumatic fever 17 72 3.9 23 76 4.1Rickettsial disease 1 4 0.2 0 0 0.1Rubella 2 2 0.1 0 3 0.4Salmonellosis 90 548 25.2 88 511 22.6Shigellosis 9 71 3.0 15 70 3.0Tuberculosis disease 31 122 6.8 23 117 6.4Typhoid fever 0 32 1.3 3 17 0.9VTEC/STEC infection 35 140 4.9 7 70 2.8Yersiniosis 33 177 11.0 44 202 12.1¹ These data are provisional² Rate is based on the cumulative total for the current year (12 months up to and including May 2013) or the previous³ Cases of gastroenteritis from a common source or foodborne intoxication⁴ Only acute cases of this disease are currently notifiableOther notifiable infectious disease reported in May: Brucellosis (1), Chemical poisoning from the environment (1),Leprosy (2), Taeniasis (1), Toxic shellfish poisoning (1)<strong>Monthly</strong> <strong>Notifiable</strong> <strong>Disease</strong> <strong>Surveillance</strong> <strong>Report</strong> – May 2013 Page 6 of 7
<strong>Notifiable</strong> <strong>Disease</strong> <strong>Surveillance</strong> Data by District <strong>Health</strong> Board May 2013Cases¹ and current rate² for May 2013 by District <strong>Health</strong> Board³<strong>Disease</strong>CampylobacteriosisCryptosporidiosisDengue feverGastroenteritisGiardiasisHaemophilusinfluenzae type bHepatitis AHepatitis BHepatitis CInvasivepneumococcaldisease Lead absorptionLegionellosisLeptospirosisListeriosisMalariaMeaslesMeningococcaldiseaseMumpsParatyphoid feverPertussisQ feverRheumatic feverRickettsial diseaseRubellaSalmonellosisShigellosisTuberculosis diseaseTyphoid feverVTEC/STEC infectionYersiniosisWaitemataNorthlandAucklandSouthernSouth CanterburyCanterburyWest CoastNelson MarlboroughWairarapaCapital and CoastHutt ValleyMidCentralWhanganuiHawke's BayTaranakiTairawhitiBay of PlentyLakesWaikatoCounties ManukauCases 8 51 28 30 44 14 13 1 7 16 10 29 11 32 7 6 2 50 13 28Rate 132.0 126.4 106.2 88.0 176.6 152.3 107.0 100.4 192.2 166.7 142.4 125.3 103.3 126.2 130.4 155.7 203.6 175.8 284.7 187.8Cases 2 18 9 9 19 8 2 0 1 10 2 3 6 24 0 2 0 12 1 5Rate 19.6 12.6 10.2 9.6 75.6 59.2 20.3 6.4 35.4 99.7 19.2 23.0 30.5 49.1 41.8 16.3 27.4 21.6 84.9 31.5Cases 2 1 3 3 0 0 3 0 0 0 0 0 1 0 0 0 0 0 1 0Rate 2.5 2.9 5.2 2.2 0.3 1.9 2.4 2.1 0.0 0.6 0.0 1.8 1.4 3.4 2.5 0.7 0.0 1.6 1.8 1.0Cases 0 5 5 2 2 0 0 0 0 0 0 15 6 4 0 0 0 0 0 0Rate 0.6 13.9 21.4 9.1 11.9 14.5 14.6 6.4 8.2 1.3 20.8 72.1 40.2 29.6 17.2 10.0 21.3 8.2 3.5 5.2Cases 1 15 21 18 19 5 10 0 7 5 1 3 5 18 1 11 2 10 0 10Rate 29.1 29.6 46.1 30.7 44.0 57.2 40.1 10.7 29.9 38.6 22.4 13.0 36.0 50.1 36.9 41.9 39.5 39.0 28.3 40.9Cases 0 0 2 0 0 0 0 0 0 0 0 0 0 0 0 0 0 0 0 1Rate 0.0 0.4 0.4 0.2 0.3 0.0 0.0 0.0 0.0 0.0 0.0 0.0 0.0 0.0 0.0 0.0 0.0 0.0 1.8 0.3Cases 0 0 2 0 0 0 0 0 0 0 0 0 0 0 0 0 0 1 0 0Rate 0.6 1.6 0.9 2.0 0.5 0.0 0.9 2.1 0.9 0.6 1.6 0.6 0.7 1.7 0.0 0.0 0.0 3.8 0.0 0.0Cases 0 0 2 1 0 0 2 0 0 0 0 0 1 0 0 0 0 0 0 0Rate 0.6 0.9 1.3 1.2 1.1 1.0 1.4 2.1 0.9 0.0 0.0 0.0 0.7 0.7 0.0 0.7 0.0 1.6 0.0 0.3Cases 0 0 0 0 0 0 0 0 0 0 0 0 0 1 0 1 0 1 0 0Rate 0.0 0.0 0.2 0.0 0.3 0.0 0.0 0.0 3.6 0.0 0.0 0.0 0.7 1.0 0.0 1.4 0.0 1.8 3.5 2.3Cases 2 5 1 1 3 4 3 1 0 2 2 0 1 2 0 0 1 2 2 2Rate 15.2 7.8 8.7 14.0 10.0 18.4 19.3 8.5 12.7 15.4 11.2 6.5 6.9 10.4 27.1 13.5 6.1 8.6 15.9 12.3Cases 0 3 4 1 0 0 1 0 1 1 1 0 0 0 0 0 1 0 0 1Rate 3.2 7.4 8.7 6.9 3.5 1.9 4.2 6.4 5.4 1.3 8.0 10.0 4.2 4.4 19.7 2.1 12.2 2.4 5.3 4.2Cases 1 2 0 3 0 0 0 0 0 0 0 2 0 0 0 0 1 2 0 0Rate 3.2 2.2 3.0 3.5 2.4 0.0 2.4 0.0 0.0 1.3 1.6 3.0 1.4 1.3 0.0 2.1 6.1 10.4 5.3 2.9Cases 0 0 0 1 1 0 2 0 2 1 1 0 0 0 0 3 1 2 0 1Rate 3.2 0.0 0.2 0.4 6.2 0.0 4.2 4.3 5.4 9.0 8.0 4.7 0.0 0.0 7.4 2.8 6.1 1.2 5.3 1.9Cases 0 1 0 0 0 0 0 0 0 0 0 0 0 0 0 0 0 0 0 0Rate 0.0 0.7 0.4 0.8 0.5 0.0 3.3 0.0 0.9 1.3 0.0 0.6 0.0 0.3 2.5 0.7 0.0 0.2 1.8 0.0Cases 1 0 0 0 0 0 0 0 0 0 0 0 0 0 0 0 0 1 0 0Rate 1.3 1.4 2.4 1.6 0.0 1.0 0.0 0.0 0.0 1.9 0.0 3.0 0.7 0.7 0.0 0.7 0.0 1.4 0.0 0.0Cases 0 0 0 0 0 0 0 0 0 0 0 0 0 0 0 0 0 1 0 0Rate 0.0 0.0 0.0 0.2 0.0 0.0 0.0 0.0 0.0 0.0 0.0 0.0 0.0 0.3 0.0 0.0 0.0 0.2 0.0 0.0Cases 0 0 0 0 1 1 1 0 0 0 0 1 0 0 0 0 0 0 0 0Rate 2.5 1.1 1.7 1.0 1.4 5.8 2.4 4.3 3.6 0.6 1.6 3.0 2.1 2.7 0.0 1.4 0.0 2.6 5.3 1.6Cases 2 0 0 1 0 0 2 0 0 0 0 0 0 0 0 0 0 0 0 1Rate 3.2 0.5 0.6 0.4 0.5 1.0 1.4 2.1 0.0 0.0 0.0 0.0 1.4 0.3 2.5 3.6 0.0 0.8 1.8 0.6Cases 0 2 3 0 0 0 0 0 0 0 0 0 0 0 0 0 0 0 0 0Rate 0.0 0.9 1.7 0.4 0.0 0.0 0.5 0.0 0.0 0.0 0.0 0.0 0.7 0.3 0.0 0.7 0.0 0.4 1.8 1.3Cases 23 10 26 12 17 5 11 4 7 6 3 17 12 19 1 52 5 50 2 22Rate 84.0 58.5 67.9 62.4 133.9 76.6 113.6 239.3 154.1 52.8 284.9 151.3 208.6 180.3 300.3 353.2 285.7 212.6 127.3 111.4Cases 0 0 0 0 0 0 0 0 0 0 0 0 0 0 0 0 0 0 0 0Rate 0.0 0.0 0.0 0.0 0.0 0.0 0.0 0.0 0.0 0.0 0.0 0.0 0.0 0.0 0.0 0.0 0.0 0.0 0.0 0.0Cases 0 2 2 3 3 1 1 0 0 1 0 0 0 2 0 0 0 2 0 0Rate 7.6 2.7 3.7 14.0 4.9 6.8 2.4 10.7 0.9 3.9 1.6 0.6 1.4 2.7 0.0 0.0 0.0 0.4 0.0 0.3Cases 0 0 0 0 1 0 0 0 0 0 0 0 0 0 0 0 0 0 0 0Rate 1.9 0.2 0.0 0.0 0.8 0.0 0.0 0.0 0.0 0.0 0.0 0.0 0.0 0.3 0.0 0.0 0.0 0.0 0.0 0.0Cases 0 0 0 0 0 0 0 0 0 0 0 0 0 0 0 0 0 2 0 0Rate 0.0 0.0 0.0 0.0 0.0 0.0 0.0 0.0 0.0 0.0 0.0 0.0 0.0 0.0 0.0 0.0 0.0 0.6 0.0 0.0Cases 11 12 6 6 5 1 1 2 2 4 1 4 0 5 1 4 0 13 1 11Rate 25.3 20.6 27.9 15.0 21.1 22.3 20.3 23.5 29.9 22.5 17.6 21.3 17.3 16.5 22.2 44.1 36.5 26.4 46.0 56.5Cases 0 1 4 4 0 0 0 0 0 0 0 0 0 0 0 0 0 0 0 0Rate 2.5 4.5 6.1 8.1 1.1 1.0 0.5 0.0 2.7 0.6 0.0 1.2 2.8 2.0 0.0 0.7 0.0 1.0 0.0 2.3Cases 0 0 5 11 1 2 2 0 0 0 0 1 1 4 0 0 0 3 0 1Rate 2.5 6.9 12.8 9.8 5.9 6.8 5.2 4.3 5.4 9.7 1.6 4.1 9.7 9.1 0.0 7.1 0.0 4.0 1.8 2.6Cases 0 0 0 0 0 0 0 0 0 0 0 0 0 0 0 0 0 0 0 0Rate 0.0 1.3 3.0 4.5 0.3 1.0 0.5 0.0 0.0 0.0 0.0 0.0 2.1 0.7 0.0 0.0 0.0 1.0 0.0 0.6Cases 2 9 5 3 4 0 1 1 2 0 0 0 0 0 0 0 2 5 1 0Rate 8.2 5.1 3.9 4.5 13.5 2.9 4.2 2.1 10.0 0.6 0.0 1.8 0.7 1.0 2.5 2.8 12.2 5.6 5.3 4.2Cases 0 2 2 3 5 2 4 1 1 0 0 0 0 2 0 0 0 10 1 0Rate 6.3 11.4 11.7 9.4 9.7 17.5 15.1 6.4 15.4 9.0 1.6 3.0 13.2 18.5 9.8 2.1 3.0 14.4 24.8 6.5¹ These data are provisional² Current rate is based on the cumulative total for the 12 months up to and including May 2013 expressed as cases per 100 000³ Further data are available from the local Medical Officer of <strong>Health</strong><strong>Monthly</strong> <strong>Notifiable</strong> <strong>Disease</strong> <strong>Surveillance</strong> <strong>Report</strong> – May 2013 Page 7 of 7