
Create successful ePaper yourself
Turn your PDF publications into a flip-book with our unique Google optimized e-Paper software.
a n n u a l r e p o r t 2 0 0 8
ttS <strong>Group</strong><br />
This is <strong>TTS</strong> 4<br />
Financial highlights 6<br />
Key events <strong>2008</strong> 8<br />
report from the ceo<br />
We are level-headed optimists 9<br />
buSineSS areaS<br />
Dry Cargo Handling Division 12<br />
Marine Cranes Division 16<br />
Port and Material Handling Division 20<br />
Deck Machinery Division 24<br />
Drilling Equipment Division 28<br />
Services Division 32<br />
Breakthrough for <strong>TTS</strong> in the market<br />
for trailer-mounted land rigs 36<br />
corporate covernance<br />
information<br />
Shareholder information 38<br />
Corporate governance 41<br />
Senior management 44<br />
Board of Directors 46<br />
d i r e c t o r ’ S r e p o r t a n d<br />
accountS<br />
Director’s report 48<br />
ProFiT anD loSS aCCounT anD noTES<br />
- <strong>Group</strong> 55<br />
- <strong>TTS</strong> Marine aSa 91<br />
auditors report 109<br />
responsibility statement 110<br />
ttS<br />
Companies in the <strong>TTS</strong> <strong>Group</strong> 112<br />
organisation 114<br />
2<br />
ttS – continuously<br />
generating profits<br />
by being the preferred<br />
global supplier for<br />
handling equipment<br />
to the maritime and<br />
oil & gas industry.
Port and<br />
material<br />
handling<br />
equipment<br />
• Yard equipment<br />
• Heavy load<br />
equipment<br />
• Port equipment<br />
Maritime<br />
• roro-equipment<br />
• Hatch covers<br />
• Side doors<br />
• Cruise- and Yacht<br />
equipment<br />
• Hose handling cranes<br />
• Cargo cranes<br />
• Davits<br />
• anchor- and<br />
mooringwinches<br />
oil & Gas<br />
• offshore cranes<br />
• offshore handling<br />
equipment<br />
• Drilling equipment<br />
• Drilling packages<br />
• HMi & Controls<br />
Services<br />
• Emergency<br />
assistance<br />
• Service agreements<br />
• Modernisation<br />
and conversions<br />
• Simulation<br />
and training<br />
• inspections<br />
and surveys
4-8 t t S G r o u p<br />
9-11 rEPorT FroM THE CEo<br />
12-37 B u S i n E S S a r E a S<br />
38-47 CorPoraTE GoVErnanCE<br />
48-110 DirECTor’S rEPorT anD aCCounTS<br />
this is ttS<br />
eStabliShmentS<br />
1966 <strong>TTS</strong> is established.<br />
1995 <strong>TTS</strong> is listed on oslo Stock Exchange.<br />
2001 <strong>TTS</strong> establishes joint venture in Shanghai, China.<br />
2002 <strong>TTS</strong> establishes rep. office in Pusan, Korea.<br />
2005 <strong>TTS</strong> establishes <strong>TTS</strong> Bohai in Dalian, China.<br />
2005 <strong>TTS</strong> establishes <strong>TTS</strong> Marine inc. in Florida, uSa.<br />
2006 <strong>TTS</strong> establishes <strong>TTS</strong> Marine s.r.l. in Genova, italy.<br />
2006 <strong>TTS</strong> establishes <strong>TTS</strong> Vietnam, Haiphong, Vietnam.<br />
2007 <strong>TTS</strong> establishes Sense Drill Fab aS, norway.<br />
2007 <strong>TTS</strong> establishes Sense EDM Pte ltd, Singapore.<br />
2007 <strong>TTS</strong> establishes <strong>TTS</strong> Keyon Marine, Zhangjiagang, China.<br />
<strong>2008</strong> <strong>TTS</strong> establishes Jiangnan <strong>TTS</strong>, nantong, China.<br />
<strong>2008</strong> <strong>TTS</strong> establishes <strong>TTS</strong> Marine Equipment (Dalian), China.<br />
acquiSitionS/SaleS<br />
1996 <strong>TTS</strong> acquires Mongstad Engineering aS, Bergen, norway.<br />
1997 <strong>TTS</strong> acquires norlift aS, Bergen, norway.<br />
2000 <strong>TTS</strong> acquires aktro aS, Molde, norway.<br />
2001 <strong>TTS</strong> sells <strong>TTS</strong> Construction aS, Bergen, norway.<br />
2001 <strong>TTS</strong> acquires Hamworthy KSE aB, Dry Cargo Division.<br />
2001 <strong>TTS</strong> acquires Hydralift Marine, and sell <strong>TTS</strong>-aktro aS.<br />
2004 <strong>TTS</strong> acquires 100 % of joint venture in Shanghai, China.<br />
2004 <strong>TTS</strong> acquires lMG, lübeck, Germany.<br />
2004 <strong>TTS</strong> acquires liftec oy, Tampere, Finland.<br />
2005 <strong>TTS</strong> acquires navCiv Engineering aB, Gothenburg, Sweden.<br />
2005 <strong>TTS</strong> acquires Kocks GmbH, Bremen, Germany.<br />
2007 <strong>TTS</strong> acquires iCD Projects aS, Ålesund, norway.<br />
2007 <strong>TTS</strong> acquires 100 % of joint venture in Pusan, Korea.<br />
2007 <strong>TTS</strong> acquires Sense EDM aS, Kristiansand, norway.<br />
2007 <strong>TTS</strong> acquires 100% Sense MuD aS, Kristiansand, norway.<br />
<strong>2008</strong> <strong>TTS</strong> acquires Wellquip Holding aS, Kristiansand, norway.<br />
4<br />
annual<br />
turnover<br />
noK mill<br />
4500<br />
4000<br />
3500<br />
3000<br />
2500<br />
2000<br />
1500<br />
1000<br />
500<br />
0<br />
96 97 98 99 00 01 02 03 04 05 06 07 08<br />
port and material handling equipment<br />
marine equipment<br />
offshore and drilling equipment
companies in the ttS <strong>Group</strong> Sales and service network<br />
<strong>TTS</strong> is an international group which develops and supplies handling equipment<br />
to the marine and oil & gas industry. The operations are divided into six divisions:<br />
marine cranes, dry cargo handling, port & material handling, deck machinery,<br />
drilling equipment and Services. <strong>TTS</strong> is the second largest supplier in the world within<br />
its market segments. <strong>TTS</strong> has a workforce of 1550 employees with main emphasis on<br />
engineering expertise. The group has subsidiaries in norway, Sweden, Finland, Germany,<br />
China, uSa, italy, Czech republic, Korea, Canada, Vietnam and Singapore. <strong>TTS</strong> Marine aSa<br />
is headquartered in Bergen, norway and listed on the oslo Stock Exchange.<br />
5
4-8 t t S G r o u p<br />
9-11 rEPorT FroM THE CEo<br />
12-37 B u S i n E S S a r E a S<br />
38-47 CorPoraTE GoVErnanCE<br />
48-110 DirECTor’S rEPorT anD aCCounTS<br />
financial highlights<br />
ProFiT anD loSS aCCounT (noK 1 000)<br />
6<br />
<strong>2008</strong> 2007 2006 2005 2004<br />
operating income 4 196 482 2 459 964 1 604 030 1 149 831 786 174<br />
operating profit/loss before depresiation (EBiTDa) 145 459 167 767 107 061 73 966 44 822<br />
operating profit/loss (EBiT) 114 616 134 636 98 145 66 402 38 769<br />
Pre-tax profit/loss 36 819 97 568 84 492 56 297 31 251<br />
net profit/loss 36 392 79 041 60 481 40 239 21 630<br />
BalanCE SHEET (noK 1 000)<br />
Fixed assets 1 508 802 1 215 577 460 996 429 629 335 374<br />
Current assets 2 871 919 1 886 377 1 172 135 753 157 465 029<br />
Total assets 4 380 721 3 101 954 1 633 130 1 182 786 800 402<br />
Equity 989 056 933 596 598 061 394 932 260 909<br />
long-term liabilities 532 297 588 878 196 635 77 279 76 294<br />
Current liabilities 2 825 808 1 579 479 838 434 710 574 463 199<br />
Total equity and liabilities 4 380 721 3 101 954 1 633 130 1 182 786 800 402<br />
Key ratioS<br />
FinanCial STrEnGTH<br />
Equity to assets ratio (as a percentage of total capital) 22.6 % 30.1 % 36.6 % 33.4 % 32.6 %<br />
ProFiTaBiliTY<br />
EBiTDa margin 3.5 % 6.8 % 6.7 % 6.4 % 5.7 %<br />
EBiT margin 2.7 % 5.5 % 6.1 % 5.8 % 4.9 %<br />
Profit margin (pre-tax) 0.9 % 4.0 % 5.3 % 4.9 % 4.0 %<br />
Profit margin (after tax) 0.9 % 3.2 % 3.8 % 3.5 % 2.8 %<br />
raTE oF rETurn<br />
return on equity 3.7 % 10.5 % 14.1 % 14.3 % 12.0 %<br />
return on total capital 2.6 % 4.3 % 5.5 % 5.0 % 4.5 %<br />
SHarES<br />
Equity per share 38.18 36.20 26.59 21.39 17.36<br />
Earnings per share (noK) 1.41 3.40 2.92 2.19 1.44<br />
number of shares, end of year 25 908 25 738 22 493 20 116 16 315<br />
average number of shares 25 840 23 250 20 832 18 460 15 029<br />
nominal value, end of year 0.50 0.50 0.50 0.50 0.50<br />
defininitions<br />
Earnings per share: Profit after taxes divided on total number of shares at the end of the fiscal year.<br />
Profitability, equity: Profit before tax as a percentage of equity.<br />
Profitability, total capital: operating profit as a percentage of total capital.
turnover<br />
noK Million<br />
786<br />
1150<br />
2004 2005 2006 2007 <strong>2008</strong><br />
ebitda<br />
noK Million<br />
45<br />
1041<br />
74<br />
1863<br />
1604<br />
107<br />
order bacKloG<br />
noK Million<br />
2273<br />
2460<br />
168<br />
6949<br />
4196<br />
145<br />
2004 2005 2006 2007 <strong>2008</strong><br />
8159<br />
2004 2005 2006 2007 <strong>2008</strong><br />
turnover<br />
<strong>2008</strong><br />
2007<br />
MC<br />
26 %<br />
MC<br />
28 %<br />
DE<br />
25 %<br />
DCH<br />
29 %<br />
order bacKloG<br />
<strong>2008</strong><br />
2007<br />
MC<br />
29 %<br />
MC<br />
35 %<br />
DE<br />
10 %<br />
DE<br />
17 %<br />
DM<br />
12 %<br />
DCH<br />
36 %<br />
DCH<br />
39 %<br />
DE<br />
14 %<br />
DCH<br />
38 %<br />
DM<br />
11 %<br />
PMH<br />
8 %<br />
PMH<br />
14 %<br />
DM<br />
11 %<br />
DM<br />
10 %<br />
PMH<br />
4 %<br />
PMH<br />
3 %<br />
dry carGo handlinG<br />
mnoK <strong>2008</strong> 2007<br />
Turnover 1 239.6 874.4<br />
EBiTDa 85.0 95.7<br />
order backlog per 31.12. 3 151 2 619<br />
marine craneS<br />
mnoK <strong>2008</strong> 2007<br />
Turnover 11 070 687.7<br />
EBiTDa 41.8 34.9<br />
order backlog per 31.12. 2 370 2 433<br />
decK machinery<br />
mnoK <strong>2008</strong> 2007<br />
Turnover 447.8 299.5<br />
EBiTDa 22.3 5.3<br />
order backlog per 31.12. 902 681<br />
port and material handlinG<br />
mnoK <strong>2008</strong> 2007<br />
Turnover 350.5 332.8<br />
EBiTDa 32.5 25.6<br />
order backlog per 31.12. 326 216<br />
drillinG equipment<br />
mnoK <strong>2008</strong> 2007<br />
Turnover 1 057.4 265.1<br />
EBiTDa -24.6 13.9<br />
order backlog per 31.12. 1 410 999<br />
7
4-8 ttS <strong>Group</strong><br />
9-11 rEPorT FroM THE CEo<br />
12-37 B u S i n E S S a r E a S<br />
38-47 CorPoraTE GoVErnanCE<br />
48-110 DirECTor’S rEPorT anD aCCounTS<br />
Key events <strong>2008</strong><br />
For the fifth year running, <strong>TTS</strong> reported a<br />
significant growth in turnover. The result,<br />
however, is somewhat reduced, owing to writedown<br />
of an individual contract. Turnover<br />
increased by 70 percent to noK 4 196 million,<br />
and earnings before depreciation (EBiTDa)<br />
reduced by 13 percent to noK 145.5 million.<br />
at the start of the new year, <strong>TTS</strong> has an order<br />
backlog of noK 8 159 million, a 17 percent<br />
increase since 2007. This includes the downward<br />
revision of approximately noK 600 million<br />
related to confirmed and anticipated cancellations<br />
owing to the international economic<br />
crisis.<br />
in connection with cancellations of agreed orders,<br />
<strong>TTS</strong> has realised losses on currency hedging<br />
contracts and made provisions for potential<br />
losses of about noK 30 million. The financial<br />
crisis, however, has lead to shorter delivery times<br />
and more favourable prices on the raw materials<br />
and components used by <strong>TTS</strong>.<br />
Effective as of 2009, <strong>TTS</strong> has organised service<br />
and after sales in a separate division. The aim<br />
of the Services division is to strengthen <strong>TTS</strong>’<br />
position as consultant and provider of after<br />
sales services following the delivery of new<br />
equipment.<br />
8<br />
<strong>TTS</strong> implemented acquisition of the norwegian<br />
drilling technology company, Wellquip, thereby<br />
strengthening the Drillig Equipment division’s<br />
expertise and capacity to deliver in relation<br />
to complete drilling packages. Wellquip has,<br />
among other things, developed and patented<br />
an automatic multifunctional roughneck.<br />
<strong>TTS</strong> experienced a breakthrough in the market<br />
for trailer-mounted land rigs and will deliver<br />
twelve 150-ton rigs to a total value of about<br />
noK 700 million. The rigs are equipped with<br />
patented technology and advanced solutions<br />
for control and automation.<br />
<strong>TTS</strong> reported strong growth in the market for<br />
deck machinery. in Dalian, China, <strong>TTS</strong> established<br />
a wholly-owned subsidiary company associated<br />
with the Deck Machinery division, producing<br />
winches and other deck machinery.<br />
in order to maintain solid equity in the presently<br />
unstable markets, <strong>TTS</strong> has proposed to the annual<br />
general meeting that there be no dividend paid<br />
out for <strong>2008</strong>.
johanneS neteland<br />
PrESiDEnT & CEo<br />
<strong>TTS</strong> MarinE aSa<br />
We are level-headed optimists!<br />
<strong>2008</strong> was an extraordinary year. our clearest<br />
memory is that of the americans electing their first<br />
afro-american president. Barack obama presented<br />
his call for change with a drive and credibility that<br />
captured the hearts of his voters and generated<br />
hope for a better future – not just in the uSa, but<br />
all over the world.<br />
The support for obama increased in line with<br />
the development of the financial crisis and ensuing<br />
upheaval of international economy. Subsequently,<br />
following his inauguration, he had his hands full by<br />
reducing expectations of how swift and efficient<br />
his administration would be able to implement<br />
measures to transform the downturn of the economy<br />
from recession to recovery. The financial<br />
crisis in itself will be overcome in the not too<br />
distant future, but the crisis in the real economy<br />
is serious and severe, striking with brutal force.<br />
Mainly, it will affect countries and people with the<br />
least ability to tolerate such changes to and setbacks<br />
in their subsistence level, but we will nevertheless<br />
all be affected, including us here in <strong>TTS</strong>.<br />
When, during the autumn last year, the financial<br />
crisis was turning into crisis with a capital C,<br />
we in <strong>TTS</strong> warned about letting pessimism get the<br />
upper hand. Based on our third-quarter results,<br />
which for the umpteenth time showed a record<br />
high level in turnover, results and order backlog,<br />
we took the liberty of drawing attention to the<br />
vast gap between the positive development in our<br />
operations and the general picture being painted<br />
by the media of the future development of the<br />
economy. as for <strong>TTS</strong>, we expressed our faith in<br />
continued progress. at the same time, we pointed<br />
out that norwegian authorities and norges Bank<br />
(norwegian State Bank) should do more to curb the<br />
fluctuations of the exchange rate of the norwegian<br />
Krone. our basis was concern for the strong<br />
fluctuations in the value of the norwegian Krone in<br />
relation to the major currencies over a short period<br />
of time. a number of contracts involving exportrelated<br />
operations have exchange rates fixed a<br />
given levels. if these contracts are cancelled, and<br />
the forward currency position accordingly has to<br />
be terminated, norwegian companies such as <strong>TTS</strong><br />
risk considerable losses if cancellation takes place<br />
at a point in time when the currency position is<br />
unfavourable.<br />
Both our faith in continued progress and our<br />
worry regarding currency proved to be valid. The<br />
underlying operation of <strong>TTS</strong> continued along the<br />
same positive path in the fourth quarter, but for<br />
the parts of our group that settle their business<br />
in norwegian Krone, the fluctuations of exchange<br />
resulted a reduction of the result. all the same,<br />
<strong>2008</strong> as a whole proved to be yet another acceptable<br />
year for <strong>TTS</strong>.<br />
Could we, and should we – in hindsight – have<br />
predicted the rather extraordinary currency challenges<br />
that cost <strong>TTS</strong> in all noK 29 million on the<br />
bottom line? let others be the judge of that.<br />
Paradoxically, norwegian politicians and authorities<br />
9<br />
president & ceo
4-8 T T S G r o u P<br />
9-11 report from the ceo<br />
12-37 B u S i n E S S a r E a S<br />
38-47 CorPoraTE GoVErnanCE<br />
48-110 DirECTor’S rEPorT anD aCCounTS<br />
maintained that the weakening of the norwegian<br />
Krone was generally positive for export-related<br />
operations, which in a sense is correct. However,<br />
what they failed to include in the assessment, was<br />
the adverse effect of such strong fluctuations from<br />
one week to another, or even from day to day. For<br />
a small country with an economy primarily aimed<br />
at trade and commercial interfacing with other<br />
nations, having a national currency carries a considerable<br />
risk. it is stability and predictability of external<br />
con ditions that gives industry exposed to compe-<br />
tition the best foundation to navigate through<br />
turbulent times. The conclusion of this autumn’s<br />
unpleasant surprises is obvious; norwegian inclusion<br />
in the European common currency must come<br />
about – sooner rather than later.<br />
an annual report is primarily history of what<br />
has been. Most of us, however, reflect mainly on<br />
what the future will bring. in <strong>TTS</strong>, we are levelheaded<br />
optimists. We have, for a number of years,<br />
informed the stock market of our assessment of<br />
the potential for turnover and results within our<br />
areas of operation, and we have usually been<br />
pretty accurate. <strong>TTS</strong> is and will remain predictable<br />
– even with the constraints that follow from doing<br />
business in 12 countries on three continents.<br />
<strong>TTS</strong> presently constitutes six divisions with a<br />
total of 1 550 employees with vast technical expertise<br />
in the areas of maritime equipment, terminal<br />
and material handling and equipment to the oil and<br />
gas industry. We started 2009 with an order back-<br />
10<br />
– norwegian inclusion<br />
in the european<br />
common currency must<br />
come about – sooner<br />
rather than later<br />
log of noK 8.2 billion. Even taking into account the<br />
substantial number of cancellations toward the end of<br />
last year, we have never had order books as full as<br />
at the start of the new year. a stringent appraisal<br />
of the quality of volume of orders indicates further<br />
cancellations in the region of noK 500 million. The<br />
overall picture indicates that we will have our hands<br />
full endeavouring to complete all deliveries within the<br />
agreed delivery times. This, in turn, means a continued<br />
growth of turnover for the <strong>TTS</strong> <strong>Group</strong>. With regard to<br />
results, there is a higher degree of uncertainty than<br />
in <strong>2008</strong>, but we note that changes to the market<br />
situation have already given us lower prices on steel<br />
and components purchased from suppliers, in addition<br />
to lower transportation cost. <strong>TTS</strong> is making money<br />
and expects this to continue.<br />
But, and this is an important but; we can with a<br />
high degree of certainty state that the order backlog<br />
will not remain at the same high level at the end<br />
of 2009 as at the start of the year. For parts of our
operations, activities will presumably be somewhat<br />
lower in 2010. Some of this is due to natural<br />
fluctuations in our markets, but the primary cause<br />
of a lowered demand is the financial crisis affecting<br />
all countries. it is hard to predict how long the crisis<br />
will last, and what consequences it will have for our<br />
customers and partners, but we do believe that it<br />
will take some time for things to improve.<br />
We will meet these challenges by strengthening<br />
efforts related to services, product development<br />
and sales. <strong>TTS</strong> holds a solid position in many of our<br />
niche markets, but in turbulent times competition<br />
is strong. However, not all of our competitors have<br />
equally favourable premises and financial solidity<br />
to handle the consequences of the economic crisis.<br />
in other words, there is potential for maintaining<br />
a high level of activity through strengthening our<br />
presence in the market, and securing a larger<br />
share of the total volume of contracts. Furthermore,<br />
we will actively work at developing interdivision<br />
co operation in order to increase sales to each<br />
customer, as well as strengthening our position as<br />
consultant and provider of after sales services<br />
following the delivery of new equipment. Moreover,<br />
we will aggressively utilise the opportunities<br />
that this situation offers to acquire new companies<br />
that naturally fall under, and can strengthen, the<br />
<strong>TTS</strong> <strong>Group</strong>.<br />
While seizing the market opportunities, we will<br />
be following a more prudent strategy, which implies<br />
that the organisation’s operations and manning will<br />
be reduced to a lower level for as long as the<br />
markets remain weak. Through its organisation into<br />
26 operative units, <strong>TTS</strong> has the advantage that our<br />
managers are closer to their respective markets,<br />
and are quick to pick up on the need for adjustments.<br />
in other words, it is not someone “far away”<br />
or “high up there” who makes the decision on<br />
how to handle potential surplus capacity in the<br />
organisation.<br />
For <strong>TTS</strong>, it is not a question of either or, but<br />
rather of both doing this and that. We will, in other<br />
words, both strengthen our market efforts and<br />
adapt our organisation to the demand for our<br />
products and services. readjustment is tough, but<br />
our managers and employees are used to such processes.<br />
Handled correctly, both our organisation<br />
and the individual affected will come through<br />
strengthened.<br />
as supplier in competitive markets, we are used<br />
to being met with high expectations by our<br />
customers, and we experience pleasure and satisfaction<br />
at being able to fulfil these expectations.<br />
Expectations to <strong>TTS</strong> as a company should be high,<br />
and we will work hard to meet our performance<br />
measures. We are still level-headed optimists!<br />
Johannes D. neteland<br />
PrESiDEnT & CEo<br />
11
4-8 T T S G r o u P<br />
9-11 rEPorT FroM THE CEo<br />
12-37 b u S i n e S S a r e a S<br />
38-47 CorPoraTE GoVErnanCE<br />
48-110 DirECTor’S rEPorT anD aCCounTS<br />
The Dry Cargo Handling division maintained<br />
a high level of activity throughout <strong>2008</strong>.<br />
The division is well prepared to meet the<br />
challenges resulting from the<br />
financial crisis and economic<br />
downturn in the global markets.<br />
Stellan bernSro<br />
DirECTor DrY CarGo<br />
HanDlinG DiViSion<br />
in recent years, tts has built up a substantial order backlog<br />
in the market for marine cargo access equipment. For the<br />
Dry cargo Handling division, the market at the beginning of<br />
last year was exceptional, however, during the course of the year,<br />
the order intake declined as a result of the impact of the financial<br />
crisis on international shipping. all in all, the division’s turnover<br />
increased by 42 percent to nOK 1 240 million. Operating profit<br />
dropped from nOK 95 million to nOK 85 million, mainly due to<br />
weak growth in the segment for hatch covers.<br />
the Dry cargo Handling division is the largest division of tts,<br />
and in <strong>2008</strong> the division once again consolidated its position as a<br />
leading global supplier. – In <strong>2008</strong>, we received a number of orders<br />
for cargo access equipment for numerous series of car carriers, one<br />
of tts’s areas of expertise. Our systems for cargo handling were<br />
the preferred choice to the world’s largest roro vessels, which are<br />
currently under construction at a Japanese shipyard, says stellan<br />
Bernsro. He has been Head of the Dry cargo Handling division<br />
since 2006. Bernsro is trained as a naval officer and holds a master<br />
in industrial engineering and management, and he is also Managing<br />
Director of tts ships equipment aB.<br />
the Dry cargo Handling division has a broad range of products<br />
within cargo access equipment, such as hatch covers, roro equipment,<br />
side-loading systems and purpose-built equipment for cruise<br />
ships and mega yachts. the division has furthermore contributed<br />
to tts’ successful targeting deliveries of equipment to offshore<br />
vessels. In the market for service and after sales support, the Dry<br />
cargo Handling division has seen a considerable level of activity,<br />
strongly contributing to the development and upgrading of expertise<br />
in the tts <strong>Group</strong>’s joint targeting of this segment.<br />
the Dry cargo Handling division is managed from Gothenburg,<br />
sweden, and has operations in Germany, norway, Italy, Usa and<br />
Vietnam. tts’ acquisition of the Dry cargo Handling division in<br />
2002 opened the door to the market in china, through the division’s<br />
50 percent ownership interest in the joint venture company tts<br />
Hua Hai ships equipment, shanghai, in partnership with the stateowned<br />
shipbuilding group china state shipbuilding corporation<br />
(cssc). through its Dry cargo Handling division, tts is furthermore<br />
owner of 50 percent of the manufacturing company tts<br />
12<br />
dry cargo handling
– the organisation has solid<br />
expertise and a documented<br />
capacity for implementing<br />
high-quality projects.<br />
13
turnover<br />
noK Million<br />
484<br />
649<br />
728<br />
874<br />
1240<br />
order bacKloG<br />
noK Million<br />
1035<br />
1063<br />
2619<br />
3100<br />
2004 2005 2006 2007 <strong>2008</strong> 2004 2005 2006 2007 <strong>2008</strong><br />
Keyon Marine equipment, which manufactures steel structures for<br />
hatch covers, ro-ro equipment and cranes. In addition to this, the<br />
joint venture company tts Hua Hai ships equipment participates<br />
with an ownership interest of 40 percent in the company Jiangnan<br />
tts Marine equipment, which focuses on manufacturing of hatch<br />
covers.<br />
the Dry cargo Handling division has 197 employees, whereof<br />
90 are based in sweden, 58 in Germany, 24 in norway, eight in<br />
Italy, 11 in Usa and six in Vietnam. the joint venture companies in<br />
china employ around 300 people. In <strong>2008</strong>, the management of this<br />
global operation was strengthened by the appointment of a new<br />
managing director to tts ships equipment GmbH in Germany, as<br />
well as the addition of an associate with extensive experience from<br />
operations in sweden to the sales and representative office in<br />
Vietnam. effective as of this year, the Dry cargo Handling Division<br />
transferred its activities within service and after sales support in<br />
Usa and Vietnam to the tts <strong>Group</strong>’s newly established service<br />
division.<br />
operations<br />
the Dry cargo Handling division is a provider of services within<br />
design and engineering of equipment for marine cargo access systems.<br />
through ownership interests in operations manufacturing steel<br />
structures in china, tts has gained control of major parts of the<br />
value chain through to completed deliveries of, among others,<br />
hatch covers and roro equipment.<br />
In recent years, an increasingly larger part of the Dry cargo<br />
Handling deliveries constitute equipment for purpose-built vessels<br />
for transportation of cars within, as well as between, continents.<br />
tts is among the world’s leading suppliers in this niche of the roro<br />
market.<br />
Furthermore, the Dry cargo Handling division has made extensive<br />
deliveries of hatch covers to dry bulk carriers, container vessels<br />
and dry cargo carriers. another speciality is side-loading systems for<br />
various ship types, and in addition to this, specialised equipment for<br />
cruise ships and yachts is an important business segment.<br />
each of the six wholly owned companies that form the Dry cargo<br />
Handling division has built up special competence within the various<br />
parts of their product repertoire, from which products and systems<br />
are delivered to all major shipbuilding nations worldwide. Product<br />
806<br />
ebitda<br />
noK Million<br />
48<br />
61<br />
90<br />
95<br />
85<br />
2004 2005 2006 2007 <strong>2008</strong><br />
development is organised internally and in teams formed crosscompany.<br />
the joint venture company, tts Hua Hai ships equipment<br />
co. Ltd. in shanghai, china, designs and manufactures hatch covers<br />
and some roro equipment for chinese shipyards.<br />
ship design today is to a large extent concerned with giving ships<br />
a design that minimises their impact on the environment and reduces<br />
fuel consumption. this, in turn, places new demands on the equipment<br />
for cargo handling equipment. tts is in close cooperation with<br />
shipping companies and shipyards regarding development of products<br />
and solutions that will be environmentally sound both short term and<br />
in the long run.<br />
market outlook<br />
the global shipbuilding market is cyclical, and subsequent to a<br />
number of exceptional years, tts is prepared to face a decline in<br />
the contracting of new vessels. the Dry cargo Handling division<br />
has for this reason strengthened its focus on service and after sales<br />
support, in order to compensate the anticipated reduction in the<br />
demand for new cargo handling equipment.<br />
the financial crisis and unforeseen rapid decline in the world<br />
economy has affected tts’ order intake. However, at the start of<br />
2009, the Dry cargo Handling had a sound order backlog of nOK<br />
3 100 million, including half of the joint venture company in<br />
china’s order backlog. risk and security of the order backlog is<br />
subject to continuous evaluation. the order intake is expected to<br />
be somewhat lower in 2009 than last year, affecting turnover and<br />
operations in the coming years.<br />
Strategy<br />
the Dry cargo Handling division’s organisation has solid expertise<br />
and a documented capacity for implementing high-quality projects.<br />
On this basis, the division will continue to have a strong focus on<br />
marketing and sales in all established markets. In light of the current<br />
market situation, the division will concentrate on adapting its organisation<br />
to a lower level of activity in respect of deliveries to new<br />
vessels, and further strengthen its operations in other markets segments,<br />
as well as in new market segments. Development of new<br />
products will be given high priority, and the division will place<br />
more emphasis on consulting and assisting shipping companies in<br />
the process of upgrading and modernising their tonnage.<br />
15<br />
dry cargo handling
4-8 T T S G r o u P<br />
9-11 rEPorT FroM THE CEo<br />
12-37 b u S i n e S S a r e a S<br />
38-47 CorPoraTE GoVErnanCE<br />
48-110 DirECTor’S rEPorT anD aCCounTS<br />
in <strong>2008</strong>, the Marine Cranes Division experienced<br />
the full effect of its restructuring to the production<br />
of cranes for the offshore market. Yet again,<br />
the division reported a strong<br />
growth in turnover; however,<br />
currency losses weakened an<br />
otherwise solid result.<br />
ivar K. hanSon<br />
DirECTor MarinE CranES<br />
DiViSion<br />
tHe MarIne cranes DIVIsIOn develops and supplies<br />
cranes to ships as well as to vessels and installations offshore.<br />
the division resumed its operation in the offshore market<br />
in 2007, and during that year the division’s turnover increased by<br />
a whole 56 percent. In <strong>2008</strong>, the growth was even higher, at 61<br />
percent, yielding a turnover of nOK 1 107 million. the offshore<br />
sector made up 63 percent of this turnover. the division’s operating<br />
profit before depreciation was nOK 42 million, compared to nOK<br />
35 million in 2007. the operating profit includes actual currency<br />
losses of nOK 10 million.<br />
the Marine cranes Division is managed from Bergen, norway,<br />
and has branch offices in Kristiansand and Ålesund, as well as<br />
Os outside Bergen. Furthermore, the division has operations in<br />
Lübeck in Germany, in shanghai and Dalian in china, and a sales<br />
and representative office in Busan, south Korea. In shanghai, tts<br />
has a wholly-owned subsidiary company, while in Dalian tts participates<br />
in a joint venture company together with the state-owned<br />
shipbuilding group Dalian shipbuilding Industry corporation<br />
(DsIc).<br />
the Marine cranes division has 576 employees, whereof 231 are<br />
based in norway, 271 in china (including the JV company), 67 in<br />
Germany and seven in south Korea. Ivar K. Hanson has headed the<br />
Marine cranes division since 2004. He holds a Masters in Business<br />
and economics, as well as a degree in mechanical engineering, and<br />
has worked for tts for a total of 14 years.<br />
– We have succeeded in our strategy of building up a global<br />
corporation for the development and production of a wide range<br />
of cranes to various types of vessels and handling equipment to the<br />
offshore industry. In <strong>2008</strong>, underlying operations yielded margins<br />
as expected, but with regard to results we were unfortunately hit<br />
by cancellations of orders with a loss on exchange. this as a result<br />
of abnormal fluctuations in the currencies that we deal in, says Ivar<br />
K. Hanson, head of the Marine cranes division.<br />
In <strong>2008</strong>, the Marine cranes division experienced a breakthrough<br />
in the market for anchor handling winches through orders for five<br />
16<br />
marine cranes
marine cranes<br />
sets with a first delivery in June of this year. In <strong>2008</strong>, the division<br />
furthermore secured its first two orders for 250-ton offshore<br />
cranes with active heave compensation for operation of heavy loads<br />
at great depths, of which the first is to be delivered in 2010.<br />
operations<br />
the operation of the Marine cranes division is based around several<br />
centres of expertise on product segments and solutions. For our<br />
customers within the maritime sector, product development and<br />
sale of cylinder cranes are primarily based in Bergen, while product<br />
development and sale of wire luffing cranes take place in Lübeck,<br />
Germany. after-sales support, service and industrial products to<br />
the shipping companies are handled by our office in Kristiansand.<br />
the development and sale of purpose-built cranes for offshore<br />
vessels and installations is managed from Bergen. the branch office<br />
in Ålesund, with the support of related centres of technologies in<br />
Os and Kristiansand, develops control systems and software for<br />
winches for deep-sea cranes. tts is known for delivering advanced<br />
systems that ensure efficient cargo handling, even in very rough<br />
seas, active heave compensation.<br />
the wholly-owned company in shanghai carries out engineering,<br />
project management, assembly and follow-up of deliveries to<br />
ship-owners and shipyards in asian markets outside of china.<br />
Moreover, the company functions as purchasing office for the<br />
division. the joint venture company, tts Bohai Machinery, in<br />
Dalian, carries out engineering, project management, assembly and<br />
testing of standard marine cranes to shipyards in china. Both in<br />
18<br />
turnover<br />
noK Million<br />
236<br />
309<br />
440<br />
688<br />
1107<br />
2004 2005 2006 2007 <strong>2008</strong> 2004 2005 2006 2007 <strong>2008</strong><br />
– 2009 will see<br />
a turnover at the same<br />
level as in <strong>2008</strong>.<br />
order bacKloG<br />
noK Million<br />
159<br />
390<br />
600<br />
2433<br />
2371<br />
ebitda<br />
noK Million<br />
-11,2<br />
2004 2005 2006 2007 <strong>2008</strong><br />
shanghai and Dalian, cranes and related equipment are assembled<br />
for customers in the offshore sector of asia, while offshore customers<br />
in europe get their deliveries from Bergen.<br />
market outlook<br />
at the start of 2009, the total order backlog of the Marine cranes<br />
division had reached nOK 2 370 million, including the joint venture<br />
company in china, which is at the same level as last year. as a result<br />
of the financial crisis, the order backlog was reduced in the fourth<br />
quarter, owing to received and anticipated cancellations. a large<br />
number of these cancellations were made by customers who had<br />
placed orders for cranes to bulk carriers. so far, the offshore market<br />
has been less sensitive to the crisis, however, one must reckon on<br />
postponements in the building schedules that in turn will affect<br />
tts. the unexpected downturn in international economy has,<br />
since October last year, resulted in a weakened demand for<br />
products from the Marine cranes division in both the maritime<br />
sector and the offshore sector.<br />
the sizeable order backlog, however, means that the division in<br />
2009 will see a turnover at the same level as in <strong>2008</strong>. With regard<br />
to results, this year looks to be another good year, provided that<br />
financial matters do not have unexpected negative effects. the<br />
order intake in 2009 is expected to be substantially lower than in<br />
<strong>2008</strong>, affecting turnover and operation in the coming years.<br />
as a consequence of changes to the market situation, the Marine<br />
cranes division will intensify its sales efforts to consolidate tts’<br />
position as leading supplier of cranes to ships and offshore vessels,<br />
as well as other handling equipment to the offshore industry. the<br />
challenges that follow in the wake of the financial crisis demand<br />
particular attention to follow-up of customers and commitments.<br />
cooperation with other divisions in tts will be strengthened, both<br />
with regard to service and after sales support to existing customers,<br />
and in relation to development and marketing of new concepts.<br />
Product development focusing on technology and equipment to the<br />
deepwater industry will continue to remain a priority.<br />
0,2<br />
13<br />
35<br />
42
4-8 T T S G r o u P<br />
9-11 rEPorT FroM THE CEo<br />
12-37 b u S i n e S S a r e a S<br />
38-47 CorPoraTE GoVErnanCE<br />
48-110 DirECTor’S rEPorT anD aCCounTS<br />
The Port and Material Handling division<br />
continued its success in <strong>2008</strong>. The division<br />
is well equipped to handle challenges<br />
following the international<br />
economic crisis.<br />
lennart SvenSSon<br />
D i r E C T o r P o r T a n D M a T E r i a l<br />
HanDlinG DiViSion<br />
in recent years, tts has built up terminal and material<br />
handling equipment to become a considerable business domain<br />
of the tts <strong>Group</strong>. the Port and Material Handling division near<br />
doubled its turnover in 2007, and last year the turnover increased<br />
by a further 5 percent to nOK 350 million. Operating profit went<br />
up by 20 percent to nOK 32.5 million.<br />
the Port and Material Handling division’s primary products are<br />
shipyard equipment and equipment for handling containers in<br />
port. the division is managed from Gothenburg, sweden, and has<br />
operations in Finland and norway. In all, the division has 63<br />
employees, whereof 15 are based in sweden, 19 in norway and<br />
29 in Finland. On 1 October last year, Lennart svensson took over<br />
as head of the Port and Material Handling division after Göran<br />
Johansson. svensson is a naval architect and Mechanical engineer,<br />
and has been Managing Director of tts Port equipment aB in<br />
Gothenburg since its establishment in 2005. Prior to this, he was<br />
Marketing Director of tts ships equipment aB, and svensson<br />
has for most of his working career been involved in marine cargo<br />
handling.<br />
tts Handling systems again reported a high level of activity<br />
related to production lines for shipyards in china and India. as a<br />
consequence of the development in the shipbuilding market, the<br />
division has had fewer deliveries to shipyards focusing on newbuildings,<br />
while the demand from shipyards concentrating on<br />
repairs and maintenance has increased.<br />
In <strong>2008</strong>, tts Port equipment delivered an advanced passenger<br />
gangway for the new terminal at risavika in stavanger. Furthermore,<br />
the division successfully completed a major project for<br />
transfer and reconstruction of linkspan, a special ramp linking<br />
vessel and quay, from ports in the netherlands and england to<br />
Belfast in northern Ireland. this year, tts will deliver linkspan to<br />
rotterdam in the netherlands, Harwich in england and ystad<br />
in sweden. the division will moreover focus strongly on sale of<br />
consultancy services to ports that are working on projects to increase<br />
the efficiency of cargo handling.<br />
20<br />
port and material handling
– We expect a strong growth<br />
in the market for systems<br />
that contribute to a more<br />
efficient cargo handling.<br />
21
turnover<br />
noK Million<br />
66<br />
141<br />
179<br />
333<br />
350<br />
2004 2005 2006 2007 <strong>2008</strong> 2004 2005 2006 2007 <strong>2008</strong><br />
again, <strong>2008</strong> saw an increase in the demand for systems for transport<br />
with loading cassettes. tts made deliveries of such systems<br />
to steelworks and operations within the paper industry, as well as<br />
to ports in spain and north africa. tts Liftec has developed an<br />
advanced trailer for this purpose, called Durion, with a remotely<br />
controlled drive unit.<br />
operations<br />
the Port and Material Handling division’s activities are built<br />
around three centres of excellence, in which each unit has its area<br />
of expertise. In addition to linkspans, passenger gangways and<br />
automatic mooring systems, the product portfolio for cargo<br />
handling has expanded to include a unique system for the handling<br />
of containers through the use of cassettes. the cassettes were<br />
originally developed to handle special transport requirements for<br />
industries such as the steel and paper. Moreover, the division’s<br />
recent innovation in developing c-aGVs (cassette- automated<br />
Guided Vehicles) for the transport of containers in ports and<br />
terminals world-wide. a manual version of the cassette system,<br />
using translifters, was put into operation for the first time in a<br />
container terminal in 2007 at aPMt Virginia, Usa. In collaboration<br />
with a swiss supplier, tts has further developed the automated<br />
– the port and material<br />
handling division is less<br />
sensitive to general<br />
fluctuations in the level<br />
of economic activity.<br />
order bacKloG<br />
noK Million<br />
76<br />
72<br />
148<br />
216<br />
326<br />
ebitda<br />
noK Million<br />
4<br />
7<br />
13<br />
26<br />
32<br />
2004 2005 2006 2007 <strong>2008</strong><br />
version of the cassette system to include a wireless energy transfer<br />
technology that adopts inductive energy.<br />
– We are hopeful that 2009 will see the first contract for<br />
delivery of such an automated system, which in that case would be<br />
operational in four years, says Lennart svensson, head of the Port<br />
and Material Handling division.<br />
– In general, we expect a strong growth in the market for<br />
systems that contribute to a more efficient cargo handling in ports,<br />
and tts has products and solutions that fulfil this requirement. By<br />
increasing the loading and discharging capacity in existing ports,<br />
one may to an extent avoid costly development of new port<br />
facilities, svensson emphasises.<br />
market outlook<br />
at the start of 2009, the Port and Material Handling division had an<br />
order backlog of nOK 325 million, compared to nOK 216 million<br />
the year before. We still except to see a growth in turnover this<br />
year. the anticipated decline in the sale of production lines and<br />
special equipment for heavy load handling to shipyards will likely<br />
be compensated by a higher volume of sales of port equipment.<br />
– Our deliveries are to a greater extent than in other parts of<br />
the tts <strong>Group</strong> aimed at public market players, and as such, the<br />
Port and Material Handling division is less sensitive to general<br />
fluctuations in the level of economic activity, svensson maintains.<br />
Strategy<br />
the primary strategy of the Port and Material Handling Division is<br />
to further develop good cooperation between the units in sweden,<br />
Finland and norway with regard to product development and<br />
sales. Furthermore, the division will focus on the development of<br />
solutions that are efficient, as well as environmentally friendly.<br />
the division will continue its long-term marketing efforts to<br />
customers in europe, north-africa, Usa and asia, and is working<br />
alongside other divisions to introduce tts to geographically new<br />
markets, such as Brazil.<br />
23<br />
port & material handling
4-8 T T S G r o u P<br />
9-11 rEPorT FroM THE CEo<br />
12-37 b u S i n e S S a r e a S<br />
38-47 CorPoraTE GoVErnanCE<br />
48-110 DirECTor’S rEPorT anD aCCounTS<br />
in <strong>2008</strong>, the Deck Machinery division reported<br />
significant progress with regard to both<br />
turnover and results. The division has established<br />
extensive operations in China<br />
and is currently targeting, and<br />
has gained a foothold, in the<br />
offshore market.<br />
edGar bethmann<br />
DirECTor DECK MaCHinErY<br />
DiViSion<br />
SInce tHe acqUIsItIOn of Kocks in Germany in the<br />
autumn of 2005, tts has made deck machinery one of its<br />
target areas. the first two years saw the implementation of<br />
a major organisational restructuring, which strengthened the<br />
division’s sales force and ability to deliver high-quality products. In<br />
<strong>2008</strong>, this restructuring yielded results by increasing turnover with<br />
50 percent to nOK 448 million, while operating profit increased<br />
from nOK 5.3 million to nOK 22.3 million.<br />
the Deck Machinery division is managed from Bremen in<br />
Germany, and the division has operations in Ostrava in the czech<br />
republic, Busan in south Korea and Dalian in china. the operations<br />
in china started out as a division for deck machinery in the joint<br />
venture company tts Bohai Machinery in 2007, which in <strong>2008</strong> was<br />
reorganised to become a fully owned subsidiary company. In total,<br />
the Deck Machinery division has 162 employees, whereof 44 are<br />
based in Germany, 33 in the czech republic, 44 in south Korea<br />
and 41 in china. edgar Bethmann is Head of the Deck Machinery<br />
division and Managing Director of tts Kocks GmbH. He holds<br />
an engineering degree in machine construction, and was Managing<br />
Director of tts ships equipment GmbH prior to being appointed<br />
Head of the Deck Machinery division in 2005.<br />
operations<br />
the Deck Machinery division supplies various types of winches and<br />
other deck machinery to the maritime and offshore industries. In<br />
principle, these winches are utilised by all types of vessels, and tts<br />
holds a particularly favourable position in the market for supplying<br />
winches to LnG ships. the level of activity within service and after<br />
sales support is increasing.<br />
the division has developed and extended their product range<br />
by smaller electric and frequency controlled electric winches. 36<br />
electric winches have been delivered in <strong>2008</strong> and the number of<br />
deliveries for 2010 will increase up to 560. tts further offers a<br />
broad range of larger, and technically advanced hydraulic winches,<br />
with either centralised hydraulic supply or self contained.<br />
24<br />
deck machinery<br />
We will focus<br />
on recruitment<br />
of highly qualified<br />
personnel, who<br />
will serve our<br />
customers world<br />
wide.
deck machinery<br />
– Our focus is on the development of new products, in order<br />
to deliver efficient and environmentally sound winches to our<br />
traditional markets, as well as to various niche markets. We have an<br />
extensive level of expertise within the division, and a functional<br />
cooperation between our operations in europe and asia, says<br />
edgar Bethmann, Head of the Deck Machinery division.<br />
collaborating with the Marine cranes division, the Deck<br />
Machinery division has taken part in tts’ general targeting of<br />
the offshore market, achieving favourable results. the division has<br />
developed tailor-made winches for use at great ocean depths, and<br />
participates in the development of packages of technologically<br />
advanced handling equipment for use on special-purpose vessels<br />
dedicated to deep-sea operations.<br />
the Deck Machinery division focuses strongly on service and<br />
after sales support. – now that tts has established its own service<br />
division, we will continue to strengthen our efforts in this area. We<br />
will focus on recruitment of highly qualified personnel, who will<br />
serve our customers world wide. Proximity to the market and<br />
market participants is essential in order to develop and strengthen<br />
our position as provider of service and after sales support,<br />
Bethmann points out.<br />
market outlook<br />
at the start of 2009, the Deck Machinery division had an order<br />
backlog of about nOK 900 million, compared to nOK 681 million<br />
at the start of <strong>2008</strong>. the order intake in <strong>2008</strong> was particularly<br />
26<br />
turnover<br />
noK Million<br />
50<br />
257<br />
300<br />
448<br />
order bacKloG<br />
noK Million<br />
2005 2006 2007 <strong>2008</strong> 2005 2006 2007 <strong>2008</strong><br />
– ttS delivered its first winches<br />
to offshore vessels in <strong>2008</strong>.<br />
366<br />
462<br />
681<br />
902<br />
ebitda<br />
noK Million<br />
2,5*<br />
-5,4<br />
2005 2006 2007 <strong>2008</strong><br />
*) Q4. only<br />
high at shipyards in south Korea, while the growth in the chinese<br />
market has stagnated.<br />
the healthy order backlog results in the division increasing<br />
its turnover yet again in 2009. Long term, the development in<br />
turnover will depend on the duration of the global economic crisis.<br />
the division is dealing aggressively with the situation; through<br />
targeting of new geographical markets, such as Brazil, as well as<br />
niche markets that have not yet been introduced to this part of<br />
tts’ products and expertise.<br />
Strategy<br />
the organisation of the Deck Machinery division is well equipped to<br />
continue the work of developing new products and increasing sales<br />
efforts in established, as well as new markets. In china, tts will set<br />
up a separate sales operation for winches and other deck machinery.<br />
as a result of the anticipated lower level of activity in the maritime<br />
segment, the division’s targeting of the offshore sector will be intensified.<br />
acquisition of companies that possess interesting and relevant<br />
technology is continuously being evaluated, in addition to expanding<br />
existing operations and strengthening collaboration with other<br />
divisions of the tts <strong>Group</strong>. service and after sales support will be<br />
further prioritised in order to enhance customer satisfaction and<br />
strengthen the total earnings of the Deck Machinery Division.<br />
5<br />
22
4-8 T T S G r o u P<br />
9-11 rEPorT FroM THE CEo<br />
12-37 b u S i n e S S a r e a S<br />
38-47 CorPoraTE GoVErnanCE<br />
48-110 DirECTor’S rEPorT anD aCCounTS<br />
The Drilling Equipment division reported a high<br />
level of activity in <strong>2008</strong>. The market for <strong>TTS</strong>’<br />
land rigs has shown strong growth, while<br />
the development in the market<br />
for drilling equipment to the<br />
offshore sector remains uncertain<br />
as a result of the financial crisis.<br />
tom fedoG<br />
DirECTor DrillinG EquiPMEnT<br />
DiViSion<br />
ttHrOUGH tHe acqUIsItIOn of sense eDM as in 2007,<br />
tts made drilling equipment a separate business domain.<br />
the company, now tts sense as, has its head office in<br />
Kristiansand, norway and a branch office in stavanger, norway, as<br />
well as a subsidiary company in edmonton, canada. sense was<br />
founded in 1999. In 2005, sense merged with stavanger-based<br />
eDM, a company with a history dating back to 1996.<br />
tts sense as has a wholly-owned sales and service company in<br />
singapore, and a sales office in Houston, Usa. tts sense Mud as<br />
is a wholly-owned subsidiary company in Kristiansand, focusing on<br />
the handling of drilling mud. tts sense eDM has a 49.9 percent<br />
ownership interest in tts sense DrillFab as, a company located in<br />
Kristiansand that carries out testing and assembly of equipment. In<br />
2007, tts acquired the drilling technology company Wellquip<br />
Holding as in Kristiansand, to be merged with tts sense in 2009.<br />
Wellquip has developed and patented an automatic multifunctional<br />
roughneck, which constitutes part of two complete drilling<br />
packages currently under development by tts sense.<br />
In <strong>2008</strong>, the Drilling equipment division reported a turnover of<br />
nOK 1 057 million, compared to nOK 265 million in the period<br />
of tts’ ownership in 2007. the turnover in <strong>2008</strong> is divided into<br />
50 percent from the offshore sector and 50 percent from the<br />
onshore sector. Operating profit before depreciation was nOK<br />
-24.6 million, compared to nOK 13.9 million under tts’ ownership<br />
in 2007. the basis of the weak result was write downs in relation to<br />
the ability contract. Without the write downs, the result would<br />
have been nOK 38.6 million.<br />
all in all, the Drilling equipment division has 318 employees,<br />
whereof 221 are based in Kristiansand, 21 in stavanger, 55 in<br />
edmonton, ten in singapore and one in Houston. the Drilling<br />
equipment division is headed by tom Fedog, who is Managing<br />
Director of tts sense. He has worked for the company since its<br />
establishment in 1999. Fedog has an advanced degree in business<br />
administration and extensive experience from aker Kværner<br />
Maritime Hydraulics.<br />
– In <strong>2008</strong>, the division worked on equipment packages for two<br />
advanced jack-up rigs, to be delivered in the course of 2009 and<br />
28<br />
drilling equipment
turnover<br />
noK Million<br />
265<br />
1057<br />
order bacKloG<br />
noK Million<br />
2010. Furthermore, the division delivered two land rigs and two<br />
work-over rigs out of a total delivery of nine larger land rigs<br />
and two maintenance rigs to ability Drilling asa. Our targeting<br />
of the market for deliveries of smaller land rigs has had very<br />
promising results, and we have signed contracts with schlumberger<br />
and Weatherford, says tom Fedog.<br />
operations<br />
the Drilling equipment division develops and supplies advanced<br />
drilling equipment and drilling systems to the international oil<br />
and gas industry, including complete drilling packages, drilling<br />
equipment and pipe handling equipment. Furthermore, the division<br />
supplies patented technology for rigs that combine drilling,<br />
maintenance and service. these rigs are used for drilling operations<br />
both on land and at sea.<br />
tts sense will deliver a complete drilling equipment package<br />
to Jurong shipyard in singapore. the equipment constitutes part<br />
of the shipyard’s delivery of a highly advanced jack-up rig for<br />
production in the north sea. the rig has been contracted by the<br />
company Petroprod, owned by Larsen Oil & Gas in Bergen.<br />
Furthermore, the division will deliver yet another drilling package<br />
to Keppel FeLs in singapore, to be used on a mobile jack-up rig<br />
currently under construction in Kristiansand for skeie Drilling<br />
and Production (sKDP).<br />
as previously mentioned, tts sense has signed a contract for the<br />
delivery of altogether nine large land-based drilling rigs to ability<br />
Drilling. the first two rigs were delivered in <strong>2008</strong>, and two rigs will<br />
be delivered in 2009. Delivery of the remaining five drilling rigs<br />
– our targeting of the<br />
market for deliveries of<br />
smaller land rigs has had<br />
very promising results.<br />
999<br />
1410<br />
2007 <strong>2008</strong> 2007 <strong>2008</strong><br />
ebitda<br />
noK Million<br />
13,9<br />
-24,6<br />
2007 <strong>2008</strong><br />
has been postponed by agreement until 2011. as the marked has<br />
shown a downward trend, uncertainty has increased with regard to<br />
whether the final 5 rigs will be delivered or not. consequently, we<br />
have chosen to terminate the total contract evaluation of the 9 rigs,<br />
and charged capitalised costs for 2007 as an expence in the <strong>2008</strong><br />
accounts. this has entailed a reduction of the Drilling equipment<br />
division’s eBItDa result of nOK 63.1 million. In <strong>2008</strong>, tts<br />
has an accounted loss on the ability deliveries caused by delays<br />
related to development and testing.<br />
In the space of <strong>2008</strong> and 2009, tts sense will deliver 11<br />
Ultrasingle drilling rigs to schlumberger and Weatherford.<br />
In addition to the major contracts, the Drilling equipment<br />
division has signed a number of contracts for single deliveries of<br />
equipment to various operators within the oil and gas industry.<br />
market outlook<br />
at the start of 2009, the Drilling equipment division had an order<br />
backlog of nOK 1 410 million, compared to nOK 999 million<br />
twelve months previously.<br />
since last autumn, the market for drilling equipment has been at<br />
stand-still owing to financial unrest and the crisis in international<br />
economy. this situation is expected to continue in 2009. In 2009,<br />
tts sense will focus on areas where investment into the oil and gas<br />
industry will continue despite the challenges in the financial market<br />
and relative low energy prices.<br />
Strategy<br />
tts sense will continue its strategy concerning deliveries of<br />
high end/high performance drilling equipment to the onshore and<br />
offshore industry. acquisitions will be evaluated in order to develop<br />
and strengthen tts’ position in the global market for rigs and<br />
drilling equipment. through its global presence, the division is<br />
well-positioned to challenge major competitors in the market.<br />
Development of cooperation with relevant centres in the group will<br />
be intensified in order to utilise synergistic effects, including lowcost<br />
production.<br />
In 2009, the division will focus on implementation of signed<br />
contracts and targeting of niche markets that have been less affected<br />
by the global economic crisis.<br />
31<br />
drilling equipment
4-8 T T S G r o u P<br />
9-11 rEPorT FroM THE CEo<br />
12-37 b u S i n e S S a r e a S<br />
38-47 CorPoraTE GoVErnanCE<br />
48-110 DirECTor’S rEPorT anD aCCounTS<br />
as of 1 January 2009, <strong>TTS</strong> has organised service<br />
and after sales support in a separate division.<br />
our aim is to strengthen the group’s position as<br />
consultant and provider of services following<br />
the delivery of new equipment,<br />
and this will be ascertained<br />
through global presence.<br />
marGrethe hauGe<br />
DirECTor<br />
SErViCES DiViSion<br />
h<br />
IstOrIcaLLy, tts has based its portfolio of service and<br />
follow-up of customers on a network of agents. the<br />
reasoning behind this was that the “critical mass” has been<br />
too small to build up a separate organisation for operation in the<br />
market for afters sales support. a service organisation primarily<br />
based on independent agents, however, has the weakness that the<br />
agents’ competence regarding various parts of tts’ product range<br />
has been limited. Furthermore, the agents have to little degree<br />
re-allocated turnover to tts, and accordingly, the company has<br />
given away an important share of the market to others. customers<br />
often choose other suppliers to handle more complete and efficient<br />
services related to maintenance of their equipment and other<br />
follow-up, and tts would now like to seize a larger share of this<br />
segment.<br />
the market for sale of new equipment within tts’ business<br />
areas has, in the recent years, been characterised by formidable<br />
growth, which in turn is reflected in the group’s growth in turnover<br />
and order backlog. the company’s divisions have focused on<br />
delivering in line with increased demand, which has affected their<br />
capacity to offer services on complete equipment deliveries. all the<br />
same, the turnover within after sales support has had a substantial<br />
growth. this market is less sensitive to economic fluctuations than<br />
the sale of new equipment, and the profit margins are usually<br />
higher.<br />
Margrethe Hauge has been appointed head of the services division.<br />
she started in tts in <strong>2008</strong>, in a newly established position as group<br />
director for after sales, and has been responsible for establishing a<br />
new direction for tts services, and consequently for the planning of<br />
operations of the new division. she holds a Master of Business and<br />
economics, and has previously worked for Hydro seafood and for<br />
Kverneland, a manufacturer of agricultural machines.<br />
– Our aim is to build up an organisation that will form an integral<br />
part of tts, with a target turnover of nOK 1 billion. the most<br />
important key to success will be the establishment of a global sales<br />
and service network in prime locations, and having colleagues<br />
32<br />
Services
Services<br />
present to the market a uniform profile, says Margrethe Hauge.<br />
customers have high expectations of what a good service provider<br />
should be able to offer, and our employees will endeavour to fulfil<br />
these expectations through a more uniform representation of<br />
tts services.<br />
operations<br />
right from the start, the services division has been provided with<br />
operations and employees from the established divisions. as such,<br />
the sales and representative office in Vietnam, with its seven<br />
employees, and the office in south Korea, with eight employees,<br />
have both been formally transferred to the services division. the<br />
same applies to the service organisation that tts set up in Usa,<br />
with 11 employees. Furthermore, tts has established a matrix<br />
organisation toward those responsible for service and aftersales in<br />
the product companies. they report on a technical level to the<br />
services division. In all, the combination of local representatives<br />
and co-workers in centres of excellence of services will constitute<br />
about 175 persons in the tts <strong>Group</strong>.<br />
– We plan on expanding the global representation based on<br />
where our customers have the greatest need for our presence. In<br />
that respect, singapore stands out at this phase, as well as the<br />
Middle east and south america. It is furthermore natural to include<br />
china in the global service network, Margrethe Hauge points out.<br />
activities within the service area are at present primarily<br />
reactive to customer inquiries, and concentrated on repairs and<br />
maintenance of existing equipment. tts will increasingly arrange<br />
34<br />
for agreements that ensure continuous service for our customers,<br />
and will further actively seek to come up with solutions that may<br />
fulfil our customers’ requirements. this means an increased focus<br />
on training as support for the customers’ operators, in order for<br />
them to implement efficient use of advanced equipment more<br />
swiftly. For tts, it is important to obtain a higher degree of standardisation<br />
related to purchasing of parts and components used in<br />
our service work.<br />
market outlook<br />
In tts, the activities in the market for after sales support and<br />
service constitute about 10 percent of the total turnover. In comparable<br />
operations, this share is often more than 20 percent. tts’<br />
long-term goal is for after sales and service to make up 20 percent<br />
of the group’s total turnover. this means that tts must be present<br />
with its expertise where service is conducted, and come up with<br />
service solutions that help the customer achieve efficient operation.<br />
We are entering a challenging period, in which the customers are<br />
assessing how much of their service can be postponed while the<br />
world economy remains unstable. nevertheless,tts view the<br />
possibilites in service and aftersales positively, as there are a lot of<br />
service opportunities to be seized in merely increasing the market<br />
share of our own already installed equipment!<br />
– this market is less sensitive to economic fluctuations<br />
than the sale of new equipment, and the profit margins<br />
are usually higher.
4-8 T T S G r o u P<br />
9-11 rEPorT FroM THE CEo<br />
12-37 b u S i n e S S a r e a S<br />
38-47 CorPoraTE GoVErnanCE<br />
48-110 DirECTor’S rEPorT anD aCCounTS<br />
Breakthrough in<br />
the market for trailermounted<br />
land rigs<br />
Through the Drilling Equipment division,<br />
<strong>TTS</strong> is supplier of land rigs of various sizes<br />
and categories. in the course of only a few<br />
years, Edmonton in Canada has seen the<br />
build-up of extensive operations relating<br />
to development, production and assembly<br />
of trailer-mounted land rigs. The unique<br />
technology has made these rigs a <strong>TTS</strong><br />
bestseller.<br />
eDMonTon in alBErTa has more to offer than<br />
its excellent ice hockey team. With just over<br />
1 million inhabitants, the city is home to a major<br />
university at the forefront of engineering education. The<br />
infrastructural premises for the company, which today<br />
constitutes <strong>TTS</strong> Sense (Canada) ltd., were consequently<br />
excellent. The company has seen an exceptional transformation<br />
from tired old building to state-of-the-art rig<br />
Shop. Presently, the company has 100 employees and is<br />
managed by Michael Symchuk. He holds a degree in<br />
Mechanical Engineering Technology, and has been on<br />
board since the incorporation of the company in alberta<br />
in october 2005.<br />
We have a conciderable time focused on implementing<br />
our concept for mobile land rigs with the most progressive<br />
36<br />
our land rigs are unique;<br />
based on offshore solutions<br />
with regard to safety<br />
and environment.<br />
and advanced technology on the market. During the<br />
course of <strong>2008</strong>, we experienced a breakthrough in the<br />
market as a result of two major contracts worth a total of<br />
noK 700 million, says Michael Symchuk.<br />
patented technology<br />
The land rigs, which have become a Canadian speciality,<br />
have 125 to 150 tons of hook load capacity, while <strong>TTS</strong><br />
Sense, norway, delivers 250-ton rigs. The rigs are based on<br />
patented rack and pinion technology, combined with an<br />
efficient mast design where the Top Drive is mounted on<br />
rails located on the front face of the mast. a mechanical<br />
pipe handling machine ensures safe and efficient handling<br />
of all types of drill pipes. With its compact design and low<br />
weight, this rig is perfect for fast and efficient well-to-
well relocation. The rig is usually mounted on a trailer,<br />
with two hydraulic cylinders that are used to swiftly<br />
swing the mast up into a vertical position in preparation<br />
for drilling operations.<br />
- our land rigs are unique; based on offshore solutions<br />
with regard to safety and environment. This, coupled with<br />
the advanced solutions for control systems and automation,<br />
results in a high level of reliability, even under<br />
extreme weather conditions, Michael maintains.<br />
prestigious contracts<br />
last year, <strong>TTS</strong> Sense Canada entered into contracts with<br />
two of the worlds largest oilfield service companies,<br />
Sclumberger and Weatherford to deliver in total 11 150-ton<br />
mobile land rigs in <strong>2008</strong> and 2009. These contracts<br />
represent a great recognition of the company’s technolgy.<br />
in January this year, <strong>TTS</strong> Sense Canada signed yet another<br />
major contract for 150-ton mobile land rigs, this time for<br />
the Mexican company Maquinaia, ingenieria y Proyectos<br />
del Puerto (MiPPSa).<br />
intensifying market efforts<br />
- These contracts, of which one is with a major market<br />
player within the oil industry, helps strengthen <strong>TTS</strong>’s<br />
position as a global supplier of land rigs. on the basis of<br />
these deliveries, we will intensify the marketing of our<br />
concept for land rigs, as well as the expertise that we<br />
represent, says Michael Symchuk.<br />
37
4-8 T T S G r o u P<br />
9-11 rEPorT FroM THE CEo<br />
12-37 B u S i n E S S a r E a S<br />
38-47 corporate Governance<br />
48-110 DirECTor’S rEPorT anD aCCounTS<br />
Shareholder information<br />
Share price performance<br />
in March 1995, <strong>TTS</strong> Marine aSa completed a public share issue,<br />
and 3 May 1995, the company was listed on the SMB list of<br />
the oslo Stock Exchange.<br />
Date Price<br />
Subscription price at time of offering noK 23.00<br />
opening price 03.05.95 noK 26.50<br />
31.12.95 noK 32.50<br />
31.12.96 noK 41.00<br />
31.12.97 noK 40.00<br />
31.12.98 noK 15.00<br />
31.12.99 noK 14.00<br />
31.12.00 noK 23.51<br />
31.12.01 noK 16.00<br />
31.12.02 noK 7.51<br />
31.12.03 noK 9.71<br />
31.12.04 noK 18.90<br />
31.12.05 noK 31.20<br />
31.12.06 noK 72.75<br />
31.12.07 noK 95.50<br />
31.12.08 noK 16.50<br />
(The share price has been adjusted to reflect<br />
the 1:2 share split in april 1996.)<br />
in the period 01.01.08 - 14.04.09. the trade in<br />
the <strong>TTS</strong> share has been as follows:<br />
01.01.08 14.04.09<br />
number of shareholders 1 200 1 407<br />
Foreign holdings 36.8 % 21.2 %<br />
01.01.08 – Average per<br />
14.04.09 trading day<br />
number of trades 10 179 32<br />
Value (noK 1000) 432 668 1 340<br />
number of shares (1000) 16 257 50<br />
average price 26.61<br />
38<br />
information<br />
<strong>TTS</strong> emphasizes the importance of giving the shareholders, the<br />
stock market and the general public the best possible knowledge<br />
of the <strong>Group</strong>’s operations and performance. relevant information<br />
will be made available through stock market reports and press<br />
releases. regular financial reports are issued in the form of<br />
annual reports and quarterly interim reports. The company is<br />
also in constant contact with financial analysts.<br />
The company’s financial calendar is as follows:<br />
4. quarter <strong>2008</strong>/preliminary annual result <strong>2008</strong> 26 February<br />
1. quarter 2009 14 May<br />
2. quarter 2009 21 august<br />
3. quarter 2009 05 november<br />
annual general meeting 28 May<br />
annual general meeting will be held at the company’s premises<br />
in Bergen.
800<br />
700<br />
600<br />
500<br />
400<br />
300<br />
200<br />
100<br />
0<br />
movements in share capital, riSK adjustment<br />
Date Type of Share capital Number Nominal<br />
value transaction after transaction shares in NOK<br />
03.05.95 Public offering 1 911 000 1 911 000 1.00<br />
19.04.96 Share split 1 911 000 3 822 000 0.50<br />
20.05.96 Private placing 2 101 000 4 202 000 0.50<br />
10.12.96 Private placing 2 146 130 4 292 260 0.50<br />
10.01.97 Private placing 2 223 879 4 447 758 0.50<br />
16.01.97 Private placing 2 348 149 4 696 298 0.50<br />
23.04.97 Private placing 2 578 149 5 146 298 0.50<br />
26.05.98 Private placing 2 680 649 5 361 298 0.50<br />
04.10.99 Private placing 2 930 649 5 861 298 0.50<br />
17.04 00 Private placing 3 220 649 6 441 298 0.50<br />
26.04.00 Private placing 3 436 681 6 873 362 0.50<br />
10.05.01 Private placing 3 494 181 6 988 362 0.50<br />
18.01.02 Private placing 3 851 323.5 7 702 647 0.50<br />
28.02.02 Private placing 7 422 752 14 845 504 0.50<br />
15.10.04 Private placing 8 157 552 16 315 104 0.50<br />
14.02.05 Private placing 8 857 552 17 715 104 0.50<br />
22.02.05 Private placing 8 970 552 17 941 104 0.50<br />
31.03.05 Private placing 9 026 802 18 053 604 0.50<br />
04.07.05 Private placing 9 101 802 18 203 604 0.50<br />
12.09.05 Private placing 10 001 802 20 003 604 0.50<br />
30.09.05 Private placing 10 058 052 20 116 104 0.50<br />
30.05.06 Private placing 10 133 052 20 266 104 0.50<br />
11.09.06 Private placing 10 226 802 20 453 604 0.50<br />
12.12.06 Private placing 11 246 452 22 492 904 0.50<br />
25.05.07 Private placing 11 624 838.5 23 249 677 0.50<br />
29.05.07 Private placing 11 681 088.5 23 362 177 0.50<br />
19.11.07 Private placing 12 781 088.5 25 562 177 0.50<br />
21.12.07 Private placing 12 869 139.5 25 738 279 0.50<br />
28.05.08 Private placing 12 954 139.5 25 908 279 0.50<br />
ttS share value <strong>2008</strong>–2009<br />
16.04.08 16.05.08 16.06.08 16.07.08 16.08.08 16.09.08 16.10.08 16.11.08 16.12.08 16.01.09 16.02.09 16.03.09<br />
NOK<br />
90<br />
80<br />
70<br />
60<br />
50<br />
40<br />
30<br />
20<br />
10<br />
0<br />
39
corporate Governance<br />
<strong>TTS</strong> Marine aSa (<strong>TTS</strong>) applies the norwegian code of practice for corporate<br />
governance, dated 4 December 2007, as guidelines for its work.<br />
The following principles for corporate governance have been adopted<br />
by the Board of <strong>TTS</strong> Marine aSa:<br />
1. review of corporate governance<br />
The intent of <strong>TTS</strong>’ principles of corporate governance is to clarify the<br />
roles of the shareholders, the Board of Directors and management<br />
beyond what follows from legislation. These principles constitute part<br />
of the company’s annual report.<br />
“The Spirit of <strong>TTS</strong>” is available on the company’s website,<br />
www.tts-marine.no and describes 1) Vision and Strategy 2) Corporate<br />
Culture and Core Values 3) Management and 4) Ethical Guidelines.<br />
as a global group with companies in 12 countries, there is a continuous<br />
focus on unifying the companies, corporate cultures and<br />
environments. Through a process involving all companies and divisions,<br />
we have examined and established our core values, integrity, openness,<br />
loyalty and initiative. our core values shall influence <strong>TTS</strong>’s activities, in<br />
order that they contribute to cooperation and progress for each and<br />
everyone in the <strong>TTS</strong> <strong>Group</strong>.<br />
2. business<br />
<strong>TTS</strong> Marine aSa’s articles of association are available on the company’s<br />
website. in accordance with article 3:<br />
The company’s purpose is to engage in industrial activities related<br />
to marine equipment, shipyard systems, oil and gas production, port<br />
terminal systems, and any related activities, as well as participation in<br />
or acquisition of other enterprises.<br />
3. equity and dividends<br />
EquiTY<br />
Total equity at 31 December <strong>2008</strong> was noK 4 381 million, with an<br />
equity capital of noK 989 million, giving an equity-to-assets ratio of<br />
22.6 percent. <strong>TTS</strong> has an unsecured debenture where the covenants’<br />
requirement is noK 550 million in equity and more than 22.5 percent<br />
equity ratio, where equity ratio is normative for minimum equity.<br />
SHarEHolDEr PoliCY<br />
<strong>TTS</strong> aims to give our shareholders a competitive long-term return that<br />
reflects the risk inherent to the company’s operations. Based on <strong>TTS</strong>’<br />
growth strategy, the shareholders’ return should be realised through<br />
an increase in the value of their shares, together with dividends when<br />
circumstances so permit. Growth by means of acquisitions will be<br />
implemented through balanced financing of equity and debt.<br />
The Board of <strong>TTS</strong> Marine aSa will propose to the annual General<br />
Meeting, on 28 May 2009, that no dividend shall be paid out for the<br />
accounting year <strong>2008</strong>.<br />
STraTEGY For FurTHEr GroWTH<br />
<strong>TTS</strong> has, since 1996, completed fourteen successful acquisitions, establishing<br />
a leading position in its segments of the market for handling<br />
equipment. This has entailed a considerable growth, and turnover has<br />
increased from about noK 260 million in 1997 to about noK 4.2 billion<br />
in <strong>2008</strong>.<br />
<strong>TTS</strong> GrouP 4-8<br />
rEPorT FroM THE CEo 9-11<br />
BuSinESS arEaS 12-37<br />
corporate Governance 38-47<br />
DirECTor’S rEPorT anD aCCounTS 48-110<br />
The international offshore and shipbuilding industry has experienced<br />
five good years. This has entailed excellent market conditions for offshore<br />
and ships equipment, which is <strong>TTS</strong>’ core business. accordingly, <strong>TTS</strong><br />
noted a record high order backlog at the end of <strong>2008</strong>.<br />
The global markets and economic cycles have shown a negative trend<br />
in the last year. Consequently, there is far greater uncertainty surrounding<br />
the future development in our markets.<br />
in the coming years, <strong>TTS</strong> will continue to expand the group’s activities<br />
within its segments for handling equipment for ships, ports and offshore<br />
installations, in addition to advanced drilling equipment for offshore<br />
and land-based units.<br />
auTHoriSaTionS To THE BoarD<br />
on 22 May <strong>2008</strong>, the annual General Meeting adopted a resolution to<br />
give the Board authority to issue a maximum of 4 000 000 shares against<br />
cash redemption or non-monetary consideration, including mergers.<br />
This authorisation is valid until the annual General Meeting for <strong>2008</strong>,<br />
28 May 2009. at 31 March 2009, no shares have been issued.<br />
on 30 May 2006, the annual General Meeting adopted a resolution<br />
to give the Board authority to issue a maximum of 340 000 shares<br />
against cash redemption for the benefit of the company’s executive<br />
management. This authorisation is valid until 30 May <strong>2008</strong>. 340 000<br />
shares have been issued in the form of options. 340 000 options were<br />
exercised within the due date.<br />
on 24 May 2007, the annual General Meeting adopted a resolution<br />
to give the Board authority to issue a maximum of 380 000 shares<br />
against cash redemption for the benefit of the company’s executive<br />
management. This authorisation is valid until 24 May 2009. 380 000<br />
shares have been issued in the form of options. at 30 March 2009,<br />
none of these options have been exercised.<br />
on 22 May <strong>2008</strong>, the annual General Meeting adopted a resolution<br />
to give the Board authority to issue a maximum of 420 000 shares<br />
against cash redemption for the benefit of the company’s executive<br />
management. This authorisation is valid until 22 May 2010, with a<br />
possible first time exercise of options following the presentation of the<br />
first quarterly results for 2009, equivalent to a maximum of 50 percent<br />
of the allocated options. The number of shares for further exercise<br />
of options constitutes 12.5 percent following the presentation of the<br />
results for the second, third and fourth quarter of 2009 and the first<br />
quarter of 2010, in addition to options not previously exercised.<br />
on 22 May <strong>2008</strong>, the annual General Meeting adopted a resolution<br />
to give the Board authority to purchase/own a maximum of 300 000<br />
of the company’s own shares. This authorisation is valid until the<br />
annual General Meeting for <strong>2008</strong>, 28 May 2009. at 30 March 2009,<br />
the company’s holding of own shares was 133 100, with a maximum<br />
holding in the period of 133 100 shares. <strong>TTS</strong> has made use of the<br />
authorisation to purchase own shares and subsequently sell these<br />
shares to employees at a discounted rate.<br />
41
4. equal treatment of shareholders and transactions with<br />
closely related parties<br />
SHarE CaPiTal anD SHarEHolDErS<br />
The share capital at 31 December <strong>2008</strong> and at 30 March 2009 was<br />
noK 12 954 139.50 divided into 25 908 279 shares at a nominal value<br />
of noK 0.50 each. The company has only one class of freely negotiable<br />
shares, which are listed on the oslo Stock Exchange’s Match list under<br />
the ticker symbol <strong>TTS</strong>. Each share is allocated one vote. a list of the<br />
<strong>TTS</strong>’ 20 major shareholders is available on the company’s website.<br />
oWn SHarES<br />
own shares are purchased on the oslo Stock Exchange. <strong>TTS</strong> maintains<br />
its preceding years’ practice of selling own shares to its employees<br />
at a discounted rate, but in <strong>2008</strong> employees were given no offer to<br />
purchase shares.<br />
THE BoarD oF DirECTorS anD GrouP ManaGEMEnT<br />
<strong>TTS</strong> Marine aSa’s Board of Directors and <strong>Group</strong> Management are<br />
viewed as closely related parties of <strong>TTS</strong>, using the oslo Stock Exchange<br />
for the transaction of <strong>TTS</strong> shares.<br />
There have been no closely related transactions between the Board<br />
of Directors or the <strong>Group</strong> Management and <strong>TTS</strong>. according to the<br />
norwegian code of practice for corporate governance, a company is<br />
advised to implement guidelines assuring that closely related parties<br />
give notice of closely related transactions. Based on the current Board<br />
of Directors and <strong>Group</strong> Management, the company has deemed such<br />
guidelines to be unnecessary.<br />
CloSElY rElaTED CoMPaniES<br />
The joint venture companies in the <strong>TTS</strong> group are treated as closely<br />
related companies with transactions as shown in note 19.<br />
on 2 november 2007, Sense EDM aS established a letter of intent<br />
in respect of an acquisition of 100 percent of the shares in Wellquip<br />
Holding aS. The transaction was effectuated in February <strong>2008</strong>. neram<br />
aS, owned by Trym Skeie, and lesk aS, owned by lena Skeie, companies<br />
that are both shareholders of <strong>TTS</strong> Marine aSa, own 9.8 percent and<br />
4.9 percent respectively of the issued share capital of Wellquip.<br />
The value of Wellquip Holding aS has been verified by third party<br />
DnBnor Markets.<br />
5. freely negotiable shares<br />
as transpires from the articles of association posted on the company’s<br />
website, no form of transfer restriction have been effectuated.<br />
6. annual General meeting<br />
The annual General Meeting (aGM) is usually held at the end of May.<br />
The annual General Meeting for <strong>2008</strong> will be held on 28 May<br />
2009 in accordance with the financial calendar published for 2009.<br />
agenda papers for the annual General Meeting, including the<br />
n ominating committee’s recommendations, are distributed to the<br />
share holders at the latest two weeks prior to the annual General<br />
Meeting, and are available on the company’s website at the latest<br />
three weeks prior to the annual General Meeting.<br />
Shareholders unable to attend may vote by proxy. The registration<br />
deadline is set to the day before the annual General Meeting.<br />
The Chairman of the Board, chairman of the nominating committee,<br />
auditor and CEo are present at the annual General Meeting, in addition<br />
to other board members when appropriate. The annual General Meeting<br />
elects its own chair; usually this is the Chairman of the Board.<br />
on account of a low turnout for the general assemblies, <strong>TTS</strong> does<br />
not deem it necessary for the full Board of Directors to be present. We<br />
have, for the same reason, found it unnecessary to establish routines<br />
to secure independent chairing of the annual General Meeting. Should<br />
there be particular items on the agenda requiring need for such measures,<br />
this will be individually considered for each general assembly.<br />
42<br />
7. nominating committee<br />
in <strong>TTS</strong>, a nominating committee is statutory according to the articles<br />
of association. in accordance with the annual General Meeting on<br />
22 May <strong>2008</strong>, a nomination committee was appointed with the following<br />
members:<br />
n a M E P o S i T i o n<br />
Harald Espedal Managing Director, Skagenfondene<br />
Bjørn Sjaastad Managing Director, Frontline Management<br />
Bjørn olafsson Managing Director, Frende liv aS<br />
The nominating committee appoints its own chairman of the committee.<br />
Bjørn olafsson was elected to chair the committee.<br />
no one in the nominating committee is a member of the Board of<br />
<strong>TTS</strong> Marine aSa or part of the management of <strong>TTS</strong>, as such ensuring<br />
independence. The nominating committee has knowledge of <strong>TTS</strong> and<br />
its shareholders, so that the interests of the shareholders are protected.<br />
The nominating committee recommends candidates to the Board<br />
and related remuneration, where the nominating committee’s recommendation<br />
is substantiated.<br />
according to the norwegian code of practice for corporate governance,<br />
the chairman of the nominating committee should be elected at<br />
the annual General Meeting. <strong>TTS</strong> views it as more appropriate that the<br />
committee decides on the distribution of tasks, including the election<br />
of a chairperson.<br />
8. corporate assembly and board of directors, composition<br />
and independence<br />
as <strong>TTS</strong> Marine aSa has fewer than 200 employees, the management<br />
model does not include a corporate assembly. There are two employee<br />
representatives on the Board of <strong>TTS</strong> Marine aSa.<br />
in accordance with the annual General Meeting on 22 May <strong>2008</strong>,<br />
the shareholders elected the following members to the Board:<br />
n a M E S T a T u S P o S i T i o n<br />
nils o. aardal not up for election CEo, J.o. odfjell aS<br />
anne Breive re-elected CFo, løvenskiold Vækerø aS<br />
Kjerstin Fyllingen new <strong>Group</strong> Director, TrygVesta aS<br />
Birger Skeie new Skeie Technology aS<br />
Bjarne Skeie new Skeie Technology aS<br />
in accordance with ordinary election of two employee representatives<br />
to the Board of <strong>TTS</strong> Marine aSa, the following were appointed to the<br />
Board in September of <strong>2008</strong>:<br />
naME CoMPanY PoSiTion<br />
olav Smeland <strong>TTS</strong> Marine Cranes aS Director<br />
anne-Karin Bedringås <strong>TTS</strong> Marine Cranes aS Director<br />
Mette abrahamsen <strong>TTS</strong> Marine Cranes aS 1st Deputy Director<br />
Jan ove Hovdenak <strong>TTS</strong> Marine Cranes aS 2nd Deputy Director<br />
Birger Skeie was elected Chairman of the Board. <strong>TTS</strong>’ Board members<br />
are elected for a two-year period. Each Board member’s CV is available<br />
in the annual report.<br />
Birger Skeie and Bjarne Skeie are both representatives for Skeie<br />
Technology, which is the company’s major sharholder. The other shareholder-elected<br />
Board members are independent of management, the<br />
company’s major shareholders and primary business connections.<br />
Furthermore, the composition of the Board upholds shareholder interests,<br />
and the company’s requirements for expertise, capacity and diversity<br />
in a fine collegiate body. The complementary expertise of the Board<br />
ensures the Board member’s ability to assess matters from different<br />
perspectives before reaching a final conclusion.<br />
at 31 March 2009, Bjarne Skeie, Director of the Board, is owner<br />
of 3 770 517 shares in <strong>TTS</strong> Marine aSa, through Skeie Technology in
which he owns all of the the voting shares. nils o. aardal, Director of<br />
the Board, owns 75 000 shares in <strong>TTS</strong> and olav Smeland, Director of<br />
the Board, owns 1 250 shares. The other Directors of the Board do not<br />
hold any shares. none of the Board Directors hold any options.<br />
according to the norwegian code of practice for corporate governance,<br />
the Chairman of the Board should be elected by the annual<br />
General Meeting. in <strong>TTS</strong>, the Board appoints its own chairman.<br />
9. the work of the board<br />
The Board has eight scheduled meetings annually, in addition to further<br />
meetings as required. a total of 14 board meeting were held in <strong>2008</strong>.<br />
as a result of the tremendous expansion that the company is undergoing,<br />
the work of the Board has been intensified, with increased<br />
focus on strategic work and acquisitions. in the coming years, <strong>TTS</strong> will<br />
continue to expand the group’s activities within its market segment<br />
for handling equipment for ships, ports and offshore installations, as<br />
well as advanced drilling equipment for offshore and land based units.<br />
Procedures for the Board and management have been established,<br />
focusing on distribution of tasks and responsibilities.<br />
The Board of <strong>TTS</strong> Marine aSa has an audit committee:<br />
auDiT CoMMiTTEE<br />
nils olav aardal (Chairman)<br />
anne Breive<br />
Kjerstin Fyllingen<br />
according to the norwegian code of practice for corporate governance,<br />
the Board should have a deputy chairman who may function when the<br />
Chairman of the Board is unable to or disqualified from heading the work<br />
of the Board. at present, <strong>TTS</strong> does not have a deputy chairman. This is<br />
assessed on an annual basis. <strong>TTS</strong> previously had a deputy chairman.<br />
10. risk management and internal control<br />
The <strong>TTS</strong> <strong>Group</strong> has a decentralized structure with operative boards in<br />
each company holding an average of six to eight board meetings a<br />
year. The largest company in each division reports on all the companies<br />
in its own division. The President and CEo is chairman of the board in<br />
all of the division’s Board of Directors. The head of division is chairman<br />
of the board of the companies within the division. in addition to this,<br />
the boards consist of personnel from various companies in different<br />
divisions, as well as external board members as required. an authority<br />
matrix has been established detailing which matters may be dealt with<br />
at the various levels.<br />
Procedures and systems upholding uniform reporting have been<br />
prepared for monthly reporting with a more comprehensive quarterly<br />
reporting. included in the reporting are any variances or measures<br />
for the most significant projects. This project reporting may be more<br />
frequent as required.<br />
11. remuneration of the board of directors<br />
Based on the recommendation of the nominating committee, the<br />
annual General Meeting determines the remuneration of the Board<br />
of Directors. remuneration is not linked to the company’s result. There<br />
is no share option programme for the Board of Directors.<br />
Members of the Board of Directors, or companies with whom they<br />
are associated, are not usually given separate tasks by <strong>TTS</strong> in addition<br />
to their function as members of the Board. Still, should such tasks be<br />
assigned, this will be based on the approval of the Board of Directors.<br />
There were no such assignments in <strong>2008</strong>.<br />
The nominating committee’s proposal for remuneration of the Board<br />
of Directors is presented in the call for the annual General Meeting<br />
on 28 May 2009.<br />
12. remuneration of executive management<br />
Guidelines for remuneration of executive management are presented<br />
in note 4. according to the note, share options constitute part of the<br />
remuneration.<br />
Share options for executive management (see item 3 – authorisations<br />
to the Board) include the group management. at the end of <strong>2008</strong>, and<br />
at 30 March 2009, a total of 800 000 authorised share options had<br />
been issued to group management. 380 000 options may be exercised<br />
up until 24 May 2009 at a price of noK 79 and 420 000 options may<br />
be exercised up until 22 May 2010 at a price of noK 81 per share.<br />
DiSTriBuTion oF oPTionS anD SHarES aT 31 MarCH 2009:<br />
Name Position Number of Number of<br />
options owned shares<br />
Johannes D. neteland President & CEo 200 000 105 000<br />
olav Bruåsdal Financial Director 80 000 34 000<br />
Hans-Jan Erstad Chief of Staff 80 000 20 000<br />
ivar K. Hanson Head of Division 80 000 20 000<br />
Stellan Bernsro Head of Division 80 000 20 000<br />
Edgar Bethmann Head of Division 80 000 20 000<br />
Tom Fedog 1) Head of Division 80 000 281 420<br />
lennart Svensson 2) Head of Division 0 200<br />
Margrethe Hauge 3) Head of Division 40 000 100<br />
Total 800 000 500 720<br />
1) Owns Wary AS (100 %) that owns 50 % of Itlution AS and Itlution II AS<br />
that owns in all 562 840 shares in <strong>TTS</strong> Marine <strong>ASA</strong>.<br />
2) Started as head of the Port and Material Handling division on<br />
1 October <strong>2008</strong>.<br />
3) Started in <strong>TTS</strong> as group director in February <strong>2008</strong>, and was appointed<br />
head of the newly established Services division as of 1 January 2009.<br />
13. information and communication<br />
The company has established guidelines for the handling of information<br />
and communication. These guidelines also address contact with the<br />
owners separate from the general assembly.<br />
The reporting by <strong>TTS</strong> of financial and other information is based on<br />
transparency, respecting the principles of equal treatment of stock<br />
market participants.<br />
a financial calendar is available on the company’s website. any<br />
dividend proposal is presented in the fourth quarterly report and the<br />
call for an annual general meeting.<br />
information for the shareholders of the company is posted on the<br />
company’s website at the same time as it is distributed to the shareholders<br />
(with the exception of the call for an annual general meeting,<br />
see item 6).<br />
14. company takeover<br />
The company’s articles of association do not include mechanisms aimed<br />
at preventing takeover, nor are other hindrances in effect to reduce<br />
transfer of the company’s shares.<br />
no main principles have been established for <strong>TTS</strong>’ response to a prospective<br />
takeover bid, other than that the norwegian code of practice<br />
for corporate governance will have a normative function.<br />
15. auditor<br />
The auditor conducts a minimum of two meetings a year with the audit<br />
committee, part of the meeting without management present. one of<br />
the meetings is conducted in connection with the review of the annual<br />
accounts. The auditor is present at board meetings as required.<br />
remuneration payable to the auditor, specifying the division between<br />
auditing and other services, is shown in note 4.<br />
The extent of services other than audit services is addressed in the<br />
meeting between the auditor and the audit committee. it has not been<br />
deemed necessary by the Board to implement additional guidelines<br />
with regard to the management’s access to making use of the auditor<br />
for services other than auditing.<br />
43
Second row, from the left: Edgar Bethmann, Hans-Jan Erstad,<br />
lennart Svensson, Stellan Bernsro, Mette Henriksen and Tom Fedog.<br />
First row: Margrethe Hauge and Johannes D. neteland.<br />
ivar K. Hanson was not present.<br />
44<br />
PHOtO: HeLGe sKODVIn
Senior management<br />
johannes d. neteland<br />
preSident & ceo<br />
neteland (51) is President & CEo<br />
of <strong>TTS</strong> Marine aSa. He has an<br />
advanced business administra tion<br />
degree from the norwegian<br />
School of Economics and<br />
Business administration (nHH).<br />
neteland worked for Statoil from<br />
1981-1988, was the deputy<br />
managing director of Block<br />
Watne Boliger from 1988-1989<br />
and the marketing director of the<br />
Ekornes <strong>Group</strong> from 1989-1991.<br />
He was the division director of<br />
Vital Forsikring from 1991-1998<br />
until he assumed his current<br />
position.<br />
mette henriksen<br />
actinG cfo<br />
Henriksen (47) is acting Chief<br />
Financial officer of <strong>TTS</strong> Marine<br />
aSa. She holds a Master of<br />
Economics from the norwegian<br />
School of Economics and<br />
Business administration (nHH),<br />
as well as a Master of Science<br />
in Public accounting. Henriksen<br />
held a position with Deloitte in<br />
oslo and Bergen for 15 years as<br />
account Manager. From holding<br />
the position of Chief accountant<br />
at Hansa Borg Bryggerier aSa,<br />
she was appointed Director of<br />
Finance of <strong>TTS</strong> in 2005. Henriksen<br />
has been acting Chief Financial<br />
officer since January 2009.<br />
hans-jan erstad<br />
vice preSident<br />
Erstad (65) is Hr Manager with<br />
additional responsibility for corporate<br />
iT and quality assurance<br />
projects. He is an automation<br />
engineer and has also studied<br />
economics, management and<br />
contract management. Erstad has<br />
worked in defence, maritime and<br />
offshore industry. For many years<br />
he also worked as a consultants<br />
for more than 40 norwegian<br />
companies. He started in <strong>TTS</strong> in<br />
1995 and has been responsible<br />
for iT, logistics and industrial<br />
development. He assumed his<br />
current position in 2002.<br />
Stellan bernsro<br />
executive vice preSident<br />
Bernsro (48) is Director of Dry<br />
Cargo Handling division and<br />
Managing Director of <strong>TTS</strong> Ships<br />
Equipment aB. Bernsro holds a<br />
Master of Science in industrial<br />
Engineering and Management, an<br />
Engineering degree in Mechanics<br />
while being graduated Captain<br />
in the royal Swedish navy.<br />
Bernsro has experience from<br />
management positions in marine<br />
diesel engine service, industrial<br />
gas applications and production<br />
automation, prior to joining <strong>TTS</strong><br />
in 1996. He was initially assigned<br />
as contract manager and was<br />
in 2005 appointed managing<br />
director, while during the spring<br />
2006 assuming current position.<br />
ivar K. hanson<br />
executive vice preSident<br />
Hanson (44) is division Director<br />
for Marine Cranes and Managing<br />
Director of <strong>TTS</strong> Marine Cranes aS.<br />
He has an advanced degree in<br />
business administration from the<br />
norwegian School of Economics<br />
and Business administration<br />
(nHH) and is a mechanical<br />
engineer. Hanson has worked as<br />
a contract coordinator and bid<br />
manager. He started at <strong>TTS</strong> as<br />
a shipyard consultant in 1994<br />
and was appointed managing<br />
director of <strong>TTS</strong> automation aS in<br />
1999 and <strong>TTS</strong> Handling Systems<br />
aS in 2000. From 1 January<br />
2003 to 30 May 2004, Hanson<br />
was director in Prosafe Drilling<br />
Services aS for Technology<br />
and Projects in the engineering<br />
division. He took up his current<br />
position with <strong>TTS</strong> in <strong>2008</strong>.<br />
lennart Svensson<br />
executive vice preSident<br />
Svensson (52) is Director of the<br />
Port and Material Handling<br />
division. Svensson is a naval<br />
architect and Mechanical<br />
Engineer. He has eight years of<br />
experience from various enterprises<br />
that are currently part of<br />
the MacGregor <strong>Group</strong> and two<br />
years as Marketing Director at<br />
Daros Piston rings aB. Svensson<br />
has worked for <strong>TTS</strong> since 1996<br />
and as managing director in<br />
<strong>TTS</strong> Port Equipment aB since the<br />
company was established in<br />
2005. He took up his current<br />
position in the autumn of <strong>2008</strong>.<br />
edgar bethmann<br />
executive vice preSident<br />
Bethmann (51) is the division<br />
Director for Deck Machinery and<br />
Managing Director of <strong>TTS</strong> Kocks<br />
GmbH. He has a Bachelor of<br />
Commerce degree from the<br />
German institute of Technology<br />
at the university of Clausthal-<br />
Zellerfeld, Germany. Bethmann<br />
has 16 years’ experience from<br />
the shipbuilding industry in<br />
Germany, partly as a technical<br />
director. Since 2000, he has been<br />
Managing Director of <strong>TTS</strong> Ships<br />
Equipment GmbH in Bremen.<br />
Bethmann took up his current<br />
position in the autumn of 2005.<br />
tom fedog<br />
executive vice preSident<br />
Tom Fedog (46) is division<br />
Director for Drilling Equipment<br />
<strong>TTS</strong> GrouP 4-8<br />
rEPorT FroM THE CEo 9-11<br />
BuSinESS arEaS 12-37<br />
corporate Governance 38-47<br />
DirECTor’S rEPorT anD aCCounTS 48-110<br />
and Managing Director of <strong>TTS</strong><br />
Sense aS. He has an advanced<br />
degree in business administration<br />
from the university of agder.<br />
Mr. Fedog has long experience<br />
from the oil and gas industry.<br />
He worked 13 years at aker<br />
Maritime Hydraulics, in different<br />
departments. He also worked<br />
several years as President for<br />
Maritime Hydraulics Canada.<br />
Thereafter he became the Vice<br />
President of the Business<br />
Development department in the<br />
company. Mr. Fedog has since<br />
1992 to 2000 been member of<br />
the Corporate Management Team<br />
at Maritime Hydraulics. From<br />
2000 and until the merge with<br />
<strong>TTS</strong>-group he was President<br />
and shareholder of Sense<br />
Technology aS. He took up his<br />
current position in the spring<br />
of 2007.<br />
margrethe hauge<br />
executive vice preSident<br />
Hauge (38) is Director of Services<br />
division. She holds a degree in<br />
Master of Science in Business<br />
and administration from the<br />
university of Mannheim in<br />
Germany, specialising in logistics<br />
and Marketing. after finishing<br />
her degree, Hauge worked for<br />
Hydro Seafood aS for three<br />
years, before taking up a position<br />
in Kverneland aSa, a company<br />
manufacturing agricultural<br />
machines. in Kverneland aSa,<br />
she held several positions; among<br />
these, she was Managing Director<br />
of the business domain spare<br />
parts, Managing Director of<br />
Kverneland <strong>Group</strong> australia,<br />
and in the last year Managing<br />
Director for business area Crop<br />
Care. Hauge started in <strong>TTS</strong><br />
Marine aSa in February <strong>2008</strong>.<br />
45
4-8 T T S G r o u P<br />
9-11 rEPorT FroM THE CEo<br />
12-37 B u S i n E S S a r E a S<br />
38-47 corporate Governance<br />
48-110 DirECTor’S rEPorT anD aCCounTS<br />
the board of directors ttS marine aSa<br />
birger Skeie<br />
chairman of the board<br />
Skeie (58) has a background in<br />
economics studies and more<br />
than 30 years’ experience from<br />
development and management<br />
of companies within the shipping,<br />
rig, offshore and equipment<br />
industries. He held various positions<br />
in Mosvold Shipping aS<br />
(1974-1981) and norwegian rig<br />
Consultants aS (1981-1986).<br />
Skeie was with the Skeie <strong>Group</strong><br />
in (1986-1990), first as financial<br />
director, then later as executive<br />
vise president. He was in Skeie<br />
Shipping & offshore (1990-<br />
1992), then in Hydralift (1992-<br />
2006) first as financial director,<br />
then as managing director from<br />
1997. Hydralift saw a tremendous<br />
organic growth through acquisitions<br />
and was sold to national<br />
oilwell in the autumn of 2002.<br />
in 2002, the company was the<br />
major shareholder of <strong>TTS</strong> Marine<br />
aSa (39.1 percent). Skeie started<br />
as managing director of Skeie<br />
Technology aS in 2006, and was<br />
seconded as managing director of<br />
Skeie Drilling & Production aSa<br />
in 2007. Skeie was a member of<br />
the Board of Directors of <strong>TTS</strong><br />
Marine aSa in the period 2002-<br />
2004, and has been chairman of<br />
the board since <strong>2008</strong>. He has no<br />
shares or options in <strong>TTS</strong> Marine<br />
aSa. Skeie is a norwegian citizen.<br />
anne-Karin bedringås<br />
d i r e c t o r o f t h e b o a r d<br />
Bedringås (44) completed three<br />
years of Business College in<br />
lillesand and arendal. She joined<br />
Hydralift, now <strong>TTS</strong>, in 1985. Her<br />
previous work in Hydralift/<strong>TTS</strong><br />
included executive work, transportation<br />
and l/C in the after<br />
Sales and Stock department.<br />
Following this, she worked as a<br />
46<br />
purchaser in the Ma department<br />
in Kristiansand, and she is currently<br />
a project secretary in sales<br />
and logistics, in the crane department<br />
in Kristiansand. She has<br />
acted as employee representative<br />
on the Board of <strong>TTS</strong> Marine aSa<br />
since <strong>2008</strong>. Bedringås holds<br />
no shares in <strong>TTS</strong>. Bedringås is a<br />
norwegian citizen.<br />
olav Smeland<br />
d i r e c t o r o f t h e b o a r d<br />
Smeland (34) holds a degree as<br />
Technical Economic Engineer<br />
(Machinery) at agder College,<br />
Grimstad division. He has previously<br />
been employed by Hydralift,<br />
and has worked for <strong>TTS</strong> since<br />
1998. He has worked primarily as<br />
purchaser for parts and accessories<br />
related to crane production.<br />
Presently, he is Project Manager<br />
in the Marine Crane Division’<br />
branch office in Kristiansand.<br />
Smeland has acted as employee<br />
representative on the Board<br />
of <strong>TTS</strong> Marine aSa since 2006.<br />
Smeland owns 1 250 shares in<br />
<strong>TTS</strong>. Smeland is a norwegian<br />
citizen.<br />
Kjerstin fyllingen<br />
d i r e c t o r o f t h e b o a r d<br />
Fyllingen (51) is corporate director<br />
of TrygVesta, Private & Commercial<br />
norway. She holds a Diploma in<br />
Economics and an MSc in leadership,<br />
both from the norwegian<br />
School of Management Bi.<br />
Fyllingen previously worked for<br />
Vital Forsikring, where she held<br />
various managerial positions in<br />
charge of the business segments<br />
Public Sector, as well as Customer<br />
Service Private & Commercial.<br />
Fyllingen has furthermore held<br />
various managerial positions in<br />
DnB within the areas of iT and<br />
Economics. She has been head<br />
of infodoc international and held<br />
various positions within Economics<br />
in DnV. Fyllingen has been a<br />
member of the board since <strong>2008</strong>.<br />
She has no shares or options<br />
in <strong>TTS</strong> Marine aSa. Fyllingen is<br />
a norwegian citizen.<br />
bjarne Skeie<br />
d i r e c t o r o f t h e b o a r d<br />
Skeie (63) has an engineering<br />
background and is known as an<br />
entrepreneur, industrial developer<br />
and investor in the rig, offshore<br />
and equipment industries. This<br />
includes the founding of Maritime<br />
Hydraulics aS (1970), as well as<br />
acquisitions and restructuring of<br />
a number of companies that were<br />
merged and listed on the oslo<br />
Stock Exchange as Skeie <strong>Group</strong><br />
(1986/87). He undertook further<br />
establishments and acquisitions<br />
of new companies, one of which<br />
was Hydralift (1990), a company<br />
that saw tremendous organic<br />
growth through acquisitions.<br />
Hydralift was sold to national<br />
oilwell in the autumn of 2002, at<br />
the time the major shareholder<br />
of <strong>TTS</strong> Marine aSa (39.1 percent).<br />
He founded Sinvest in 2002,<br />
which was sold in 2006. in 2006,<br />
Skeie Drilling & Productions was<br />
established, and in 2007, Skeie<br />
energy was established. as of<br />
april <strong>2008</strong>, Skeie Technology aS<br />
owned 3 406 917 shares (13.2<br />
percent) in <strong>TTS</strong> Marine aSa.<br />
Bjarne Skeie owns 20 percent of<br />
all the shares and 100 percent<br />
of the a-class voting shares in<br />
Skeie Technology aS. He holds<br />
no options in <strong>TTS</strong> Marine aSa.<br />
Skeie was Chairman of the Board<br />
of <strong>TTS</strong> Marine aSa in the period<br />
2002-2003 and has been a<br />
member of the board since <strong>2008</strong>.<br />
Skeie is a norwegian citizen.<br />
nils o. aardal<br />
d i r e c t o r o f t h e b o a r d<br />
aardal (61) with a background in<br />
economics studies, aardal has<br />
over 30 years’ experience of the<br />
shipping and offshore industry<br />
through managerial and board<br />
positions with Jo Tankers and<br />
odfjell Drilling. He has also held<br />
many posts as a director within<br />
banking, marine insurance and<br />
interest organisations. Today, nils<br />
o. aardal is a working director of<br />
the ship-owning companies that<br />
are used by Jo Tankers, and he<br />
also holds board positions within<br />
the marine industry. aardal has<br />
been a member of the <strong>TTS</strong> Marine<br />
aSa board since 1999. aardal<br />
owns 75 000 shares in <strong>TTS</strong>. He<br />
has no options in the company.<br />
aardal is a norwegian citizen.<br />
anne breive<br />
d i r e c t o r o f t h e b o a r d<br />
Breive (43) is CFo of løvenskjold<br />
Vækerø. She has a Bachelor<br />
of Commerce degree from the<br />
norwegian School of Management<br />
(Bi) and an MBa degree<br />
from Glasgow university. During<br />
the period 1994-2005, she held<br />
various managerial positions in<br />
the norske Skog <strong>Group</strong>, including<br />
that of Vice President Corporate<br />
Funding and Vice President<br />
Corporate Controlling. Breive was<br />
CFo of Statnet from 2005-<strong>2008</strong>.<br />
Breive has been a member of<br />
the <strong>TTS</strong> Marine aSa board since<br />
2005. She has no shares or<br />
options in the company. Breive<br />
is a norwegian citizen.
From the left: Bjarne Skeie, anne Karin Bedringås,<br />
olav Smeland, Kjerstin Fyllingen, Birger Skeie,<br />
nils o. aardal, anne Breive.<br />
PHOtO: HeLGe sKODVIn<br />
47
4-8 T T S G r o u P<br />
9-11 rEPorT FroM THE CEo<br />
12-37 B u S i n E S S a r E a S<br />
38-47 CorPoraTE GoVErnanCE<br />
48-110 director’S report and accountS<br />
director’s report for <strong>2008</strong><br />
introduction<br />
the tts <strong>Group</strong> (tts) had its best operating year ever in <strong>2008</strong><br />
despite for the financial turmoil in the finacial markets and the<br />
increasing international financial crisis.<br />
However due to the increased uncertainty in the market, the<br />
Board has deceided to end the total contract evaluation of costs<br />
related to a contract of delivery of 9 rigs to ability Drilling. Due to<br />
the uncertainty related to wheter the last 5 rigs will be delivered,<br />
capitalized costs related to the total contract evaluation in the 2007<br />
accounts of nOK 79 million, have been taken into the accounts of<br />
<strong>2008</strong>. after this depreciation the operating result (eBItDa) for<br />
<strong>2008</strong> is nOK 145.5 million (nOK 167.8 million in 2007). Pre-tax<br />
profit was nOK 36.8 million (nOK 97.6 million) and net profit<br />
was nOK 36.4 million (nOK 79 million). the board propose that<br />
the result is allocated to other reserves.<br />
In <strong>2008</strong>, the turnover in tts was nOK 4 196 million (nOK<br />
2 460 million). at the start of the new year, the order backlog was<br />
nOK 8 159 million (nOK 6 946 million).<br />
In <strong>2008</strong>, tts developed and consolidated its position as leading<br />
global supplier within the group’s prioritised business segments;<br />
handling equipment to the maritime sector, to the onshore and<br />
offshore sector, as well as to ports and terminals.<br />
operations<br />
tts is an international group that develops and supplies handling<br />
equipment to the maritime industry and to the oil and gas industry.<br />
Operations have been organised in five divisions; Dry cargo<br />
Handling, Marine cranes, Port and Material Handling, Deck<br />
Machinery and Drilling equipment. as of 2009, after sales support<br />
and services in all areas of operation have been organised in a new<br />
division; the services division.<br />
In <strong>2008</strong>, tts acquired the norwegian drilling technology company<br />
Wellquip, thereby strengthening the Drilling equipment<br />
division’s expertise and ability to deliver with regard to complete<br />
drilling packages. In Dalian, china, tts established a wholly-owned<br />
subsidiary company associated to the Deck Machinery division.<br />
tts Marine equipment co. Ltd. manufactures winches and other<br />
deck equipment. In total, the tts <strong>Group</strong> comprises 24 operative<br />
and wholly-owned units in 12 countries.<br />
In china, tts holds a 50 percent ownership interest in two<br />
joint venture companies, tts Hua Hai ships equipment co. Ltd.<br />
and tts Bohai Machinery co. Ltd., with partners china state<br />
shipbuilding corporation (cssc) and Dalian shipbuilding Industry<br />
corporation (DsIc) respectively. through the Dry cargo Handling<br />
division, tts holds a 50 percent ownership interest in the privately<br />
48<br />
owned manufacturing company tts Keyon Marine equipment co.<br />
Ltd., a company which supplies steel structures for hatch covers,<br />
roro equipment and cranes. Furthermore, the joint venture company<br />
tts Hua Hai ships equipment participates with an ownership<br />
interest of 40 percent in the company Jiangnan tts (nantong) ships<br />
equipment co. Ltd., which manufactures hatch covers.<br />
marKet and diviSionS<br />
through its activities in the dry cargo handling division, tts is a<br />
leading supplier of cargo handling systems for ships; side loading<br />
systems, roro equipment, hatch covers and special equipment for<br />
offshore vessels, yachts and cruise ships. the division reported<br />
continued growth in deliveries in <strong>2008</strong>. the level of activity was<br />
particularly brisk in the market for handling equipment to car<br />
carriers. as a result of the negative trend in global economy, the<br />
division was, in the fourth quarter, forced to record losses on several<br />
contracts with weak margins, and moreover take a loss on currency<br />
hedging contracts in connection with cancellation of contracts.<br />
this meant that the division’s result was somewhat weaker than<br />
in 2007.<br />
the marine cranes division develops and supplies marine cranes,<br />
and is the world’s leading supplier of hose handling cranes. the<br />
division is furthermore a major supplier of provision cranes and<br />
cargo cranes. For the offshore sector, the division delivers cranes<br />
and other handling equipment for vessels and installations. In <strong>2008</strong>,<br />
the division continued its progress in all business areas. Operations<br />
were mainly as expected, but the Marine cranes division recorded<br />
losses on currency contracts, that was weakening the result of the<br />
division in the fourth quarter.<br />
the port and material handling division supplies shipyard production<br />
systems and systems for material handling in shipyards and<br />
other industries, as well as loading and transport systems to ports.<br />
the division’s turnover increased further in <strong>2008</strong>, and the result<br />
was considerably better than in 2007.<br />
the deck machinery division manufactures winches and other<br />
deck machinery for the maritime industry and for the offshore<br />
sector. the division reported a significant growth in turnover in<br />
<strong>2008</strong>, with a solid result.<br />
the drilling equipment was established following tts’ acquisition<br />
of sense eDM. the division supplies drilling equipment to offshore
igs and complete drilling rigs for onshore use. the growth in turn-<br />
over in <strong>2008</strong> was excellent, but the result was strongly affected<br />
by the depreciation related to the rigs in the ability Drilling<br />
contract. Furthermore, the division was greatly affected by the<br />
financial crisis after several projects failed to be completed owing<br />
to lack of financing.<br />
the ttS <strong>Group</strong><br />
at 31 December <strong>2008</strong>, the tts <strong>Group</strong> had a workforce of 1 236<br />
employees. Of these, 557 were based in norway, 105 in sweden,<br />
29 in Finland, 175 in Germany, 35 in the czech republic, 8 in<br />
Italy, 195 in china, 11 in Usa, 55 in canada, 50 in south Korea,<br />
6 in Vietnam and 10 in singapore. at the start of the new year,<br />
tts’ three joint venture companies in china had a total of 418<br />
employees.<br />
the parent company, tts Marine asa, has its head office in<br />
Bergen, norway, and is listed on the Oslo stock exchange.<br />
tts has reached a dimension where considerable synergies<br />
can be obtained through a higher degree of interfacing between<br />
divisions and corporate units. this requires a degree of central<br />
management to ensure support and loyalty with regard to approved<br />
principles for coordination of operation. at the same time, the<br />
established principle for operations in tts is based on extensive use<br />
of local management and direction. Proximity to operations and<br />
results in each of the operative units motivates management and<br />
employees to greater efforts, and this in turn strengthens the<br />
perception of the individual customer’s experience that their needs<br />
and requirements are being met in a satisfactory manner.<br />
In tts, product development is primarily performed on a<br />
project basis. Prior to the signing of contracts, considerable<br />
development takes place in some of the projects in cooperation<br />
with the customers. However, for some of the new product areas,<br />
product development will not be tied to any one single project.<br />
among other things, tts has developed a winch for anchor<br />
handling with so-called active heave compensation, which means<br />
that loads can be placed safely on the seabed regardless of surface<br />
weather conditions.<br />
Goal and StrateGy<br />
tts’ goal is to develop and supply equipment to the maritime<br />
industry and to the oil and gas industry of a quality that strengthens<br />
our customers’ productivity and value generation. Our expertise<br />
and our resources are aimed at design and engineering, as well as<br />
assembly and testing of products. Other activities that are included<br />
in a total delivery are primarily purchased from cooperating<br />
companies. after sales support and service is on of the group’s<br />
areas of priority.<br />
tts’ strategy is to build up and maintain a relationship of trust<br />
with our customers through development and delivery of products<br />
that are competitive as regards price and quality. this means that<br />
tts must have a global competitive structure to match the lowest<br />
bidder. In addition to this, the reliable and professional handling of<br />
guarantee issues is necessary in order to become a preferred supplier.<br />
tts has a program of specific actions for the implementation<br />
of such a strategy.<br />
tts has based its growth and development on a combination of<br />
organic growth and acquisition of companies in areas that supplement<br />
tts’ established operations and that create synergistic effects. this<br />
strategy will be continued.<br />
review of the annual accounts<br />
financial reSultS for <strong>2008</strong><br />
In <strong>2008</strong>, tts achieved a pre-tax profit of nOK 36.8 million (nOK<br />
97.6 million) and a net profit of nOK 36.4 million (nOK 79<br />
million). earnings per share was nOK 1.41 (nOK 3.40).<br />
the group’s turnover was nOK 4 196 million (nOK 2 460<br />
million), and earnings before depreciation (eBItDa) was nOK<br />
145.5 million (nOK 167.8 million). there was an increase in<br />
turnover of 70 percent and a decrease in operating profit of 15<br />
percent. the turnover was higher than previously communicated in<br />
the guiding presented by the company at the start of the year.<br />
Operating profit was weaker than anticipated, due to the depreciation<br />
in the ability Drilling contract and to unexpected losses on<br />
foreign exchange in the wake of the downturn of international<br />
economy toward the end of the year. In addition to this, two of the<br />
group’s companies delivered a weaker result than expected.<br />
accountinG principleS<br />
the annual accounts of the group have been prepared in accordance<br />
with the annual accounts of the mothercompany. tts Marine asa<br />
have been prepared in accordance with norwegian reporting<br />
standards. the accounting principles are the same as for the annual<br />
accounts for 2007.<br />
balance Sheet<br />
the total assets at 31 December <strong>2008</strong> were nOK 4 380.7 million<br />
(nOK 3 102 million) with a total equity of nOK 989.1 million<br />
(nOK 933.6 million), equivalent to an equity ratio of 22.6 percent<br />
(30.1 percent).<br />
49
4-8 T T S G r o u P<br />
9-11 rEPorT FroM THE CEo<br />
12-37 B u S i n E S S a r E a S<br />
38-47 CorPoraTE GoVErnanCE<br />
48-110 director’S report and accountS<br />
tts’ debenture of nOK 500 million, which was taken up in<br />
2007 in connection with the acquisition of sense eDM as, has<br />
a covenants’ requirement to equity of a minimum of nOK 550<br />
million and an equity ratio of 22.5 percent.<br />
the increase of intangible assets to nOK 1 205.2 million<br />
(nOK 1 075.4 million) is primarily related to the acquisition of<br />
Wellquip as. the increase in tangible fixed assets to nOK 124.7<br />
million (nOK 78.3 million) is mainly due to increased inventory<br />
and equipment.<br />
Fixed assets constitute nOK 104.1 million (nOK 61.9 million),<br />
of which nOK 87.4 million (nOK 57 million) are ownership<br />
interests in the three joint venture companies in china. Of the<br />
remaining nOK 16.7 million (nOK 4.9 million), the investment in<br />
Fastship Inc constitutes nOK 2.9 million (nOK 3 million).<br />
Increase in current assets to nOK 2.871,9 million (nOK<br />
1 886.3 million) is a result of increased activity, in addition to<br />
resources from acquired companies.<br />
net interest-bearing debt at 31 December <strong>2008</strong> was nOK 509.7<br />
million (nOK 253.2 million). cash reserves as of 31.12.07 were<br />
nOK 267.2 million (nOK 353.1 million).<br />
the tts <strong>Group</strong> has income and expenses in foreign currencies,<br />
where the financial risk has been reduced by the use of hedging<br />
instruments, described in greater detail in accounting Principles.<br />
the annual accounts shows actual loss on currency hedging<br />
contracts of in all nOK 10 million in connection with cancellations<br />
of firm orders and has made appropriations of further loss on<br />
currency of in all about nOK 20 million.<br />
the annual accounts have been prepared in accordance with the<br />
International Financial reporting standard (IFrs). the accounts<br />
provide a true picture of the company’s financial position at<br />
31 December <strong>2008</strong>. the Board and management are not aware of<br />
any events that have occurred subsequent to the balance sheet date<br />
of 31 December <strong>2008</strong> that may be of material significance to tts<br />
and the annual accounts for <strong>2008</strong>.<br />
at the end of <strong>2008</strong>, tts Marine asa had a share capital of nOK<br />
12 954 140 divided into 25 908 208 shares at nOK 0.50 each.<br />
order bacKloG<br />
the order backlog at 31 December <strong>2008</strong> was nOK 8 159 million<br />
(nOK 6 949 million). these figures include 50 percent of the order<br />
backlog of the joint venture companies.<br />
On the basis of confirmed and anticipated cancellations that have<br />
followed in the wake of the financial crisis and the downturn in the<br />
global economy, tts made a downward adjustment of the order<br />
backlog in the fourth quarter of about nOK 600 million. Presumably,<br />
50<br />
the order backlog will have to be adjusted downward with a further<br />
nOK 400 million in 2009 for the same reason.<br />
continued operation<br />
the requirement for continued operation pursuant to section 3-3<br />
of the norwegian accounting act has been fulfilled, and the annual<br />
accounts have been prepared according to this. at 31 December<br />
<strong>2008</strong>, the equity ratio was 22.6 percent of a total balance of nOK<br />
4 380 million, with net interest-bearing debt of nOK 509.7 million.<br />
business areas<br />
tts develops and supplies and delivers handling equipment to the<br />
maritime industry and to the oil and gas industry. the operations<br />
have been organised in five divisions in <strong>2008</strong>.<br />
d r y c a r G o h a n d l i n G d i v i S i o n<br />
the Dry cargo Handling division reported a turnover in <strong>2008</strong> of<br />
nOK 1 240 million (nOK 875 million). earnings before depreciation<br />
(eBItDa) were nOK 85 million (nOK 95.5 million). the<br />
eBItDa margin was 6.9 percent compared to 10.9 percent in<br />
2007.<br />
at 31 December <strong>2008</strong>, the order backlog was nOK 3 151<br />
million (nOK 2 619 million). toward the end of <strong>2008</strong>, the market<br />
for equipment to bulk carriers was affected by the economic crisis,<br />
resulting in cancellations. In spite of this, the Dry cargo Handling<br />
division reported a positive net order intake in the fourth quarter.<br />
marine craneS diviSion<br />
the Marine cranes division reported a turnover in <strong>2008</strong> of nOK<br />
1 107 million (nOK 688 million). earnings before deprecation<br />
(eBItDa) was nOK 41.8 million (nOK 34.9 million). the eBItDa<br />
margin was 3.8 percent compared to 5.1 percent in 2007.<br />
at 31 December <strong>2008</strong>, the order backlog was nOK 2 371<br />
million (nOK 2 433 million). the market for cargo cranes to<br />
bulk carriers is affected by the economic crisis, and for tts it has<br />
resulted in a substantial number of cancellations.<br />
port and material handlinG diviSion<br />
the Port and Material Handling division reported a turnover in<br />
<strong>2008</strong> of nOK 350.5 million (nOK 333 million). earnings before<br />
depreciation (eBItDa) were nOK 32.5 million (nOK 25.6<br />
million). the eBItDa margin was 9.3 percent compared to 7.7<br />
percent in 2007.<br />
at 31 December <strong>2008</strong>, the order backlog was nOK 326 million<br />
(nOK 216 million). the market outlook for the division’s products<br />
remains good.
d e c K m a c h i n e r y d i v i S i o n<br />
the Deck Machinery division reported a turnover in <strong>2008</strong> of nOK<br />
448 million (nOK 300 million). earnings before depreciation<br />
(eBItDa) were nOK 22.3 million (nOK 5.3 million). the eBItDa<br />
margin was 5 percent compared to 1.8 percent in 2007. In <strong>2008</strong>, the<br />
division established a new wholly-owned company in Dalian in china<br />
for production of winches and other deck machinery. start-up costs<br />
related to this have been included in the accounts.<br />
at 31 December <strong>2008</strong>, the order backlog was nOK 902 million<br />
(nOK 681 million). the level of activity in the market for the<br />
division’s products remains high.<br />
drillinG equipment diviSion<br />
the Drilling equipment division reported a turnover in <strong>2008</strong> of<br />
nOK 1 057 million (nOK 265 million). earnings before depreciation<br />
(eBItDa) were nOK -24.6 million (nOK 13.9 million).<br />
the eBItDa margin was -2.3 percent compared to 5.2 percent<br />
in 2007. Without write-downs the eBItDa margin is 3,6 procent.<br />
the division was established in May 2007, following tts’<br />
acquisition of sense eDM as, and the figures for 2007 reflect the<br />
period under tts’ ownership.<br />
the division has a program for delivery of large rigs for onshore<br />
use to ability Drilling asa. the total contract is 9 rigs and the total<br />
development costs has been allocated to the 9 rigs. Due to the<br />
negative development in the market since the change of year and<br />
increased uncertainty related to wheter all rigs will be delivered,<br />
the Board decided to end the total contract evaluation and to depreciate<br />
the activated costs of nOK 79 million. In addition costs for<br />
compensation to the customer related to delays in the start<br />
of the project has been taken into the accounts. costs related to<br />
further development- and testing has also been taken into the<br />
divisions accounts.<br />
at 31 December <strong>2008</strong>, the order backlog was nOK 1 410 million<br />
(nOK 999 million). as a result of the economic crisis the market<br />
for equipment deliveries to the offshore market is at a standstill,<br />
however the onshore market shows potential.<br />
risk factors and risk management<br />
the tts <strong>Group</strong> is exposed to various types of risks, and the Board<br />
closely monitors development within the different risk areas.<br />
On a monthly basis, the Board reviews operating reports prepared<br />
by the administration. In addition to the continuous risk<br />
management, the Board and administration carry out specific risk<br />
analyses in connection with major investments and acquisitions, as<br />
well as risk analyses of projects.<br />
marKet riSK<br />
at the end of <strong>2008</strong>, tts reported a record high order backlog. as<br />
a result of the financial crisis, the order backlog is encumbered<br />
with uncertainty due to the risk of cancellations and payment<br />
difficulties on part of the customers. In addition to this, many of<br />
the group’s projects depend on the customer’s ability to finance<br />
their investments. In general, the risk of lack of financing has<br />
increased throughout the market. Moreover, a lower level of<br />
activity within shipbuilding could affect the group’s activity level in<br />
the long run.<br />
financial riSK<br />
tts is exposed to financial risk related to credit risk, liquidity risk<br />
and currency risk.<br />
credit risk is the risk of financial losses should a contractual<br />
partner fail to fulfil his obligations. the customer base is differentiated,<br />
and historically the group has seen only a modest loss on<br />
accounts receivable. the development of the global economy in<br />
general, and of the ship building industry and offshore industry in<br />
particular, has resulted in an increased credit risk. as a consequence<br />
of the increased risk level, actions have been taken to limit risk<br />
exposure. allocation for loss of accounts receivable was increased<br />
by nOK 11.4 million at the end of the year.<br />
Liquidity risk is the risk of the group being unable to fulfil its<br />
financial obligations as they fall due. at 31 December <strong>2008</strong>, tts has<br />
an unused bank overdraft of nOK 325 million.<br />
tts is exposed to a considerable currency risk through its high<br />
degree of export. the group’s primary trading currencies are euro<br />
and UsD. tts’ policy is to limit currency risk through hedging all<br />
contractual revenue.<br />
operational riSK<br />
the group’s deliveries are primarily organised in the form of<br />
projects. Uncertainty in the ship building industry has resulted in<br />
cancellations and delays of deliveries, and the likelihood of further<br />
cancellations and delays is still present. tts has a large contract<br />
with ability drilling consisting of 9 rigs for onshore use. this has<br />
been a challanging project and the customer had no total financing<br />
for the project by the end of <strong>2008</strong>. the uncertainty in the market<br />
has increased sinse the year end, which is the cause to the depreciation<br />
of the ability Drilling contract in <strong>2008</strong>.<br />
the situation in the market is being closely monitored, and tts<br />
is continuously working at reducing the group’s exposure to loss in<br />
the event of cancellations.<br />
51
4-8 T T S G r o u P<br />
9-11 rEPorT FroM THE CEo<br />
12-37 B u S i n E S S a r E a S<br />
38-47 CorPoraTE GoVErnanCE<br />
48-110 director’S report and accountS<br />
organisation<br />
orGaniSation and environment<br />
the number of employees in the tts <strong>Group</strong> increased by 62 persons<br />
to 1 236 persons. In the three joint venture companies, manning<br />
increased from 361 to 418.<br />
absence due to illness was 2.4 percent in <strong>2008</strong>, compared to<br />
3.2 percent in 2007. twelve minor personal injuries were reported<br />
during the year, compared to 20 in 2007. the number of days of<br />
absence due to personal injuries in 2007 was 83. a key area for<br />
continuous improvement is work within Health, safety and<br />
environment (Hse).tts has prepared its own Hse Handbook,<br />
which has been translated into most of the languages native to the<br />
group’s employees.<br />
tts has put down considerable resources in establishing a crossborder<br />
connection between the managers and employees. through<br />
a process involving all companies and divisions, we have examined<br />
and established our core values, integrity, openness, loyalty and<br />
initiative. Our core values shall influence tts’s activities, so that<br />
they contribute to cooperation and progress for each and everyone<br />
in the tts <strong>Group</strong>.<br />
the work to increase cooperation and interaction between<br />
divisions and companies has high priority in order to achieve<br />
synergistic effects with regard to revenue and cost. this work has<br />
been organised in various project groups with a high degree of<br />
involvement by the operative units. the priority areas are marketing<br />
and sales support, purchasing, technical operation, as well as<br />
service and after sales support. With regard to service and after<br />
sales support, evaluation and discussions of how tts may increase<br />
its activities in the aftermarket on a long term basis has led to<br />
the organisation of this business areas in a new division as of 2009;<br />
the services division.<br />
tts works systematically to increase the level of quality on all<br />
deliveries. For several years there has been an ongoing process of<br />
quality control in the group, and our aim is for all tts companies<br />
to be IsO-certified by the end of 2009.<br />
the tts <strong>Group</strong>’s activities are primarily related to design, engineering,<br />
assembly and testing of equipment. assembly and testing<br />
of tts products is based on a very limited use of chemicals harmful<br />
to human health or to the environment.<br />
the products supplied by tts are primarily electro-hydraulically<br />
powered, and there is little risk of environmental pollution. the<br />
tts <strong>Group</strong>’s operations are not regulated by licenses or regulatory<br />
orders.<br />
52<br />
equal opportunitieS<br />
tts aims to ensure equal working conditions, equal opportunities<br />
and equal treatment regardless of gender, religion or ethnic background.<br />
the aim is equal treatment of all with regard to recruitment,<br />
remuneration and promotion.<br />
among tts’s employees, most of them have engineering<br />
expertise. Women are typically underrepresented in this field; of<br />
the total workforce of 1 236 employees, 257 of these, constituting<br />
20.8 percent (18.1 percent in norway), are women. 185 of the<br />
women in tts hold positions within administration, finance or sales<br />
and marketing, giving a 35.4 percentage of women within these<br />
functions.<br />
three of the seven board members of tts Marine asa are<br />
women; two of these were elected by the shareholders and one was<br />
elected by the employees.<br />
among the group management of nine persons, one is a woman.<br />
neW manaGerS in <strong>2008</strong><br />
On 1 October <strong>2008</strong>, Lennart svensson was appointed head of the<br />
Port and Material Handling division, following Göran Johansson’s<br />
retirement. svensson is a Mechanical engineer, and has been<br />
Managing Director of tts Port equipment aB in Gothenburg<br />
since its establishment in 2005. Prior to this, he was Marketing<br />
Director of tts ships equipment aB, and svensson has for most<br />
of his working career been involved in marine cargo handling.<br />
Margrethe Hauge, who started in tts in <strong>2008</strong> in charge of the<br />
group’s aftermarket activities, is as of 1 January 2009 appointed as<br />
head of the new services division.<br />
Mette Henriksen is acting chief Financial Officer, in place of<br />
Olav Bruåsdal, who is absent due to illness, and she is part of group<br />
management.<br />
corporate governance<br />
introduction<br />
a more detailed account of the applicable principles for corporate<br />
governance is provided on page 41-43 in this annual report.<br />
the same applies to election of a new Board of Directors and nominating<br />
committee at the annual General Meeting on 22 May <strong>2008</strong>,<br />
as well as the employees’ election of members to the Board.<br />
capital Structure<br />
at the start of the year, the company’s capital structure was nOK<br />
12 869 140 divided into 25 738 279 shares at a value nOK 0.50.
In accordance with the resolution adopted at the annual General<br />
Meeting on 30 May 2006, the Board has issued 340 000 purchase<br />
options, of which 170 000 options were exercised in May <strong>2008</strong> at<br />
a rate of nOK 35 each.<br />
at the annual General Meeting on 22 May <strong>2008</strong>, the Board was<br />
granted authority to increase the company’s share capital with up to<br />
nOK 2 million, by issuing 4 000 000 shares at a nominal value of<br />
nOK 0.50. the Board was furthermore given authority to increase<br />
the company’s share capital for the benefit of the company’s<br />
employees with up to nOK 210 000 by issuing 420 000 shares each<br />
at a nominal value of nOK 0.50.<br />
future prospects<br />
the financial crisis and subsequent crisis in the market economy,<br />
places particular demands on management and control of operations<br />
in tts. the Board considers the situation to be uncertain. the<br />
downturn in the shipbuilding. market was expected, and formed<br />
the basis for the group’s targeting of the marine maintenance<br />
market. at the start of the new year, a new division, the services<br />
division, was established to facilitate this targeting. Furthermore,<br />
the group has used considerable resources on developing a new<br />
business segment within oil and gas. consequently, the Board<br />
maintains its faith in continued progress for tts – based on a solid<br />
Bergen, 27 april 2009<br />
the Board of tts Marine asa<br />
order backlog and healthy level of activity in several of the group’s<br />
markets. the crisis has resulted in more favourable prices on raw<br />
materials and components used by tts for their products.<br />
tts has the structure and flexibility to enable the group to adapt<br />
to changes in activity levels. at the end of <strong>2008</strong>, approximately<br />
20 percent of the work force was contracted personnel. tts is<br />
already in the process of reducing the number of contractors in<br />
parts of the group.<br />
In the long term, our markets will depend on the rate of investment<br />
and will to invest within the maritime sector and the oil<br />
and gas sector.<br />
allocation of annual profit for ttS marine aSa<br />
In <strong>2008</strong>, the tts <strong>Group</strong>’s net profit was nOK 36.4 million. the<br />
equity capital at 31 December <strong>2008</strong> was nOK 989.1 million.<br />
tts Marine asa’s net profit in <strong>2008</strong> was nOK -2.5 million, and<br />
the equity capital at 31 December was nOK 877.7 million.<br />
Based on the unstable economic situation internationally, the<br />
Board proposes that tts Marine asa’s result for <strong>2008</strong> in its<br />
entirety is allocated and employed as Other equity capital.<br />
accordingly, the Board proposes that no dividend shall be paid<br />
out to the shareholders.<br />
Birger skeie anne Breive<br />
cHaIrMan DIrectOr<br />
nils Olav aardal Bjarne skeie<br />
DIrectOr DIrectOr<br />
Olav smeland anne-Karin Bedringås<br />
DIrectOr DIrectOr<br />
Kjerstin Fyllingen Johannes D. neteland<br />
DIrectOr PresIDent & ceO<br />
53
4-8 T T S G r o u P<br />
9-11 rEPorT FroM THE CEo<br />
12-37 B u S i n E S S a r E a S<br />
38-47 CorPoraTE GoVErnanCE<br />
48-110 director’S report and accountS<br />
54
consolidated profit and loss account<br />
ttS <strong>Group</strong><br />
1 january - 31 december<br />
<strong>TTS</strong> GrouP 4-8<br />
rEPorT FroM THE CEo 9-11<br />
BuSinESS arEaS 12-37<br />
CorPoraTE GoVErnanCE 38-47<br />
director’S report and accountS 48-110<br />
(aMounTS in noK 1000) iFrS iFrS<br />
<strong>2008</strong> 2007<br />
oPEraTinG inCoME noTES<br />
income from projects 1, 2 4 176 497 2 452 225<br />
other operating income 19 985 7 739<br />
Total operating income 4 196 482 2 459 964<br />
oPEraTinG CoST<br />
Cost of sales 3 333 041 1 757 915<br />
Personnel costs 4, 5 448 051 341 697<br />
Depreciation of tangible fixed assets 6, 7 30 496 17 187<br />
other depreciations/write-downs 8 347 15 944<br />
other operating costs 18 283 726 207 087<br />
losses on accounts receivable 3 917 829<br />
income from investments in joint ventures 10 -17 712 -15 331<br />
Total operating expenses 4 081 866 2 325 328<br />
operating profit 114 616 134 636<br />
FinanCial inCoME anD ExPEnSES<br />
other interest income 22 18 107 9 930<br />
other financial income 22 28 067 11 749<br />
other interest expenses 22 -89 663 -42 258<br />
other financial expenses 22 -34 307 -16 489<br />
net financial items -77 797 -37 068<br />
profit before income tax 36 819 97 568<br />
income tax expences 14 427 18 527<br />
net profit for the year 36 392 79 041<br />
Earnings per share (noK) 23 1.41 3.40<br />
Diluted earnings per share (noK) 23 1.41 3.37<br />
55
4-8 T T S G r o u P<br />
9-11 rEPorT FroM THE CEo<br />
12-37 B u S i n E S S a r E a S<br />
38-47 CorPoraTE GoVErnanCE<br />
48-110 director’S report and accountS<br />
balance sheet<br />
ttS <strong>Group</strong><br />
aSSetS<br />
(aMounTS in noK 1 000) iFrS iFrS<br />
31.12.08 31.12.07<br />
fixed assets noTES<br />
Deferred tax assets 14 74 793 43 648<br />
inTanGiBlE FixED aSSETS<br />
research and development 7 236 838 167 337<br />
licences and patents 7 9 654 3 107<br />
other intangible fixed assets 7 4 097 4 619<br />
Goodwill 7 954 614 856 691<br />
Total intangible fixed assets 1 205 203 1 031 754<br />
TanGiBlE FixED aSSETS<br />
land 6 14 673 15 466<br />
Buildings 6 29 288 16 876<br />
Machinery and vehicles 6 24 785 8 783<br />
Furniture, office-, and computer equipment 6 55 950 37 192<br />
Total tangible fixed assets 124 696 78 317<br />
FixED aSSET inVESTMEnTS<br />
investments in joint ventures 10, 19 87 407 57 022<br />
investments in shares and other financial instruments 8 1 945 2 153<br />
other receivables 11 3 400 1 891<br />
Pensions 5 11 362 792<br />
Total fixed asset investments 104 114 61 858<br />
total fixed assets 1 508 802 1 215 577<br />
current assets<br />
inventories 3 212 828 100 582<br />
Work in progress 3 33 105 30 680<br />
Total inventories 245 933 131 262<br />
aCCounTS rECEiVaBlE<br />
receivables from customers 11 732 239 423 867<br />
other receivables 11 468 076 137 500<br />
accrued, non-invoiced production 2 884 156 596 638<br />
Financial derivatives 20 70 360 53 988<br />
Prepayments to suppliers 2 203 922 189 984<br />
Total receivables 2 358 282 1 401 977<br />
Bank deposits, cash in hand, etc. 15 267 233 353 138<br />
total current assets 2 871 919 1 886 377<br />
total assets 4 380 721 3 101 954<br />
56
equity and liabilitieS<br />
(aMounTS in noK 1000) iFrS iFrS<br />
31.12.08 31.12.07<br />
equity noTES<br />
Share capital 16 12 954 12 869<br />
Company’s own shares 16 -67 -2<br />
Share premium reserve 16 122 891 611 580<br />
other equity 16 853 278 309 149<br />
total equity 989 056 933 596<br />
liabilities<br />
ProViSionS For liaBiliTiES anD CHarGES<br />
Deferred tax 14 33 560 25 712<br />
Total provisions for liabilities and charges 33 560 25 712<br />
oTHEr lonG-TErM liaBiliTiES<br />
Debt to financial institutions 12, 13 532 297 563 166<br />
Total other long-term liabilities 532 297 563 166<br />
CurrEnT liaBiliTiES<br />
Debt to credit institutions 13, 15 244 634 46 634<br />
Payables to suppliers 607 375 290 989<br />
income tax payable 14 4 211 14 657<br />
other taxes payable 44 775 34 171<br />
Prepayments from customers 2 931 910 570 445<br />
non-invoiced production costs, suppliers 2 72 102 273 715<br />
Financial derivatives 20 351 342 20 480<br />
other current liabilities 17, 21 569 459 328 388<br />
Total current liabilities 2 825 808 1 579 479<br />
total liabilities 3 391 664 2 168 357<br />
total equity and liabilities 4 380 721 3 101 954<br />
Bergen, 27 april 2009<br />
The Board of <strong>TTS</strong> Marine aSa<br />
Birger Skeie anne Breive nils aardal Bjarne Skeie<br />
CHairMan DirECTor DirECTor DirECTor<br />
olav Smeland anne-Karin Bedringås Kjerstin Fyllingen Johannes D. neteland<br />
DirECTor DirECTor DirECTor PrESiDEnT & CEo<br />
57
4-8 T T S G r o u P<br />
9-11 rEPorT FroM THE CEo<br />
12-37 B u S i n E S S a r E a S<br />
38-47 CorPoraTE GoVErnanCE<br />
48-110 director’S report and accountS<br />
consolidated equity Statement<br />
ttS <strong>Group</strong><br />
(ifrS)<br />
Share<br />
Share Own premium- Other<br />
(aMounTS in noK 1 000) noTES capital shares reserve equity Total<br />
equity as of 1 january 2007 11 246 -3 318 550 268 268 598 062<br />
Dividends 0 0 0 -22 493 -22 493<br />
Company’s own share 0 1 0 -165 -163<br />
new issue 16 1 623 0 299 980 0 301 602<br />
new issue expenses 16 0 0 -9 377 0 -9 377<br />
options cost 16 0 0 2 427 0 2 427<br />
Currency differences 25 0 0 0 -15 503 -15 503<br />
net profit for the year 0 0 0 79 041 79 041<br />
equity as of 31 december 2007 12 869 -2 611 580 309 149 933 596<br />
Depreciation of share premium account 0 0 -500 000 500 000 0<br />
Dividends 0 0 0 -32 173 -32 173<br />
Company’s own share 0 -65 0 -2 850 -2 915<br />
new issue 16 85 0 5 865 0 5 950<br />
new issue expenses 16 0 0 0 0 0<br />
options cost 16 0 0 5 447 0 5 447<br />
Currency differences 25 0 0 0 42 758 42 758<br />
net profit for the year 0 0 0 36 392 36 392<br />
equity as of 31 december <strong>2008</strong> 12 954 -67 122 892 853 275 989 056<br />
58
consolidated cash flow Statement<br />
ttS <strong>Group</strong><br />
1 january - 31 december<br />
(aMounTS in noK 1 000)<br />
<strong>2008</strong> 2007<br />
cash flow from operations<br />
net profit for the year 36 819 97 568<br />
Tax paid during the period -36 806 -14 092<br />
Depreciation 30 497 17 340<br />
other depreciations/write-downs 347 15 943<br />
net change in project accruals 219 861 -162 444<br />
interest cost 89 663 42 258<br />
Share of gain from associated companies -17 712 -15 331<br />
Foreign currency gains/losses on loans 0 4 333<br />
Difference between pension charges and payments to/from pension schemes -7 720 -2 963<br />
inventories, customer receivables and payables to suppliers -106 657 256 497<br />
other receivables and other short-term liabilities -123 924 -216 518<br />
net cash flow from operations 84 368 22 591<br />
cash flow from investments<br />
acquisition of subsidiaries (less cash balances in subsidiaries) -70 000 -566 946<br />
receipts from sale of fixed assets 0 542<br />
Disbursements for acquisition of tangible fixed assets -67 701 -12 682<br />
acquisition of intangible fixed assets -72 507 0<br />
Payments on other claims (loans) -1 509 4 835<br />
Foreign currency gains/loss related to investments -3 968 0<br />
net cash flow from investments -215 685 -574 251<br />
cash flow from financing<br />
receipts from new short-term/long-term debt 0 500 000<br />
repayment of short-term/long-term debt -24 976 -113 492<br />
net change in bank overdraft 181 179 11 786<br />
Dividends paid to to company shareholders -32 173 -22 493<br />
interest paid -89 663 0<br />
Paid-in equity 3 035 292 063<br />
net cash flow from financing 37 402 667 864<br />
net change in cash and cash equivalents -93 915 116 204<br />
Cash and cash equivalents at the start of the period 353 138 236 934<br />
Foreign currency effect on cash and cash equivalents 8 008 0<br />
Cash and cash equivalents at the end of the period 267 231 353 138<br />
This consists of:<br />
Bank deposits 267 231 353 138<br />
59
4-8 T T S G r o u P<br />
9-11 rEPorT FroM THE CEo<br />
12-37 B u S i n E S S a r E a S<br />
38-47 CorPoraTE GoVErnanCE<br />
48-110 director’S report and accountS<br />
accounting principles<br />
ttS <strong>Group</strong><br />
1. General information<br />
<strong>TTS</strong> is a global company that creates and supplies innovative systems<br />
and equipment to the Marine and offshore industries.<br />
The operations are organised into the following divisions: Dry Cargo<br />
Handling, Marine Cranes, Port and Material Handling, Deck Machinery<br />
and Drilling Equipment. <strong>TTS</strong> is among the world’s leading suppliers in<br />
its market segments.<br />
<strong>TTS</strong> Marine aSa is registered and domiciled in norway, and the head<br />
office is located in Bergen. The group has companies in norway,<br />
Sweden, Germany, Finland, China, the uS, the Czech republic, italy,<br />
Canada, Singapore as well as offices in Korea and Vietnam. The company<br />
is listed on the oslo Stock Exchange. This consolidated accounts were<br />
approved by the Board on 27 april 2009.<br />
STruCTural CHanGES<br />
at 25 May 2007 <strong>TTS</strong> Marine aSa acquired 100 per cent of the shares<br />
in Sense EDM in Kristiansand, norway. The corporate figures have not<br />
been changed as a result of the acquisition.<br />
2. accounting principles<br />
The most important accounting principles applied in the preparation of<br />
the consolidated accounts are described below. These principles have<br />
been applied identically to all the periods that are presented unless<br />
otherwise stated in the description.<br />
2.1 basic principles<br />
The consolidated accounts for <strong>TTS</strong> Marine aSa <strong>Group</strong> have been prepared<br />
in accordance with international reporting Standards (iFrS) as adopted<br />
by the European union. Discretionary standards and interpretations as at<br />
31.12.08 have not been implemented.<br />
The consolidated accounts have been prepared on the basis of the<br />
principle of historic costs, with the following modifications: shares held<br />
available for sale and financial derivatives are obligations estimated to<br />
actual value in the profit and loss accounts.<br />
Preparation of the accounts according to iFrS requires the use of estimates.<br />
Furthermore, application of the company’s accounting principles<br />
requires that management perform evaluations. areas that to a great<br />
extent involve such evaluations or high degree of complexity, or areas<br />
where assumptions and estimates are material to the consolidated<br />
accounts, are described in note 4.<br />
a ) i n T E r P r E T a T i o n S E F F E C T i V E a S o F 2 0 0 8<br />
iFriC 14, iaS19 – The limit on a defined benefit asset, minimum funding<br />
requirements and their interactions, provides guidelines for the evaluation<br />
of the amount of over-financing that may be recognised in the<br />
balance sheet as assets in accordance with iaS 19. it further explains<br />
how pension funds or pension obligations may be affected by statutory<br />
or contractual requirements to financing. This interpretation has no<br />
effect on the group, as the group has a net pension obligation by<br />
60<br />
the fact that its net pension obligation is lower than the present<br />
value of the net pension obligation and is not subject to the minimum<br />
requirement to financing.<br />
iFriC 11, iFrS 2 - <strong>Group</strong> and treasury share transactions, provides<br />
guidelines as to whether share based transactions that involve own<br />
shares or shares in associated companies (such as options for shares in<br />
the parent company) shall be recognised as settled by equity instruments<br />
or by cash in the company accounts of the parent company and each<br />
individual associate company. This interpretation has no effect on the<br />
consolidated accounts.<br />
B ) i n T E r P r E T a T i o n S E F F E C T i V E i n 2 0 0 8 , B u T n o T r E l E V a n T<br />
T o T H E G r o u P<br />
The following interpretations of published standards are mandatory for<br />
periods that begin on 1 January <strong>2008</strong> or later, but are deemed to be<br />
of no relevance to the group:<br />
• IFRIC 12, Service concession arrangements<br />
C ) S Ta n D a r D S , a M E n D M E n T S a n D i n T E r P r E TaT i o n S To E x i S T i n G<br />
S Ta n D a r D S T H aT H aV E n oT Y E T E n T E r E D i n To F o r C E a n D<br />
W H E r E T H E G r o u P H a S C H o S E n n oT To i M P l E M E n T E a r lY<br />
a P P l i C aT i o n<br />
The following standards, amendments and interpretations to existing<br />
standards have been published and will be mandatory for the group for<br />
annual periods beginning on 1 January 2009 or later, but the group has<br />
chosen not to implement early application. The effect of implementation<br />
of standards, amendments and interpretations, beyond what is discussed<br />
above, is currently being assessed by the group.<br />
• IFRS 8, Operating Segments replaces IAS 14 (effective as of<br />
1 January 2009). The new standard requires use of a managerial<br />
approach where segment information is presented in the same way<br />
as in internal reporting. The new standard will entail no significant<br />
change to the group’s reporting, as segment reporting at 31.12.<strong>2008</strong><br />
essentially corresponds to internal reporting in the group.<br />
• IAS 23 (amended) Borrowing cost (effective as of 1 January 2009).<br />
• IAS 1 (revised) Presentation of financial statements (effective as<br />
of 1 January 2009). The revision entails presentation of a separate<br />
statement for the total result, Comprehensive income, which at<br />
present is presented in the equity capital statement.<br />
• IFRS 2 (revised), Share-based payments (effective as of 1 January<br />
2009).<br />
• IAS 32 (revised), Financial instruments; presentation and IAS 1<br />
(revised), Presentation of financial statements – Puttable financial<br />
instruments and obligations arising on liquidation (effective as of<br />
1 January 2009). Presumed at present to be of no relevance to the<br />
group.<br />
• IFRS 1 (revised), First time adoption of IFRS and IAS 27 (revised),<br />
Consolidated and separate financial statements. (effective as of<br />
1 January 2009) The amendment in iFrS 1 will not have any effect<br />
on the consolidated accounts as this as of 31.12.<strong>2008</strong> is prepared<br />
in accordance with iFrS.
4-8 T T S G r o u P<br />
9-11 rEPorT FroM THE CEo<br />
12-37 B u S i n E S S a r E a S<br />
38-47 CorPoraTE GoVErnanCE<br />
48-110 director’S report and accountS<br />
• IAS 27 (revised), Consolidated and separate financial statements<br />
(effective as of 1 July 2009)<br />
• IFRS 3 (revised), Business combinations (effective as of 1 July 2009)<br />
• IFRS 5 (revised), Non-current assets held for sale and discontinued<br />
operations (and delegated amendments in iFrS 1, First-timeadoption<br />
(effective as of 1 July 2009)<br />
• IAS 28 (revised), Investments in associates (and delegated amendments<br />
in iaS 32, Financial instruments; Presentations, and iFrS 7,<br />
Financial instruments. Disclosures.<br />
• IAS 36 (revised), Impairment of assets (effective as of 1 January<br />
2009)<br />
• IAS 38 (revised), Intangible assets (effective as of 1 January 2009)<br />
• IAS 19 (revised), Employee benefits (effective as of 1 January 2009)<br />
• IAS 39 (revised), Financial Instruments; Recognition and measurement<br />
(effective as of 1 January 2009)<br />
• IFRIC 16, Hedges of a net investments in a foreign operation<br />
(effective as of 1 october <strong>2008</strong>)<br />
2.2 consolidation principles<br />
a) SuBSiDiariES<br />
Subsidiaries are all the units where the group has a controlling influence<br />
over the unit’s financial and operational strategy, normally through<br />
ownership of more than half of the voting capital. Subsidiaries are<br />
consolidated from the point in time when control is transferred to the<br />
group and eliminated from consolidation when such control ends.<br />
The purchase method of accounting is used for the acquisition of subsidiaries.<br />
The historical acquisition cost is measured as the fair value of<br />
the compensation. identifiable assets acquired and liabilities assumed<br />
are recorded at fair value at the time of the acquisition in the accounts.<br />
The portion of the historical cost that exceeds the fair value of identifiable<br />
net assets in the subsidiary is recognised on the balance sheet as<br />
goodwill. if historical cost is lower than fair value of identittiable net<br />
assets in the subsidiary, the difference is recognised in profit and loss<br />
account at the time of acquisition (se article 2.6).<br />
all intragroup transactions, outstanding accounts and unrealised gains<br />
between group companies are eliminated. The accounting principles in<br />
subsidiaries are changed as required to achieve compliance with the<br />
group’s accounting principles.<br />
B) JoinT VEnTurES<br />
Joint ventures are units where the group has a controlling influence<br />
together with other parties, but not alone. investments in joint ventures<br />
are recorded in the accounts in accordance with the equity method.<br />
investments in joint ventures companies are recorded in the accounts<br />
at the historical cost at the time of acquisition and include goodwill<br />
(which is reduced by any subsequent write-downs) (see article 2.6).<br />
The group’s share of the profit or loss in joint ventures is recognised<br />
in the profit and loss account and added to the book value of the<br />
investments together with the share of equity changes not recognised<br />
in the profit and loss account. The group does not recognise its share<br />
62<br />
of the losses in the profit and loss account if this entails that the book<br />
value of the investment becomes negative (including unsecured claims<br />
against the unit), unless the group has assumed liabilities or granted<br />
guarantees for the joint venture company’s liabilities.<br />
The group’s share of unrealised gains on transactions between the group<br />
and its joint venture companies are eliminated. The same applies to<br />
unrealised losses unless the transaction indicates a write-down of the<br />
asset transferred. The accounting principles in joint ventures have been<br />
changed as required to achieve compliance with the group’s accounting<br />
principles.<br />
2.3 Segment information<br />
a business segment is a portion of the business operations that delivers<br />
products or services that are subject to a risk and return that are distinct<br />
from that of other business areas. The group’s primary reporting format<br />
is business segment.<br />
a geographic market (segment) is a portion of the business operations<br />
that delivers products or services within a limited geographic area that<br />
are subject to a risk and return that are distinct from that of other<br />
geographic markets. The secondary reporting segment is geographical<br />
segment.<br />
2.4 foreign currency translation<br />
a) FunCTional anD PrESEnTaTion CurrEnCiES<br />
The accounts of the individual units in the group are measured in the<br />
currency that is used primarily in the economic area where the unit<br />
operates (functional currency). The consolidated accounts are presented<br />
in norwegian kroner (noK), which is both the functional and presentation<br />
currency for the parent company.<br />
B) TranSaCTionS anD BalanCE SHEET iTEMS<br />
Transactions involving foreign currencies are translated into the functional<br />
currency using the exchange rates that are in effect at the time of<br />
the transactions. Foreign currency gains and losses that arise from the<br />
payment of such transactions and the translation of monetary items<br />
(assets and liabilities) in foreign currencies at the rates in effect on the<br />
date of the balance sheet are recognised in the profit and loss account.<br />
C) GrouP CoMPaniES<br />
The profit and loss account and balance sheet for group units with<br />
a functional currency different than the presentation currency are<br />
translated as follows:<br />
i. balance sheet is translated at the closing rate on the date<br />
of the balance sheet<br />
ii. profit and loss account is translated at the average rate during<br />
the year<br />
iii. translation differences are entered directly against equity and<br />
specified separately<br />
Goodwill associated with the acquisition of a foreign unit are allocated<br />
to the acquired unit and translated at the rate in effect on the date of<br />
the balance sheet. This is for acquisitions from 2004 and later.
2.5 tangible fixed assets<br />
Tangible fixed assets are recorded in the accounts at historical cost less<br />
depreciation. The historical cost includes the costs directly related to<br />
the acquisition of the fixed asset.<br />
Subsequent expenses are added to the value of the fixed asset on the<br />
balance sheet or recorded separately on the balance sheet, when it is<br />
probable that the future economic benefits associated with the expense<br />
will accrue to the group and the expense can be measured reliably.<br />
other repair and maintenance costs are recorded in the profit and loss<br />
account in the period when the expenses are incurred.<br />
land is not depreciated. other fixed assets are depreciated based on<br />
the straight-line method, so that the historical cost of the fixed asset<br />
is depreciated to the residual value over the expected time of use:<br />
Buildings 50 years<br />
Machinery and vehicles 3-5 years<br />
Fixtures/office equipment 5 years<br />
Computer equipment 3 years<br />
Depreciation or tangible fixed assets is recognised on a separate line in<br />
the profit and loss account.<br />
When the book value of the fixed asset is higher than the estimated<br />
recoverable amount, the value is written down to the recoverable<br />
amount.<br />
Gains and losses on disposals are recognised in the profit and loss<br />
account and represent the difference between the sales price and book<br />
value.<br />
The need for write down is taken into continuous evaluation by supervision<br />
of indicators.<br />
2.6 intangible fixed assets<br />
a) GooDWill<br />
Goodwill is the difference between the historical cost of the acquisition<br />
of a business and the fair value of the group’s share of the net identifiable<br />
assets in the business at the time of the acquisition. analysis<br />
of acquisition distributes added values between goodwill and other<br />
assets.<br />
Goodwill from the acquisition of subsidiaries is classified as an<br />
intangible fixed asset. Goodwill associated with the acquisition of<br />
an interest in joint ventures is included in the investments in joint<br />
ventures according to equity method. Goodwill is tested annually for<br />
impairment in value and recorded on the balance sheet at historical<br />
cost less write-downs. The write-down of goodwill is not reversed.<br />
B) PaTEnTS, TECHnoloGY anD DEVEloPMEnT<br />
Patents and technology have a limited useful life and are recorded<br />
at historical cost on the balance sheet less depreciation. Patents and<br />
technology are depreciated by the straight-line method over their<br />
expected useful life (2 to 15 years).<br />
Development costs associated with market surveys, market development<br />
and the development of new products are normally charged<br />
against operating income as they are incurred. order-related development<br />
is charged directly to the projects. For certain special projects<br />
the development costs are capitalised, cf. note 8. in such cases the<br />
development costs are depreciated over their expected useful life<br />
(2 to 15 years).<br />
Depreciation of intangible fixed assets is recognised on a separate line<br />
in the profit and loss account.<br />
2.7 financial assets<br />
The group classifies financial assets into the following categories:<br />
(a) loans and receivables<br />
(b) assets available for sale (investments in shares)<br />
(c) assets to fair value over result ( derivatives)<br />
a) loanS anD oTHEr rECEiVaBlES<br />
loans and receivables are classified as current assets unless they mature<br />
later than 12 months after the date of the balance sheet. in this case<br />
they are classified as fixed assets. loans and other are assessed to<br />
nominal value reduced by a provision for bad debt.<br />
B) aSSETS aVailaBlE For SalE (inVESTMEnTS in SHarES)<br />
investments in shares are included in the fixed assets unless the<br />
manage ment intends to sell the investment within 12 months from<br />
the date of the balance sheet.<br />
investments are assessed at fair value on balance day. Possible<br />
changes in fair value are entered directly against equity.<br />
By possible sale are or written downs the entire value adjustment<br />
entered against equity is recognised in the profit and loss account<br />
as a gain or loss from investments in securities.<br />
C) aSSETS To Fair ValuE oVEr rESulT<br />
See 2.9<br />
2.8 leases<br />
leases of property, plant and equipment where the <strong>Group</strong> has substantially<br />
all the risks and rewards of ownership, are classified as finance<br />
leases. Finance leases are capitalized at the inception of the lease at<br />
the lower of the fair value of the leased property or the present value<br />
of the minimum lease payments.<br />
lease payments are apportioned between the finance charges and<br />
reduction of the lease liability.<br />
Property, plant and equipment acquired under finance leases are<br />
depreciated over the shorter of the useful life of the asset or the lease<br />
term.<br />
leases where a significant portion of the risks and rewards of<br />
ownership are retained by the lessor are classified as operating leases.<br />
Payment made under operating leases is charged to the income statement<br />
on a straight-line basis over the period of the lease.<br />
63
4-8 T T S G r o u P<br />
9-11 rEPorT FroM THE CEo<br />
12-37 B u S i n E S S a r E a S<br />
38-47 CorPoraTE GoVErnanCE<br />
48-110 director’S report and accountS<br />
2.9 derivatives and hedging<br />
in accordance with adopted guidelines and the group’s strategy, the<br />
group utilises hedging of contractual income in a foreign currency at<br />
the date of signature of the contract. The same may apply to individual<br />
larger sub-contracts in foreign currencies.<br />
a C T u a l V a l u E H E D G i n G<br />
Derivatives are recognised on the balance sheet at actual value at the<br />
date of entry of the forward currency contract, and subsequently on a<br />
continuous basis at actual value. The group only enters into forward<br />
currency contracts that qualify for actual value hedging.<br />
at the start of the hedging transaction, the group documents the<br />
relation between hedging instruments and hedge objects. Furthermore,<br />
the group documents whether the derivatives used are efficient in<br />
balancing changes to the actual value related to the hedge objects.<br />
Such evaluations are documented both at the start of the hedge and<br />
continuously during the hedging period.<br />
actual value of the derivatives used for hedging are set out in note 20.<br />
actual value of the derivatives is classified as current assets or shortterm<br />
liabilities, as the hedges and derivatives in all material aspects fall<br />
due within 12 months.<br />
Changes to actual value of the derivatives are passed to the income<br />
statement together with changes to actual value related to the associated<br />
hedged asset or obligation. The impact on the result is posted<br />
to operating income if it is related to hedging of contractual income<br />
and to operating cost if it is related to hedging of contractual costs.<br />
The ineffective profit and loss related part of the hedge value is posted<br />
to operating income and operating cost together with the changes in<br />
value of derivatives.<br />
in the event that the hedge no longer fulfils the criteria for hedging<br />
accounting, the derivative is carried over at actual value to the result.<br />
This applies to derivatives where the underlying delivery contract has<br />
been cancelled.<br />
DEriVaTiVES aT aCTual ValuE in ProFiT anD loSS aCCounT<br />
Derivatives that do not fulfil the criteria for hedging accounting are<br />
carried over at actual value to the result. Changes to the actual value<br />
of the derivatives are recognised in the profit and loss statement as<br />
financial expenses and financial income.<br />
2.10 inventories<br />
inventories are valued at the lower of historical cost or net realisable<br />
value. The historical cost is calculated by means of the first-in, first-out<br />
principle (FiFo). For finished goods and work in progress, the historical<br />
cost consists of the product design expenses, consumption of materials,<br />
direct wage costs, other direct costs, and indirect production costs<br />
(based on a normal capacity level). loan costs are not included.<br />
64<br />
2.11 receivables from customers<br />
receivables from customers are recognised initially at nominal value<br />
considered to be fair value on the balance sheet, that is nominal value.<br />
For subsequent measurement receivables from customers are assessed<br />
at nominal value less provisions for losses that have incurred. Provisions<br />
for losses are recognised when there are objective indicators that the<br />
group will not receive settlement in accordance with the original terms.<br />
Considerable financial difficulties on part of the customer, likelihood of<br />
bankruptcy on part of the customer and significant delays on payment,<br />
are all deemed to be indicators of the need to write down accounts<br />
receivables. Changes in the provisions are recognised in the profit and<br />
loss account as losses on accounts receivable.<br />
receivables in foreign currency are converted to noK at the exchange<br />
rate on the balance sheet date.<br />
2.12 cash and cash equivalents<br />
Cash and cash equivalents consist of cash and bank deposits. Bank<br />
deposits in foreign currencies are assessed to the exchange rate of the<br />
balance sheet date. Withdrawals from the bank overdraft constitute<br />
part of current liabilities.<br />
2.13 Share capital and premium<br />
ordinary shares are classified as equity.<br />
Expenses that are directly attributable to the issuance of new shares or<br />
options less taxes are entered against the equity as a reduction in the<br />
proceeds.<br />
When the company’s own shares are purchased, the consideration, is<br />
entered as a reduction of the equity (attributable to the company’s<br />
shareholders). if the company’s own shares are subsequently sold<br />
or reissued, the proceeds are entered as an increase in the equity<br />
attributable to the company’s shareholders.<br />
2.14 loans<br />
loans are recorded at their fair value when they are disbursed, less any<br />
transaction costs. in subsequent periods, loans are recorded at their<br />
amortised cost, as calculated by means of the effective interest rate.<br />
The difference between the loan amount disbursed (less transaction<br />
costs) and the redemption value are recognised in the profit and loss<br />
account over the term of the loan.<br />
loans are classified as current liabilities unless there is an unconditional<br />
right to postpone payment of the debt by more than 12 months<br />
from the date of the balance sheet. The next years payment is classified<br />
as short term debt.<br />
2.15 accounts payable<br />
accounts payable are measured in actual value at the date of recognition<br />
in the balance sheet. upon subsequent measuring, accounts payable are<br />
valued at amortised cost using the method of effective interest rate.<br />
2.16 taxes<br />
Tax in the profit and loss account encompasses both the tax payable<br />
for the period and the change in deferred tax.
Deferred tax is calculated for all the temporary differences between the<br />
financial and tax values of assets and liabilities and tax losses carry<br />
forward. Temporary differences are only offset between the norwegian<br />
companies in the group. Deferred tax is determined by means of the<br />
tax rates and tax laws that have been adopted or essentially adopted<br />
on the date of the balance sheet, which are assumed to apply when the<br />
deferred tax asset is realised or when the deferred tax is settled.<br />
Deferred tax assets are recognised on the balance sheet provided future<br />
taxable income is probable and the temporary differences can be offset<br />
against this income.<br />
Deferred taxes are not calculated based on temporary differences from<br />
investments in subsidiaries and associated companies when the group<br />
controls the timing for the reversal of the temporary differences and it<br />
is probable that they will not be reversed in the foreseeable future.<br />
2.17 pension obligations, bonus schemes and other<br />
compensation schemes for employees<br />
a) PEnSion oBliGaTionS<br />
The companies in the group have different pension schemes. The pension<br />
schemes are financed in general by payments to insurance companies<br />
or pension funds, as determined by periodic actuarial calculations.<br />
The group has both defined contribution and defined benefit plans.<br />
a defined contribution plan is a pension scheme in which the group<br />
pays fixed contributions to a separate legal entity. The group does not<br />
have any legal or other obligation to pay additional contributions if<br />
this unit does not have sufficient funds to pay all employees benefits<br />
relating to their service in current and prior periods. a defined benefit<br />
plan is a pension scheme that is not a defined contribution plan. For<br />
defined contribution plans, the group pays contributions to publicly<br />
or privately administered pension insurance plans on a mandatory,<br />
contractual or voluntary basis. The group does not have any further<br />
payment obligations after the contributions have been paid. The<br />
contributions are recorded as a payroll expense in the accounts as<br />
they fall due. Contributions paid in advance are recognised as an asset<br />
in the accounts if the contribution can be refunded or reduce future<br />
payments. a defined benefit plan is typically a pension scheme that<br />
defines the pension payments employees will receive when they retire.<br />
Pension payments are normally dependent on one or more factors<br />
such as age, years of service for the company and salary level.<br />
The liability recorded on the balance sheet relating to defined benefit<br />
plans is the net present value of the defined benefits on the date of the<br />
balance sheet less the fair value of the pension assets and adjusted for<br />
unrecognised estimate deviations. The pension obligation is calculated<br />
annually by an independent actuary on the basis of a linear model. The<br />
net present value of the defined benefits is determined by discounting<br />
the estimated future payments at the interest rate for a bond issued by<br />
a company with high creditworthiness in the same currency as the<br />
benefits will be paid with a term that is approximately the same as the<br />
term of the associated pension obligation.<br />
Estimate deviations due to new information or changes in the actuarial<br />
assumptions in excess of 10 per cent of the value of the pension assets<br />
or 10 per cent of the pension obligations will be recorded in the profit<br />
and loss account over a period that corresponds to the employees’<br />
expected average remaining service lifetime.<br />
Changes in the pension plan’s benefits are entered as an expense or<br />
income on a current basis in the profit and loss account, unless the<br />
rights in accordance with the new pension plan are contingent on<br />
the employee remaining in service for a specified period of time<br />
(accrual period). in this case the cost related to the change in benefits<br />
is amortised linearly over the accrual period.<br />
The employer’s share of national insurance contributions are charged<br />
against income based on the pension premiums paid, as well as the<br />
accrued change in the net pension obligation.<br />
B) EMPloYEE oPTionS<br />
in accordance with authorities granted by the annual General Meeting,<br />
the management of the company has been granted options to purchase<br />
shares in the parent company. The fair value of allotted options is<br />
calculated as part of the salary cost with a corresponding increase<br />
in equity. The fair value is measured on the date of allotment and<br />
distributed over the intervals till the employee has worked up an<br />
unconditional right to exercise the options. Fair value of allotted<br />
options is estimated on the date of allotment using the Black & Sholes<br />
option pricing model. ref. note 16.<br />
C) GrouP BonuSES<br />
The group records a liability and a cost for any group bonuses. Whether<br />
the bonus shall be calculated and paid and the size of the bonus is<br />
dependent on the profit for the year. The bonus is paid to all of the<br />
employees in the following year.<br />
2.18 provisions<br />
The group recognises provisions for restructuring, legal requirements,<br />
etc., when: There is a legal or self-imposed obligation to do so as a<br />
result of earlier events, there is a preponderance of evidence that the<br />
obligation will be settled by a transfer of economic resources, and the<br />
size of the obligation can be estimated with an adequate degree of<br />
reliability.<br />
The group recognises provisions for expected guarantee liabilities<br />
based on experience and contract. additionally the group recognises<br />
provisions for remaining work or claims from the customer regarding<br />
long-term construction contracts.<br />
appropriations are measured at current value of excepted payments in<br />
order to fulfil the obligation. a pre-tax discount rate is used, reflecting<br />
the present market situation and risk specific to that obligation. an<br />
increase in the obligation due to altered time frame is recognised on<br />
the balance sheet as a financial cost.<br />
65
4-8 T T S G r o u P<br />
9-11 rEPorT FroM THE CEo<br />
12-37 B u S i n E S S a r E a S<br />
38-47 CorPoraTE GoVErnanCE<br />
48-110 director’S report and accountS<br />
2.19 recognition of income<br />
income from the sale of goods and services is assessed at the net fair<br />
value after the deduction of value added tax and possible rebates.<br />
The group’s income is related to long-term construction contracts,<br />
service contracts and after-sales.<br />
revenue from long-term production contracts are recognised in the<br />
balance sheet in accordance with guidelines in iaS 11 using the method<br />
of continues settlement, ref. item 2.20 for more detail. The group’s<br />
products are frequently sold with a warranty period of +/- two years.<br />
as for other matters, reference is made to information regarding<br />
guarantee liabilities in paragraph 4 and note 21.<br />
income connected to service contracts and after-sales is recognised<br />
in the period it is accrued. intragroup income is eliminated.<br />
interest income is recognised in the profit and loss account over<br />
time in accordance with the effective interest method. if receivables<br />
are written down, the book value of the receivables are reduced to<br />
the recoverable amount.<br />
2.20 construction contracts<br />
revenue from long-term manufacturing projects is allocated in step with<br />
the degree of progress of the project, if the outcome of the transaction<br />
can be estimated in a reliable manner, according to iaS 11. Progress is<br />
measured as accrued hours in comparison to total estimated hours, when<br />
reliable estimates are available. in some parts of the group, progress is<br />
measured against specific milestones.<br />
When the outcome of the transaction cannot be reliably estimated,<br />
only the revenue corresponding to accrued project costs will be entered<br />
as income. in the period where it is identified that a project will give a<br />
negative outcome, the estimated deficit on the contract will be fully<br />
allocated.<br />
Cost relating to manufacturing projects are allocated in step with<br />
the degree of progress on a level with the revenue. in the event that a<br />
major discrepancy between what is considered as actual progress and<br />
budgeted costs based on calculated degree of completion, the degree<br />
of competition will be adjusted so that it to a greater extent will<br />
correspond to the actual progress of the manufacturing project.<br />
upon establishing accrued costs for manufacturing contracts, purchasing<br />
relating to future activities of a contract will not be taken into<br />
account. The purchases/costs are posted as goods, advance payments<br />
or other liquid assets depending of type of costs.<br />
incurred costs and profit received related to all construction contracts<br />
in progress, where the incurred costs and profit received (less recognised<br />
losses) exceed the payments on account invoiced, will be recorded<br />
on the balance sheet as an asset. The asset is classified as accrued,<br />
non-invoiced production.<br />
if the payments on account invoiced for all the construction contracts<br />
in progress exceed the incurred costs and income recognised<br />
(less losses) this is presented as prepayments received from customers<br />
under short term liabilities.<br />
2.21 cash flow statement<br />
The cash flow statement has been prepared based on the indirect method.<br />
66<br />
3. financial risk management<br />
3.1 financial risk factors<br />
The <strong>TTS</strong> <strong>Group</strong>’s activities entail various types of financial risk; market<br />
risk (including currency risk and floating rate of interest risk), credit risk<br />
and liquidity risk.<br />
The Board has primary responsibility for the establishment and supervision<br />
of the group’s framework for risk management. The principles of<br />
risk management have been established in order to identify and analyze<br />
the risk to which the group is exposed. Principles and systems for risk<br />
management are regularly reviewed to reflect any changes in activities<br />
and market conditions.<br />
The auditing committee implements follow-up of managements’<br />
supervision of the group’s principles and procedures for risk management.<br />
The group’s main risk management plan focuses on the unpredictability<br />
of the capital market, and attempts to minimize its potentially negative<br />
effects on the group’s financial results.<br />
The group engages in international operations and is especially exposed<br />
to currency risk risk. The group makes use of hedging to reduce the risk<br />
of currency exposure. risk management routines are determined by the<br />
Board.<br />
The <strong>TTS</strong> <strong>Group</strong> has a decentralized structure with operational supervision<br />
of the various business units, where the main management of financial<br />
risk is determined by the Board. This applies to areas such as currency<br />
risk, interest rate risk, credit risk and use of financial derivatives.<br />
For the classification of financial assets and liabilities, reference is<br />
made to note 29.<br />
marKet riSK<br />
Market risk is the risk of changes to market prices, such as foreign<br />
exchange rates, interest and stock-exchange values, affecting the<br />
income or value of financial instruments. Management of market risk<br />
intends to supervise that risk exposure lies within a set framework.<br />
a) CurrEnCY riSK<br />
The <strong>TTS</strong> <strong>Group</strong> operates internationally and is exposed to currency risk<br />
in a number of foreign currencies. The consolidated accounts are to<br />
a great extent affected by the exchange rate of noK against SEK,<br />
uSD and Eur. The group endeavors to reduce the risk of exposure to<br />
exchange rate fluctuations by obtaining an optimal balance between<br />
incoming and outgoing payments in the same currency, in addition<br />
to forward exchange transactions at an acceptable exchange rate.<br />
Currency risk is to a large extent related to contracts for delivery that<br />
involve income and expenses in foreign currencies. Following contract<br />
signing, the guidelines are to sell and purchase foreign currencies on<br />
a forward exchange contract, to reduce the currency risk in cash flows<br />
designated in foreign currencies. With a production process based on<br />
the use of an international network of sub suppliers, purchases may<br />
further be optimized with regard to currency.<br />
in order to manage the currency risk of future trade transactions and<br />
assets and liabilities recognised in the balance sheet, the <strong>TTS</strong> <strong>Group</strong>’s<br />
units use forward exchange contracts. When necessary, forward<br />
exchange contracts are continued as they mature.<br />
These hedging activities meet the requirements of hedge accounting.<br />
interest on loans is in the currency corresponding with cash flows
generated by the underlying operations, primarily in Euro. This ensures<br />
financial hedging without the use of derivatives, and accordingly<br />
does not necessitate hedging.<br />
For other monetary assets and obligations in foreign currency,<br />
net exposure is kept at an acceptable level by purchasing and selling<br />
foreign currency at spot prices whenever necessary.<br />
The company has investments in foreign subsidiaries where net<br />
assets are exposed to currency risk at conversion of currency.<br />
See also note 25.<br />
SiGniFiCanT CurrEnCiES THrouGHouT THE YEar:<br />
Average exchange rates Spot prices<br />
Q1 Q2 Q3 Q4 31.12.08<br />
SEK 0.8512 0.8513 0.8483 0.8775 0.9042<br />
Eur 8.006 8.03 8.171 9.099 9.865<br />
uSD 5.2514 5.0862 5.4534 6.4125 6.9989<br />
SEnSiTiViTY analYSiS<br />
a 10 percent strengthening of the Euro against noK at year-end<br />
would have increased equity and result with the figures given below.<br />
The analysis is subject to other variables being constant.<br />
Equity Result<br />
after tax<br />
31 December <strong>2008</strong> 9.406 6.559<br />
31 December 2007 9.589 1.989<br />
a 10 percent weakning of the Euro against noK would have the same<br />
effect as regards to amount, only with the opposite denominator,<br />
subject to other variables being constant.<br />
a 10 percent strengthening of the SEK against noK at year-end would<br />
have increased equity and result with the figures given below. The<br />
analysis is subject to other variables being constant.<br />
Equity Result<br />
after tax<br />
31 December <strong>2008</strong> 28.770 6.022<br />
31 December 2007 26.643 6.932<br />
a 10 percent weakning of the SEK against noK would have the same<br />
effect as regards to amount, only with the opposite denominator,<br />
subject to other variables being constant.<br />
B) inTErEST raTE riSK<br />
The <strong>TTS</strong> <strong>Group</strong>’s interest-bearing debt is based on a floating rate of<br />
interest. This involves an interest rate risk for the group’s cash flow.<br />
The group’s surplus liquidity are in the form of bank deposits and not<br />
in liquid securities.<br />
any divergence from the use of a floating rate of interest and<br />
placement of surplus liquidity shall be determined by the Board.<br />
Entries exposed to interest rate risk are bank deposits and long-term<br />
liabilities.<br />
S E n S i T i V i T Y a n a lY S i S o F C a S H F l o W F o r i n S T r u M E n T S o F<br />
VariaBlE inTErEST<br />
The following table illustrates the group’s sensitivity to potential<br />
fluctuations in interest rate levels. Calculations take into account all<br />
interest-bearing entries. all effects will brought forward to the profit<br />
and loss account, as the company has no hedging instruments related<br />
to interest that will be directly charged to equity.<br />
The analysis is subject to other variables being constant.<br />
Fluctuations Effect Effect<br />
in interest rates on result on equity<br />
<strong>2008</strong> +/- 1 % point 5 285 0<br />
2007 +/- 1 % point 2 939 0<br />
Calculations are made on the basis of an average of net interest-<br />
bearing debt. For details of net interest bearing debt, see note 12.<br />
credit riSK<br />
Credit risk is the risk of financial losses should a customer or opposite<br />
party to a financial instrument become unable to fulfil his obligations<br />
according to contract.<br />
Credit risk is dealt with at a corporate level. Credit risk arises in<br />
transactions with derivatives, bank deposits and financial institutions,<br />
in addition to transactions with customers.<br />
Maximum risk exposure is represented by the extent of financial<br />
assets recognized in the balance sheet.<br />
The counterparty for pension resources is a norwegian insurance<br />
company, and risk related to this is regarded as minimal. The counterparties<br />
for derivates are banks, and the credit risk related to these is<br />
considered to be insignificant. The same applies to bank deposits.<br />
These days’ unrest in the financial markets entails an increased credit<br />
risk. in <strong>2008</strong>, the group implemented actions against increased risk<br />
by close monitoring of customers and suppliers.<br />
High-risk customers are monitored on a regular basis Historically, the<br />
group has had no substantial losses on accounts receivable.<br />
as of 31.12, the group had the following maturity distribution on its<br />
external customers:<br />
Not yet 0–3 3-6 > 6<br />
Total due months months months<br />
31.12.<strong>2008</strong> 732 239 331 082 274 189 88 761 38 208<br />
31.12.2007 423 867 204 515 146 233 27 281 45 838<br />
it is considered that it is not required to write down the value of overdue<br />
account receivables.<br />
These account receivables relates to independent customers which<br />
previously not failed to fulfill their obligations to the group. The<br />
invoicing is to a great extent in accordance with milestones bases on<br />
progress in each project. Due to delay in delivery, a gap between due<br />
date and payment date may occur from time to time.<br />
at 31.12.08, the provision for loss on accounts receivable was MnoK<br />
15.4, compared to MnoK 4.0 in 2007. For more details see note 11.<br />
67
4-8 T T S G r o u P<br />
9-11 rEPorT FroM THE CEo<br />
12-37 B u S i n E S S a r E a S<br />
38-47 CorPoraTE GoVErnanCE<br />
48-110 director’S report and accountS<br />
liquidity riSK<br />
liquidity risk is the risk of the group being unable to fulfil its financial obligations as they fall due. liquidity management shall, to the extent possible,<br />
ensure that available liquidity is sufficient to meet obligations as they mature for payment, without this resulting in unacceptable loss or risk of<br />
damage to the group’s reputation. The availability of sufficient liquidity to meet expected operating cost, as well as resources to service financial<br />
obligations in the future, shall be secured.<br />
<strong>TTS</strong> has a group accounting system which includes most of its subsidiaries. The group accounting system improves accessibility and flexibility in<br />
the management of liquidity. The subsidiary companies regularly prepare cash flow projections for follow-up by the group.<br />
The <strong>TTS</strong> <strong>Group</strong>’s strategy is to have sufficient cash or credit options to be able to, at any time, finance operations and investments throughout<br />
the year, in accordance with the group’s strategy plan. The group regards it as most likely that it will be able to renew loan agreements or negotiate<br />
alternative financing agreements upon expiry of the current agreements. Surplus liquidity is placed as deposits in bank on the best possible terms.<br />
The table below gives an overview of the structure of maturity of the group’s financial obligations;<br />
rEMaininG PErioD: More<br />
<strong>2008</strong><br />
Long-term financial obligations:<br />
< 6 months 6-12 months 1-5 year(s) than 5 years In total<br />
interest-bearing non-current liabilities 0 0 531 811 486 532 297<br />
Current financial obligations:<br />
First year’s installment on non-current liabilities 15 484 15 483 0 0 30 967<br />
interest-bearing current liabilities 175 730 27 937 0 0 213 667<br />
Derivatives 175 000 176 342 0 0 351 342<br />
accounts payable and other current liabilities 600 000 576 834 0 0 1 176 834<br />
Total financial obligations 901 214 881 596 531 811 486 2 315 107<br />
The syndicated loan from nordea constitutes part of short-term loans, and will be renewed within 6 months.<br />
reference is made to note 13 for further discussion on the syndicated loan.<br />
2007<br />
Long-term financial obligations:<br />
< 6 months 6-12 months 1-5 year(s)<br />
More<br />
than 5 years In total<br />
interest-bearing non-current liabilities 0 0 562 764 386 563 166<br />
Current financial obligations:<br />
First year’s installment on non-current liabilities 13 086 13 086 0 0 26 172<br />
interest-bearing current liabilities 0 20 461 0 0 20 461<br />
Derivatives 10 000 10 480 0 0 20 480<br />
accounts payable and other current liabilities 300 000 319 377 0 0 619 377<br />
Total financial obligations 323 086 363 404 562 764 386 1 249 657<br />
For further information of financial obligations se note 12,13,15,17,20, and 29. in addition to this is advance payment from costumers and cost<br />
related to facilities under construction. These entries are items of accrual and ordinarily fall due within a year. Further information in note 2.<br />
3.2 risk related to investment management<br />
The <strong>TTS</strong> <strong>Group</strong>’s aim with regard to investment management is to<br />
secure continued operations in order to ensure a return for the owners<br />
and other partners, and maintain an optimum capital structure, so as<br />
to reduce capital costs.<br />
To improve the capital structure, the group may adjust the level of<br />
dividend payment to shareholders, issue new shares or sell assets to<br />
repay loans. The company’s gearing as of 31.12.08 and 31.12.07 is<br />
illustrated below:<br />
<strong>2008</strong> 2007<br />
Total loan 776 931 609 800<br />
-cash and cash equivalent 267 233 353 138<br />
net interest-bearing debt 509 698 256 662<br />
Equity 989 056 933 598<br />
in total 1 498 754 1 186 782<br />
Gearing 34.0% 21.3 %<br />
68<br />
3.3 estimation of fair market value<br />
actual value of financial instruments traded in an active market is<br />
based on the market value on the balance sheet date. Examples of<br />
this are forward contracts in foreign currencies where actual value<br />
is calculated by using a market-to-market rate on the balance sheet<br />
date.<br />
actual value of financial instruments not traded in an active market<br />
is stipulated by the use of valuation techniques (primarily discounted<br />
future prospective cash flows) or other relevant information for giving<br />
a best estimate of actual value on the balance sheet date. an example<br />
of this is shares held available for sale that have been estimated based<br />
on information regarding transactions involving said shares.<br />
accounts receivable and accounts payable are valued at face value,<br />
less deductions for occurred or estimated losses on the balance sheet<br />
date, an amount that is presumed to be equal to the actual value<br />
of the entry.
4. risk related to key accounting estimates and<br />
evaluations<br />
accounting estimates and evaluations are based on a best estimate.<br />
Estimates are evaluated on the basis of available information on the<br />
balance sheet date, as well as management’s experience and expectation<br />
of future events deemed likely to occur. When considering the<br />
best estimate, allowance is made for relevant events that have occurred<br />
subsequent to the balance sheet date and up until the Board’s<br />
approval of the accounts, to the extent that such events are presumed<br />
to significantly alter the estimates. Estimates are always associated<br />
with uncertainty and consequently the recorded balance sheet and<br />
result variables. These days’ unrest in the financial market significantly<br />
increases the uncertainty of the premises for estimates and assessments<br />
of likely future events. Below follows a discussion of the key<br />
balance sheet items and appropriate profit and loss items where<br />
estimates are considered to be associated with major risk which forms<br />
the basis of the accounts.<br />
a ) r i S K r E l a T E D T o S i G n i F i C a n T l o S S o F V a l u E o F G o o D W i l l<br />
anD oTHEr inTanGiBlE aSSETS<br />
Book value of goodwill and other intangible assets are evaluated<br />
on an annual basis, and for each balance sheet date when there is<br />
external or internal depreciation indicators. The assessment is based<br />
on implemented tests of any depreciation performed in accordance<br />
with requirements and guidelines given in iaS 36. as will appear from<br />
section 2.6, depreciation tests have been carried through indicating<br />
that there is no need for depreciation as of 31.12.<strong>2008</strong>. The premises<br />
that form the basis of this assessment may be significantly affected<br />
by future alterations to market conditions or events. reference is made<br />
to a more detailed discussion of these balance sheet items in section<br />
2.6 and accounting values in note 7.<br />
B ) r i S K r E l a T E D T o a S S E S S M E n T o F C a P i T a l C o n T r a C T S<br />
aCCorDinG To THE METHoD oF ConTinuouS SETTlEMEnT<br />
Entering of income and appropriate commodity costs from capital contracts<br />
is done according to the method of current settlement pursuant<br />
to requirements and guidelines given in iaS 11. The method demands<br />
of the group that it prepares reliable estimates (prognosis) for future<br />
income and costs for each project as well as degree of completion on<br />
the balance sheet date. accounting values related to capital contracts<br />
have been further discussed in section 2.19 and note 11. income<br />
forecasts are based on contractual values where future income in<br />
foreign currencies is secured by forward contracts. Forward contracts<br />
and hedging accounting is discussed in section 2.9 and the accounting<br />
value of hedging instruments in note 20. Commodity cost forecast<br />
is based on evaluation of calculated volume and evaluation of future<br />
price levels. The price of steel, in particular, could significantly alter<br />
commodity cost. in today’s market, there is particular risk related to<br />
delays and cancellations of firm contracts. The group assesses the<br />
likelihood of cancellations and delays on a continuous basis. Delays<br />
and cancellation entail the risk of reduced income, increased costs,<br />
and that any previously estimated margins must be charged as an<br />
expense. in the event of cancellations, the foundation for hedging<br />
accounting ceased to exist according to iaS 39. This entails a risk of<br />
unrealised loss on forward contracts associated with cancelled projects.<br />
C) riSK rElaTED To aSSESSMEnT oF FinanCial aSSETS anD<br />
oBliGaTionS<br />
The group’s financial assets and obligation are further discussed in<br />
sections 2.7, 2.8, 2.9, 2.11, 2.12, 2.14 and 2.15. risk related to currency,<br />
interest, credit and liquidity, as well as asset management is discussed<br />
in section 3. These days’ unrest in the financial market could significantly<br />
affect the premises for valuation, estimated cash flow and<br />
liquidity in the course of the next accounting year. For further discussion<br />
of this, reference is made to section 3 and, for accounting values<br />
see note 11, 12, 15, 20, 22, and 29.<br />
D) riSK rElaTED To GuaranTEE liaBiliTY<br />
The group customarily offers a warranty period of +/- two years on its<br />
deliveries. Management estimates appropriation for future guaranty<br />
commitments based on information of historical guarantee claims,<br />
together with information indicating that information regarding<br />
previous expenses may differ from future obligations. Factors that<br />
may affect estimated obligations include the outcome of productivity<br />
and quality initiatives, as well as reference prices and labour costs.<br />
Guarantee costs are further discussed in section 2.17, and accounting<br />
values in note 21.<br />
E) riSK rElaTED To PEnSion oBliGaTionS<br />
net pension obligations are stipulated according to invoice calculations<br />
based on the premises related to discount rate, future salary developments,<br />
pension adjustment, expected returns on funds, as well as<br />
demographic considerations such as disability and mortality. The<br />
premises are stipulated based on observable market prices and historic<br />
development of the group and society. Changes to these premises<br />
could significantly affect the estimated pension obligation and pension<br />
cost. Pension cost and other compensation payments to employees<br />
are further discussed in section 2.17, and accounting values in note 5.<br />
F ) r i S K r E l a T E D T o a C T u a l V a l u E o n S H a r E S<br />
actual value on shares not traded in an active market is stipulated by<br />
the use of valuation techniques. The group evaluates and chooses the<br />
methods and premises that are primarily based on market conditions on<br />
the balance sheet date. Changes to the market conditions may significantly<br />
affect the actual value of shares. The accounting value of shares<br />
is further discussed in note 8.<br />
69
notes<br />
ttS <strong>Group</strong><br />
note 1 Segment information<br />
(aMounTS in noK 1 000)<br />
P r i M a r Y r E P o r T i n G F o r M a T –<br />
BuSinESS SEGMEnTS<br />
The <strong>TTS</strong> Marine aSa <strong>Group</strong> is divided into five<br />
strategic business units that are organised and<br />
managed separately. The various business segments<br />
sell various products aimed at different customer<br />
groups with different risk profiles.<br />
<strong>TTS</strong> GrouP 4-8<br />
rEPorT FroM THE CEo 9-11<br />
BuSinESS arEaS 12-37<br />
CorPoraTE GoVErnanCE 38-47<br />
director’S report and accountS 48-110<br />
THE GrouP iS DiViDED inTo THE FolloWinG BuSinESS SEGMEnTS:<br />
DCH: Dry Cargo Handling<br />
MC: Marine Cranes<br />
PMH: Port and Material Handling<br />
DM: Deck Machinery<br />
<strong>2008</strong> Key Profit Figures<br />
MC DCH PMH DM DE Annet Total<br />
Turnover 1 107 028 1 239 622 350 484 447 748 1 057 357 -5 757 4 196 482<br />
Earnings before depreciation (EBiTDa) 0 16 573 0 0 0 1 140 17 713<br />
Depreciation 41 781 84 957 32 501 22 269 -24 565 -11 482 145 461<br />
operating profit/loss -7 036 -3 494 -2 686 -2 231 -12 819 -2 579 -30 845<br />
income form joint ventures 34 745 81 463 29 815 20 038 -37 384 -14 061 114 616<br />
net financial items -27 728 -8 767 2 331 -2 446 -17 626 -23 561 -77 797<br />
Pre-tax profit/loss 7 017 72 696 32 146 17 592 -55 010 -37 622 36 819<br />
2007 Key Profit Figures<br />
DE: Drilling Equipment<br />
others: Corporate and others<br />
MC DCH PMH DM DE Annet Total<br />
Turnover 687 712 874 920 332 787 299 485 265 060 0 2 459 964<br />
Earnings before depreciation (EBiTDa) 6 049 12 095 0 -2 813 0 0 15 331<br />
Depreciation 34 878 95 728 25 627 5 278 13 877 -7 621 167 767<br />
operating profit/loss -5 068 -2 810 -858 -2 779 -3 717 -17 896 -33 128<br />
income form joint ventures 29 810 92 918 24 769 2 499 10 160 -25 520 134 636<br />
net financial items -32 091 1 611 -2 213 -3 202 -859 -314 -37 068<br />
Pre-tax profit/loss -2 281 94 529 22 556 -703 9 301 -25 834 97 568<br />
<strong>2008</strong> Segment liabilites and assets as of 31 December and investement expenses<br />
MC DCH PMH DM DE Annet Total<br />
assets 1 140 014 1 142 179 312 796 281 825 1 228 724 187 779 4 293 318<br />
associated companies - 70 888 - - 3 201 13 314 87 403<br />
Total assets 1 140 014 1 213 067 312 796 281 825 1 231 925 201 093 4 380 721<br />
liabilities 991 012 789 678 207 870 226 695 1 055 777 120 632 3 391 664<br />
investment expenses 37 196 179 993 8 344 46 165 166 635 941 439 273<br />
2007 Segment liabilites and assets as of 31 December and investement expenses<br />
MC DCH PMH DM DE Annet Total<br />
assets 609 682 670 114 193 458 173 746 364 030 1 033 900 3 044 929<br />
associated companies 0 41 089 0 0 4 100 11 836 57 025<br />
Total assets 609 682 711 203 193 458 173 746 368 130 1 045 736 3 101 954<br />
liabilities 420 699 501 087 143 373 204 861 237 255 661 083 2 168 358<br />
investment expenses 7 719 2 751 5 647 905 114 868 528 097 659 987<br />
intragroup transactions are eliminated within the individual segments.<br />
Transactions and transfers between the various segments are at normal terms, consistent with those between independent parties.<br />
71
71-89 noteS to the accountS ttS <strong>Group</strong><br />
note 1 cont.<br />
SEConDarY rEPorTinG ForMaT – GEoGraPHiCal SEGMEnTS<br />
The group’s activities are distributed primarily in the following regions:<br />
Scandinavia<br />
rest of Europe<br />
asia<br />
uSa/Canada<br />
rest of World<br />
Sales revenues <strong>2008</strong> 2007<br />
Scandinavia 917 143 634 053<br />
rest of Europe 1 131 496 773 341<br />
asia 1 178 568 882 641<br />
uSa/Canada 328 679 0<br />
rest of World 36 596 169 931<br />
Sales are allocated based on the customer’s home country.<br />
4 196 478 2 459 966<br />
Segment assets <strong>2008</strong> 2007<br />
Scandinavia 2 893 013 2 415 900<br />
rest of Europe 1 038 591 659 810<br />
asia 275 883 44 942<br />
uSa/Canada 173 237 13 795<br />
rest of World 0 0<br />
assets are based on where the assets are located.<br />
4 380 721 3 134 445<br />
Investment expenses <strong>2008</strong> 2007<br />
Scandinavia 199 756 652 985<br />
rest of Europe 197 991 1 988<br />
asia 28 006 655<br />
uSa/Canada 9 331<br />
rest of World 4 189 4 359<br />
439 273 659 987<br />
investment expenses are based on where the assets are located.<br />
note 2 construction contracts<br />
(aMounTS in noK 1 000)<br />
<strong>2008</strong> 2007<br />
income based on contracts 4 176 497 2 452 225<br />
iTEMS on THE BalanCE SHEET rElaTED To ConSTruCTion ConTraCTS<br />
Current assets<br />
Completed production 1 410 289 930 414<br />
invoiced production 526 133 333 777<br />
accrued, non-invoiced production 884 156 596 638<br />
Prepayments to suppliers 203 922 189 984<br />
Total current assets 1 088 077 786 622<br />
Current liabilities<br />
Completed production 597 996 417 224<br />
invoiced production 1 529 906 987 669<br />
Prepayments from customers -931 910 -570 445<br />
non-invoiced production cost, suppliers -72 102 -273 715<br />
Total current liabilities -1 004 012 -844 161<br />
risk related to the estimates that form the basis for posted values are further discussed in accounting<br />
principles, in sections 2.20 and 4.<br />
72
note 3 inventories<br />
(aMounTS in noK 1 000)<br />
<strong>2008</strong> 2007<br />
inventories, incl. non-current 230 953 104 891<br />
non-current iventories -18 125 -4 309<br />
Total inventories 212 828 100 582<br />
Work in progress 33 105 30 680<br />
Book value of inventories pledged as security for liabilities 78 461 35 029<br />
note 4 payroll expenses and employee information<br />
(aMounTS in noK 1 000)<br />
Payroll expenses <strong>2008</strong> 2007<br />
Salaries 351 741 257 269<br />
Employer’s social security contribution 47 332 39 251<br />
Defined benefit pension costs 7 020 5 644<br />
Defined contribution pension costs 20 102 21 134<br />
other benefits 21 855 18 400<br />
Total payroll expenses 448 051 341 697<br />
number of employees as of 31 December 1 236 787<br />
number of employees in the group increased by 362 from 2007 to <strong>2008</strong>. The acquisition of new companies<br />
increased the number of employees by 18.<br />
Remuneration to board members <strong>2008</strong> 2007<br />
Birger Skeie (Board Chairman from 22.05.08) 160 0<br />
Bjarne Skeie (from 22.05.08) 102 0<br />
nils aardal (Board Chairman to 22.05.08) 245 310<br />
anne Breive 205 170<br />
Hilde P. aa. Krøgenes (to 22.05.08) 73 150<br />
agnar Gravdal (to 22.05.<strong>2008</strong>) 73 88<br />
John M. lunde (to June 08) 0 63<br />
Kjerstin Fyllingen (from 22.05.08) 120 0<br />
olav Smeland 88 75<br />
oddmund Hatletun (to September 08) 37 75<br />
anne-Karin Bedringås (from September 08) 51 0<br />
Total 1 153 931<br />
*) The <strong>Annual</strong> General Meeting determines the remuneration to the Board from one general meeting to the next. For the accounting year 2007,<br />
the same remuneration was stipulated as was determined by the Board at the <strong>Annual</strong> General Meeting for 2007.<br />
noMinaTion CoMMiTTEE rEMunEraTion<br />
<strong>TTS</strong>’s nominations committee comprises the following members: Bjørn olafsson (Chairman), Bjørn Sjaastad and Harald Espedal.<br />
Proposed remuneration for <strong>2008</strong> was TnoK 40 for the chairman and TnoK 25 to members, a total of TnoK 65.<br />
STaTEMEnT rEGarDinG THE STiPulaTion oF rEMunEraTion anD oTHEr BEnEFiTS For THE PrESiDEnT & CEo anD oTHEr ExECuTiVES<br />
The remuneration policy of <strong>TTS</strong> Marine aSa is based on offering the group management competitive conditions. The level of remuneration shall<br />
reflect to the company is a listed company focusing internationally. The annual remuneration is based on the group management taking into<br />
account and the added value for the shareholders through increased company value.<br />
remuneration consists of three main components: base salary, bonus and a share option program.<br />
Bonus is determined on the basis of target results. in certain circumstances where change and development are of a decisive nature, the bonus is<br />
further based on specific development targets. Bonus targets are revisited annually. The maximum bonus is one year’s base salary for the President<br />
& CEo, and up to 50 percent for other executives.<br />
Since 1998, a share option program has been active for the group management of <strong>TTS</strong>; the goal being that the group management shall have<br />
the same incentive as the shareholders in respect of increasing company value over time. The annual General Meeting has each year given the<br />
Board authority to establish share option programs with a two year term. redemption price equals market price on allotment. First exercise is<br />
50 percent after one year. Thereafter 12.5 percent per quarter, in addition to share options that have not been previously exercised. Share options<br />
may not be exercised subsequent to the second anniversary.<br />
The group pension scheme in norway is based on approximately 65 percent of base salary at the age of 67, limited to a maximum of 12G, except<br />
from Sense EDM thai has a contribution pension. For employees abroad, the schemes prevailing in the respective companies where they are<br />
employed apply.<br />
The period of notice is 6 months with a severance pay from 6 to 24 months, period of notice inclusive.<br />
The share option program is conditional upon the annual General Meeting’s approval, based on the Board being granted authority to make such<br />
allotments. The President & CEo’s remuneration is determined by the Board of <strong>TTS</strong> Marine aSa.<br />
With respect to other executives, their remuneration is determined by the boards of the respective subsidiaries/President & CEo.<br />
73
71-89 noteS to the accountS ttS <strong>Group</strong><br />
note 4 cont.<br />
rEMunEraTion anD oTHEr BEnEFiTS For THE PrESiDEnT & CEo anD oTHEr ExECuTiVES<br />
Other Bonus Share Pension<br />
Name Position Remuneration benefits paid options Total benefits<br />
Johannes D. neteland President & CEo 1 631 406 1 202 2 200 5 438 113<br />
olav Bruåsdal Financial Director 1 074 221 207 880 2 382 89<br />
Hans-Jan Erstad Manager Hr-iT-qa 713 89 84 880 1 766 169<br />
ivar K. Hanson Man. Dir. MC 1 202 97 344 880 2 522 86<br />
lennart Svensson Man. Dir. PMH 886 0 4 0 891 290<br />
Stellan Bernsro Man. Dir. DCH 1 037 0 455 880 2 372 251<br />
Edgar Bethmann Man. Dir. DM 1 405 164 0 880 2 449 0<br />
Tom Fedog Man. Dir. DE 1 313 0 0 0 1 313 28<br />
Margrethe Hauge (from March <strong>2008</strong>) Man. Dir. Services 884 308 0 0 1 192 87<br />
remuneration Taxable remuneration<br />
other benefits Free car, life insurance, telephone, newspapers etc.<br />
Bonus paid Bonus paid in current year<br />
Share options Difference between market price and exercise price<br />
Total Total taxable remuneration<br />
The pension premium for the President & CEo is based on pension payments of approximately 65 percent of his base salary from the age of 67,<br />
for the CFo approximately 65 percent of a maximum of 12G. in addition, an early retirement scheme from the age of 60 that pays approximately<br />
60 percent of base salary is established. With effect from 2007, the group pension scheme will be based on approximately 65 percent of base salary<br />
at the age of 67, limited to a maximum of 12G. additional pension benefits will be adjusted similar to other benefits.<br />
The period of notice for the President & CEo is 6 months, with a severance pay of 24 months, period of notice inclusive, and from 6 to 24 months<br />
for other group executives. .<br />
auDiTor FEES<br />
<strong>2008</strong> 2007<br />
Statutory auditing 3 884 2 670<br />
other certifications 123 110<br />
other assistance including tax assistance 2 065 1 587<br />
Total 6 072 4 307<br />
note 5 pensions<br />
(aMounTS in noK 1 000)<br />
The norwegian companies in the group have defined benefit pension schemes that entitle the employees to defined future pension benefits dependent<br />
on the number of years of service, salary level, retirement age and national insurance benefits received. The pension scheme includes 248 persons as<br />
of 31 December <strong>2008</strong>. The group’s obligations are covered primarily by an insurance company. The companies outside norway have pension plans<br />
according to local practice and legislation, that is contribution pension. <strong>TTS</strong> Sense aS also has a contribution pension.<br />
The net pension obligations based on the assumptions as of 31 December <strong>2008</strong> recorded on the balance sheet are determined as follows:<br />
<strong>2008</strong> 2007<br />
Insured Uninsured Total Insured Uninsured Total<br />
Market value of pension funds 62 917 0 62 917 49 843 0 49 843<br />
- net present value of accrued pension obligations -87 281 -1 658 -88 939 -55 677 -1595 -57 272<br />
+ unrecognised estimate changes and deviations 41 641 -206 41 435 8 244 -23 8 221<br />
- Change in employer’s share of ni contributions 3 817 234 4 051 0 0 0<br />
= Total costs, including payroll expenses 13 460 -2 098 11 362 2 410 -1 618 792<br />
Net pension costs are determined as follows: <strong>2008</strong> 2007<br />
Insured Uninsured Total Insured Uninsured Total<br />
net present value of current year’s pension benefits accrued 5 541 174 5 715 4 737 133 4 870<br />
+ interest payable on pension obligations 2 820 71 2 890 2 063 55 2 118<br />
- Expected return on pension funds -3 062 0 -3 062 -2 322 0 -2 322<br />
+ recognised estimate changes and deviations 723 -28 696 1 018 0 1 018<br />
+ Change in employer’s share of ni contributions 747 35 782 0 -40 -40<br />
= Total costs, including payroll expenses 6 769 252 7 020 5 496 148 5 644<br />
Change in book value of funds: <strong>2008</strong> 2007<br />
Book value as of 1 January 792 -2 171<br />
- Costs recognised during the year (see above) 7 020 5 644<br />
+/- Pension payments and payment of pension premiums 17 589 8 606<br />
= Book value as of 31 December 11 362 792<br />
74
The following economic assumptions have been made<br />
for calculation of the pension obligations: <strong>2008</strong> 2007<br />
31.12. 1.1. 31.12. 1.1.<br />
return on pension funds 5.80 % 6.10 % 6.10 % 5.40 %<br />
Discount rate 3.80 % 5.10 % 5.10 % 4.35 %<br />
annual wage inflation 4.80 % 4.50 % 4.50 % 4.50 %<br />
annual adjustment of the basic national insurance amount (G) 3.80 % 4.25 % 4.25 % 4.25 %<br />
annual adjustment of pensions being paid out 3.80 % 2.35 % 2.35 % 1.65 %<br />
Voluntary retirement 10.00 % 10.00 % 10.00 % 10.00 %<br />
Withdrawal tendency for early retirement (aFP) 45.00 % 45.00 % 45.00 % 45.00 %<br />
Employer’s share of national insurance contributions 14.10 % 14.10 % 14.10 % 14.10 %<br />
risk related to the estimates that form the basis for the posted values are further discussed in accounting principles, in sections 2.17 and 4.<br />
note 6 tangible fixed assets<br />
(aMounTS in noK 1 000)<br />
Furniture<br />
Machinery and office Computer<br />
Land Buildings and vehicles equipment equipment Total<br />
aS oF 1 JanuarY 2007<br />
Historical cost as of 1 January 739 13 823 25 631 9 907 42 159 92 259<br />
accumulated depreciation as of 1 January 0 -2 045 -18 811 -6 826 -30 536 -58 218<br />
Book value as of 1 January 739 11 778 6 820 3 081 11 623 34 041<br />
2007 FinanCial YEar<br />
Book value as of 1 January 739 11 778 6 820 3 081 11 623 34 041<br />
Exchange differences 0 -1 027 -1 254 -418 -1 716 -4 415<br />
acquisition of subsidiaries 14 727 5 518 1 128 401 18 224 39 998<br />
additions during the year 0 698 5 068 4 074 19 341 29 181<br />
Disposals during the year 0 0 -942 -1 511 -5 160 -7 613<br />
Depreciation for the year 0 -91 -2 036 -1 754 -8 993 -12 874<br />
Book value as of 31 December 15 466 16 876 8 784 3 873 33 319 78 318<br />
aS oF 31 DECEMBEr 2007<br />
Historical cost as of 1 January 15 466 19 012 29 631 12 453 72 848 149 410<br />
accumulated depreciation as of 1 January 0 -2 136 -20 847 -8 580 -39 529 -71 092<br />
Book value as of 1 January 15 466 16 876 8 784 3 873 33 319 78 318<br />
<strong>2008</strong> FinanCial YEar<br />
Book value as of 1 January 15 466 16 876 8 784 3 873 33 319 78 318<br />
Exchange differences -793 2 460 568 995 2 091 5 321<br />
acquisition of subsidiaries 0 0 0 1 450 0 1 450<br />
additions during the year 0 12 531 20 548 14 810 15 792 63 685<br />
Disposals during the year 0 89 -317 0 -54 -281<br />
Depreciation for the year 0 -2 667 -4 798 -3 436 -12 894 -23 796<br />
Book value as of 31 December 14 673 29 288 24 785 17 692 38 250 124 696<br />
aS oF 31 DECEMBEr <strong>2008</strong><br />
Historical cost as of 1 January 14 673 34 092 50 430 29 708 90 682 219 584<br />
accumulated depreciation as of 1 January 0 -4 803 -25 645 -12 016 -52 423 -94 888<br />
Book value as of 1 January 14 673 29 288 24 785 17 692 38 250 124 696<br />
Property in the norwegian companies has been pledged as security for long-term and short-term debt to credit institutions, see note 13.<br />
ParT oF FixED aSSETS THaT arE lEaSED: Furniture<br />
Machinery/ and office<br />
and vehicles equipment<br />
<strong>2008</strong> FinanCial YEar<br />
Book value as of 1 January 632 3 258<br />
additions during the year 1 009 0<br />
Disposals during the year -632 0<br />
Depreciation for the year -100 -1 426<br />
Book value as of 31 December 909 1 832<br />
2007 FinanCial YEar<br />
Book value as of 1 January 700 4 200<br />
Depreciation for the year -68 -942<br />
Book value as of 31 December 632 3 258<br />
75
71-89 noteS to the accountS ttS <strong>Group</strong><br />
note 7 intangible fixed assets<br />
(aMounTS in noK 1 000)<br />
76<br />
Customer- R&D, patents,<br />
portfolio licences 1) Goodwill 2) Total<br />
aS oF 1 JanuarY 2007<br />
Historical cost as of 1 January 0 26 692 329 860 356 552<br />
accumulated depreciation as of 1 January 0 -5 490 -22 081 -27 571<br />
Book value as of 1 January 0 21 202 307 779 328 981<br />
2007 FinanCial YEar<br />
Book value as of 1 January 0 21 202 307 779 328 981<br />
Exchange differences 0 212 -3 799 -3 587<br />
additions during the year - internal developed 0 111 504 0 111 504<br />
acquisition of subsidiaries 5 219 41 208 552 691 599 118<br />
Disposals during the year 0 0 0 0<br />
Depreciation for the year -600 -3 682 0 -4 282<br />
Book value as of 31 December 4 619 170 444 856 671 1 031 734<br />
aS oF 31 DECEMBEr 2007<br />
Historical cost as of 1 January 5 219 179 616 878 752 1 063 587<br />
accumulated depreciation as of 1 January -600 -9 172 -22 081 -31 853<br />
Book value as of 1 January 4 619 170 444 856 671 1 031 734<br />
<strong>2008</strong> FinanCial YEar<br />
Book value as of 1 January 4 619 170 444 856 671 1 031 734<br />
Exchange differences 0 26 129 26 129<br />
additions during the year - internal developed 0 72 227 0 72 227<br />
acquisition of subsidiaries 0 10 000 71 814 81 814<br />
Disposals during the year 0 0 0 0<br />
Depreciation for the year -522 -6 179 0 -6 701<br />
Book value as of 31 December 4 097 246 492 954 614 1 205 203<br />
aS oF 31 DECEMBEr <strong>2008</strong><br />
Historical cost as of 1 January 5 219 261 843 976 695 1 243 777<br />
accumulated depreciation as of 1 January -1 122 -15 351 -22 081 -38 554<br />
Book value as of 1 January 4 097 246 492 954 614 1 205 203<br />
BooKED ValuTE r&D, PaTEnTS anD liCEnCES aS oF 31 DECEMBEr 2007:<br />
Eu project, development of a Terminal System 13 791<br />
Development costs in BoHai, China 6 530<br />
Development onshore rigs 190 391<br />
Development Heave Compensering VME 17 800<br />
others 17 980<br />
Total 246 492<br />
1) iTEM ConSiSTS oF:<br />
<strong>TTS</strong> Port Equipment AB has capitalised TNOK 13 791 related to development on ”Terminal System”.<br />
<strong>TTS</strong> Marine Cranes AS has activated TNOK 6 530 related to development costs in China.<br />
Drilling Equipment has activated an R&P rig solution, the JIM multifunctional roughneck and a mud treatment plant.<br />
<strong>TTS</strong> Offshore Handling Equipment AS has activated own development of anchor handling winches with high pressure hydraulics.<br />
<strong>TTS</strong> Marine Cranes AS has activated own development of a conceptual range for subsea cranes with secondary controlled AHC technology.<br />
2) a SuMMarY oF THE GooDWill alloCaTion aT THE SEGMEnT lEVEl iS aS FolloWS:<br />
<strong>2008</strong> MC DCH PMH DM DE Others Total<br />
Scandinavia 51 458 156 424 4 274 0 586 944 0 798 655<br />
rest of Europe 33 975 22 963 42 908 54 060 0 0 153 906<br />
asia 2 053 0 0 0 0 0 2 053<br />
rest of World 0 0 0 0 0 0 0<br />
Total 87 486 179 387 47 182 54 060 586 944 0 954 614<br />
2007 MC DCH PMH DM DE Others Total<br />
Scandinavia 49 458 156 424 3 449 0 516 089 0 725 420<br />
rest of Europe 27 386 22 963 35 243 43 626 0 0 129 218<br />
asia 2 053 0 0 0 0 0 2 053<br />
rest of World 0 0 0 0 0 0 0<br />
Total 78 897 179 387 38 692 43 626 516 089 0 856 691<br />
risk related to the estimates that form the basis for the posted values are further discussed in accounting principles, in sections 2.6 and 4.
iMPairMEnT aSSESSMEnT<br />
There are external indicators of the need to test for impairment of the carryvalue of the five assessements cash generating units (CGu) in accordance<br />
with the rules in iaS 36. The <strong>TTS</strong> <strong>Group</strong> has defined five CGuS in the group, consistent with the five divisions above. The value of goodwill in the<br />
balance sheet and important assumptions for the test are shown below:<br />
note 8 Shares in other companies<br />
(aMounTS in noK 1 000)<br />
Ownership Historical Book value<br />
interest cost <strong>2008</strong> 2007<br />
FixED aSSETS<br />
Shin Young Heavy industry 13.4 % 222 222 222<br />
FastShip inc.* 6.7 % 13 326 1 723 1 931<br />
other 2 0 0<br />
Total shares in other companies 13 550 1 945 2 153<br />
other investment in shares are all defined as available for sale.<br />
Goodwill Turnover EBITDA Margin<br />
31.12.08 <strong>2008</strong><br />
(MNOK) (MNOK) 2007 <strong>2008</strong> 2009-2010 2011 WACC<br />
DiViSion (CGu)<br />
Dry Cargo Handling 179 1 240 11.0 % 6.7 % 5.6 % - 10.0 % 10.,0 % 9.1 %<br />
Marine Cranes 87 1 107 5.1 % 3.8 % 6.1 % - 8.0 % 8.0 % 9.1 %<br />
Port and Material Handling 47 350 7.7 % 9.3 % 8.9 % - 10.0 % 10.0 % 9.1 %<br />
Deck Machinery 54 448 1.9 % 5.0 % 5.0 % - 8.0 % 8.0 % 9.1 %<br />
Drilling Equipment 586 1 057 5.3 % -2.3 % 7.0 % - 10.0 % 10.0 % 10.5 %<br />
Total 954 4 202<br />
Test for depreciation is implemented by estimating a utility value for<br />
each of the divisions, which is compared to the posted value. Estimated<br />
utility value is based on discounted future cash flows, and is subject to<br />
the following premises:<br />
• Expected cash flows are set to EBITDA with deductions made for<br />
investments and requirement for working capital, and is based on an<br />
actual board-approved business plan for each division over the next<br />
three years. The basis for this is a growth in turnover up until 2012.<br />
From 2012, growth is assumed to be equal to inflation, and on this<br />
basis calculation has been made of a terminal value at the end of<br />
the fourth year (2012).<br />
• Expected future revenues (EBITDA) is estimated at the same level as<br />
comparable and competitive companies in the market.<br />
• Inflation is presumed at 2.5 percent per year, and all values in the<br />
estimations are based on real value (less inflation). The presumption<br />
of inflation is according to estimates from norges Bank.<br />
• The weighted average cost of capital (WACC) is estimated on the<br />
basis of the capital asset pricing model and WaCC is on pre-tax<br />
and basis. all divisions, with the exception of the Drilling Equipment<br />
division are presumed to have the same WaCC (9.1 percent). WaCC<br />
for the Drilling Equipment division is estimated to 10.5 percent due<br />
to a Beta value differing from the other divisions. The Beta values<br />
are estimated by comparing the values with other similar companies<br />
listed on the stock exchange.<br />
• The investment requirements of each division are based on an<br />
investment plan approved by the Board.<br />
• Change to the working capital is estimated on the basis of the<br />
working capital constituting 8 percent of the division’s operating<br />
income.<br />
Based on the above presumptions, the estimated value in use exceeds<br />
the carrying value for each CGu indicating that there is no need to<br />
impair in any of the divisions.<br />
Please note, however, that there is a high degree of uncertainty related<br />
to the presumptions, and that changes to theses could entail future<br />
write downs. The group has conducted sensitivity analyses that show<br />
no need for write downs given the following premises:<br />
- 10 % decline in sales revenues<br />
- 1 %-point increase in the WaCC<br />
- 1 %-point decrease in EBiTDa margin<br />
The sensitivity analysis does, however, show that the risk of the utility<br />
value falling below book value is greatest for the Drilling Equipment<br />
division. in example, an EBiTDa that falls below 7 percent in future in<br />
this division will require write downs, given that the premises remain<br />
unchanged. The cause of a negative EBiTDa in <strong>2008</strong> for the Drilling<br />
Equipment division is the loss on contract with ability Drilling aSa.<br />
reference is made to note 24 for further discussion on the matter and<br />
associated risks.<br />
*) On the balance sheet as of 31.12.08, the company has entered 615 156 shares in FastShip Inc (FSI) with a recorded value of NOK 1.7 million.<br />
The shares were written down by NOK 11.4 million in 2007, and further 0,2 in <strong>2008</strong> to estimated market value. Additionally, three convertible loans<br />
have been entered with NOK 1.1 in the entry for other receivables. The convertible loans were written down by NOK 4.5 million in 2007, and<br />
0.1 MNOK in <strong>2008</strong>. Total write-downs related to FastShip in <strong>2008</strong> are NOK 16.2 million. <strong>TTS</strong> has been involved in the FastShip project since 1996.<br />
There is still activity in the project. Should the project remain unrealized and <strong>TTS</strong> have to write off the remaining assets entries, equity will<br />
be reduced by a corresponding amount.<br />
risk related to the estimates that form the basis for the posted values are further discussed in accounting principles, in sections 2.7 and 4.<br />
77
71-89 noteS to the accountS ttS <strong>Group</strong><br />
note 9 Subsidiaries<br />
(aMounTS in noK 1 000)<br />
The following subsidiaries are included in the consolidated accounts:<br />
ttS marine aSa<br />
Acquisition Ownership Voting<br />
Subsidiaries Registered office date interest share<br />
<strong>TTS</strong> Handling Systems aS Drøbak, norway 1994 100 % 100 %<br />
<strong>TTS</strong> Ships Equipment aS Bergen, norway 1996 100 % 100 %<br />
norlift aS Bergen, norway 1994 100 % 100 %<br />
Hydralift Marine aS Kristiansand, norway 2003 100 % 100 %<br />
<strong>TTS</strong> Ships Equipment aB Gothenburg, Sweden 2002 100 % 100 %<br />
<strong>TTS</strong> Marine Shanghai Co ltd Shanghai, China 2002 100 % 100 %<br />
<strong>TTS</strong> Marine Cranes aS Bergen, norway 2006 100 % 100 %<br />
<strong>TTS</strong> Cranes norway aS Bergen, norway 2007 100 % 100 %<br />
<strong>TTS</strong> offshore Handling Equipment aS Ålesund, norway 2007 100 % 100 %<br />
<strong>TTS</strong> Sense aS Kristiansand, norway 2007 100 % 100 %<br />
Associated companies<br />
<strong>TTS</strong> Bohai Machinery Co. ltd Dalian, China 2005 50 % 50 %<br />
ttS Ships equipment ab has the following investments:<br />
Acquisition Ownership Voting<br />
Subsidiaries Registered office date interest share<br />
<strong>TTS</strong> Ships Equipment GmbH Bremen, Germany 1997 100 % 100 %<br />
<strong>TTS</strong> Marine inc. Virginia, uSa 1994 100 % 100 %<br />
<strong>TTS</strong> Hua Hai aB Gothenburg, Sweden 2002 100 % 100 %<br />
<strong>TTS</strong> liftec oy Tampere, Finland 2004 100 % 100 %<br />
<strong>TTS</strong> Port Equipment aB Gothenburg, Sweden 2005 100 % 100 %<br />
<strong>TTS</strong> Marine S.r.l Genova, italy 2006 100 % 100 %<br />
Associated companies<br />
<strong>TTS</strong> Hua Hai Ships Equipment Co. ltd Shanghai, China 2002 50 % 50 %<br />
<strong>TTS</strong> JV Jiangsu Shanghai, China 2007 50 % 50 %<br />
<strong>TTS</strong> Keyon Marine Equipment Co. ltd Shanghai, China 2007 50 % 50 %<br />
ttS Ships equipment Gmbh has the following investments:<br />
Acquisition Ownership Voting<br />
Subsidiaries Registered office date interest share<br />
<strong>TTS</strong>-lMG Marine Cranes GmbH lübeck, Germany 2004 100 % 100 %<br />
<strong>TTS</strong> Kocks GmbH Bremen, Germany 2005 100 % 100 %<br />
ttS Kocks Gmbh has the following investments:<br />
Acquisition Ownership Voting<br />
Subsidiaries Registered office date interest share<br />
<strong>TTS</strong> Kocks ostrava s.r.o ostrava, Czech republic 2005 100 % 100 %<br />
<strong>TTS</strong> Kocks GmbH Korea Co. ltd Korea 2007 100 % 100 %<br />
<strong>TTS</strong> Marine Equipment Dalian, China <strong>2008</strong> 100 % 100 %<br />
ttS Sense aS has the following investments:<br />
Acquisition Ownership Voting<br />
Subsidiaries Registered office date interest share<br />
<strong>TTS</strong> Sense (Canada) ltd Edmonton, Canada 2007 100 % 100 %<br />
<strong>TTS</strong> Sense MuD aS Kristiansand, norway 2007 100 % 100 %<br />
<strong>TTS</strong> Sense Pte ltd Singapore Singapore 2007 100 % 100 %<br />
<strong>TTS</strong> Sense Drillfab aS Kristiansand, norway 2007 50 % 50 %<br />
<strong>TTS</strong> EDM inc uSa 2007 100 % 100 %<br />
Maskinering og Sveiseservice aS Kristiansand, norway 2007 34 % 34 %<br />
<strong>TTS</strong> Wellquip aS Kristiansand, norway <strong>2008</strong> 100 % 100 %<br />
Companies are accounted for in accordance with the equity method.<br />
78
note 10 investments in joint ventures<br />
(aMounTS in noK 1 000)<br />
investments are accounted for in accordance with the equity method.<br />
THE GrouP HaS THE FolloWinG inVESTMEnTS in JoinT VEnTurES:<br />
Company Registered office Acquisition date Ownership interest Voting share<br />
<strong>TTS</strong> Hua Hai Ships Equipment Co., ltd Shanghai, China 2002 50 % 50 %<br />
<strong>TTS</strong> Jiangsu Shanghai, China 2007 50 % 50 %<br />
<strong>TTS</strong> BoHai Machinery Co., ltd Dalian, China 2005 50 % 50 %<br />
<strong>TTS</strong> Keyon Marine Equipment Co., ltd China 2007 50 % 50 %<br />
<strong>TTS</strong> Sense Drillfab aS Kristiansand, norway 2007 50 % 50 %<br />
Maskin og Sveiseservice aS Kristiansand, norway 2007 34 % 34 %<br />
inTErEST in <strong>TTS</strong> Bohai <strong>TTS</strong> Hua Hai <strong>TTS</strong> Keyon<br />
JoinT Machinery Ships Equipment Marine Equipment Sense<br />
VEnTurES Co. Ltd incl. Jiangsu Co. Ltd Drillfab Total<br />
opening balance 1 January 11 836 36 712 4 375 4 100 57 022<br />
acquisition/Start-up of the company 0 0 0 -952 -952<br />
Share of profit/loss 1 140 14 020 2 552 0 17 712<br />
Effect of foreign currencies 764 10 099 1 858 0 13 621<br />
Closing balance 31 December 13 394 61 731 8 785 3 148 87 403<br />
There are no contingent liabilities related to the group’s shares in joint ventures, and no contingent liabilities in the joint ventures themselves.<br />
GrouP’S SHarE oF THE ProFiT/loSS, Long term Current Long term Current<br />
aSSETS anD liaBiliTiES aS oF 31.12.08 assets assets debt liabilities Income Profit/Loss<br />
<strong>TTS</strong> Hua Hai Ships Equipment Co., ltd incl. Jiangsu 22 332 192 682 0 152 909 282 198 14 020<br />
<strong>TTS</strong> Bohai Machinery Co., ltd 761 73 306 0 60 674 121 088 1 140<br />
<strong>TTS</strong> Keyon Marine Equipment Co., ltd 4 557 42 409 0 38 180 69 500 2 552<br />
Sense Drillfab 0 3 148 0 0 0 0<br />
Total 27 650 311 545 0 251 763 472 786 17 712<br />
GrouP’S SHarE oF THE ProFiT/loSS, Long term Current Long term Current<br />
aSSETS anD liaBiliTiES aS oF 31.12.07 assets assets debt liabilities Income Profit/Loss<br />
<strong>TTS</strong> Hua Hai Ships Equipment Co., ltd incl. Jiangsu 1 189 112 770 0 79 842 235 863 11 980<br />
<strong>TTS</strong> Bohai Machinery Co., ltd 540 23 089 0 11 793 45 147 4 659<br />
<strong>TTS</strong> Keyon Marine Equipment Co., ltd 1 288 14 811 0 11 724 21 890 115<br />
<strong>TTS</strong> Kocks GmbH Korea Co. ltd 0 0 0 0 13 753 -1 423<br />
Sense Drillfab 0 4 100 0 0 0 0<br />
Maskin og Sveiseservice aS 0 2 595 0 0 0 0<br />
Total 3 017 157 365 0 103 359 316 653 15 331<br />
note 11 customer and other receivables<br />
(aMounTS in noK 1 000)<br />
<strong>2008</strong> 2007<br />
receivables from customers 747 633 427 889<br />
Write-down for losses on receivables from customers -15 394 -4 022<br />
net receivables from customers 732 239 423 867<br />
Booked value of net receivables from<br />
customers by currency: <strong>2008</strong> 2007<br />
Euro 256 239 134 590<br />
uSD 126 823 137 919<br />
noK 232 344 138 894<br />
other currencies 116 833 12 464<br />
Total 732 239 423 867<br />
Other receivables under fixed assets investments: <strong>2008</strong> 2007<br />
loan to Fast Ship 1) 1 143 1 281<br />
Deposit 259 587<br />
loan 1 998 23<br />
other receivables 3 400 1 891<br />
Other receivables under current receivables: <strong>2008</strong> 2007<br />
Foreign currency contracts 357 688 23 062<br />
other receivables 110 388 114 438<br />
other current receivables 468 076 137 500<br />
For further information of customers and related<br />
risk, see note 24 and 2.11, 3.1, 4.0 in accounting<br />
principles.<br />
1) <strong>TTS</strong> Marine <strong>ASA</strong> has a convertible loan of TNOK<br />
1 143 towards Fast Ship. Ref Note 8. The loan was<br />
written down by TNOK 4 549 in 2007 and further<br />
TNOK 138 in <strong>2008</strong>. All are long-term receivables<br />
without fixed maturity.<br />
79
71-89 noteS to the accountS ttS <strong>Group</strong><br />
note 12 long-term liabilities<br />
(aMounTS in noK 1 000)<br />
rEPaYMEnT ProFilE anD MaTuriTY<br />
Balance as 2014<br />
of 31.12.08 2009 2010 2011 2012 2013 and later<br />
leasing debt 2 741 1 730 708 303 0 0 0<br />
long-term liabilities 571 253 29 237 521 402 15 233 3 208 2 000 486<br />
Total long-term liabilites 573 994<br />
- first year of long-term debt instalments -30 967 0 0 0 0 0 0<br />
- reclassified due Waier -10 730<br />
Total booked debt to credit institutions 532 297 30 967 522 110 15 536 3 208 2 000 486<br />
SPECiFiCaTion oF loanS<br />
80<br />
Type Foreign Nominal Instalment Book value Book value<br />
of loan currency interest rate Maturity terms <strong>2008</strong> 2007<br />
<strong>TTS</strong> MarinE aSa<br />
nordea Mortgage loan noK nibor+1.35 % 2011 4 per year 17 870 25 010<br />
Elcon Finans other long-term noK 6.72 % 2009 12 per year 0 140<br />
norfund Mortgage loan noK nibor+1.75 % 2011 4 per year 4 761 6 668<br />
norsk Tillitsmann aS Bond issue noK nibor+1.6 %* 2010 none 500 000 500 000<br />
<strong>TTS</strong> MarinE CranES aS<br />
SG Finans other long-term noK 5.50 % 2010 12 per year 1 832 3 259<br />
<strong>TTS</strong> SHiPS EquiPMEnT aS<br />
Skandia Banken other long-term noK 4.50 % 2010 12 per year 909 632<br />
<strong>TTS</strong> HanDlinG SYSTEMS aS<br />
innovasjon norge Mortgage loan noK 6.50 % <strong>2008</strong> 4 per year 0 4 613<br />
<strong>TTS</strong> liFTEC oY<br />
Sampo Bank Mortgage loan Eur 2 % 2009 4 per year 764 1 851<br />
<strong>TTS</strong> SHiPS EquiPMEnT GMBH<br />
nordea Mortgage loan Eur Euribor+1.275 % 2011 4 per year 24 406 26 868<br />
<strong>TTS</strong> KoCKS GMBH<br />
HypoVereinsbank Mortgage loan Eur Euribor+1.275 % 2011 4 per year 3 768 7 475<br />
<strong>TTS</strong> KoCKS KorEa<br />
Pusan Bank Mortgage loan KrW 4.40 % 2014 4 per year 11 197 12 823<br />
<strong>TTS</strong> KoCKS oSTraVa<br />
unicredit Bank Mortgage loan CZK Euribor+1.275 % 2012 4 per year 8 486<br />
Total 573 994 589 339<br />
*) In addition appr. 0.3 % in periodical cost. The repayment day of the Bond loan is 27.05.2010.<br />
True value of loans is considered to be approximately equal to book value as the loans is based on market related terms, and also the fact thai no fixed<br />
interest rate loan exist.<br />
Book value of the group’s long-term loans in different currencies is as follows:<br />
<strong>2008</strong> 2007<br />
noK 525 372 540 322<br />
Eur 28 989 36 194<br />
CZK 8 486 0<br />
KrW 11 197 12 823<br />
Total 573 994 589 339<br />
all loans are in the subsidiary’s own currency. See note 13 for security for long-term debt.<br />
risk related to the estimates that form the basis for the posted values are further discussed in accounting principles, in sections 2.7, 2.14, 3 and 4.
note 13 assets pledged as security and guarantees<br />
(aMounTS in noK 1 000)<br />
<strong>TTS</strong> Marine aSa’s norwegian credit agreement has been established (50/50) with nordea norge aSa (nordea) and Sparebanken Vest,<br />
with nordea as agent. <strong>TTS</strong> Marine aSa has the following agreements:<br />
<strong>2008</strong> 2007<br />
Limit Drawing Limit Drawing<br />
<strong>Group</strong> account 330 000 6 179 70 000 0<br />
Drawing facility, operations 175 000 175 000 100 000 0<br />
Guarantee limit for <strong>TTS</strong> <strong>Group</strong> (incl. Sense norge) 425 000 423 753 300 000 230 882<br />
Guarantee limit for Drawing facility, acquisition 0 0 50 000 0<br />
as of 31.12.08, the norwegian companies, in addition to <strong>TTS</strong> Sense Canada, <strong>TTS</strong> Ships Equipment aB, <strong>TTS</strong> Port Equipment aB and<br />
<strong>TTS</strong> Ships Equipment GmbH, all participate in the group account system. The same applies to the guarantee limit for the group, with<br />
the exception of the <strong>TTS</strong> Sense group which has its own guarantee limit. The guarantee limits cover payment guaranties, contract guaranties<br />
and tax guaranties. <strong>TTS</strong> Marine aSa furthermore has a drawing facility for operations and bridge financing in connection with acquisitions<br />
(in addition to long-term loans, see note 12).<br />
For the abovementioned agreements, the following assets (from <strong>TTS</strong> Marine aSa, <strong>TTS</strong> Handling Systems aS, <strong>TTS</strong> Ships Equipment aS and<br />
norlift aS, who also have joint liability) have been pledged as collateral toward nordea:<br />
<strong>2008</strong> 2007<br />
Secured debt 198 179 109 800<br />
Total drawdown in the guarantee pool 423 753 185 682<br />
Assets at book value:<br />
Customer/intragroup receivables 371 402 139 840<br />
non-invoiced production 439 193 230 743<br />
inventories/work in progress 78 461 35 029<br />
Prepayments to suppliers 198 954 149 509<br />
Property 3 080 3 365<br />
Total assets pledged as security 1 091 090 558 485<br />
in addiation following assets in the group have been pledged as security for garanties and credit agreements:<br />
Total assests pledged as security (book value) 135 200 249 067<br />
Total 1 226 290 807 552<br />
The abovementioned includes; inventory, accounts receivable and cash balance. in addition to this is tenancy right with charge on machinery<br />
and plant, as well as the shares in <strong>TTS</strong> Ships Equipment aS. The value of the mortgage bond is TnoK 200 000.<br />
Collateral towards nordea will include the norwegian companies, in addition to security interest in the shares in <strong>TTS</strong> Ships Equipment aB.<br />
T T S - K o C K S G M B H<br />
The credit agreement for <strong>TTS</strong> Kocks GmbH at noK 39.5 million (4.0 MEur) has been established with Bayerische Hypo- und Vereinsbank<br />
aktiengesellshaft (HypoVereinsbank) in Germany. The bank has a pledge in the company’s customers receivables and inventories, and additionaly<br />
a parent company guarantee from <strong>TTS</strong> Marine aSa of noK 44.4 million (4.5 MEur). The assets of the company has a book value of noK 29,6<br />
million (3.0 million Eur).<br />
<strong>TTS</strong>-lMG MarinE CranES GMBH<br />
The credit agreement for <strong>TTS</strong>-lMG Marine Cranes GmbH has been established with Bayerische Hypo- und Vereinsbank aktiengesellshaft<br />
(HypoVereinsbank) in Germany with a total credit limit including bank guarantees of noK 88.8 million (9.0 million Eur) and a drawdown<br />
of noK 5.6 million (0.6 million Eur) as of 31 December <strong>2008</strong>. The bank has security in the company’s assets, in addition to a parent<br />
company guarantee from <strong>TTS</strong> Marine aSa with a limit of noK 88.8 million (9.0 million Eur). The assets of the company has a book value<br />
of noK 313.3 million (31.7 million Eur).<br />
<strong>TTS</strong> liFTEC oY<br />
The credit agreement for <strong>TTS</strong> liftec oy has been established with Sampo Pankki oyi (Sampo Bank) in Finland with a credit limit of<br />
noK 32.5 million (3.3 million Eur) and a drawdown of noK 0.0 million (0.0 million Eur) as of 31 December <strong>2008</strong>. The bank has a parent<br />
company guarantee from <strong>TTS</strong> Marine aSa with a limit of noK 32.5 million (3.3 million Eur).<br />
81
71-89 noteS to the accountS ttS <strong>Group</strong><br />
note 13 cont.<br />
<strong>TTS</strong> MarinE SHanGHai Co. lTD<br />
The credit agreement for <strong>TTS</strong> Marine Shanghai Co. ltd. has been established with DnB Bank aSa, Shanghai Branch with a credit<br />
limit of noK 19.7 million (2 million Eur) and a drawdown of noK 9.8 (1.0 million Eur) as of 31 December <strong>2008</strong>. The bank has<br />
a parent company guarantee from <strong>TTS</strong> Marine aSa with a limit of noK 9.9 million (1 million Eur).<br />
<strong>TTS</strong> KoCKS oSTraVa s.r.o<br />
The credit agreement for <strong>TTS</strong> Kocks ostrava s.r.o has been established with uniCredit Bank Czech republic a.s in Check with<br />
a credit limit of noK 1.9 million (5 million CZK) and a drawdown of noK 1.1 million (2.9 million CZK) as of 31 December <strong>2008</strong>.<br />
The bank has scurity in the comapny’s assets, in addition <strong>TTS</strong> Marine aSa is co-debtor. The assets of the company has a book value<br />
of noK 19.1 million (53.9 million CZK).<br />
<strong>TTS</strong> KoCKS KorEa<br />
The loan to <strong>TTS</strong> Kocks GmbH Korea Co ltd. of noK 7.8 (1 448.0 million KrW) has been established with Pusan Bank in Korea.<br />
The bank has scurity in the company’s buildings, in addition <strong>TTS</strong> Marine aSa is co-debtor. The building of the company has a book<br />
value of noK 18.5 million (3 419.9 million KrW).<br />
CoVEnanTS<br />
The group has also undertaken to meet the following financial strength requirements for Nordea:<br />
There is a requirement that the equity shall be greater than noK 800 million at any time. in addition the equity ratio shall be<br />
greater than 25 per cent as of 31 December. With equity of noK 989 million and an equity ratio of 22.6 per cent, the group does<br />
not meet these requirements.<br />
The syndicated loan from nordea is subject to an annual renewal by 31 May 2009. accordingly, this loan formally matures for<br />
payment on this date. reference is made to the maturity structure of the group’s financial obligations in section 3.1, in accounting<br />
principles. nordea has granted a waiver of the covenants’ claim from 25 percent to 22.5 percent.<br />
The group has also undertaken to meet the following financial strength requirements for Norsk Tillitsmann <strong>ASA</strong>:<br />
There is a requirement that the equity shall be greater than noK 550 million at any time. in addition the equity ratio shall be<br />
greater than 22.5 per cent as of 31 December. With equity of noK 989 million and an equity ratio of 22.6 per cent, the group<br />
meets these requirements.<br />
With regard to the debenture issue there is, in addition to a covenants claim of 22.5 percent equity capital share and nominal<br />
equity capital of noK 500 million, several standard default clauses for this type of debenture issue. under these, the debenture issue<br />
is deemed to be defaulted, should the aforementioned syndicated loan toward nordea be defaulted (cross default).<br />
note 14 taxes<br />
(aMounTS in noK 1 000)<br />
Deferred taxes are netted if the group has a legal right to offset deferred tax assets against deferred taxes on the balance sheet<br />
and if the deferred taxes are owed to the same tax authority.<br />
The following amounts have been netted:<br />
<strong>2008</strong> 2007<br />
DEFErrED Tax aSSETS<br />
- Deferred tax assets that reverse after more than 12 months<br />
- Deferred tax assets that reverse within 12 months<br />
-74 793 -43 648<br />
Total recognised deferred tax assets -74 793 -43 648<br />
DEFErrED TaxES<br />
- Deferred taxes that reverse after more than 12 months 33 560 25 712<br />
- Deferred taxes that reverse within 12 months<br />
Total recognised deferred taxes 33 560 25 712<br />
net deferred taxes on the balance sheet -41 233 -17 936<br />
Change in recognised deferred taxes:<br />
Book value as of 1 January -17 936 -15 929<br />
recognised during the period (see specifications below) -30 144 -2 007<br />
Deffered taxes related to the acquisition of <strong>TTS</strong> Sense posted against goodwill 6 426 0<br />
To much allocated deffered taxes 421 0<br />
Book value as of 31 December -41 233 -17 936<br />
82
Change in deferred tax assets and deferred taxes (without netting within the same tax regime):<br />
1.1.2007 Change 2007 31.12.2007 Change <strong>2008</strong> 31.12.<strong>2008</strong><br />
DEFErrED TaxES<br />
Fixed assets 2 061 5 491 7 552 -508 7 044<br />
Construction contracts 21 872 38 015 59 887 33 071 92 958<br />
other temporary differences 17 221 -12 691 4 530 11 915 16 445<br />
Total deferred taxes 41 154 30 815 71 969 44 478 116 447<br />
DEFErrED Tax aSSETS<br />
accounts receivable -474 -138 -612 -2 190 -2 802<br />
inventories -2 301 1 181 -1 120 168 -952<br />
Pension funds -608 757 149 3 001 3 150<br />
other provisions for liabilities and charges -1 713 -1 902 -3 615 3 217 -398<br />
Total deferred tax assets -5 096 -102 -5 198 4 196 -1 002<br />
net deferred taxes 36 058 30 713 66 771 48 674 115 445<br />
Tax credit deduction carryforward -6 182 0 -6 182 0 -6 182<br />
Tax allowance carryforward -1 260 0 -1 260 0 -1 260<br />
Tax loss carryforward -47 552 -34 430 -81 982 -78 818 -160 800<br />
net deferred tax assets -18 936 -3 717 -22 653 -30 144 -52 797<br />
Changes in deffered taxes due to acquisition of <strong>TTS</strong> Sense 0 0 0 6 426 6 426<br />
Excess allocation 1 749 1 709 3 458 421 3 879<br />
of which unrecognised deferred<br />
tax assets related to allowance 1 260 0 1 260 0 1 260<br />
net deferred tax assets on the balance sheet -15 927 -2 009 -17 935 -23 297 -41 233<br />
The deferred tax assets related to tax loss carryforwards are recognised on the balanace sheet when the management believes<br />
that it is probable that the group can apply this against future taxable income.<br />
Specification of differences between the financial profit<br />
before tax and the tax basis for the year: <strong>2008</strong> 2007<br />
Pre-tax profit/loss 36 819 97 568<br />
Permanent differences -14 334 -22 644<br />
Change in temporary profit/loss differences -107 657 -14 212<br />
application of tax loss carryforward -245 -34 048<br />
Tax basis for the year -85 417 26 664<br />
Breakdown of the tax charge:<br />
Tax payable1 30 571 20 535<br />
Change in deferred taxes -30 144 -2 009<br />
Tax charge 427 18 526<br />
1 ) Tax payable is related to the foreign subsidiaries’ taxable profit that cannot be offset against the tax loss carryforward in Norway.<br />
Tax payable on the balance sheet: <strong>2008</strong> 2007<br />
Tax payable 30 571 20 535<br />
Prepaid tax in foreign subsidiaries -26 360 -5 879<br />
Tax payable on balance sheet 4 211 14 656<br />
Average tax rate for the group is: 22.0 % 22.5 %<br />
Calculated tax payable 8 100 27 319<br />
Too little/much allocated deferred taxes 421 0<br />
Profit JV -4 959 0<br />
Permanent differences, including amortisation of goodwill -3 136 -8 793<br />
Estimated tax charge 427 18 526<br />
note 15 liquid assets/short-term interest-bearing liabilities<br />
(aMounTS in noK 1 000)<br />
<strong>2008</strong> 2007<br />
Bank deposits, cash, etc. as of 31 December 267 233 353 138<br />
Deposits(+)/withdrawals(–) in the cash pool account system as of 31 December -6 179 171 653<br />
other short-term interest-bearing debt -509 698 -256 662<br />
Drawing facilities, security and covenants are described in note 13.<br />
83
71-89 noteS to the accountS ttS <strong>Group</strong><br />
note 16 Share capital and shareholder information<br />
(aMounTS in noK 1 000)<br />
Number of shares as of 31 December Nominal value Book value of share capital<br />
25 908 280 0.50 12 954 140<br />
THE FolloWinG CoMPaniES arE inCluDED in THE <strong>TTS</strong> MarinE GrouP:<br />
Ownership Number<br />
Company Owner interest Share capital of shares<br />
norlift aS (former <strong>TTS</strong> Eiendom aS) <strong>TTS</strong> Marine aSa 100 % noK 500 000 500<br />
<strong>TTS</strong> Handling Systems aS <strong>TTS</strong> Marine aSa 100 % noK 950 000 95 000<br />
<strong>TTS</strong> Ships Equipment aS <strong>TTS</strong> Marine aSa 100 % noK 2 500 000 2 500<br />
Hydralift Marine aS <strong>TTS</strong> Marine aSa 100 % noK 100 000 1 000<br />
<strong>TTS</strong> Ships Equipment aB <strong>TTS</strong> Marine aSa 100 % SEK 2 000 000 2 000<br />
<strong>TTS</strong> Marine Shanghai Co ltd <strong>TTS</strong> Marine aSa 100 % uSD 200 000 3 500<br />
<strong>TTS</strong> Ships Equipment GmbH <strong>TTS</strong> Ships Equipment aB 100 % Eur 255 646 5 000<br />
<strong>TTS</strong> Marine inc. <strong>TTS</strong> Ships Equipment aB 100 % uSD 190 000 1 900<br />
<strong>TTS</strong>-lMG Marine Cranes GmbH <strong>TTS</strong> Ships Equipment GmbH 100 % Eur 25 000 1<br />
<strong>TTS</strong> liftec oy <strong>TTS</strong> Ships Equipment aB 100 % Eur 76 500 1 020<br />
<strong>TTS</strong> Port Equipment aB <strong>TTS</strong> Ships Equipment aB 100 % SEK 100 000 1 000<br />
<strong>TTS</strong> Kocks GmbH <strong>TTS</strong> Ships Equipment GmbH 100 % Eur 1 000 000 1 000<br />
<strong>TTS</strong> Kocks ostrava s.r.o. <strong>TTS</strong> Ships Equipment GmbH 100 % Eur 310 291 1 000<br />
<strong>TTS</strong> Marine S.r.l <strong>TTS</strong> Ships Equipment aB 100 % Eur 10 400 1 000<br />
<strong>TTS</strong> Marine Cranes aS <strong>TTS</strong> Marine aSa 100 % noK 1 000 000 1 000<br />
<strong>TTS</strong> Cranes norway <strong>TTS</strong> Marine aSa 100 % noK 500 000 1 000<br />
<strong>TTS</strong> offshore Handling Equipment <strong>TTS</strong> Marine aSa 100 % noK 100 000 100 000<br />
<strong>TTS</strong> Sense aS <strong>TTS</strong> Marine aSa 100 % noK 1 200 288 400 076<br />
<strong>TTS</strong> Kocks Korea <strong>TTS</strong> Ships Equipment GmbH 100 % KrW 1 513 390 000 1 000<br />
<strong>TTS</strong> Hua Hai aB <strong>TTS</strong> Ships Equipment aB 100 % SEK 100 000 1 000<br />
<strong>TTS</strong> Sense (Canada) ltd <strong>TTS</strong> Sense aS 100 % CaD 100 10<br />
<strong>TTS</strong> Sense MuD aS <strong>TTS</strong> Sense aS 100 % noK 1 000 000 1 000<br />
<strong>TTS</strong> Sense Pte ltd Singapore <strong>TTS</strong> Sense aS 100 % SGD 100 000 100 000<br />
<strong>TTS</strong> Sense Drillfab <strong>TTS</strong> Sense aS 50 % noK 1 000 000 100 000<br />
<strong>TTS</strong> EDM inc <strong>TTS</strong> Sense aS 100 % uSD 100 000 1 000<br />
<strong>TTS</strong> Wellquip aS <strong>TTS</strong> Sense aS 100 % noK 1 100 000 110 000<br />
THE larGEST SHarEHolDErS in <strong>TTS</strong> MarinE aSa aS oF 31 DECEMBEr <strong>2008</strong> WErE:<br />
Shareholder Number of shares Ownership interest Voting share<br />
Skeie Technology aS 3 406 917 13.15 % 13.15 %<br />
rasmussengruppen aS 2 995 000 11.56 % 11.56 %<br />
lesk aS 2 024 361 7.81 % 7.81 %<br />
Stisk aS 2 024 361 7.81 % 7.81 %<br />
Citibank n.a. london 1 608 600 6.21 % 6.21 %<br />
nordea Bank PlC Finland 1 045 000 4.03 % 4.03 %<br />
Morgan Stanley & co 999 000 3.86 % 3.86 %<br />
Tamafe Holding aS 824 361 3.18 % 3.18 %<br />
Verdipapir odin 810 000 3.13 % 3.13 %<br />
rBC Dexia investor Services Bank 650 000 2.51 % 2.51 %<br />
itlution aS 516 165 1.99 % 1.99 %<br />
Skagen Vekst 476 000 1.84 % 1.84 %<br />
DnB nor Smb 435 000 1.68 % 1.68 %<br />
rBC Dexia investor Services Trust 390 000 1.51 % 1.51 %<br />
Svenska Handelsbanken depot 376 400 1.45 % 1.45 %<br />
odin Europa Smb 363 900 1.40 % 1.40 %<br />
Skeie Consultants aS 363 600 1.40 % 1.40 %<br />
Pensjonskassen Statoil 291 539 1.13 % 1.13 %<br />
Stichting Shell Pens. 284 003 1.10 % 1.10 %<br />
Holberg norge 278 400 1.07 % 1.07 %<br />
Total 20 largest shareholders 20 162 607 77.82 % 77.82 %<br />
Total others 5 745 673 22.18 % 22.18 %<br />
Total 25 908 280 100.00 % 100.00 %<br />
84
Shares ownded by board members and corporate management group and their related:<br />
Board Per 31.12.08 Per 27.04.09<br />
Bjarne Skeie 2) 3 770 517 3 770 517<br />
nils o. aardal 75 000 75 000<br />
olav Smeland 1 250 1 250<br />
Corporate Management <strong>Group</strong><br />
Johannes D. neteland 105 000 105 000<br />
- daugther anna S. neteland 100 100<br />
olav Bruåsdal 34 000 34 000<br />
Hans-Jan Erstad 20 000 20 000<br />
ivar K. Hanson 20 000 20 000<br />
Stellan Bernsro 20 000 20 000<br />
Edgar Bethmann 20 000 20 000<br />
Tom Fedog1) 281 420 281 420<br />
lennart Svensson 200 200<br />
Margrethe Hauge 100 100<br />
1) Owns Wary (100 %) who ownsr 50 % of Itlution AS and Itlution II AS who own a total of 562.840 shares in <strong>TTS</strong> Marine <strong>ASA</strong><br />
2) Owns (20 % of the shares and 100 % voting shares) in Skeie Technology AS and Skeie Consultans AS.<br />
on 22 May <strong>2008</strong> the annual General Meeting resolved to grant the Board authority to issue a maximum of 4 000 000 shares in the event of<br />
an acquisition or merger. This authorisation is valid until the annual General Meeting for <strong>2008</strong>, and no later than 30 June <strong>2008</strong>.<br />
as of 31 December <strong>2008</strong>, 380 000 options were allotted that can be exercised until 24 May 2009 at a price of noK 79 (from an authorisation for<br />
a total of 380,000 options granted at the ordindary General Meeting of 24 May 2007). in addition to 420 000 options that can be exercised until<br />
22 May 2010 at a price of noK 81. (From an authoristion for a total of 420 000 options granted at the annual General Meeting of 22 May <strong>2008</strong>).<br />
THE DiSTriBuTion oF oPTionS iS aS FolloWS:<br />
No. of options No. of options<br />
that can be that can be<br />
exercised until exercised until<br />
Name Position Company 30.05.09 Price 24.05.10 Price Total<br />
Johannes D. neteland President & CEo <strong>TTS</strong> Marine aSa 100 000 79.00 100 000 81.00 200 000<br />
olav Bruåsdal Financial director <strong>TTS</strong> Marine aSa 40 000 79.00 40 000 81.00 80 000<br />
Hans-Jan Erstad Chief of staff <strong>TTS</strong> Marine aSa 40 000 79.00 40 000 81.00 80 000<br />
Göran K. Johansson Division Director <strong>TTS</strong> Port Equipment aB 40 000 79.00 40 000 81.00 80 000<br />
ivar K. Hanson Division Director <strong>TTS</strong> Marine aSa 40 000 79.00 40 000 81.00 80 000<br />
Stellan Bernsro Division Director <strong>TTS</strong> Ships Equipment aB 40 000 79.00 40 000 81.00 80 000<br />
Edgar Bethmann Division Director <strong>TTS</strong> Kocks Gmbh 40 000 79.00 40 000 81.00 80 000<br />
Tom Fedog Division Director <strong>TTS</strong> Sense aS 40 000 79.00 40 000 81.00 80 000<br />
Margrethe Hauge Division Director <strong>TTS</strong> Marine aSa 0 - 40 000 81.00 40 000<br />
Total number of options to leading employees 380 000 420 000 800 000<br />
Share options exercised in <strong>2008</strong> resulted in the issue of a total of 170 000 shares. 170 000 of these shares were issued at noK 79 per share.<br />
in accordance with authorities granted by the annual General Meeting in 2005, 2006, 2007 and <strong>2008</strong>, <strong>TTS</strong> has issued share option programmes<br />
to its Management group. Through these programmes, <strong>TTS</strong>’ Managment <strong>Group</strong> have a future right to purchase a number of shares at a strike price<br />
equal to the marked rate on the date that the share purchase programme was initiated.<br />
The option premium is estimated on the date of allotment using the Black & Scholes option pricing model (BS).<br />
The options have a maximum term of two years, with a possible first exercise after one year (50 percent), then (12.5 percent) per quarter,<br />
giving a weighted averaged of 15 months maturity which is employed in BS. The option premium is distributed over the option’s two-year term.<br />
implied volatility is based on a combination of historic data and discretion. For options issued in 2006, a 30 percent volatility is used for 2006,<br />
a 35 percent volatility for 2007, and 42 percent volatility for <strong>2008</strong>.<br />
For 2006, a risk-free interest rate of 3.5 percent is used, for 2007 a rate of 4.5 percent, and for <strong>2008</strong> a rate of 5.0 percent.<br />
For <strong>2008</strong>, noK 5 446 in option premium is charged as an expense classified as salary in the profit and loss account.<br />
Employers’ national insurance contribution is charged as an expense over the vesting period. For <strong>2008</strong>, noK 1 054 million is charged as an expense<br />
classified as salary in the profit and loss account.<br />
oWn SHarES<br />
a resolution was adopted at the annual General Meeting of 22 May <strong>2008</strong> to authorise the Board to purchase a maximum of 400 000 of the<br />
company’s own shares. This authorisation is valid to annual General Meeting of 28 May <strong>2008</strong>, latest 30 June 2009. in the period <strong>TTS</strong> has owned<br />
a maximum og 133 100 shares.<br />
85
71-89 noteS to the accountS ttS <strong>Group</strong><br />
note 17 other short-term liabilities<br />
(aMounTS in noK 1 000)<br />
<strong>2008</strong> 2007<br />
Provisions for projects (see note 21) 144 419 83 870<br />
other provisions to the obligations (see note 21) 69 111 33 319<br />
Foreign currency contracts 80 782 57 411<br />
other current liabilities 275 147 153 788<br />
Total short-term liabilities 569 459 328 388<br />
The best estimate for date of payment for completed projects is within 12 months from the balance sheet date.<br />
note 18 other operating expenses<br />
(aMounTS in noK 1 000)<br />
<strong>2008</strong> 2007<br />
rent, costs for premises 48 919 29 608<br />
EDP costs 16 774 12 784<br />
Marketing, travel 82 973 58 802<br />
other 135 060 105 895<br />
Total other operating expenses 283 726 207 088<br />
note 19 related parties<br />
(aMounTS in noK 1 000)<br />
all the underlying subsidiaries (note 9), investments in joint ventures (note 10) members of the Board (note 4) and senior management<br />
are regarded as related parties. The group has carried out various transactions with underlying companies and joint ventures.<br />
all the transactions have been carried out at part of the ordinary operations and at arm’s length prices.<br />
Sales: <strong>2008</strong> 2007<br />
Joint Ventures 52 476 3 802<br />
Cost of sales:<br />
Joint Ventures 201 574 35 057<br />
iTEMS on THE BalanCE SHEET rElaTED To SalES anD CoST oF SalES To rElaTED ParTiES:<br />
Current assets:<br />
Joint Ventures 132 191 2 194<br />
Current liabilites:<br />
Joint Ventures 53 422 6 830<br />
information of shares and share options of the board and corporate management group follows in note 16.<br />
There are no further transaction with related parties.<br />
note 20 derivatives<br />
(aMounTS in noK 1 000)<br />
<strong>2008</strong> 2007<br />
Assets Liabilities Assets Liabilities<br />
Forward currency contracts – fair value hedging 70 350 339 043 53 988 20 480<br />
Forward currency contracts to fair value of the result 18 12 300 0 0<br />
Forward currency contracts Total 70 368 351 343 53 988 20 480<br />
The actual value of hedging instruments is classified as a short-term asset or obligation. actual value of the derivatives are classified<br />
as current assets or short-term liabilities, as the hedge objects and derivatives in all material aspects fall due within 12 months.<br />
ForWarD CurrEnCY ConTraCTS<br />
The nominal value of the outstanding forward currency contracts at 31 December 2009 is noK 4 596 million compared to noK 2 347 in 2007.<br />
Derivatives are in principle included at fair value on the date of signature of contract. The value is adjusted to actual value in later periods.<br />
<strong>TTS</strong> enters into hedging contracts that qualify as, and are considered accounting wise to be, fair value hedges. in addition to this, the group<br />
has hedging contracts that no longer meet the criteria of hedging accounting, as the underlying delivery contract has been cancelled. These are<br />
considered at fair value in the profit and loss account.<br />
Changes to fair value of the derivatives that meet the criteria of an effective hedge, are included in the profit and loss accounts together with changes<br />
to actual fair value of the hedged asset or liability. Changes to fair value of derivatives is posted to the profit and loss accounts as operating income<br />
or operating cost, both for derivatives that are effective hedges and those not qualified for hedging.<br />
The ineffective portion of the hedge value amounts to noK 13 378 and is posted together with the changes in value of derivatives.<br />
The asset or liability being hedged is contractual income or cost related to production cost. Hedged assets or liabilities are recognised in the balance<br />
sheet at actual value. The hedged asset or liability represents, among other things, the part of the contractual income or cost that has not been<br />
invoiced on the balance sheet date, or where invoices have not been received from the supplier. The asset and liability is included in other Short-term<br />
assets and other Short-term liabilities respectively.<br />
86
note 21 other provisions for obligations<br />
(aMounTS in noK 1 000)<br />
Delivered Product<br />
projects* guarantees* Other Total<br />
1 January <strong>2008</strong> 83 870 24 519 8 800 117 189<br />
Provisions for the year 85 949 10 967 34 407 131 323<br />
utilised during the year -25 400 -2 112 -7 470 -34 982<br />
31 December <strong>2008</strong> 144 419 33 375 35 736 213 530<br />
Classification on the balance sheet <strong>2008</strong> 2007<br />
other current liabilities 213 530 117 189<br />
*) Obligations related to supplementary work and other claims from the customer<br />
risk related to the estimates that form the basis for the posted values are further discussed in accounting principles,<br />
in sections 2.17 and 4.<br />
note 22 financial items and foreign currency gains/losses<br />
(aMounTS in noK 1 000)<br />
<strong>2008</strong> 2007<br />
other interest income 18 107 9 930<br />
interest on bank loans -89 663 -42 258<br />
net foreign currency gains/losses -6 240 -4 739<br />
Total -77 797 -37 067<br />
net other financial expenses mainly consists of foreign exhange profits and loss, in addition to bank-related transaction cost.<br />
note 23 earnings per share<br />
(aMounTS in noK 1 000)<br />
The earnings per share are calculated by dividing the portion of the net profit for the year that is attributable to the company’s<br />
shareholders with a weighted average of the number of outstanding ordinary shares throughout the year, less the company’s own shares.<br />
<strong>2008</strong> 2007<br />
net profit for the year attributable to the company’s shareholders 36 392 79 041<br />
Weighted average number of outstanding shares 25 839 23 250<br />
Earnings per share (noK per share) 1.41 3.40<br />
DiluTED EarninGS PEr SHarE<br />
in calculating the diluted earnings per share, the weighted average of the number of outstanding ordinary shares adjusted for<br />
the effect of the conversion of all the potential shares that can entail dilution is used.<br />
The company has share options where a calculation is made to determine the number of shares that could have been subscribed<br />
for at the market price (calculated at the average share price for the company’s shares throughout the year) based on the<br />
monetary value of the subscription rights for the outstanding share options. The number of shares calculated as explained above<br />
are compared with the number of shares that would have been issued if all the share options were exercised. The difference<br />
is placed in the denominator in the fraction as shares issued without consideration.<br />
<strong>2008</strong> 2007<br />
Profit used to calculate the diluted earnings per share 36 392 79 041<br />
average number of shares outstanding, ordinary shares 25 839 23 250<br />
adjustments for share options 0 179<br />
average number of ordinary shares for calculation of diluted earnings per share 25 839 23 429<br />
Diluted earnings per share (noK per share) 1.41 3.37<br />
87
71-89 noteS to the accountS ttS <strong>Group</strong><br />
note 24 events subsequent to the balance sheet date<br />
There is not proposed dividend to shareholders for <strong>2008</strong>.<br />
a subsidiary of <strong>TTS</strong> Marine aSa within the Drilling Equipment division, <strong>TTS</strong> Sense aSa, has a significant delivery contract<br />
for nine 250-ton rigs with the listed company ability Drilling aSa. rigs number 1 and 2 have been delivered. rigs number<br />
3 and 4 are scheduled for delivery in May and July of 2009, respectively. rigs number 5-9 will, subsequent to renegotiation<br />
in January 2009, be delivered 2010-2012. in total the contract amount of the 9 rigs constitute just over noK 1 billion.<br />
The 9 rig contacts were assessed as one contract and accounted for according to continuous settlement pursuant<br />
to iaS 11, Construction Contracts. in april of 2009, ability Drilling aSa defaulted on the third instalment of rig number 4 by<br />
noK 24 million. accordingly, <strong>TTS</strong> considers there to be uncertains as to whether ability Drilling aSa is able to maintain the order.<br />
The anticipated total loss on rigs 1-4 is charged as an expense of at 31.12.<strong>2008</strong>. This is the primary cause of modifications to<br />
the accounts in relation to previously reported figures for the fourth quarter of <strong>2008</strong>. at 31.12.<strong>2008</strong>, the <strong>TTS</strong> <strong>Group</strong> had an<br />
outstanding claim against ability Drilling aSa of noK 86 million. as of april 2009, the outstanding claim is noK 127 million,<br />
a part of which remains uncertain.<br />
note 25 exchange differences<br />
(aMounTS in noK 1 000)<br />
Exchange differences includes differences that as a result of translation of the financial<br />
reports of the foreign companies into noK.<br />
at 01.01.<strong>2008</strong> 4 902<br />
Exchange differences 2007<br />
Corporate companies -13 729<br />
Joint Ventures -1 774<br />
at 31.12.2007 -10 601<br />
Exchange differences <strong>2008</strong><br />
Corporate companies 32 784<br />
Joint Ventures 10 000<br />
at 31.12.<strong>2008</strong> 32 183<br />
note 26 contingencies<br />
Provisions for contingent liabilities have been made (see note 21). Beyond what has already been earmarked, no significant<br />
provisions are expected,<br />
The previous owners of <strong>TTS</strong> offshore Handling Equipment aS have an earn-out of a maximum of noK 2 million in 2007,<br />
noK 4 million in <strong>2008</strong> and noK 9 million in 2009, at most accumulated to noK 15 million. noK 2 million was realised<br />
in 2007 and paid in <strong>2008</strong>. Estimated earn-out for <strong>2008</strong> is noK 3 million.<br />
The previous owners of Sense EDM aS have an earn-out of a maximum of noK 75 million for 2007 and <strong>2008</strong>.<br />
Earn-out was not paid for 2007.<br />
The previous owners of Wellquip aS have an earn-out of a maximum of noK 20 million for <strong>2008</strong> and 2009.<br />
note 27 Government grants<br />
<strong>TTS</strong> has through one subsidiaries received a grant from public institutions to research and development activites that is<br />
approved under the public institutions SKaTTEFunn. The company received a total of TnoK 459.<br />
Governmental subsidies are recorded at fair market value when there is reasonable certainty that the subsidy will be received<br />
and that the group will meet the requirements related to the subsidy.<br />
note 28 business integration<br />
(aMounTS in noK 1 000)<br />
in February <strong>2008</strong>, <strong>TTS</strong> Sense aS acquired 100 percent of the shares in Wellquip Holding aS in Kristiansand for cash of noK 70 million<br />
plus an earn-out of noK 20 million subject to the development in <strong>2008</strong> and 2009. The company, with its 24 employees,<br />
delivers drilling equipments to the offshore industry.<br />
The explanation of acquired net assets and goodwill are as follows:<br />
Acquisition cost:<br />
Cash sum 70 000<br />
in total acquisition costs 70 000<br />
Fair market value of net acquired assets (e.g. goodwill) -3 257<br />
Technology 10 000<br />
Goodwill 63 257<br />
88
note 29 financial risk management<br />
(aMounTS in noK 1 000)<br />
Financial assets and liabilities are desribed in accounting principles, sections 2.7, 2.9, 2.11, 2.12, 2.14 and 2.15.<br />
risk related to the estimates that form the basis for the posted values are further discussed in accounting principles, section 3.<br />
ClaSSiFiCaTion oF FinanCial aSSETS<br />
<strong>2008</strong> 2007<br />
Derivates Derivates<br />
related to Assets related to Assets<br />
hedging Loans and available In total hedging Loans and available In total<br />
purposes receivables for sale <strong>2008</strong> purposes receivables for sale 2007<br />
Financial assets:<br />
loans to jointly controlled venture 0 0 0 0 0 0 0 0<br />
Shares 0 0 1 945 1 945 0 0 2 153 2 153<br />
other receivables 0 3 400 0 3 400 0 1 891 0 1 891<br />
Financial current assets:<br />
accounts receivable 0 732 239 0 732 239 0 423 867 0 423 867<br />
other current receivables 0 468 076 0 468 076 0 137 500 0 137 500<br />
Earned, not invoiced production 0 884 156 0 884 156 0 596 638 0 596 638<br />
Derivatives 70 360 0 0 70 360 53 988 0 0 53 988<br />
advances to suppliers 0 203 922 0 203 922 0 189 984 0 189 984<br />
Bank deposit, cash in hand etc 0 267 231 0 267 231 0 353 138 0 353 138<br />
Total financial assets 70 360 2 559 024 1 945 2 631 329 53 988 1 703 018 2 153 1 759 159<br />
The group has no financial assets classed as hold to maturity or available for sale as of 31.12.06 or 31.12.07.<br />
Fair market value of financial assets:<br />
The group’s derivatives consist of forward exchange contratcs. The fair market value of forward exchange contracts is determined by employing<br />
the market-to-market rate on the balance sheet date.<br />
ClaSSiFiCaTion oF FinanCial liaBiliTiES<br />
<strong>2008</strong> 2007<br />
Derivates Derivates<br />
related to Other related to Other<br />
hedging financial In total hedging financial In total<br />
purposes liabilities <strong>2008</strong> purposes liabilities 2007<br />
Non-current financial liabilities:<br />
interest-bearing non-current liabilities 0 532 297 532 297 0 563 166 563 166<br />
Current financial liabilities:<br />
First year’s instalment on non-current liabilities 0 30 967 30 967 0 26 173 26 173<br />
interest-bearing current liabilities 0 213 667 213 667 0 20 461 20 461<br />
Prepayment from customers 0 931 910 931 910 0 570 445 570 445<br />
Costs related to facilities under construction 0 72 102 72 102 0 273 715 273 715<br />
Derivatives 351 342 0 351 342 20 480 0 20 480<br />
accounts payable and other non-current liabilities 0 1 176 834 1 176 834 0 619 377 619 377<br />
Total financial liabilities 351 342 2 457 777 3 309 119 20 480 2 073 337 2 093 817<br />
Fair market value of financial liabilities:<br />
The group’s derivates consist of forward exchange contratcs. The fair market value of forward exchange contracts is determined by employing<br />
the market-to-market rate given by the bank on the balance sheet date.<br />
Fair market value related to non-current loans are regarded to be nearly approximate to the recorded value, as loans are given at market terms<br />
and with a floating rate of interest.<br />
89
profit and loss account<br />
ttS marine aSa<br />
1 january - 31 december<br />
(aMounTS in noK 1 000) nGaaP nGaaP<br />
<strong>2008</strong> 2007<br />
oPEraTinG inCoME noTES<br />
income from projects 2 727 -<br />
other operating income 102 -<br />
<strong>Group</strong> contribution from <strong>TTS</strong> - subsidiaries 26 753 14 414<br />
Total operating income 29 582 14 414<br />
oPEraTinG CoST<br />
Cost of sales 24 -<br />
Personell costs 1, 2 18 842 15 690<br />
Depreciation 3, 4 395 269<br />
other operating costs 1, 14 22 841 6 663<br />
Write downs of shares 5 349 15 944<br />
Total operating expenses 42 451 38 566<br />
operating profit -12 869 -24 152<br />
FinanCial inCoME anD ExPEnSES<br />
income from investments in subsidiaries 6 21 580 80 543<br />
income from investments in joint ventures 6 1 140 4 659<br />
interest received from group companies 16 5 785 3 574<br />
other interest income 16 19 551 5 766<br />
other financial income 16 5 7<br />
other interest expenses 16 -46 772 -27 514<br />
other financial expenses 16 -688 -3 998<br />
net financial items 600 63 036<br />
profit before income tax -12 269 38 884<br />
income tax payable 10 -9 767 -11 684<br />
net profit for the year -2 502 50 568<br />
<strong>TTS</strong> GrouP 4-8<br />
rEPorT FroM THE CEo 9-11<br />
BuSinESS arEaS 12-37<br />
CorPoraTE GoVErnanCE 38-47<br />
director’S report and accountS 48-110<br />
91
4-8 T T S G r o u P<br />
9-11 rEPorT FroM THE CEo<br />
12-37 B u S i n E S S a r E a S<br />
38-47 CorPoraTE GoVErnanCE<br />
48-110 director’S report and accountS<br />
balance Sheet<br />
ttS marine aSa<br />
aSSetS<br />
(aMounTS in noK 1 000) nGaaP nGaaP<br />
31.12.08 31.12.07<br />
intangible fixed assets noTES<br />
Deferred tax assets 10 56 745 46 978<br />
Total intangible fixed assets 56 745 46 978<br />
TanGiBlE FixED aSSETS<br />
Machinery and vehicles 3 686 353<br />
Furniture, office- and computer equipment 3 440 400<br />
Total tangible fixed assets 1 126 752<br />
FixED aSSET inVESTMEnTS<br />
investments in associated companies 6 1 134 250 1 078 282<br />
loans to companies in the same group 6 13 740 11 836<br />
investments in associated companies 7 149 782 46 865<br />
investments in shares and other financial instruments 5 1 945 2 153<br />
other receivables 7 1 143 45 305<br />
Pensions 2 1 663 209<br />
Total fixed asset investments 1 302 522 1 184 649<br />
total fixed assets 1 360 394 1 232 380<br />
current assets<br />
aCCounTS rECEiVaBlE<br />
receivables from customers 7 2 936 49<br />
intragroup accounts receivables 7 25 618 7 023<br />
other receivables 3 700 4 858<br />
other intragroup receivables 1 710 53 547<br />
Total receivables 33 964 65 476<br />
Bank deposits, cash in hand, etc. 11 128 039 203 427<br />
total current assets 162 003 268 903<br />
total assets 1 522 398 1 501 283<br />
92
equity and liabilitieS<br />
(aMounTS in noK 1 000) nGaaP nGaaP<br />
31.12.08 31.12.07<br />
equity<br />
CallED-uP anD FullY PaiD SHarE CaPiTall noTES<br />
Share capital 12 12 954 12 869<br />
Company’s own shares 12 -67 -2<br />
Share premium account 122 891 611 580<br />
Total called-up and fully paid share capital 135 779 624 447<br />
rETainED EarninGS<br />
Valuation variable fund 189 485 134 308<br />
other reserves 552 470 81 445<br />
Total retained earnings 741 955 215 753<br />
total equity 877 733 840 200<br />
liabilities<br />
oTHEr lonG-TErM liaBiliTiES<br />
Debt to financial institutions 8, 9 622 632 531 816<br />
Total other long-term liabilities 622 632 531 816<br />
CurrEnT liaBiliTiES<br />
Payables to suppliers 1 112 1 386<br />
Payables to internal suppliers 1 271 1 122<br />
other taxes payable 1 505 2 095<br />
Dividends 22 - 32 173<br />
other intragroup liabilities 18 2 315<br />
other current liabilities 15 18 127 90 175<br />
Total current liabilities 22 033 129 266<br />
total liabilities 644 665 661 082<br />
total equity and liabilities 1 522 398 1 501 283<br />
Bergen, 27 april 2009<br />
The Board of <strong>TTS</strong> Marine aSa<br />
Birger Skeie anne Breive nils aardal Bjarne Skeie<br />
CHairMan DirECTor DirECTor DirECTor<br />
olav Smeland anne-Karin Bedringås Kjerstin Fyllingen Johannes D. neteland<br />
DirECTor DirECTor DirECTor PrESiDEnT & CEo<br />
93
4-8 T T S G r o u P<br />
9-11 rEPorT FroM THE CEo<br />
12-37 B u S i n E S S a r E a S<br />
38-47 CorPoraTE GoVErnanCE<br />
48-110 director’S report and accountS<br />
equity Statement<br />
ttS marine aSa<br />
Company’s Share Valuation<br />
Share own premium variance Other<br />
(aMounTS in noK 1 000) capital shares account fund reserves Total<br />
equity as of 1 january 2007 12 869 -2 611 580 134 308 81 455 840 200<br />
Depreciation of share premium account 0 0 -500 000 0 500 000 0<br />
options 0 0 0 0 0 0<br />
Company’s own shares 0 -65 0 0 -2 850 -2 915<br />
new issue 85 0 5 865 0 0 5 950<br />
Cost of new issue 0 0 0 0 0 0<br />
Cost of share option 0 0 5 447 0 0 5 447<br />
Currency differences concerning equity method 0 0 0 0 31 553 31 553<br />
Dividends 0 0 0<br />
net profit for the year 0 0 0 53 577 -56 079 -2 502<br />
equity as of 31 december <strong>2008</strong> 12 954 -67 122 892 187 885 554 069 877 733<br />
94
consolidated cash flow Statement<br />
ttS marine aSa<br />
1 january - 31 december<br />
(aMounTS in noK 1 000) <strong>2008</strong> 2007<br />
cash flow from operations<br />
net profit for the year -12 269 38 884<br />
income from investments in subsidiaries -21 580 -85 202<br />
Depreciation 395 269<br />
Gains/losses on the sale of tangible fixed assets 349 15 994<br />
Share of gain from associated companies -1 140 0<br />
Foreign currency gains/losses on loans 1 704 -12 686<br />
Difference between pension charges and payments to/from pension schemes -1 454 -4 063<br />
inventories 0 26 223<br />
Customer receivables and other receivables 31 512 186 393<br />
Payables to supplies and other short-term liabilities -75 059 -62 693<br />
net cash flow from operations -77 541 103 119<br />
cash flow from investments<br />
acquisition of subsidiaries (less cash balances in subsidiaries) 0 -524 969<br />
receipts from sale of tangible fixed assets 173 0<br />
Disbursements for acquisition of tangible fixed assets -941 -501<br />
receipts on other claims (loans) 329 0<br />
increase in long-term receivables 0 -24 783<br />
receipts from group constributions/dividends 0 18 765<br />
Payments on other claims (loans) -59 084 -13 561<br />
net cash flow from investments -59 523 -545 049<br />
cash flow from financing<br />
receipts from new short-term/long-term debt 100 000 495 348<br />
repayment of short-term/long-term debt -9 185 -109 861<br />
Payment to group company 0 -38 348<br />
net change in bank overdraft 0 0<br />
Dividends paid to company shareholder -32 173 -22 493<br />
Paid-in equity 3 035 292 063<br />
net cash flow from financing 61 678 616 709<br />
effect of exchange rate fluctuations on cash balances and cash equivalents<br />
net change in cash and cash equivalents -75 386 174 779<br />
Cash and cash equivalents at the start of the period 203 426 28 649<br />
Cash and cash equivalents at the end of the period 128 039 203 428<br />
This consists of:<br />
Bank deposits etc. 128 039 203 427<br />
95
4-8 T T S G r o u P<br />
9-11 rEPorT FroM THE CEo<br />
12-37 B u S i n E S S a r E a S<br />
38-47 CorPoraTE GoVErnanCE<br />
48-110 director’S report and accountS<br />
accounting principles<br />
ttS marine aSa<br />
The financial statements have been prepared in accordance with<br />
The norwegian accounting act of 1998 and generally accepted<br />
accounting principles.<br />
Subsidiaries, associated companies<br />
Subsidiaries are valuated according to the equity method in the annual<br />
accounts. The parent company’s share of the result is based on the<br />
invested companies’ post-tax result after allowing for internal gains<br />
and possible depreciation of any additional value arising because the<br />
cost price of the shares was higher than the acquired share of the<br />
book equity. in the profit and loss account, the share of the profit is<br />
posted under financial items, while the assets in the balance sheet<br />
are posted under financial assets.<br />
also associated companies (joint ventures) are included in the<br />
accounts in accordance with the cost method. This means that the<br />
result is included as financial income and portion of equity is included<br />
under financial assets.<br />
operating income<br />
operating income includes income on delivered products and services<br />
granted over the year. The income is booked when the services are delivered.<br />
classification and valuation of balance sheet items<br />
Current assets and short term liabilities include items which fall<br />
due within one year of the end of the financial year, as well as items<br />
related to the operating cycle. other items are classified as fixed<br />
assets/long-term liabilities.<br />
Current assets are valued at the lowest of cost and market value.<br />
Short-term liabilities are posted in the balance sheet at the nominal<br />
value at the time of initial establishment.<br />
Fixed assets are recorded at cost, but are written down to net<br />
r ealizable value if the diminution in value is not expected to be<br />
temporary. long-term liabilities are posted in the balance sheet at<br />
the nominal value at the time the initial establishment.<br />
accounts receivables<br />
Trade debtors and other accounts receivables are recorded in the<br />
balance sheet at their nominal value reduced by a provision for bad<br />
debts. The provisions are made on the basis of an individual assessment<br />
of each balance. in addition, an unspecified provision is made to<br />
cover expected losses.<br />
fixed assets<br />
Fixed assets are booked on the balance sheet and depreciated over<br />
the asset’s life span if the expected life span exceeds 3 years and has<br />
a cost price higher than noK 15 000. Direct maintenance of assets<br />
is expensed as incurred under operating expenses, while renovation<br />
or upgrading is added to the asset’s cost price and is depreciated in<br />
line with the asset.<br />
96<br />
pensions<br />
The company has a defined-benefit pension. The pension expenses<br />
and pension commitments are calculated on a straight-line earning<br />
profile basis, based on assumptions relating to discount rates, projected<br />
salaries, the amount of benefits from the national insurance Scheme,<br />
future return on pension funds, and actuarial calculations relating<br />
to mortality rate, voluntary retirement, etc. Pension funds are valued<br />
at net realizable value and deducted in the net pension commitment<br />
in the balance sheet. Changes in the commitment due to changes<br />
in the pension plans are written down over the expected remaining<br />
service period. The same applies to estimated differences if they exceed<br />
10 % of the largest of the pension commitment and pension funds<br />
(corridor).<br />
Social security fees are expensed on basis of pension premiums<br />
paid for pension schemes and accrued changes in net pension<br />
commitment.<br />
taxes<br />
The tax expense in the profit and loss account includes both the<br />
current tax payable and change in deferred tax. Deferred tax is<br />
estimated to 28 % based on the temporary changes between taxation<br />
and accounting values, as well as tax losses carried forward to the<br />
end of the fiscal year. Tax-increasing and tax-reducing temporary<br />
differences which are reversed, or could be reversed, during the<br />
same period are offset against each other and recorded as a net sum.<br />
Temporary changes are only assessed for the norwegian companies.<br />
foreign currency<br />
items in foreign currency are converted to noK at the exchange rate<br />
on the balance sheet date. For future contracts, forward rates are used.<br />
cash flow statement<br />
The cash flow statement has been prepared according to the indirect<br />
method. Cash and cash equivalents include cash, bank deposits, and<br />
other short term investments which immediately and with minimal<br />
exchange risk can be converted into known cash amounts, with due<br />
date less than three months from purchase date.<br />
cash and cash equivalents<br />
Cash and cash equivalents consist of cash and bank deposits. Bank<br />
deposits in foreign currencies are assessed to the exchange rate of the<br />
balance sheet date.
notes<br />
ttS marine aSa<br />
note 1 personnel expenses, number of employees, other remunerations, loans to employees, etc.<br />
(aMounTS in noK 1 000)<br />
Payroll expenses <strong>2008</strong> 2007<br />
Salaries 13 710 10 156<br />
Employer’s social security contribution 2 583 2 702<br />
Pension costs 533 664<br />
other benefits 2 016 2 168<br />
Total personnel expenses 18 842 15 690<br />
number of employees as of 31 December 8 6<br />
Remuneration to board members <strong>2008</strong> 2007<br />
Birger Skeie (Board Chairman from 22.05.08) 160 0<br />
Bjarne Skeie (from 22.05.08) 102 0<br />
nils aardal (Board Chairman to 22.05.08) 245 310<br />
anne Breive 205 170<br />
Hilde P. aa. Krøgenes (to 22.05.08) 73 150<br />
agnar Gravdal (to 22.05. <strong>2008</strong>) 73 88<br />
Kjerstin Fyllingen (from 22.05.08) 120 0<br />
John M. lunde (to June 2007) 0 63<br />
olav Smeland 88 75<br />
oddmund Hatletun (to September 08) 37 75<br />
anne-Karin Bedringås (from September 08) 51 0<br />
Total 1 153 931<br />
*) The <strong>Annual</strong> General Meeting determines the remuneration to the Board from one general meeting to the next. For accounting year <strong>2008</strong>,<br />
the same remuneration was stipulated as was determined by the Board at the <strong>Annual</strong> General Meeting for <strong>2008</strong>.<br />
noMinaTion CoMMiTTEE rEMunEraTion<br />
<strong>TTS</strong>’s nominations committee comprises the following members: Bjørn olafsson (Chairman), Bjørn Sjaastad and Harald Espedal.<br />
Proposed remuneration <strong>2008</strong> is TnoK 40 for the chairman and TnoK 25 to members, a total of TnoK 90.<br />
STaTEMEnT rEGarDinG THE STiPulaTion oF rEMunEraTion anD oTHEr BEnEFiTS For THE PrESiDEnT & CEo anD oTHEr ExECuTiVES<br />
The remuneration policy of <strong>TTS</strong> Marine aSa is based on offering the group management competitive conditions.<br />
The level of remuneration shall reflect that the company is a listed company focusing internationally.<br />
The annual remuneration is based on the group management taking part in the company’s results, and in the added value for the shareholders<br />
through increased company value.<br />
remuneration consists of three main components; base salary, bonus and a share option program.<br />
Bonus is determined on the basis of target results. in certain circumstances where change and development are of a decisive nature,<br />
the bonus is further based on specific development targets. Bonus targets are revisited annually.<br />
The maximum bonus is one year’s base salary for the President & CEo, and up to 50 percent for other executives.<br />
Since 1998, a share option program has been active for the group management of <strong>TTS</strong>; the goal being that the group management<br />
shall have the same incentive as the shareholders in respect of increasing company value over time. The annual General Meeting has each year<br />
given the Board authority to establish share option programs with a two year term. redemption price equals market price on allotment.<br />
First exercise is 50 percent after one year. Thereafter 12.5 percent per quarter, in addition to share options that have not been previously exercised.<br />
Share options may not be exercised subsequent to the second anniversary.<br />
The group pension scheme in norway is based on approximately 65 percent of base salary at the age of 67, limited to a maximum of 12G.<br />
For employees abroad, the schemes prevailing in the respective companies where they are employed apply.<br />
The period of notice is 6 months with a severance pay from 6 to 24 months, period of notice inclusive.<br />
The share option program is conditional upon the annual General Meeting’s approval, based on the Board being granted authority to make<br />
such allotments. The President & CEo’s remuneration is determined by the Board of <strong>TTS</strong> Marine aSa.<br />
With respect to other executives, their remuneration is determined by the boards of the respective subsidiaries / President & CEo.<br />
97
97-108 noteS to the accountS ttS marine aSa<br />
note 1 cont.<br />
rEMunEraTion anD oTHEr BEnEFiTS For THE PrESiDEnT & CEo anD oTHEr ExECuTiVES<br />
Other Bonus Share Pension<br />
Name Position Remuneration benefits paid options Total benefits<br />
Johannes D. neteland President & CEo 1 631 406 1 202 2 200 5 438 113<br />
olav Bruåsdal Financial Director 1 074 221 207 880 2 382 89<br />
Hans-Jan Erstad Manager Hr-iT-qa 713 89 84 880 1 766 169<br />
ivar K. Hanson Man. Director MC 1 202 97 344 880 2 522 86<br />
lennart Svensson Man. Director PMH 886 0 4 0 891 290<br />
Stellan Bernsro Man. Director DCH 1 037 0 455 880 2 372 251<br />
Edgar Bethmann Man. Director DM 1 405 164 0 880 2 449 0<br />
Tom Fedog Man. Director DE 1 313 0 0 0 1 313 28<br />
Margrethe Hauge (from March 08) Man. Director Services 884 308 0 0 1 192 87<br />
remuneration Taxable remuneration<br />
other benefits Free car, life insurance, telephone, newspapers etc.<br />
Bonus paid Bonus paid in current year<br />
Share options Difference between market price and exercise price<br />
Total Total taxable remuneration<br />
The pension premium for the President & CEo is based on pension payments of approximately 65 percent of his base salary from the age of 67,<br />
for the CFo approximately 65 percent of a maximum of 12G. in addition, an early retirement scheme from the age of 60 that pays approximately<br />
60 percent of base salary is established. With effect from 2007, the group pension scheme will be based on approximately 65 percent of base salary<br />
at the age of 67, limited to a maximum of 12G. additional pension benefits will be adjusted similar to other benefits.<br />
The period of notice for the President & CEo is 6 months, with a severance pay of 24 months, period of notice inclusive, and from 6 to 24 months<br />
for other group executives.<br />
auDiTor FEES<br />
<strong>2008</strong> 2007<br />
Statutory auditing 516 501<br />
others certifications 52 67<br />
other assistance including tax consulting 832 1 200<br />
Total 1 400 1 768<br />
98
note 2 pensions<br />
(aMounTS in noK 1 000)<br />
The norwegian companies in the group have defined benefit pension schemes that entitle the employees to defined future pension benefits<br />
dependent on the number of years of service, salary level, retirement age and national insurance benefits received.<br />
The pension scheme includes 8 persons as of 31 December <strong>2008</strong>.<br />
Net pension funds recorded on the balance sheet<br />
are determined as follows: <strong>2008</strong> 2007<br />
Insured Uninsured Total Insured Uninsured Total<br />
Market value of pension funds 13 144 0 13 144 11 355 0 11 355<br />
- net present value of accrued pension obligations -14 805 -84 -14 889 -9 752 -175 -9 927<br />
+ unrecognised estimate changes and deviations 3 997 -336 3 661 -1 002 -217 -1 219<br />
accrued employer’s share of<br />
- national insurance contributions -242 -12 -254 0 0 0<br />
= net pension obligation 2 095 -432 1 663 601 -392 209<br />
Net pension costs are determined as follows: <strong>2008</strong> 2007<br />
Insured Uninsured Total Insured Uninsured Total<br />
net present value of current year’s pension<br />
benefits accrued 602 11 614 619 10 629<br />
+ interest payable on pension obligations 485 9 494 373 7 380<br />
- Expected return on pension funds -640 0 -640 -767 0 -767<br />
+ recognised estimate changes and deviations 38 -39 -1 258 0 258<br />
+ Change in employer’s share of national insurance<br />
contributions 63 3 66 0 -40 -40<br />
= Total costs, including payroll expenses 549 -16 533 483 -23 460<br />
Change in book value of funds: <strong>2008</strong> 2007<br />
Book value as of 1 January 209 -3 854<br />
+ obligation with transfer of operation 0 3082<br />
- Costs recognised during the year (see above) -533 -460<br />
+/- Pension payments and payment of pension premiums 1 987 1 441<br />
= Book value as of 31 December 1 663 209<br />
The following economic assumptions have been made for calculation<br />
of the pension obligations: <strong>2008</strong> 2007<br />
31.12. 1.1 31.12. 1.1<br />
return on pension funds 5.80 % 5.40 % 6.10 % 5.40 %<br />
Discount rate 3.80 % 4.35 % 5.10 % 4.35 %<br />
annual wage inflation 4.00 % 4.50 % 4.50 % 4.50 %<br />
annual adjustment of the basic national insurance amount (G) 3.75 % 4.25 % 4.25 % 4.25 %<br />
annual adjustment of pensions being paid out 3.80 % 1.65 % 2.35 % 1.65 %<br />
Voluntary retirement 10.00 % 10.00 % 10.00 % 10.00 %<br />
Withdrawal tendency for early retirement (aFP) 45.00 % 45.00 % 45.00 % 45.00 %<br />
Employer’s share of national insurance contributions 14.10 % 14.10 % 14.10 % 14.10 %<br />
99
97-108 noteS to the accountS ttS marine aSa<br />
note 3 tangible fixed assets<br />
(aMounTS in noK 1 000)<br />
100<br />
Furniture<br />
Machinery and office Computer<br />
and vehicles equipment equipment Total<br />
aS oF 1 JanuarY 2007<br />
acquisition cost as of 31 December 7 010 5 891 15 368 28 269<br />
accumulated depreciation as of 31 December -5 563 -4 391 -10 555 -20 509<br />
Book value as of 31 December 1 447 1 500 4 813 7 760<br />
2007 FinanCial YEar<br />
Book value as of 1 January 1 447 1 500 4 813 7 760<br />
Disposal of acc. depreciation related to transfer of operation -6 170 -5 891 -15 368 -27 429<br />
additions during the year 5 244 4 390 10 555 20 189<br />
additions during the year 0 501 0 501<br />
Depreciation for the year -168 -101 0 -269<br />
Book value as of 31 December 353 399 0 752<br />
aS oF 31 DECEMBEr 2007<br />
acquisition cost as of 31 December 840 501 0 1 341<br />
accumulated depreciation as of 31 December -487 -102 0 -589<br />
Book value as of 31 December 353 399 0 752<br />
<strong>2008</strong> FinanCial YEar<br />
Book value as of 1 January 353 399 0 752<br />
additions during the year 700 137 104 941<br />
Disposals during the year -173 0 0 -173<br />
Depreciation for the year -194 -181 -20 -395<br />
Book value as of 31 December 687 355 84 1 126<br />
aS oF 31 DECEMBEr <strong>2008</strong><br />
Historical cost as of 31 December 1 368 638 104 2 110<br />
accumulated depreciation as of 31 December -681 -283 -20 -984<br />
Book value as of 31 December 687 355 84 1 126
note 4 intangible fixed assets<br />
(aMounTS in noK 1 000)<br />
R&D, Patents,<br />
Licences Goodwill Total<br />
aS oF 1 JanuarY 2007<br />
Historical cost as of 1 January 5 550 26 104 31 654<br />
accumulated depreciation as of 1 January -1 020 -6 290 -7 310<br />
Book value as of 1 January 4 530 19 814 24 344<br />
2007 FinanCial YEar<br />
Book value as of 1 January 4 530 19 814 24 344<br />
Disposals related to transfer of operation -5 550 -26 104 -31 654<br />
additions during the year 1 020 6 290 7 310<br />
Disposals during the year 0 0 0<br />
Depreciation for the year 0 0 0<br />
Book value as of 31 December 0 0 0<br />
aS oF 31 DECEMBEr 2007<br />
acquisition cost as of 31 December 1 020 6 290 7 310<br />
accumulated depreciation as of 31 December -1 020 -6 290 -7 310<br />
Book value as of 31 December 0 0 0<br />
<strong>2008</strong> FinanCial YEar<br />
Book value as of 1 January 0 0 0<br />
Disposals related to transfer of operation 0 0 0<br />
Disposals of acc. depreciations related to transfer of operation 0 0 0<br />
additions during the year 0 0 0<br />
Disposals during the year 0 0 0<br />
Depreciation for the year 0 0 0<br />
Book value as of 31 December 0 0 0<br />
aS oF 31 DECEMBEr <strong>2008</strong><br />
Historical cost as of 31 December 0 0 0<br />
accumulated depreciation as of 31 December 0 0 0<br />
Book value as of 31 December 0 0 0<br />
note 5 Shares in other companies<br />
(aMounTS in noK 1 000)<br />
Ownership Historical<br />
interest cost Book value<br />
<strong>2008</strong> 2007<br />
Fixed assets<br />
Shin Young Heavy industry 13.4 % 222 222 222<br />
FastShip inc.* 6.7 % 13 326 1 723 1 930<br />
Total shares in other companies 13 548 1 945 2 152<br />
*) On the balance sheet as of 31.12, the company has entered 615 156 shares in FastShip Inc (FSI) with a recorded value of NOK 1.7 million.<br />
The shares were written down by NOK 11.4 million in 2007 and further 0.2 million in <strong>2008</strong> to estimated market value. Additionally, three<br />
convertible loans have been entered with NOK 1.1 in the entry for other receivables. The convertible loans were written down by NOK 4.5 million<br />
in 2007 and 0.1 MNOK in <strong>2008</strong>. Total write-downs related to FastShip in <strong>2008</strong> are NOK 16.2 million. <strong>TTS</strong> has been involved in the FastShip project<br />
since 1996.There are still activity in the project. Should the project remain unrealized and <strong>TTS</strong> have to write off the remaining assets entries,<br />
equity will be reduced by a corresponding amount. (In total NOK 3.2 million.)<br />
101
97-108 noteS to the accountS ttS marine aSa<br />
note 6 Subsidiaries<br />
(aMounTS in noK 1 000)<br />
Acquisition Ownership Voting<br />
Subsidiaries Registered office date interest share<br />
<strong>TTS</strong> Handling Systems aS Drøbak, norway 1994 100 % 100 %<br />
<strong>TTS</strong> Ships Equipment aS Bergen, norway 1996 100 % 100 %<br />
norlift aS Bergen, norway 1994 100 % 100 %<br />
Hydralift Marine aS Kristiansand, norway 2003 100 % 100 %<br />
<strong>TTS</strong> Ships Equipment aB Gothenburg, Sweden 2002 100 % 100 %<br />
<strong>TTS</strong> Marine Shanghai Co ltd Shanghai, China 2002 100 % 100 %<br />
<strong>TTS</strong> Marine Cranes aS Bergen, norway 2006 100 % 100 %<br />
<strong>TTS</strong> Cranes norway aS Bergen, norway 2007 100 % 100 %<br />
<strong>TTS</strong> offshore Handling Equipment aS Ålesund, norway 2007 100 % 100 %<br />
<strong>TTS</strong> Sense aS Kristiansand, norway 2007 100 % 100 %<br />
Associated companies:<br />
<strong>TTS</strong> Bohai Machinery Co. ltd Dalian, China 2005 50 % 50 %<br />
Companies are accounted for in accordance with the equity method.<br />
<strong>TTS</strong> <strong>TTS</strong> <strong>TTS</strong> <strong>TTS</strong> <strong>TTS</strong> Cranes <strong>TTS</strong> <strong>TTS</strong><br />
<strong>TTS</strong> HS Norlift SE AS SE AB Ma.Sh Cranes AS Norway AS OHE AS Sense AS Total<br />
Historical cost at time of acquisition 9 589 500 14 232 303 180 1 386 40 000 25 000 619 253 1 013 140<br />
of which goodwill 7 129 255 163 2 053 23 165 506 719 794 229<br />
of which excess value -453 19 950 19 497<br />
Unamortised excess value/goodwill as of 31 December:<br />
Goodwill 4 585 220 288 1 899 23 165 455 350 705 287<br />
amortisation of GW -424 -13 524 -103 -1 493 -965 -22 083 -38 592<br />
unamortised goodwill as of 31 December 0 0 4 161 206 764 1 796 -1 493 0 22 200 433 267 666 695<br />
Calculation of profit for the year:<br />
Share of profit/loss for the year 11 029 6 6 331 96 126 -1 844 -17 764 1 791 5 318 -40 970 60 022<br />
amortisation of goodwill -424 -13 524 -103 -1 493 -965 -22 083 -38 592<br />
Elimination of intragroup transactions 150 0 150<br />
income from investments in subsidiaries 11 179 6 5 907 82 602 -1 947 -19 257 1 791 4 353 -63 054 21 580<br />
Shares in subsidiaries:<br />
opening balance 1 January 7 554 318 22 101 327 410 9 500 41 331 562 27 277 642 229 1 078 282<br />
additions associated companies/subsidiaries 0 0 0 0 0 0 0 2 000 1 602 3 602<br />
Disposals subsidiaries 0 0 0 0 0 0 0 0 0 0<br />
income from investments in subsidiaries 11 179 6 5 907 82 602 -1 947 -19 257 1 791 4 353 -63 054 21 580<br />
<strong>Group</strong> contributions/dividends 0 0 0 0 0 0 0 0 0 0<br />
Foreign currency effects 0 0 0 26 714 4 075 0 0 0 0 30 789<br />
uB 31.12. 18 733 324 28 008 436 726 11 629 22 074 2 353 33 630 580 777 1 134 250<br />
SHarES in JoinT VEnTurES <strong>TTS</strong> Bohai<br />
Machinery Co., Ltd<br />
iB 01.01. 11 836<br />
opening balance 1 January 11 836<br />
acquisition/Start-up of the company 0<br />
Share of profit/loss 1 140<br />
Dividends 0<br />
Forgiveness of debt 0<br />
Effect of foreign currencies 764<br />
Disposal of shares in associated companies 0<br />
Closing balance 31 December 13 740<br />
102
note 7 customer and other receivables<br />
(aMounTS in noK 1 000)<br />
<strong>2008</strong> 2007<br />
receivables from customers 2 936 49<br />
receivables from internal customers 25 618 7 023<br />
net receivables from customers 28 554 7 072<br />
rECEiVaBlES THaT MaTurE aFTEr MorE THan onE YEar<br />
other receivables 1 143 45 304<br />
loans to companies in the same group 149 782 46 864<br />
Total 150 925 92 168<br />
<strong>TTS</strong> Marine aSa has a convertible loan of noK 1 280 000 related to FastShip inc., see note 5.<br />
There are no credit risk concentrations within the receivables from customers since the company has many customers distributed throughout<br />
a number of countries.<br />
note 8 long-term liabilities<br />
(aMounTS in noK 1 000)<br />
rEPaYMEnT ProFilE anD MaTuriTY<br />
Balance as<br />
of 31.12.08 2009 2010 2011 2012 2013 2014 and later<br />
long-term liabilities 622 632 11 902 507 140 3 590 0 0 100 000<br />
Foreign Interest Instalment Book<br />
Specification of loans Type of loan currency rate Maturity terms value<br />
nordea Drawing facility noK nibor + 1.35 % 0 100 000<br />
nordea Mortgage loan noK nibor +1.35 % 2011 4 per year 17 870<br />
norfund Mortgage loan noK 7.47 % 2009 4 per year 4 762<br />
norsk Tillitsmann aSa Bond issue noK nibor +1.60 %* 2010 0 500 000<br />
622 632<br />
*) Additional 0.3 % in deferred cost.<br />
See note 9 for security for long-term debt.<br />
103
97-108 noteS to the accountS ttS marine aSa<br />
note 9 assets pledged as security and guarantees<br />
(aMounTS in noK 1 000)<br />
The credit agreement for <strong>TTS</strong> Marine aSa in norway was established (50/50) with nordea norge aSa (nordea) and Sparebanken Vest<br />
(SparebankenVest), and nordea is the agent:<br />
<strong>TTS</strong> Marine <strong>ASA</strong> has the following agreements:<br />
<strong>2008</strong> 2007<br />
Limit Drawing Limit Drawing<br />
<strong>Group</strong> account 330 000 6 179 70 000 0<br />
Drawing facility, operations 175 000 175 000 100 000 0<br />
Guarantee limit for <strong>Group</strong> 425 000 423 753 300 000 230 882<br />
Drawing facility, acquisition 0 0 50 000 0<br />
as of 31.12.08, the norwegian companies, in addition to <strong>TTS</strong> Ships Equipment aB and <strong>TTS</strong> Ships Equipment GmbH, all participate in the group<br />
account system. The same applies to the guarantee limit for the group, with the exception of <strong>TTS</strong> Sense which has its own guarantee limit.<br />
The guarantee limits cover payment guaranties, contract guaranties and tax guaranties.<br />
<strong>TTS</strong> Marine aSa furthermore has a drawing facility for operations and bridge financing in connection with acquisitions (in addition to long-term<br />
loans, see note 8).<br />
For the abovementioned agreements, the following assets (from <strong>TTS</strong> Marine aSa, <strong>TTS</strong> Handling Systems aS, <strong>TTS</strong> Ships Equipment aS and norlift aS,<br />
who also have joint liability) have been pledged as collateral toward nordea:<br />
<strong>2008</strong> 2007<br />
Secured debt 117 870 31 816<br />
Assets at book value<br />
Customer/intragroup receivables 178 335 0<br />
non-invoiced production 0 0<br />
inventories/work in progress 0 0<br />
Prepayments to suppliers - -<br />
Property 0 0<br />
Total assets pledged as security 178 335 53 935<br />
The abovementioned includes; inventory, accounts receivable and cash balance. in addition to this is tenancy right with charge on machinery<br />
and plant, as well as the shares in <strong>TTS</strong> Ships Equipment aS. The value of the mortgage bond is TnoK 200 000.<br />
CoVEnanTS<br />
The group has also undertaken to meet the following financial strength requirements for Nordea:<br />
There is a requirement that the equity shall be greater than noK 800 million at any time. in addition the equity ratio shall be greater than<br />
25 per cent as of 31 December. With equity of noK 989 million and an equity ratio of 22.6 per cent, the group does not meet these requirements.<br />
The syndicated loan from nordea is subject to an annual renewal by 31 May 2009. accordingly, this loan formally matures for payment on this<br />
date. reference is made to the maturity structure of the group’s financial obligations in section 3.1, in accounting principles.<br />
nordea has granted a waiver of the covenants’ claim from 25 percent to 22.5 percent.<br />
The group has also undertaken to meet the following financial strength requirements for Norsk Tillitsmann <strong>ASA</strong>:<br />
There is a requirement that the equity shall be greater than noK 550 million at any time. in addition the equity ratio shall be greater than<br />
22.5 per cent as of 31 December. With equity of noK 989 million and an equity ratio of 22,6 per cent, the group meets these requirements.<br />
With regard to the debenture issue there is, in addition to a covenants claim of 22.5 percent equity capital share and nominal equity capital<br />
of noK 500 million, several standard default clauses for this type of debenture issue. under these, the debenture issue is deemed to be defaulted,<br />
should the aforementioned syndicated loan toward nordea be defaulted (cross default).<br />
104
note 10 taxes<br />
(aMounTS in noK 1 000)<br />
Change in deferred tax assets and deferred taxes:<br />
DEFErrED TaxES<br />
1.1.2007 Change 2007 31.12.2007 Change <strong>2008</strong> 31.12.<strong>2008</strong><br />
Fixed assets 2 286 -2 142 144 -48 96<br />
accounts receivable 0 0 0 0 0<br />
Construction contracts 13 332 -13 332 0 0 0<br />
Pensions 59 59 407 466<br />
other temporary differences 0 0 0 0 0<br />
Total deferred taxes 15 618 -15 415 203 359 563<br />
DEFErrED Tax aSSETS<br />
accounts receivable -392 392 0 0 0<br />
inventories -2 133 2 133 0 0 0<br />
Pension funds -1 079 1 079 0 0 0<br />
other provisions for liabilities and charges -573 573 0 0 0<br />
Total deferred tax assets -4 177 4 177 0 0 0<br />
net deferred taxes 11 441 -11 238 203 359 563<br />
Tax credit deduction carryforward -6 182 0 -6 182 0 -6 182<br />
Tax allowance carryforward -1 260 0 -1 260 0 -1 260<br />
Tax loss carryforward -38 339 -6 117 -44 456 -10 127 -54 583<br />
net deferred tax assets -34 340 -17 368 -51 695 -9 768 -61 462<br />
Excess allocation 1 431 2 026 3 457 0 3 457<br />
of which unrecognised deferred tax assets<br />
related to allowance 1 260 0 1 260 0 1 260<br />
net deferred tax assets on the balance sheet -31 649 -15 342 -46 978 -9 768 -56 745<br />
The deferred tax assets related to tax loss carryforwards are recognised on the balance sheet when the management believes that it is<br />
probable that the company can apply this against future taxable income.<br />
Specification of differences between the financial profit before tax and the tax basis for the year: <strong>2008</strong> 2007<br />
Pre-tax profit/loss -12 269 38 884<br />
Permanent differences 106 -8 443<br />
Change in the assessment in relation to previous year’s accounts 0 0<br />
Change in temporary profit/loss differences -1 285 40 139<br />
reversed share of profit/loss in subsidiaries -22 720 -85 202<br />
application of tax loss carryforward 0 0<br />
Tax basis for the year -36 167 -14 622<br />
Breakdown of the tax charge:<br />
Tax payable 0 0<br />
Effect of group contribution on deferred taxes 0 0<br />
Effect of too little allocated deferred tax assets 0 3 643<br />
Change in deferred taxes -9 768 -15 330<br />
Tax charge -9 768 -11 684<br />
Tax payable on the balance sheet:<br />
Tax payable 0 0<br />
Tax effect of group contributions 0 0<br />
Tax payable on balance sheet 0 0<br />
Explanation of why the tax for the year is not 28% of the profit before tax:<br />
28 % of the profit before tax -3 436 10 888<br />
Permanent differences, including amortisation of goodwill 30 -2 361<br />
result fron daughters and joint ventures -6 362 -23 857<br />
Tax of lost of new issue not as a result 0 3 646<br />
Estimated tax charge -9 768 -11 684<br />
105
97-108 noteS to the accountS ttS marine aSa<br />
note 11 liquid asset/interest-bearing liabilities<br />
(aMounTS in noK 1 000)<br />
<strong>2008</strong> 2007<br />
Bank deposits, cash, etc. as of 31 December 128 039 203 427<br />
Deposits(+)/withdrawals(–) in the cash pool account system as of 31 December -6 179 191 378<br />
<strong>TTS</strong> Marine aSa administers a cash pool account system. The group has been granted a credit limit for the group of noK 330 000 000.<br />
in addition <strong>TTS</strong> Marine aSa has a drawing facility of TnoK 100 000.<br />
note 12 Share capital and shareholder information<br />
Number of shares Nominal Book value of<br />
as of 31 December value share capital<br />
25 908 280 0.50 12 954 140<br />
THE FolloWinG CoMPaniES arE inCluDED in THE <strong>TTS</strong> MarinE GrouP:<br />
(aMounTS in noK)<br />
Ownership Share Number<br />
Company Owner interest capital of shares<br />
norlift aS (former <strong>TTS</strong> Eiendom aS) <strong>TTS</strong> Marine aSa 100 % noK 500 000 500<br />
<strong>TTS</strong> Handling Systems aS <strong>TTS</strong> Marine aSa 100 % noK 950 000 95 000<br />
<strong>TTS</strong> Ships Equipment aS <strong>TTS</strong> Marine aSa 100 % noK 2 500 000 2 500<br />
Hydralift Marine aS <strong>TTS</strong> Marine aSa 100 % noK 100 000 1 000<br />
<strong>TTS</strong> Ships Equipment aB <strong>TTS</strong> Marine aSa 100 % SEK 2 000 000 2 000<br />
<strong>TTS</strong> Marine Shanghai Co ltd <strong>TTS</strong> Marine aSa 100 % uSD 200 000 3 500<br />
<strong>TTS</strong> Ships Equipment GmbH <strong>TTS</strong> Ships Equipment aB 100 % Eur 255 646 5 000<br />
<strong>TTS</strong> Marine inc. <strong>TTS</strong> Ships Equipment aB 100 % uSD 190 000 1 900<br />
<strong>TTS</strong>-lMG Marine Cranes GmbH <strong>TTS</strong> Ships Equipment GmbH 100 % Eur 25 000 1<br />
<strong>TTS</strong> liftec oy <strong>TTS</strong> Ships Equipment aB 100 % Eur 76 500 1 020<br />
<strong>TTS</strong> Port Equipment aB <strong>TTS</strong> Ships Equipment aB 100 % SEK 100 000 1 000<br />
<strong>TTS</strong> Kocks GmbH <strong>TTS</strong> Ships Equipment GmbH 100 % Eur 1 000 000 1 000<br />
<strong>TTS</strong> Kocks ostrava s.r.o. <strong>TTS</strong> Ships Equipment GmbH 100 % Eur 310 291 1 000<br />
<strong>TTS</strong> Marine S.r.l <strong>TTS</strong> Ships Equipment aB 100 % Eur 10 400 1 000<br />
<strong>TTS</strong> Marine Cranes aS <strong>TTS</strong> Marine aSa 100 % noK 1 000 000 1 000<br />
<strong>TTS</strong> Cranes norway <strong>TTS</strong> Marine aSa 100 % noK 500 000 1 000<br />
<strong>TTS</strong> offshore Handling Equipment <strong>TTS</strong> Marine aSa 100 % noK 100 000 100 000<br />
<strong>TTS</strong> Sense aS <strong>TTS</strong> Marine aSa 100 % noK 1 200 288 400 076<br />
<strong>TTS</strong> Kocks Korea <strong>TTS</strong> Ships Equipment GmbH 100 % KrW 1 513 390 000 1 000<br />
<strong>TTS</strong> Hua Hai aB <strong>TTS</strong> Ships Equipment aB 100 % SEK 100 000 1 000<br />
<strong>TTS</strong> Sense (Canada) ltd <strong>TTS</strong> Sense aS 100 % CaD 100 10<br />
<strong>TTS</strong> Sense MuD aS <strong>TTS</strong> Sense aS 100 % noK 1 000 000 1 000<br />
<strong>TTS</strong> Sense Pte ltd Singapore <strong>TTS</strong> Sense aS 100 % SGD 100 000 100 000<br />
<strong>TTS</strong> Sense Drillfab <strong>TTS</strong> Sense aS 50 % noK 1 000 000 100 000<br />
<strong>TTS</strong> EDM inc <strong>TTS</strong> Sense aS 100 % uSD 100 000 1 000<br />
<strong>TTS</strong> Wellquip aS <strong>TTS</strong> Sense aS 100 % noK 1 100 000 110 000<br />
106
THE larGEST SHarEHolDErS in <strong>TTS</strong> MarinE aSa aS oF 31 DECEMBEr <strong>2008</strong> WErE:<br />
(FiGurES in noK)<br />
Number Ownership Voting<br />
Shareholder of shares interest share<br />
Skeie Technology aS 3 406 917 13.15 % 13.15 %<br />
rasmussengruppen aS 2 995 000 11.56 % 11.56 %<br />
lesk aS 2 024 361 7.81 % 7.81 %<br />
Stisk aS 2 024 361 7.81 % 7.81 %<br />
Citibank n.a. london 1 608 600 6.21 % 6.21 %<br />
nordea Bank PlC Finland 1 045 000 4.03 % 4.03 %<br />
Morgan Stanley & co 999 000 3.86 % 3.86 %<br />
Tamafe Holding aS 824 361 3.18 % 3.18 %<br />
Verdipapir odin 810 000 3.13 % 3.13 %<br />
rBC Dexia investor Services Bank 650 000 2.51 % 2.51 %<br />
itlution aS 516 165 1.99 % 1.99 %<br />
Skagen Vekst 476 000 1.84 % 1.84 %<br />
DnB nor Smb 435 000 1.68 % 1.68 %<br />
rBC Dexia investor Services Trust 390 000 1.51 % 1.51 %<br />
Svenska Handelsbanken depot 376 400 1.45 % 1.45 %<br />
odin Europa Smb 363 900 1.40 % 1.40 %<br />
Skeie Consultants aS 363 600 1.40 % 1.40 %<br />
Pensjonskassen Statoil 291 539 1.13 % 1.13 %<br />
Stichting Shell Pens. 284 003 1.10 % 1.10 %<br />
Holberg norge 278 400 1.07 % 1.07 %<br />
Total 20 largest shareholders 20 162 607 77.82 % 77.82 %<br />
Total others 5 745 673 22.18 % 22.18 %<br />
Total 25 908 280 100.00 % 100.00 %<br />
SHarES oWnDED BY BoarD MEMBErS anD CorPoraTE ManaGEMEnT GrouP anD THEir rElaTED:<br />
Board Per 31.12.08 Per 27.04.09<br />
Bjarne Skeie2) 3 770 517 3 770 517<br />
nils o. aardal 75 000 75 000<br />
olav Smeland 1 250 1 250<br />
Corporate Management <strong>Group</strong><br />
Johannes D. neteland 105 000 105 000<br />
- daugther anna S. neteland 100 100<br />
olav Bruåsdal 34 000 34 000<br />
Hans-Jan Erstad 20 000 20 000<br />
ivar K. Hanson 20 000 20 000<br />
Stellan Bernsro 20 000 20 000<br />
Edgar Bethmann 20 000 20 000<br />
Tom Fedog1) 281 420 281 420<br />
lennart Svensson 200 200<br />
Margrethe Hauge 100 100<br />
1) Owns Wary (100 %) who ownsr 50 % of Itlution AS and Itlution II AS who own a total of 562 840 shares in <strong>TTS</strong> Marine <strong>ASA</strong>.<br />
2) Owns 20 % of the shares and 100 % of the voting shares in Skeie Technology AS and Skeie Consultants AS.<br />
on 22 May <strong>2008</strong> the annual General Meeting resolved to grant the Board authority to issue a maximum of 4 000 000 shares in the event<br />
of an acquisition or merger. This authorisation is valid until the annual General Meeting for 2007, and no later than 30 June <strong>2008</strong>.<br />
none of these shares were issued in <strong>2008</strong>.<br />
as of 31 December <strong>2008</strong>, 380 000 options were allotted that can be exercised until 24 May 2009 at a price of noK 79 (from an authorisation<br />
for a total of 380 000 options granted at the ordindary General Meeting of 24 May 2007). in addition to 420 000 options that can be exercised<br />
until 22 May 2010 at a price of noK 81. (From an authoristion for a total of 420,000 options granted at the annual General Meeting of<br />
22 May <strong>2008</strong>).<br />
107
97-108 noteS to the accountS ttS marine aSa<br />
THE DiSTriBuTion oF oPTionS iS aS FolloWS:<br />
No. of options No. of options<br />
that can be that can be<br />
exercised exercised<br />
Name Position Company until 30.05.08 Price until 24.05.09 Price Total<br />
Johannes D. neteland President & CEo <strong>TTS</strong> Marine aSa 100 000 79.00 100 000 81.00 200 000<br />
olav Bruåsdal Financial director <strong>TTS</strong> Marine aSa 40 000 79.00 40 000 81.00 80 000<br />
Hans-Jan Erstad Chief of staff <strong>TTS</strong> Marine aSa 40 000 79.00 40 000 81.00 80 000<br />
Göran K. Johansson Division Director <strong>TTS</strong> Port Equipment aB 40 000 79.00 40 000 81.00 80 000<br />
ivar K. Hanson Division Director <strong>TTS</strong> Marine aSa 40 000 79.00 40 000 81.00 80 000<br />
Stellan Bernsro Division Director <strong>TTS</strong> Ships Equipment aB 40 000 79.00 40 000 81.00 80 000<br />
Edgar Bethmann Division Director <strong>TTS</strong> Kocks Gmbh 40 000 79.00 40 000 81.00 80 000<br />
Tom Fedog Division Director <strong>TTS</strong> Sense aS 40 000 79,00 40 000 81.00 80 000<br />
Margrethe Hauge Division Director <strong>TTS</strong> Marine aSa 0 - 40 000 81.00 40 000<br />
Total number of options to leading employees 380 000 420 000 800 000<br />
Share options exercised in 2007 resulted in the issue of a total of 170 000 shares at noK 35 per share, with a weighted average market price on<br />
the date of issue of noK 79.00 per share. a resolution was adopted at the annual General Meeting of 22 May <strong>2008</strong> to authorise the Board to purchase<br />
a maximum of 400 000 of the company’s own shares. This auhorisation is valid to annual General Meeting for <strong>2008</strong>, latest 30 June 2009.<br />
in the period <strong>TTS</strong> has owned a maximum of 133 000 shares. as of 31 December <strong>2008</strong> the company held 133 100 of its own shares.<br />
note 13 other short-term liabilities<br />
(aMounTS in noK 1 000)<br />
<strong>2008</strong> 2007<br />
other provisions 8 340 5 771<br />
Short term debt related to <strong>TTS</strong> Sense aS 9 786 84 404<br />
Total short-term liabilities 18 127 90 175<br />
note 14 other operating expenses<br />
(aMounTS in noK 1 000)<br />
<strong>2008</strong> 2007<br />
rent, costs for premises 735 12<br />
EDP costs 2 055 816<br />
Marketing, travel 6 221 2 871<br />
other 13 830 2 964<br />
Total other operating expenses 22 841 6 663<br />
note 15 related parties<br />
all the underlying subsidiares (note 6), joint ventures (note 6), members of the Board and corporate management group,<br />
are regarded as related parties. The group has carried out various transactions with underlying companies and joint ventures.<br />
all the transactions have been carriedout as part of the ordinary operations and at arm’s length prices.<br />
note 16 financial items and foreign currency gains/losses<br />
(aMounTS in noK 1 000)<br />
<strong>2008</strong> 2007<br />
income from investments in subsidiaries 21 580 80 543<br />
income from investments in associated companies 1 140 4 659<br />
internat interest income 5 785 3 574<br />
other interest income 19 551 5 766<br />
Dividends 5 7<br />
Bank loans -46 773 -27 514<br />
other financial expenses -3 547 -2 429<br />
net foreign currency gains/losses 2 859 -1 569<br />
Total 600 63 036<br />
ForEiGn CurrEnCY GainS/loSSES<br />
The foreign currency differences that are recognised<br />
in the profit and loss account are as follow: <strong>2008</strong> 2007<br />
Foreign currency gains 35 270 1 652<br />
Foreign currency losses -32 411 -3 220<br />
Total 2 859 -1 569<br />
Foreign currency gains are included in other financial income in the profit and loss account,<br />
and foreign currency losses are included in other financial expenses.<br />
108
auditor’s report<br />
<strong>2008</strong><br />
To the <strong>Annual</strong> Shareholders' Meeting of <strong>TTS</strong> Marine <strong>ASA</strong><br />
PricewaterhouseCoopers AS<br />
Postboks 3984 - Dreggen<br />
NO-5835 Bergen<br />
Telephone +47 02316<br />
Telefax +47 23 16 10 00<br />
Auditor’s report for <strong>2008</strong><br />
We have audited the annual financial statements of <strong>TTS</strong> Marine <strong>ASA</strong> as of December 31, <strong>2008</strong>, showing a loss of<br />
NOK 2,501,659 for the parent company and a profit of NOK 36,391,864 for the group. We have also audited the<br />
information in the directors' report concerning the financial statements, the going concern assumption, and the<br />
proposal for the coverage of the loss. The annual financial statements comprise the financial statements of the<br />
parent company and the group. The financial statements of the parent company comprise the balance sheet, the<br />
statements of income and cash flows, the statement of changes in equity and the accompanying notes. The<br />
financial statements of the group comprise the balance sheet, the statements of income and cash flows, the<br />
statement of changes in equity and the accompanying notes. The regulations of the Norwegian accounting act<br />
and accounting standards, principles and practices generally accepted in Norway have been applied in the<br />
preparation of the financial statements of the parent company. International Financial <strong>Report</strong>ing Standards as<br />
adopted by the EU have been applied in the preparation of the financial statements of the group. These financial<br />
statements are the responsibility of the Company’s Board of Directors and Managing Director. Our responsibility<br />
is to express an opinion on these financial statements and on other information according to the requirements of<br />
the Norwegian Act on Auditing and Auditors.<br />
We conducted our audit in accordance with laws, regulations and auditing standards and practices generally<br />
accepted in Norway, including standards on auditing adopted by The Norwegian Institute of Public Accountants.<br />
These auditing standards require that we plan and perform the audit to obtain reasonable assurance about<br />
whether the financial statements are free of material misstatement. An audit includes examining, on a test basis,<br />
evidence supporting the amounts and disclosures in the financial statements. An audit also includes assessing<br />
the accounting principles used and significant estimates made by management, as well as evaluating the overall<br />
financial statement presentation. To the extent required by law and auditing standards an audit also comprises a<br />
review of the management of the Company's financial affairs and its accounting and internal control systems. We<br />
believe that our audit provides a reasonable basis for our opinion.<br />
In our opinion,<br />
• the financial statements of the parent company have been prepared in accordance with the law and<br />
regulations and give a true and fair view of the financial position of the company as of December 31,<strong>2008</strong><br />
and the results of its operations and its cash flows and the changes in equity for the year then ended, in<br />
accordance with accounting standards, principles and practices generally accepted in Norway<br />
• the financial statements of the group have been prepared in accordance with the law and regulations and<br />
give a true and fair view of the financial position of the group as of December 31, <strong>2008</strong>, and the results of its<br />
operations and its cash flows and the changes in equity for the year then ended, in accordance with<br />
International Financial <strong>Report</strong>ing Standards as adopted by the EU<br />
• the company's management has fulfilled its duty to produce a proper and clearly set out registration and<br />
documentation of accounting information in accordance with the law and good bookkeeping practice in<br />
Norway<br />
• the information in the directors' report concerning the financial statements, the going concern assumption,<br />
and the proposal for the coverage of the loss are consistent with the financial statements and comply with the<br />
law and regulations.<br />
"Without qualifying our opinion above, we emphasise that there is significant uncertainty related to the estimates<br />
which form the basis of the company’s impairment tests in the Drilling Equipment segment. We refer to further<br />
remarks in the directors’ report and in note 7 to the financial statements of the group."<br />
Bergen, April 27, 2009<br />
PricewaterhouseCoopers AS<br />
Geir Inge Lunde<br />
State Authorised Public Accountant (Norway)<br />
Note: This translation from Norwegian has been prepared for information purposes only.<br />
Alta Arendal Bergen Bodø Drammen Egersund Florø Fredrikstad Førde Gardermoen Gol Hamar Hammerfest Hardanger Harstad Haugesund Kongsberg Kongsvinger<br />
Kristiansand Lyngseidet Mandal Mo i Rana Molde Mosjøen Måløy Namsos Oslo Sandefjord Sogndal Stavanger Stryn Tromsø Trondheim Tønsberg Ulsteinvik Ålesund<br />
PricewaterhouseCoopers navnet refererer til individuelle medlemsfirmaer tilknyttet den verdensomspennende PricewaterhouseCoopers organisasjonen<br />
Medlemmer av Den norske Revisorforening • Foretaksregisteret: NO 987 009 713 • www.pwc.no<br />
109
4-8 T T S G r o u P<br />
9-11 rEPorT FroM THE CEo<br />
12-37 B u S i n E S S a r E a S<br />
38-47 CorPoraTE GoVErnanCE<br />
48-110 director’S report and accountS<br />
110<br />
confirmation from the board of directors and chief executive officer<br />
We confirm, to the best of our knowledge, that the consolidated annual accounts for<br />
the period 1 January to 31 December <strong>2008</strong> have been prepared in accordance with current accounting<br />
standards/IFrs and that the information herein gives a true and fair view of the company’s and<br />
group’s assets, liabilities, financial position and profit as a whole, and that the annual report gives<br />
a fair view of the development, result and position of the company and of the group, together<br />
with a description of the principal risks and uncertainties facing the enterprise.<br />
Bergen, 27 april 2009<br />
the Board of tts Marine asa<br />
Birger skeie anne Breive<br />
cHaIrMan DIrectOr<br />
nils Olav aardal Bjarne skeie<br />
DIrectOr DIrectOr<br />
Olav smeland anne-Karin Bedringås<br />
DIrectOr DIrectOr<br />
Kjerstin Fyllingen Johannes D. neteland<br />
DIrectOr PresIDent & ceO
111
4-8 T T S G r o u P<br />
9-11 rEPorT FroM THE CEo<br />
12-37 B u S i n E S S a r E a S<br />
38-47 CorPoraTE GoVErnanCE<br />
48-110 DirECTor’S rEPorT anD aCCounTS<br />
112 -115 orGaniSation<br />
companies in the ttS <strong>Group</strong><br />
canada<br />
ttS Sense (canada) ltd<br />
6708 – 75th Street<br />
Edmonton, alberta T6E 6T9<br />
Tel: +1 780 430 1833<br />
Fax: +1 780 430 1834<br />
michael.symchuk@tts-sense.com<br />
china<br />
ttS hua hai Ships<br />
equipment co ltd<br />
18th floor, 3255 Zhou Jia Zui road<br />
Cn-200093 Shanghai<br />
Tel: +86 21 6539 8257<br />
Fax: +86 21 6539 7400<br />
info@tts-huahai.com<br />
ttS-Keyon marine<br />
equipment co ltd<br />
lan Gan qiao, Fenghuang Town<br />
Cn-216514 Zhang Jia Gang City<br />
Tel: +86 5125 8425 988<br />
Fax: +86 5125 8425 908<br />
info@tts-keyon.com<br />
ttS marine<br />
Shanghai co ltd<br />
no. 433 Gao Dong no.2 road<br />
GaoDong industrial Park, PuDong<br />
Cn-Shanghai 200137<br />
Tel: +86 21 5848 5300<br />
Fax: +86 21 5848 5311<br />
sales@tts-marine.cn<br />
ttS bohai machinery co ltd<br />
Sujia, Dalian Wan Street<br />
Cn-Dalian<br />
Tel: +86 411 8711 2670<br />
Fax: +86 411 8711 2702<br />
info@tts-bohai.com<br />
112<br />
ttS marine equipment<br />
(dalian) co ltd<br />
Tuchengzi Cun, Dalianwan Street<br />
Ganjingzi District<br />
Cn-Dalian 116034<br />
Tel: +86 411 8711 9663<br />
Fax: +86 411 8711 9678<br />
goran.bertilson@tts-me.cn<br />
czech republic<br />
ttS Kocks ostrava s.r.o.<br />
u Řeky 808<br />
CZ-720 00 ostrava-Hrabová<br />
Tel: +420 596 782 708<br />
Fax: +420 596 782 707<br />
info@tts-kocks.cz<br />
finland<br />
ttS liftec oy<br />
Tuotekatu 8<br />
Fi-33840 Tampere<br />
Tel: +358 3 31401400<br />
Fax: +358 3 31401444<br />
liftec@tts-liftec.fi<br />
Germany<br />
ttS Kocks Gmbh<br />
Wachtstrasse 17–24,<br />
DE-28195 Bremen<br />
P.o. Box 104080,<br />
DE-28040 Bremen<br />
Tel: +49 421 5<strong>2008</strong>-0<br />
Fax: +49 421 5<strong>2008</strong>-20<br />
info@tts-kocks.de<br />
ttS Ships<br />
equipment Gmbh<br />
Wachtstrasse 17–24,<br />
DE-28195 Bremen<br />
P.o. Box 100811,<br />
DE-28008 Bremen<br />
Tel: +49 421 3 35 84 0<br />
Fax: +49 421 3 35 84 98<br />
info@tts-se.de<br />
ttS-lmG<br />
marine cranes Gmbh<br />
Einsiedelstrasse 6<br />
DE-23554 lübeck<br />
Tel: +49 451 4501 730<br />
Fax: +49 451 4501 392<br />
info@tts-lmg.de<br />
italy<br />
ttS marine s.r.l<br />
Ponte Colombo<br />
iT-16126 Genova<br />
Tel: +39 010 24 81 205<br />
Fax: +39 010 25 43 191<br />
info@tts-marine.it<br />
Korea<br />
ttS Kocks Korea co.,ltd<br />
#1664–10, Songjeong-Dong<br />
Gangseo-Gu<br />
Busan 618-819 Korea<br />
Tel: +82 51 831 8401<br />
Fax: +82 51 979 5610<br />
mail@tts-kocks.co.kr<br />
ttS Korea<br />
rM 625, ocean Tower<br />
# 760-3 Woo 1-Dong,<br />
Haeundae-Gu<br />
Busan 612-726 Korea<br />
Tel: +82 51 740 6081-3<br />
Fax: +82 51 740 6084<br />
info@ttskorea.co.kr
norWay<br />
ttS marine aSa<br />
Folke Bernadottesvei 38<br />
P.o. Box 3577<br />
no-5845 Bergen<br />
Tel: +47 55 94 74 00<br />
Fax: +47 55 94 74 01<br />
info@tts-marine.no<br />
ttS Sense aS<br />
andøyfaret 3<br />
no-4623 Kristiansand<br />
Tel: +47 38 00 05 70<br />
Fax: +47 38 00 05 71<br />
mail@tts-sense.com<br />
ttS Sense aS<br />
Jåttåflaten 10<br />
no-4020 Stavanger<br />
Tel: +47 51 81 16 00<br />
Fax: +47 51 81 16 01<br />
mail@tts-sense.com<br />
ttS Sense drill fab aS<br />
Spjotneset<br />
no-4645 nodeland<br />
Tel: +47 480 30 500<br />
Fax: +47 3818 9001<br />
jan.ove.aase@tts-sensedrillfab.com<br />
ttS Sense mud aS<br />
andøyfaret 7<br />
no-4623 Kristiansand<br />
Tel: +47 3800 0570<br />
Fax: +47 3800 0571<br />
mud@sense-mud.no<br />
ttS marine cranes aS<br />
Folke Bernadottesvei 38<br />
P.o. Box 3566<br />
no-5845 Bergen<br />
Tel: +47 55 34 84 00<br />
Fax: +47 55 34 84 01<br />
info@tts-mc.no<br />
ttS marine cranes aS<br />
regional office<br />
Barstølveien 26<br />
Servicebox 602<br />
no-4606 Kristiansand<br />
Tel: +47 38 04 95 00<br />
Fax: +47 38 04 95 01<br />
info@tts-mc.no<br />
ttS offshore handling<br />
equipment aS<br />
Corporate office:<br />
Hundsværgata 8<br />
no-6008 Ålesund<br />
Tel: +47 70 11 51 51<br />
Fax: +47 70 13 00 73<br />
info@tts-ohe.no<br />
ttS handling Systems aS<br />
Holterkollvn 6<br />
P.o. Box 49<br />
no-1441 Drøbak<br />
Tel: +47 64 90 79 10<br />
Fax: +47 64 93 16 63<br />
info@tts-hs.no<br />
ttS Ships equipment aS<br />
Folke Bernadottesvei 38<br />
P.o. Box 3517<br />
no-5845 Bergen<br />
Tel: +47 55 11 30 50<br />
Fax: +47 55 11 30 60<br />
info@tts-se.no<br />
SinGapore<br />
ttS Sense<br />
Singapore pte ltd<br />
international Business Park<br />
unit #03-23 nordic<br />
European Center<br />
Singapore 609927<br />
Tel: +65 68906521/23<br />
Fax: +65 68906522<br />
mailsg@tts-sense.com<br />
SWeden<br />
ttS port equipment ab<br />
Kämpegatan 3<br />
SE-411 04 Göteborg<br />
Tel: +46 31 725 79 00<br />
Fax: +46 31 725 78 04<br />
info@tts-port.se<br />
ttS Ships equipment ab<br />
Kämpegatan 3<br />
SE-411 04 Göteborg<br />
Tel: +46 31 725 79 00<br />
Fax: +46 31 725 78 00<br />
info@tts-se.se<br />
uSa<br />
ttS Sense uS<br />
1400 Broadfield<br />
Suite 200<br />
Houston, Tx 77084<br />
Tel: +1 281 405 2691<br />
Fax: +1 281 405 2692<br />
rolf.gullaksen@tts-sense.com<br />
ttS marine inc.<br />
6555 Powerline road, Suite 410<br />
Fort lauderdale, Fl 33309<br />
Tel: +1 954 493 6405<br />
Fax: +1 954 493 6409<br />
info@tts-se.us<br />
vietnam<br />
ttS vietnam<br />
4th Floor, Harbour View Building<br />
no 4, Tran Phu Street<br />
Haiphong City<br />
Tel: +84 31 3686518<br />
Fax. +84 31 3686516<br />
info@tts-se.vn<br />
113
4-8 T T S G r o u P<br />
9-11 rEPorT FroM THE CEo<br />
12-37 B u S i n E S S a r E a S<br />
38-47 CorPoraTE GoVErnanCE<br />
48-110 DirECTor’S rEPorT anD aCCounTS<br />
112 -115 orGaniSation<br />
organisation<br />
tom fedoG<br />
arne lindeKleiv<br />
michael SymchuK<br />
berGtor hauGaa<br />
jan ove aaSen<br />
114<br />
drilling<br />
equipment<br />
dry cargo<br />
handling<br />
Stellan bernSro<br />
holGer elieS<br />
jan maGnar Grøtte<br />
madame he pu<br />
maSSimo triGlia<br />
barnard zhonG<br />
port & material<br />
handling<br />
lennart SvenSSon<br />
rolf-atle tomaSSen<br />
tatu miiKKulainen<br />
ivar K. hanSon<br />
arne KnudSen<br />
Sven-eriK herneS<br />
li dali<br />
marine<br />
cranes<br />
StiG eSpeSeth<br />
deck<br />
machinery<br />
edGar bethmann<br />
marcuS berGmann<br />
Göran bertilSon<br />
Services<br />
marGrethe hauGe<br />
torSten paaS<br />
dan maGnuSSon<br />
KyunG-hWan Kim
<strong>TTS</strong> Marine <strong>ASA</strong><br />
Johannes D. Neteland<br />
PRESIDENT & CEO<br />
Services<br />
Margrethe Hauge<br />
Deck Machinery<br />
Edgar Bethmann<br />
Marine Cranes<br />
Ivar K. Hanson<br />
Port and Material Handling<br />
Lennart Svensson<br />
Dry Cargo Handling<br />
Stellan Bernsro<br />
Drilling Equipment<br />
Tom Fedog<br />
EXECUTIVE VICE PRESIDENT<br />
EXECUTIVE VICE PRESIDENT<br />
EXECUTIVE VICE PRESIDENT<br />
EXECUTIVE VICE PRESIDENT<br />
EXECUTIVE VICE PRESIDENT<br />
EXECUTIVE VICE PRESIDENT<br />
<strong>TTS</strong> Marine Inc.<br />
Torsten Paas<br />
<strong>TTS</strong> Kocks GmbH<br />
Edgar Bethmann<br />
<strong>TTS</strong> Marine Cranes AS<br />
Ivar K. Hanson<br />
<strong>TTS</strong> Port Equipment AB<br />
Lennart Svensson<br />
<strong>TTS</strong> Ships Equipment AB<br />
Stellan Bernsro<br />
<strong>TTS</strong> Sense AS<br />
Tom Fedog<br />
PRESIDENT<br />
PRESIDENT<br />
PRESIDENT<br />
PRESIDENT<br />
PRESIDENT<br />
PRESIDENT<br />
<strong>TTS</strong> Vietnam<br />
Dan Magnusson<br />
<strong>TTS</strong> Kocks Ostrava s.r.o.<br />
Edgar Bethmann<br />
<strong>TTS</strong> Marine Shanghai Co. Ltd.<br />
Arne Knudsen<br />
<strong>TTS</strong> Handling System AS<br />
Rolf-Atle Tomassen<br />
<strong>TTS</strong> Ships Equipment GmbH<br />
Holger Elies<br />
<strong>TTS</strong> Sense Mud AS<br />
Arne Lindekleiv<br />
GENERAL MANAGER<br />
PRESIDENT<br />
PRESIDENT<br />
PRESIDENT<br />
PRESIDENT<br />
PRESIDENT<br />
<strong>TTS</strong> Korea<br />
Kyung-Hwan Kim<br />
<strong>TTS</strong> Kocks Korea Co. Ltd.<br />
Marcus Bergmann<br />
<strong>TTS</strong>-LMG Marine Cranes GmbH<br />
Sven-Erik Hernes<br />
<strong>TTS</strong> Liftec Oy<br />
Tatu Miikkulainen<br />
<strong>TTS</strong> Ships Equipment AS<br />
Jan Magnar Grøtte<br />
<strong>TTS</strong> Sense (Canada) Ltd<br />
Michael Symchuk<br />
PRESIDENT<br />
PRESIDENT<br />
PRESIDENT<br />
PRESIDENT<br />
PRESIDENT<br />
PRESIDENT<br />
<strong>TTS</strong> Marine Equipment (Dalian)<br />
Göran Bertilson<br />
<strong>TTS</strong> Bohai Machinery Co. Ltd.<br />
Li Dali<br />
<strong>TTS</strong> Hua Hai<br />
Ships Equipment Co. Ltd.<br />
Madame He Pu<br />
<strong>TTS</strong> Sense Singapore Pte Ltd<br />
Bergtor Haugaa<br />
PRESIDENT<br />
GENERAL MANAGER<br />
GENERAL MANAGER<br />
GENERAL MANAGER<br />
<strong>TTS</strong> Offshore Handling<br />
Equipment AS<br />
Stig Espeseth<br />
<strong>TTS</strong> Marine s.r.l.<br />
Massimo Triglia<br />
<strong>TTS</strong> Sense Drill Fab AS<br />
Jan Ove Aasen<br />
PRESIDENT<br />
GENERAL MANAGER<br />
PRESIDENT<br />
<strong>TTS</strong> Keyon Marine<br />
Equipment Co. Ltd<br />
Barnard Zhong<br />
S<br />
GENERAL MANAGER<br />
115
ttS marine aSa<br />
Folke Bernadottesvei 38<br />
Po Box 3577 Fyllingsdalen<br />
n-5845 Bergen, norway<br />
Tel: +47 55 94 74 00<br />
Fax: +47 55 94 74 01<br />
E-mail: info.bgo@tts-marine.no<br />
www.tts-marine.com<br />
• 25980 • Trykk: Molvik Grafisk AS


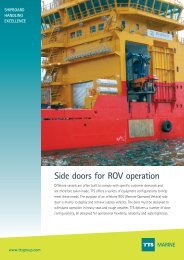
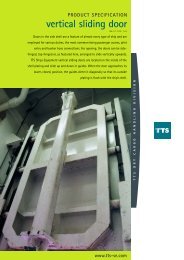

![2012.MasterPresentation_final [Compatibility Mode] - TTS Group ASA](https://img.yumpu.com/4612021/1/190x146/2012masterpresentation-final-compatibility-mode-tts-group-asa.jpg?quality=85)