- Page 1:
Thankyou fordownloadingthisbook.We
- Page 8 and 9:
6Ways Through This BookAcknowledgin
- Page 12 and 13:
10015019023Foreword by Geoff Mulgan
- Page 14 and 15:
12Creative Commons LicenceThis work
- Page 16 and 17:
14 Chapter
- Page 18 and 19:
16 Chapter*—A note from the autho
- Page 20 and 21:
18 Chapter
- Page 22 and 23:
20 ChapterBoth hard and soft eviden
- Page 24 and 25:
22 Chapter1—For more information
- Page 26 and 27:
24 Chapter1—The first mechanical
- Page 28 and 29:
26 Chapter*—See also:Handle With
- Page 30 and 31:
28 Chapter1—Sparke, Penny. ‘Con
- Page 32 and 33:
30 ChapterSketching the Escalating
- Page 34 and 35:
32 Chapter1—Trans-, multi-, inter
- Page 36 and 37:
34 Chapterstrong recommendations. I
- Page 38 and 39:
36 Chapter*—See also:Bibliography
- Page 40 and 41:
38 ChapterThe inherent pliability o
- Page 42 and 43:
40 ChapterIn the context of strateg
- Page 44 and 45:
42 Chapter
- Page 46 and 47:
44 Chapter
- Page 48 and 49:
46 Chapter1—The answer had nothin
- Page 50 and 51:
48 ChapterTo see challenges in a ne
- Page 52 and 53:
50 ChapterFor another peek into the
- Page 54 and 55:
52 Chapter
- Page 56 and 57:
54 Education StudioA successful edu
- Page 58 and 59:
56 Education StudioAlthough current
- Page 60 and 61:
58Education StudioMaja KecmanSenior
- Page 62 and 63:
60 Education StudioMonday, May 3Tue
- Page 64 and 65:
62 Education StudioOutcomesSummaryT
- Page 66 and 67:
64 Sustainability Studio
- Page 68 and 69:
66Sustainability StudioThe stage is
- Page 70 and 71:
68Sustainability StudioFederico Par
- Page 72 and 73:
70Sustainability StudioMonday, May
- Page 74 and 75:
72Sustainability StudioOutcomesSumm
- Page 76 and 77:
74 Ageing Studio
- Page 78 and 79:
76Ageing StudioIn advance of the st
- Page 80 and 81:
78Ageing StudioDr. Marianne Guldbra
- Page 82 and 83:
80Ageing StudioMonday, June 7Tuesda
- Page 84 and 85:
82Ageing StudioOutcomesSummaryThe p
- Page 86 and 87:
84 Chapter
- Page 88 and 89:
86 ChapterA typical day in studio
- Page 90 and 91:
88 ChapterPresentation mode for the
- Page 92 and 93:
90 Chapter
- Page 94 and 95:
92 Chapter
- Page 96 and 97:
94 The HDL Studio ModelCriterion #1
- Page 98 and 99:
96 Chapter
- Page 100 and 101:
98The HDL Studio Model*Examples fro
- Page 102 and 103:
100 Chapter
- Page 104 and 105:
102The HDL Studio Modelconversation
- Page 106 and 107:
104The HDL Studio ModelRules of Thu
- Page 108 and 109:
106 Chapter
- Page 110 and 111:
108The HDL Studio ModelSunday:Settl
- Page 112 and 113:
110The HDL Studio ModelThursday:Pul
- Page 114 and 115:
112 Chapter
- Page 116 and 117:
114The HDL Studio ModelFrameworkfor
- Page 118 and 119:
116 Chapter
- Page 120 and 121:
118The HDL Studio Modelcontribution
- Page 122 and 123:
120 Chapter
- Page 124 and 125:
122The HDL Studio Modelstepped insi
- Page 126 and 127:
124The HDL Studio Modelably want to
- Page 128 and 129:
126 Chapter
- Page 130 and 131:
128The HDL Studio ModelSample outpu
- Page 132 and 133:
130 Chapter
- Page 134 and 135:
132The HDL Studio ModelBe Casual bu
- Page 136 and 137:
134The HDL Studio ModelPROCESS PLAC
- Page 138 and 139:
136 Chapter
- Page 140 and 141:
138 Chapteras a result, suggesting
- Page 142 and 143:
140
- Page 144 and 145:
142
- Page 146 and 147:
Opportunity SpaceFinland must trans
- Page 148 and 149:
BackgroundDropping out conjures suc
- Page 150 and 151:
Finnish Core ValuesIn Finland, equa
- Page 152 and 153:
Another distinguishing feature in F
- Page 154 and 155:
“lead users” re-frames the ques
- Page 156 and 157:
D1.2 Student Pathways01Day Care2(Pr
- Page 158 and 159:
Polytechnics, also known as institu
- Page 160 and 161:
the local comprehensive schools. Th
- Page 162 and 163:
D2 - The Youth PopulationThe teenag
- Page 164 and 165:
D2.2 FamiliesThe family is still th
- Page 166 and 167:
100 %90 %80 %70 %60 %50 %Finland200
- Page 168 and 169:
Government assistance to Finnish st
- Page 170 and 171:
ConscriptionAll men are required to
- Page 172 and 173:
Each year, about 12,500 young peopl
- Page 174 and 175:
More education is correlated with h
- Page 176 and 177:
All Male FemaleCompleters of 9th gr
- Page 178 and 179:
D4 - Differentiated Learning:The Br
- Page 180 and 181:
More recent theories of cognitive d
- Page 182 and 183:
D5 - Culture of YouthTeenage cultur
- Page 184 and 185:
➢ 74% of 15-24 year use the site
- Page 186 and 187:
D5.5 Media, Sports & CelebrityMedia
- Page 188 and 189:
futures of finlandThere's no way to
- Page 190 and 191: Finland 2020 - Slow recovery from 2
- Page 192 and 193: Finland 2050 - At a glancePopulatio
- Page 194 and 195: Environmental taxes and personal qu
- Page 196 and 197: slowly leads to the practice whereb
- Page 198 and 199: BibliographyAho, Erkki and Kari Pit
- Page 200 and 201: Luopa, Pauliina and Minna Pietikäi
- Page 202 and 203: InterviewsHeidi Cook, Vice Principa
- Page 204 and 205: End notesPrepared by Ezra BlockWith
- Page 206 and 207: 204
- Page 208 and 209: 206
- Page 210 and 211: 208
- Page 212 and 213: scale. Overcoming "fast no's," defl
- Page 214 and 215: Climate ChangeChemical pollution(no
- Page 216 and 217: different scales of funding will in
- Page 218 and 219: While Finland has clearly begun to
- Page 220 and 221: The relationship between GHG emissi
- Page 222 and 223: D1.2 Carbon SinkFinland's forests a
- Page 224 and 225: The Land Use, Land-Use Change and F
- Page 226 and 227: It is predicted that both Pathway A
- Page 228 and 229: Inhabitations/km²1—1617—499500
- Page 230 and 231: INDEX 1990=01510Rural areasadjacent
- Page 232 and 233: Because of Finland's climate, the c
- Page 234 and 235: Population Growth9746—45154515—
- Page 236 and 237: REGIONAL LAND USE PLANDrawn up & ap
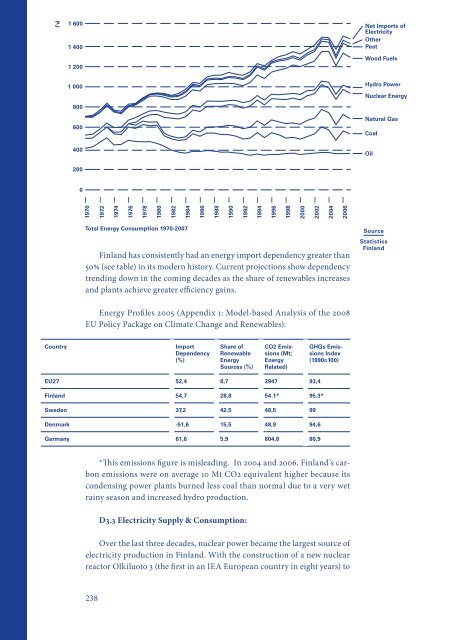
- Page 238 and 239: Finland is still greatly dependent
- Page 242 and 243: As with TFC, overall electricity co
- Page 244 and 245: PJ400300Other BiofuelsRecovered Fue
- Page 246 and 247: 244
- Page 248 and 249: 3.532.5All VehiclesPassengersVehicl
- Page 250 and 251: Passenger Traffic inthe Helsinki Ar
- Page 252 and 253: Policy planning in Finland is begin
- Page 254 and 255: D6: GovernanceD6.1 Finland's Polici
- Page 256 and 257: The EU legislative Climate and Ener
- Page 258 and 259: GHG emissions. For instance, Helsin
- Page 260 and 261: futures of finlandThere's no way to
- Page 262 and 263: Finland 2020 - Slow recovery from 2
- Page 264 and 265: Finland 2050 - At a glancePopulatio
- Page 266 and 267: Environmental taxes and personal qu
- Page 268 and 269: slowly leads to the practice whereb
- Page 270 and 271: Delivering Sustainability Bibliogra
- Page 272 and 273: End notesPrepared by Justin W. Cook
- Page 274 and 275: 272
- Page 276 and 277: 274
- Page 278 and 279: Providing adequate care for the eld
- Page 280 and 281: to hedge risk with competitive grow
- Page 282 and 283: participants in the relationship: t
- Page 284 and 285: Key DimensionsProvided below are a
- Page 286 and 287: D1.1 Origins Of The WaveThe Silver
- Page 288 and 289: first group of dependents of the so
- Page 290 and 291:
D2.1 Defining The LandscapeThe defi
- Page 292 and 293:
D2.3 Social And Service NetworksAn
- Page 294 and 295:
care as much as possible. It is gen
- Page 296 and 297:
D3—Beyond Functional CapacityCont
- Page 298 and 299:
and educated, and attain the tools
- Page 300 and 301:
The municipalities must abide to th
- Page 302 and 303:
D5—Government Initiatives and Ref
- Page 304 and 305:
approach for carrying out municipal
- Page 306 and 307:
D6 - Evolution of the Welfare Syste
- Page 308 and 309:
futures of finlandThere's no way to
- Page 310 and 311:
Finland 2020 - Slow recovery from 2
- Page 312 and 313:
Finland 2050 - At a glancePopulatio
- Page 314 and 315:
Environmental taxes and personal qu
- Page 316 and 317:
slowly leads to the practice whereb
- Page 318 and 319:
BibliographyPamphlets (PDF and hard
- Page 320 and 321:
Koskinen, Seppo, et al. Health in F
- Page 322 and 323:
“Social Security Programmes Throu
- Page 324 and 325:
End notesPrepared by Adriel Mesznik
- Page 326 and 327:
324
- Page 328 and 329:
326Look AgainUnpack IssuesExamine B
- Page 330 and 331:
328ChapterGlossary/IndexAgeing—p
- Page 332 and 333:
330BibliographyAdditional worksof i
- Page 334 and 335:
332About SitraIn 1967, Finland rewa
- Page 336 and 337:
334
- Page 339:
Thankyou forreadingthisbook.Questio