Company Presentation - Tom Tailor
Company Presentation - Tom Tailor
Company Presentation - Tom Tailor

Create successful ePaper yourself
Turn your PDF publications into a flip-book with our unique Google optimized e-Paper software.
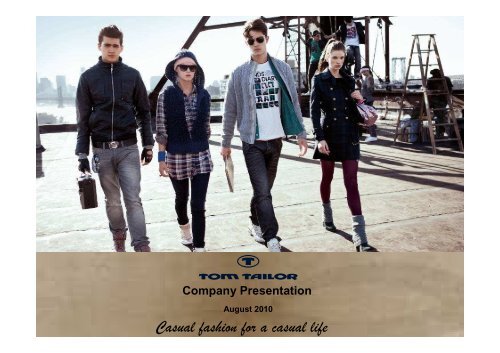
<strong>Company</strong> <strong>Presentation</strong>August 2010Casual fashion for a casual life1
Act Premium – Sell VolumeTOM TAILOR COMPANY PRESENTATION33
Act Premium – Sell VolumeTOM TAILOR COMPANY PRESENTATION4
Strong and experienced management teamDieter Holzer, CEODr. Axel Rebien, CFOChristoph Rosa, CPO• Joined TOM TAILOR in September 2006• 2000-2006: CEO at <strong>Tom</strong>my HilfigerGermany• 1995-2000: Wholesale Manager at EspritEurope, especially for Germany, UK andEastern EuropeTOM TAILOR COMPANY PRESENTATION• Joined TOM TAILOR in October 2005• 2002-2005: Ernst & Young CorporateFinance, Transaction Advisory Services• 1999-2002: Arthur Andersen• 1991-1998: Bremer Landesbank CapitalMarkets• Joined TOM TAILOR in November 2007• 2003-2007: Marketing Director StreetOne (Division Head, CBR Group)• 2002-2003: Rosa Retail Proprietor• 1999-2002: P&C Buying Department5
Investment highlights–A proven business concept witha strategy for systematic and profitable growth1Verticalsystem-supplierof lifestylefashionLean and vertical business model with full information control over entirevalue chainFashion follower approach with 12 collections per year minimising fashion risk2AttractivegrowthpotentialStrong growth potential across product divisionsMulti-channel distribution focused on controlled space driving growth andfostering brand reach3StrongprofitabilityupsideStrong economies of scale effectsStructural margin upside potential through systematic retail expansion4ExperiencedmanagementteamBusiness revitalisation since entry of new management as base forsystematic and profitable growthLong-standing industry experience and track record at leading apparel playersTOM TAILOR COMPANY PRESENTATION6
Multi-channel distribution approach providingsignificant growth opportunitiesControlleddistributionRetail / B2CWholesale / B2BRetail E-businessFranchise Shop-in-shop Multi-labelPoSas ofJune 30, 201096 own operatedstores acrossEuropewww.tom-tailor.dewww.tom-tailor.atwww.tom-tailor.nl205 across Europe1,240 acrossEurope~4,500 worldwideHighlights Promote identification withthe brand Attract potentialfranchisees Fundamentally strongdistribution channellaunched in December2006 High customerconvenience Mono-label stores run ona franchise basis Assistance in professionalretail space management Demarcated retail areasin department stores Situated in top locationsin larger towns and citiesand shopping centres Designed in accordancewith TOM TAILOR’sspecifications Listings in multi-labelretailers offering a limitedrange of TOM TAILORproductsTOM TAILOR COMPANY PRESENTATION8
TOM TAILOR has outperformed the apparel marketClothing market–Germany (€bn)Market sharesTOM TAILORCAGR 06–08:+12.5%Western EuropeTop 5 companies11.7%GermanyTop 5 companies15.0%55.756.2 56.4MarketCAGR 06–08:+0.7%2006 2007 2008Source: Verdict (2009)Others88.3%Source: Mintel report (October 2009)Others85.0%TOM TAILOR Retail–Like-for-like sales growthExcluding e-business Including e-business16.5%12.6%14.0%4.6%2.8%2007 2008 2009Highlights Significant outperformance of TOM TAILOR, growing inGermany at a CAGR 06–08 of 12.5%, systematically gainingmarket share Strong growth momentum through retail store roll-out and likefor-likesales growth High level of fragmentation in the Western European andGerman apparel industries with the top 5 companies holding amarket share of 11.7% and 15.0%, respectivelyTOM TAILOR COMPANY PRESENTATION9
1Vertical system-supplier of lifestyle fashionA premium lifestyle brand at affordable pricesLifestyle matrixTOM TAILOR target groupExclusivesegmentBridgesegmentBOGNERJIL SANDERSTRENESSEMAX MARARALPH LAURENHUGO BOSSTOMMY HILFIGERSTRELLSONMARC O’POLOESCADAPRADADIESELREPLAYCLOSEDG-STARNominal disposable income ofGerman households200837.2mm¹Households (HHs)2.5 HHs(Disp. income: > €4,500)% of HHs6.7%Medium pricesegmentBONITAGERRY WEBERESPRITS. OLIVERBENETTONSTREET ONECECILLERROSMEXXSTEFANELNEWYORKERBESTSELLERGROUPMANGOH&MZARATOM TAILORtarget group20.3 HHs(Disp. income:€1,500-4,500)54.6%Low tomedium pricesegmentKIKTAKKOC&APIMKIEORSAY14.4 HHs(Disp. income: < €1,500)38.7%Fashion degreeLowHighStrong market positioning in the young, casual lifestyle segmentSource: German Federal Statistical Office - StatisticalYearbook 2009, Management view; ¹ Excludes ~2.9mmhouseholds for which no disposable income figures areavailable as per German Federal Statistical OfficePrimarily targeting the middle-income consumer segment with a highly attractive value-for-money propositionTOM TAILOR COMPANY PRESENTATION10
1Vertical system-supplier of lifestyle fashionStrong consumer acceptance: TOM TAILOR is oneof the fastest growing apparel brandsDimensions of consumer acceptance and brand recognition across competitorsBrand awareness Brand ownership Willingness to buy200140%+31%-pts8%+14%-pts12%+14%-pts2006/771%22%26%200177%27%32%+11%-pts+12%-pts+9%-pts2006/788%39%41%200172%25%31%+15%-pts+16%-pts+12%-pts2006/787%41%43%200168%18%25%2006/777%+9%-pts20%+2%-pts28%+3%-ptsOne of the key winners in recent history according to Spiegel Outfit–a leading brand survey in GermanyIndustry-leading growth rates across all relevant brand dimensionsSource: Spiegel Outfit study 6 (2007); Spiegel Outfit study 5 (2001)TOM TAILOR COMPANY PRESENTATION11
1Vertical system-supplier of lifestyle fashionLean and vertical business model with fullinformation control over entire value chainFull information control acrossall value chain processesProduct development Sourcing Logistics Distributione.g. WomenDesignTechnical preparationBuying / purchasingComplete outsourcingof manufacturingand procurementCentralisedwarehousingsystemPoints-of-saleProduct management Low fashion risk with 12collections per year~90% of purchasing inwholesale segment viapre-order system minimisingstock riskOutsourced to DHL with B2Bportal ensuring 24/7 availabilityfor business partnersMulti-channel distributionapproach with focus oncontrolled distributionFocus on core value added processes: product development and distributionTrack record for system expertise and meticulous supply chain managementTOM TAILOR COMPANY PRESENTATION12
1Vertical system-supplier of lifestyle fashionSystematic process design facilitating highflexibility to rapidly react to latest market trendsCollection developmentCollectiondevelopmentjointly bydesigner andmarket scoutDesignerMonthlyconceptmeetingMarketscoutFashion follower approach with 12 collectionsper year minimising fashion risk Systematic research of market intelligenceand identification of successful fashiontrends Fast incorporation of market-provenfashion styles Operational value chain allows for 12collections per year for each productdivision “Bestseller management”Product cycle–time-to-marketStandardprocessFasttrackSpot styleDevelopmentSaleProductionTransport &warehouse11 18 1-4 24 15 1/2 1/21T1-2 days 4W4 1/2 1/2PoSLead time:~23-26weeks~11weeks~5weeksNote: Numbers in weeks unless stated otherwiseTOM TAILOR COMPANY PRESENTATION13
2Attractive growth potentialUnique breadth of complementing growth driversInternationalisationRetail store roll-outE-businessMarket sharepotentialControlledwholesale areaLicensingTOM TAILOR DenimTOM TAILOR COMPANY PRESENTATION14
2Attractive growth potentialMulti-channel distribution focused on controlledspace driving growth and fostering brand reachControlled distributionRetail / B2COwnoperatedstoresE-businessNumber ofstoresRevenues(€mm)295.1CAGR: 73.2%872007 2009CAGR: 81.0%16.6FY 2007 FY 2009 Fast store roll-out programme indomestic market Systematic expansion in lucrativeinternational markets Rapid development of recently launcheddistribution channel Significant Capex-light roll-out opportunitiesinternationallyWholesale / B2BFranchisestoresShop-inshopsMulti-labelNumber ofstoresPoS159CAGR: 12.4%2012007 2009757CAGR: 21.0%1,1082007 2009Number of customeraccounts5,625CAGR: (10.4)%4,5122007 2009 Systematic roll-out of mono-label franchisepartner stores Significant demand from international franchisepartners promising material growthopportunities Fast-growing area expansion across domesticand international department stores Significant demand from internationalwholesale partners promising material growthopportunities Historically established dense distributionnetwork Diminishing in relative importance due tosystematic expansion of controlled distributionand conversion of multi-label into SISTOM TAILOR COMPANY PRESENTATIONNote: PoS, number of stores and customer accounts as of year-end (31 Dec)15
2Attractive growth potentialEstablished international footprint as strong basefor continuous growthEstablished internationalpresenceSteady internationalisationin core marketsBreakdown by region–2009International 31.0%Core international (€mm)Other international (€mm)Austria30.1%91.5101.393.2Other 37.0%Germany 69.0%Total revenues 2009: €300.2mm46.07.2%52.720.7%34.445.4 48.758.7France 3.3%Switzerland 11.3%Benelux18.4%2007 2008 2009Today present in 35 countries International brand reach through >360controlled points-of-saleControlled expansion in lucrative growth regions⎯⎯⎯Congruency between market potential andTOM TAILOR brandAttractive size and growth of middle-incomeconsumer segmentIncrease in purchasing powerBalanced and diversified international brandreachCore markets Austria, Benelux, Switzerlandand France accounting for 63.0% ofinternational salesStrategic decision to reduce expansion in EasternEurope due to difficult economic environment inFY2009TOM TAILOR COMPANY PRESENTATION16
3Strong profitability upsideEconomies of scale: Cost dilution and positive scaleeffects driven by revenue growthSales organisationwholesale Optimised sales force capacity utilisation Full benefit of economies of scale as a result of in-sourcing of sales forceRetail distribution Significant scale effects resulting from fast-growing store-roll out and e-business Leverage on established retail infrastructure Increased maturity profile of retail operationsPurchasing Continuous improvements in purchasing terms as a result of higher order quantities and increased buying power Significant further upside potential from optimised supplier base and higher volumes per supplierProductdevelopment Significant cost dilution driven by economies of scale in product developmentHead office Significant economies of scale across major group functions, including⎯ IT/Services⎯ AdministrationTOM TAILOR COMPANY PRESENTATION17
3Strong profitability upsideStructural margin upside potential throughsystematic retail expansionIncreasing Retail contributionAverage Retail store EBITDA margin¹Retail/B2C10.3%Retail/B2C25.5%Stores opened before 1 Jan 07 Stores opened in 2007Stores opened in 200817.0%12.8%16.3%12.9%Wholesale/B2B 89.7%2007Wholesale/B2B 74.5%20097.7%8.3%2007 2008 2009Retail–Recurring EBITDA marginRetail–Like-for-like sales growth6.3%12.0%12.6%Excluding e-business14.0%Including e-business16.5%1.8%2.8%4.6%2007 2008 20092007 2008 2009¹ Pre retail overhead expensesTOM TAILOR COMPANY PRESENTATION18
4Experienced management teamBusiness revitalisation since entry of new managementas base for systematic and profitable growthModification ofproduct mixExpansion ofcontrolled spaceImprovement oforganisationalstructureImprovement ofoperationalprocessesKey management initiatives Launch of new product lines Denim Male and Denim Female Repositioning of product line WOMEN Casual Launch and development of e-business platform Optimisation of store/shop concept Expansion and optimisation of retail business Systematic expansion of controlled premium floor space through franchise operationsand shop-in-shops Implementation of EDI/Navision Introduction of divisional structure Insourcing of sales organisation Upgrading of logistics platform Reduction of lead-times in standard processes Streamlining of supplier network Strategic focus on PoS marketingStatus20072008Dec 2006–20082008ContinuouslyContinuously2008End of 200620082009In implementation20102009TOM TAILOR COMPANY PRESENTATION19
Strong financial momentumKey historical financialsHistorical performanceGrowth potentialRevenues(€mm)261.38.5%283.55.9%300.22007 2008 2009 Resilience to difficult sectortrading environment Superior growth momentum,outgrowing the Europeanapparel market Temporary reduction ofEastern European business Systematic retail store roll-out(Casual and Denim) Controlled wholesale growthvia franchise and SIS network Strong wholesale order book2010 Fast-growing e-business International expansion inlucrative marketsGross profit137.7(€mm) Margin117.3111.345.9%42.6%41.4%2007 2008 2009 Recent improvement in grossmargins due to successfulimplementation of operationalinitiatives and economiesof scale Fast retail store roll-out Procurement chainefficiencies and betterbuying termsRecurringEBITDA(€mm) Margin35.0 37.813.4%22.17.8%12.6%2007 2008 2009 Extraordinary circumstancesin 2008 as a result of salesforce integration Recovery of EBITDA margin2009 driven by revenuegrowth and realisedefficiency gains Continued materialisation ofoperational improvements Scalability of business modeland rapid growth allowingdegression of overhead costsTOM TAILOR COMPANY PRESENTATION20
Financial snapshot - wholesaleWholesale–Revenues (€mm)Shop-in-shop format234.5237.5223.72007 2008 2009Wholesale–Recurring EBITDAFranchise format34.6(€mm)Margin28.914.8%18.77.9%12.9%2007 2008 2009TOM TAILOR COMPANY PRESENTATION21
Financial snapshot - retailRetail–Revenues and PoSCasual storesRevenues (€mm)Number of PoS26.829CAGR 07-09: 68.8%45.96076.5872007 2008 2009Retail–Recurring EBITDADenim stores(€mm)Margin9.212.0%2.91.8%0.56.3%2007 2008 2009Note: PoS exclude e-businessTOM TAILOR COMPANY PRESENTATION22
Use of IPO proceeds: ExpansionRetail store roll-outFunding of Shop-In-Shop expansion TOM TAILOR CASUAL concept200 – 250 sqm net sellingareaCapex approx. 900 €/sqmInventory level 40-60k EUR 30-50 sqm net selling area up to 350€/sqm contribution TOM TAILOR DENIM concept150 - 200 sqm net sellingareaCapex 900 €/sqmInventory level 40-60k EUR200 - 300 SISp.a. all divisions60 – 70 stores p.a.TOM TAILOR COMPANY PRESENTATION23
Investment highlights–A proven business concept witha strategy for systematic and profitable growth1Verticalsystem-supplierof lifestylefashionLean and vertical business model with full information control over entirevalue chainFashion follower approach with 12 collections per year minimising fashion risk2AttractivegrowthpotentialStrong growth potential across product divisionsMulti-channel distribution focused on controlled space driving growth andfostering brand reach3StrongprofitabilityupsideStrong economies of scale effectsStructural margin upside potential through systematic retail expansion4ExperiencedmanagementteamBusiness revitalisation since entry of new management as base forsystematic and profitable growthLong-standing industry experience and track record at leading apparel playersTOM TAILOR COMPANY PRESENTATION24
Financial highlights Q2 20101. Increase of consolidated net revenues + 13.6 %Q2 2010: €70.9 mmQ2 2009: €62.4 mm2. Like-for-like growth own operated retail stores + 5.8 %(including e-Shop + 14.2%)3. Increase of gross margin + 3.2%-pointsQ2 2010: 47.6 %Q2 2009: 44.4 %4. Strong increase of adjusted EBITDAQ2 2010: €3.6 mmQ2 2009: €-0.6 mm5. Increase of adjusted net income of + 83.5%Q2 2010: €-1.4 mmQ2 2009: €-8.6 mmTOM TAILOR COMPANY PRESENTATION25
Financial highlights H1 20101. Increase of consolidated net revenues + 9.9 %H1 2010: €147.3 mmH1 2009: €134.0 mm2. Like-for-like growth own operated retail stores + 5.8 %(including e-Shop + 14.1%)3. Increase of gross margin + 2.8%-pointsH1 2010: 47.3 %H1 2009: 44.5 %4. Increase of adjusted EBITDA of + 73.9%H1 2010: €13.5 mmH1 2009: €7.7 mm5. Increase of adjusted net income of + 70.4%H1 2010: €-3.4 mmH1 2009: €-11.4 mmTOM TAILOR COMPANY PRESENTATION26
Focus on controlled distribution areasControlleddistributionRetail / B2CWholesale / B2BRetail E-businessFranchise Shop-In-Shop Multi-labelPoS(as ofJune 30, 2010)96 own operatedstores acrossEuropewww.tom-tailor.dewww.tom-tailor.atwww.tom-tailor.nl205 across Europe1,240 acrossEurope~4,500 worldwideHighlights+ 9 stores> 40% toprior yearContinuingRevenue Share(RS) store growth+ 132 Shop-In-ShopsNumber of POSremains stableTOM TAILOR COMPANY PRESENTATION27
Split up of net revenues H1 2010Balanced product portfolioMulti-channel distributionDenim 15%Denim Male 9%Licensesand other 2%KIDS &MINIS 13%Denim Female 6%Casual83%MEN 38%Retail/B2C 23%H1 2009Retail/B2C 29%H1 2010WOMEN32%Total revenues H1 2010: € 147.3mmWholesale/B2B 77%Wholesale/B2B 71%Total revenues H1 2010: € 147.3 mmStrong international presenceConcentration on Core marketsInternational30%Core markets*90%H1 2009H1 2010Core markets*91%Domestic70%Total revenues H1 2010: € 147.3 mmOther marketsOther markets10%9%Total revenues H1 2010: € 147.3 mm*Core Markets: Germany, Austria, Switzerland, the Benelux countries, FranceTOM TAILOR COMPANY PRESENTATION28
Consolidated Profit & Loss accountKey financials H1 2010Key financials Q2 2010Revenues(€mm)9.9%134,0147,3H1 2009 H1 2010Revenues(€mm)62,413,6%70,9(€mm)MarginQ2 2009 Q2 2010(€mm) MarginGrossprofit44,5%59,616.8%69,647,3%Grossprofit44,4%27,721,7%47,6%33,7H1 2009 H1 2010Q2 2009 Q2 2010AdjustedEBITDA(€mm)5,80%Margin7,773.9%9,10%13,5AdjustedEBITDA(€mm)Margin: -0.9%-0,6Margin: 5.1%3,6H1 2009 H1 2010Q2 2009 Q2 2010AdjustedNet Income(€mm)70.4%H1 2009 H1 2010-11,4-3,4AdjustedNet Income(€mm)Q2 2009 Q2 2010-8,683.5%-1,4TOM TAILOR COMPANY PRESENTATION29
Profit & Loss account segment wholesaleKey financials H1 2010Comments(€mm)Revenues103.71.2%104.9 Controlled wholesale growthvia franchise and SIS networkin core marketsH1 2009 H1 2010(€mm)MarginGross profit6.8%43.7 41.6%39.4% 40.9H1 2009 H1 2010 Further improvements inproduct development andprocurement chains efficiency Realization of economies ofscale(€mm)MarginAdjustedEBITDA5.8%6.076.6%10.610.1% Economies of scale lead to abetter cost dilutionH1 2009 H1 2010TOM TAILOR COMPANY PRESENTATION30
Profit & Loss account segment retailKey financials H1 2010Comments(€mm)Revenues39.8%42.330.3H1 2009 H1 2010 Systematic retail store roll-out(Casual and Denim) Fast-growing e-business:increase to PY >40%; as oftotal retail revenues 23%Gross profit(€mm) Margin61.8% 25,9 61.3%18,738,5%H1 2009 H1 2010 Stable gross margindevelopment(€mm)MarginEBITDA5.7%1.768.6%2.96.9% Economies of scale lead to abetter overhead cost dilutionH1 2009 H1 2010TOM TAILOR COMPANY PRESENTATION31
Snapshot segment retail H1 2010Increasing Retail contributionRetail–Like-for-like sales growthRetail/B2C23 %Retail/B2C29 %Excluding e-businessIncluding e-business13,9%14.2%5.8% 5.8%Wholesale/B2B 77 %H1 2009Wholesale/B2B 71 %H1 2010Q1 2010 Q2 2010 Accelerated Retail store roll out will start in Q3/2010: 23 new stores openings for H2 2010 are alreadysignedTOM TAILOR COMPANY PRESENTATION32
Reconciliation to adjusted net incomeReconciliationH1 2010KEURReported Net Income for the period -13.651AdjustmentsEBITDA IPO costs 6.384Release of former transaction cost 3.405PPA amortisation 4.032Other one-time effects 87514.696H1 2009KEUR-13.645004.032-8003.23230% tax shield on adjustments -4.409-970Adjusted Net Income for the period -3.364-11.383TOM TAILOR COMPANY PRESENTATION33
Preview H2 2010RetailLFL increase in July 22.2% andincluding e-business 38.4%23 new Retail Store contracts havealready been concluded for H2 2010i.e. Berlin, Frankfurt, Zurich, Kiel,NordhornWholesaleFurther roll out of controlled salesareas: around 150 SIS in July andAugustIncrease in net incomeTOM TAILOR COMPANY PRESENTATION 34
BackupTOM TAILOR COMPANY PRESENTATION35
Annual balance sheetAssets(€mm, Dec Y/E) 2007 2008 2009Intangible assets 145.9 147.1 139.9Tangible assets 9.6 19.6 19.9Inventories 30.9 30.8 31.4Trade receivables 31.1 37.4 33.4Cash and short-term deposits 7.9 11.4 14.1Other assets 6.0 6.4 11.4Equity and liabilities(€mm, Dec Y/E) 2007 2008 2009Total equity (52.0) (62.5) (68.2)Financial liabilities 182.3 201.8 198.0Pensions 0.2 0.2 0.2Deferred tax liabilities 40.8 36.6 34.3Provisions 15.3 14.5 13.5Deferred income 0.0 5.9 5.1Trade payables 39.8 44.7 50.9Current income tax liabilities 1.2 0.8 5.7Other liabilities 3.7 10.9 10.6Total liabilities 283.4 315.3 318.3Total assets 231.4 252.8 250.1Total equity and liabilities 231.4 252.8 250.1Recapitalisation 2006 Negative balance of total equity due to the recapitalisation of TOM TAILOR in December 2006 Recapitalisation classified as “business combination under common control” according to IFRS 3. Consequently, a step-up of hidden reserves was notrealised under IFRS and the amounts distributed to shareholders decreased the group equity (positive equity under German HGB resulting from theadditional step-up in the course of the recapitalisation) As a result, net loss in FY2006 amounted to €107.2mmTOM TAILOR COMPANY PRESENTATION36
Annual income statementSummary income statement(€mm, Dec Y/E) 2007 2008 2009Revenues 261.3 283.5 300.2% growth 8.5% 5.9%Material expenses (150.0) (166.2) (162.5)Gross profit 111.3 117.3 137.7% margin 42.6% 41.4% 45.9%Other operating income 8.5 10.2 12.8Personnel expenses (31.0) (39.6) (41.3)Other operating expenses (61.8) (77.0) (72.3)Reported EBITDA 27.0 10.9 37.0% margin 10.3% 3.9% 12.3%Depreciation and amortisation (13.7) (18.2) (21.1)Reported EBIT 13.2 (7.3) 15.9Financial result (14.9) (21.7) (17.7)EBT (1.7) (29.0) (1.8)Income taxes 14.4 3.7 (3.8)Net result 12.8 (25.3) (5.6)TOM TAILOR COMPANY PRESENTATION37
Annual cash flow statement(€mm, Dec Y/E) 2007 2008 2009Net result 12.8 (25.3) (5.6)Depreciation and amortisation 13.7 18.2 21.1Change of long-term provisions (1.1) (0.1) (0.1)Cash flow 25.4 (7.3) 15.3Interest on shareholder's loan 3.1 2.7 2.2PIK interest on Mezzanine financing 1.3 1.6 1.9Change of deferred taxes (16.8) 0.5 (1.9)Change of short-term provisions 6.3 (0.7) (0.9)Gain/loss on the disposal of fixed assets 0.0 (0.2) (0.2)Change of inventories (9.9) 0.0 (0.6)Change of receivables and other assets (15.0) (6.3) (1.4)Change of payables and other liabilities 14.9 12.5 10.1Other non-cash items 0.0 (0.1) 0.2Operating cash flow 9.3 2.7 24.7Purchases of fixed assets (7.9) (23.7) (11.5)Proceeds from the sale or disposal of fixed assets 0.1 0.2 0.2Investing cash flow (7.8) (23.5) (11.3)Change in equity due to payments to and from shareholders 0.0 15.0 0.0Change in debt due to payments to and from shareholders 0.0 0.0 9.0Change of financial liabilities (6.4) 9.3 (19.7)Financing cash flow (6.4) 24.3 (10.7)Currency effects (0.0) 0.1 0.0Net change in cash (4.9) 3.6 2.6TOM TAILOR COMPANY PRESENTATION38
H1 balance sheetAssets(€mm) Dec. 31, 2009 June 30, 2010Intangible assets 139.9 136.5Tangible assets 19.9 23.3Deferred income tax 0.3 0.8Inventories 31.4 42.9Trade receivables 33.4 41.4Income tax receivable 0.4 0.7Other assets 5.1 3.9Cash and short-term deposits 14.1 13.9Prepaid assets 5.6 6.2Equity and liabilities(€mm) Dec. 31, 2009 June 30, 2010Total equity (68.2) 81.3Financial liabilities 198.0 71.6Pensions 0.2 0.2Deferred tax liabilities 34.3 33.5Provisions 13.5 13.8Deferred income 5.1 4.5Trade payables 50.9 52.7Current income tax liabilities 5.7 5.7Other liabilities 10.6 6.4Total liabilities 318.3 188.4Total assets 250.1 269.8Total equity and liabilities 250.1 269.8TOM TAILOR COMPANY PRESENTATION39
H1 income statementSummary income statement(€mm) H1 2009 H1 2010Revenues 134.0 147.3% growth 9.9%Material expenses (74.4) (77.7)Gross profit 59.6 69.6% margin 44.5% 47.3%Other operating income 6.4 7.2Personnel expenses (21.0) (26.8)Other operating expenses (36.4) (43.8)Adjusted EBITDA* 7.7 13.5% margin 5.8% 9.1%Depreciation and amortization (excluding PPA) (6.2) (6.4)Adjusted EBIT* 1.5 7.1Financial result** (10.5) (5.3)Adjusted EBT* (9.0) 1.8Income taxes (without tax shield 30%) (1.4) (0.7)Adjusted net result*** (incl. tax shield 30%) (11.4) (3.4)TOM TAILOR COMPANY PRESENTATION*7.3m one time effectsmainly for IPO**3.4m one timeeffects for restructuringof financial liabilites***10.3m totalnon-recurringone time effects40
H1 cash flow statement(€mm) H1 2009 H1 2010Net result (13.6) (13.7)Depreciation and amortisation 10.2 10.5Income tax expense / income 1.4 0.6Interest income and expenses 10.5 8.7Change in non-current provisions 0.0 0.0Change in current provisions (4.9) (1.0)Loss/gain on the disposal of fixed assets (0.2) 0.0Change in inventory (1.7) (11.5)Change in receivables and other assets (1.4) (7.4)Change in liabilities and other assets (2.8) (0.8)Income taxes paid / received 0.9 (0.3)Other non-cash changes (1.0) (2.7)Net cash flow from (used in) operating activities (2.5) (17.4)Interest paid (4.3) (4.7)Interest received 0.0 0.0Net cash flow from (used in) current activities (6.9) (22.1)Capital expenditures (10.1) (10.0)Proceeds from disposal of fixed assets 0.2 0.0Net cash flow from (used in) investing activities (9.9) (10.0)IPO proceeds 0.0 143.0Transaction costs due to IPO 0.0 (6.6)Repayment of shareholder loans 0.0 (32.6)Change in current financing liabilities 10.3 (6.0)Long-term financing liabilities 2.2 0.5Repayment of long-term financing liabilities (2.5) (66.4)Net cash flow from financing activities 10.0 31.9Effect of exchange rate changes 0.0 0.0Change in cash and cash equivalents (6.8) 0.2Cash and cash equivalents at beginning of period 11.4 14.1Cash and cash equivalents at end of period 4.7 13.9TOM TAILOR COMPANY PRESENTATION41
International wholesale footprintWholesale operationsGermany Format PoSFranchise: 48SIS: 1022Showrooms: 7Other Format PoSFranchise: 57SIS: 41Showrooms: 9Russia Format PoSFranchise: 20SIS: 4Showrooms: 1Benelux Format PoSFranchise: 10SIS: 26Showrooms: 2Bulgaria Format PoSFranchise: 3France Format PoSFranchise: 6SIS: 21Showrooms: 1Slovenia Format PoSFranchise: 9Showrooms: 1Switzerland Format PoSFranchise: 9SIS: 93Showrooms: 1Broad international distribution networkAustria Format PoSFranchise: 34SIS: 33Showrooms: 2Croatia Format PoSFranchise: 9Showrooms: 1TOM TAILOR core marketsTOM TAILOR regional wholesale operationsStable and highly visible performance as a result of established pre-order systemPoS and showrooms as of June 30, 2010SIS = Shop-in-shopTOM TAILOR COMPANY PRESENTATION42
International retail footprintRetail operationsNetherlandsPoSFull price 2Outlet 2e-shop 1Market entry 2008BelgiumPoSFull price 2Outlet 1Market entry 2009GermanyPoSFull price 45Outlet 16e-shop 1e-coop 2Market entry 2002Northern Ireland¹ PoSOutlet 1Market entry 2008Ireland¹Czech Republic PoSOutlet 3ItalyPoSFull price 2Market entry 2009Market entry 2009PoSOutlet 2FrancePoSOutlet 1Market entry 2009PoS as of June 30, 2010¹ Joint ventureTOM TAILOR COMPANY PRESENTATIONAustriaPoSFull price 15Outlet 3e-shop 1Market entry 2004SwitzerlandPoSFull price 3Outlet 1Market entry 2003Market entry 2009TOM TAILOR core marketsTOM TAILOR regional wholesale operations43