A-11634A AIB1 Improvements in cIEF_r3.qxd ... - Beckman Coulter
A-11634A AIB1 Improvements in cIEF_r3.qxd ... - Beckman Coulter
A-11634A AIB1 Improvements in cIEF_r3.qxd ... - Beckman Coulter

Create successful ePaper yourself
Turn your PDF publications into a flip-book with our unique Google optimized e-Paper software.
Application InformationIdentification of System ParametersCritical for High-Performance <strong>cIEF</strong>Ingrid D. Cruzado-Park, Scott Mack and Chitra K. Ratnayake<strong>Beckman</strong> <strong>Coulter</strong>, Inc., Fullerton, CA, USAIntroductionCapillary Isoelectric Focus<strong>in</strong>g (<strong>cIEF</strong>) is a unique andpowerful capillary electrophoretic technique. In thisprocedure, a capillary is filled with a mixture of sampleand ampholytes and the ends are submerged <strong>in</strong> anolyte(acidic) and catholyte (basic) solutions. Voltage is thenapplied across the capillary to form a pH gradient, <strong>in</strong>which ampholytes and sample are focused at theirrespective isoelectric po<strong>in</strong>t (pI). Addition of pI markerswith<strong>in</strong> the <strong>cIEF</strong> gradient allows for the reproducibledeterm<strong>in</strong>ation of pI for the sample. The <strong>cIEF</strong> analysisrequires proper optimization of various factors <strong>in</strong> orderto achieve high-quality results. Factors to beconsidered for optimization <strong>in</strong>clude degree of prote<strong>in</strong>solubility, strategies for sample mobilization, anolyteand catholyte concentrations, and pH gradient stability.Beg<strong>in</strong>n<strong>in</strong>g with currently available <strong>cIEF</strong> chemistry, westep through these key areas to consider foroptimization of this technique. This article describes aholistic approach to maximiz<strong>in</strong>g resolution andreproducibility <strong>in</strong> <strong>cIEF</strong> separations.ExperimentalInstrument. All experiments were performed us<strong>in</strong>g aPA 800 Prote<strong>in</strong> Characterization System (<strong>Beckman</strong><strong>Coulter</strong>, Inc., Fullerton, CA) equipped with a UVdetector and a 280 nm filter (p/n 144439). Data wascollected and analyzed us<strong>in</strong>g 32 Karat Software. The<strong>in</strong>stalled Neutral Capillary (<strong>Beckman</strong> <strong>Coulter</strong>, p/n477441) was 30.2 cm long (20 cm from <strong>in</strong>jector todetector). The capillary temperature was ma<strong>in</strong>ta<strong>in</strong>ed at20°C <strong>in</strong> all separations. Normal polarity was useddur<strong>in</strong>g voltage application.Chemicals and Materials. <strong>cIEF</strong> separations wereperformed us<strong>in</strong>g the components of the <strong>cIEF</strong> kit(<strong>Beckman</strong> <strong>Coulter</strong>, p/n 477490) as described <strong>in</strong> the kitUser Guide, unless specified otherwise. Anolyteconsist<strong>in</strong>g of 91 mM phosphoric acid was prepared bymix<strong>in</strong>g 1.7 mL of <strong>cIEF</strong> gel with 170 μL of 1 Mphosphoric acid <strong>in</strong> a 2 mL glass vial (<strong>Beckman</strong> <strong>Coulter</strong>,p/n 144980). Catholyte consist<strong>in</strong>g of 20 mM sodiumhydroxide was prepared by mix<strong>in</strong>g 36 μL of 1 M NaOHwith 1.8 mL of double-deionized (DDI) water <strong>in</strong> a 2 mLglass vial. The acid r<strong>in</strong>se wash (10 mM phosphoricacid) was prepared by mix<strong>in</strong>g 1.8 mL of DDI water and18 μL of 1 M phosphoric acid <strong>in</strong> a 2 mL glass vial. Allthree solutions were freshly prepared at the start ofeach work<strong>in</strong>g day and used for no more than eightconsecutive <strong>cIEF</strong> runs. The <strong>cIEF</strong> kit (p/n 477490)<strong>in</strong>cludes four prote<strong>in</strong>s as pI markers: ribonuclease A(24 mg/mL, pI 9.45), carbonic anhydrase II (4 mg/mL,pI 5.9), β-lactoglobul<strong>in</strong> A (4 mg/mL, pI 5.1) and CCKflank<strong>in</strong>g peptide (2 mg/mL, pI 3.6).Human hemoglob<strong>in</strong> AF was obta<strong>in</strong>ed from <strong>Beckman</strong><strong>Coulter</strong> (p/n 667630). Synthetic peptides weremanufactured and used as pI markers. Pharmalyte* 3-10 (p/n 17-0456-01) and Pharmalyte 5-8 (p/n 17-0453-01) were from GE-Healthcare Bio-Sciences AB(Uppsala, Sweden). Conductivity measurements wereperformed us<strong>in</strong>g an Orion 3 Star* conductivity meter(Thermo-Electron Corp., Waltham, MA). DDI water wasobta<strong>in</strong>ed from an E-pure* deionizer (BarnsteadThermolyne, Dubuque, IA). Additional solutions usedare as follows:Anolyte: 200 mM phosphoric acid was prepared bydilut<strong>in</strong>g 685 μL of 85% phosphoric acid (Sigma-Aldrich, St. Louis, MO, p/n 343245) to a f<strong>in</strong>al volumeA-<strong>11634A</strong>
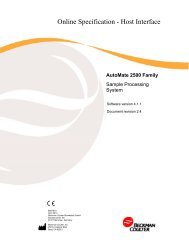
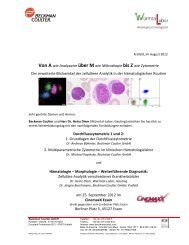
of 50.0 mL with DDI water. The anolyte can be storedat room temperature for up to 30 days.Catholyte: 300 mM sodium hydroxide was preparedby dissolv<strong>in</strong>g 0.60 g of sodium hydroxide (J. T. Baker,Phillipsburg, NJ, p/n 3722-11) <strong>in</strong> DDI water to a f<strong>in</strong>alvolume of 50.0 mL. This solution can be stored atroom temperature <strong>in</strong> a plastic conta<strong>in</strong>er for up to 30days.Chemical Mobiliz<strong>in</strong>g Solution: 20 mM acetic acidwas prepared by dilut<strong>in</strong>g 0.8 mL of 1 M acetic acid(Sigma, p/n 318590) with DDI water to a f<strong>in</strong>al volumeof 40.0 mL. This solution can be stored at roomtemperature for up to 30 days.Chemical Mobiliz<strong>in</strong>g Solution: 350 mM acetic acidwas prepared by dilut<strong>in</strong>g 1.0 mL of glacial acetic acid(Sigma, p/n A6283) with DDI water to a f<strong>in</strong>al volumeof 50.0 mL. This solution can be stored at roomtemperature for up to 30 days.Cathodic Stabilizer: 0.50 M arg<strong>in</strong><strong>in</strong>e (Arg) wasprepared by dissolv<strong>in</strong>g 0.87 g of Arg (Sigma, p/nA5006) <strong>in</strong> 10.0 mL of DDI water. This solution can bestored at room temperature for up to 30 days.Anodic Stabilizer: 0.20 M im<strong>in</strong>odiacetic acid (IDA)was prepared by dissolv<strong>in</strong>g 0.27 g of IDA (Sigma, p/n220,000) <strong>in</strong> 10.0 mL of DDI water. This solution canbe stored at room temperature for up to 30 days. IDAwill precipitate out of solution if stored at 2-8°C.Capillary Clean<strong>in</strong>g Solution: 4.3 M urea solution wasprepared by mix<strong>in</strong>g 10.8 g of urea (Sigma, p/nU0631) and 30.0 mL of DDI water. The solid materialwas dissolved by vortex<strong>in</strong>g for at least 15 m<strong>in</strong>. Thissolution can be stored at 2-8°C for up to 30 days.Desalt<strong>in</strong>g the IgG Sample. Mouse IgG1κ (Sigma,p/n M9269) was buffer-exchanged with 20 mM Tris,pH 8.0 buffer prior to <strong>cIEF</strong> analysis. A 20 mM Tris, pH8.0 buffer was prepared by dilut<strong>in</strong>g 4.0 mL of 50 mMTris buffer, pH 8.0 (<strong>Beckman</strong> <strong>Coulter</strong>, p/n 477427) to10.0 mL with DDI water. The IgG1κ stock solution(each vial conta<strong>in</strong>s 1 mL at a concentration of 1mg/mL) was thawed at room temperature and thendivided by equal volume <strong>in</strong>to two Microcon*Centrifugal Filter Devices YM-30 (p/n 42410,Millipore, Bedford, MA). The samples wereimmediately centrifuged at 12,000 rcf for 5 m<strong>in</strong> <strong>in</strong> aMicrofuge 18 (<strong>Beckman</strong> <strong>Coulter</strong>). The flow-throughwas discarded when necessary. Next, 250 μL of TrisAApertureBApertureFigure 1: <strong>cIEF</strong> separation of hemoglob<strong>in</strong>s A and F us<strong>in</strong>g different capillary cartridge apertures: (a) 200 μm and (b) 800 μm. Sample: 1.0μL of hemoglob<strong>in</strong> AF, 200 μL of <strong>cIEF</strong> gel and 4.0 μL of ampholytes 3-10. <strong>cIEF</strong> conditions: focus<strong>in</strong>g at 21 kV for 10 m<strong>in</strong> us<strong>in</strong>g a 4 m<strong>in</strong>ramp; mobilization at 21 kV for 35 m<strong>in</strong> apply<strong>in</strong>g 0.5 psi towards the outlet. Anolyte: 91 mM phosphoric acid. Catholyte: 20 mM sodiumhydroxide.2
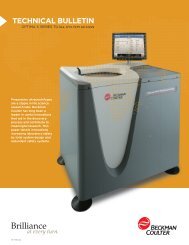
uffer were added <strong>in</strong>to each Microcon device and thesamples were aga<strong>in</strong> centrifuged at 12,000 rcf for 10m<strong>in</strong>. Aga<strong>in</strong>, 250 μL of Tris buffer were added <strong>in</strong>toeach Microcon device and the samples werecentrifuged at 12,000 rcf for 3 m<strong>in</strong>. Then 200 μL ofTris buffer were added <strong>in</strong>to each Microcon deviceand centrifuged for 5 m<strong>in</strong> at 12,000 rcf. The volume<strong>in</strong>side each Microcon filter was collected by plac<strong>in</strong>gthe <strong>in</strong>verted Microcon filters <strong>in</strong>to new centrifuge tubesand centrifug<strong>in</strong>g at 2,000 rcf for 3 m<strong>in</strong>. The volumecollected was measured with a pipet and adjusted toyield an IgG concentration of 5.0 mg/mL. F<strong>in</strong>ally, theIgG sample was aliquoted <strong>in</strong> 5.0 μL volumes andstored at -20°C or below until needed.Results and DiscussionDetection Aperture <strong>in</strong> the Capillary Cartridge. Acapillary cartridge uses an aperture to determ<strong>in</strong>e thedimension of the detection w<strong>in</strong>dow. The PA 800cartridge apertures are available <strong>in</strong> two widths: 200and 800 μm. The aperture size plays an important role<strong>in</strong> <strong>cIEF</strong> and can result <strong>in</strong> differences <strong>in</strong> peakresolution (Fig. 1). Resolution between hemoglob<strong>in</strong>sA (pI 7.0) and F (pI 7.1) <strong>in</strong>creased from 0.8 to 1.0when the 800 µm aperture was replaced with the 200µm aperture. Due to this <strong>in</strong>creased resolution, allfurther <strong>cIEF</strong> experiments were carried out with the200 µm aperture.Mobilization of the Gradient. Resolution can begreatly enhanced when us<strong>in</strong>g chemical mobilization<strong>in</strong>stead of pressure mobilization due to the absenceof hydrodynamic flow, which can cause bandbroaden<strong>in</strong>g to occur. Manabe et al 1 studied differentchemical mobilizers and concluded that acetic acidgives the best resolution. In chemical mobilization,acetate ions enter the capillary at the cathodic side,while hydronium ions enter at the anodic side.Apply<strong>in</strong>g voltage, sample and ampholytes <strong>in</strong> thegradient are titrated from the basic to the acidic sideof the capillary. Acetic acid does not significantly<strong>in</strong>crease the electrical current dur<strong>in</strong>g mobilizationthus allow<strong>in</strong>g the gradient to reta<strong>in</strong> both its l<strong>in</strong>earityand resolution.In <strong>cIEF</strong>, resolution of hemoglob<strong>in</strong>s A and F is affectedby mobilization strategy (Fig. 2). A resolution of 1.0was obta<strong>in</strong>ed with pressure mobilization, whereas aresolution of 4.0 was obta<strong>in</strong>ed us<strong>in</strong>g chemical0.07A0.06F0.05(A) Pressure Mobilization0.04AAU0.030.020.010.00(B) Chemical MobilizationF0 2 4 6 8 10 12 14 16 18 20 22 24 26 28 30 32 34M<strong>in</strong>utesFigure 2: <strong>cIEF</strong> separation of hemoglob<strong>in</strong>s A and F us<strong>in</strong>g (a) pressure and (b) chemical mobilization. Sample and experimental sett<strong>in</strong>gsas described <strong>in</strong> Fig. 1. Method with pressure mobilization as described <strong>in</strong> Fig. 1. Method with chemical mobilization: focus<strong>in</strong>g at 21 kVfor 10 m<strong>in</strong> us<strong>in</strong>g a 4 m<strong>in</strong> ramp; mobilization at 21 kV for 35 m<strong>in</strong> without pressure. Chemical mobiliz<strong>in</strong>g solution: 20 mM acetic acid.3
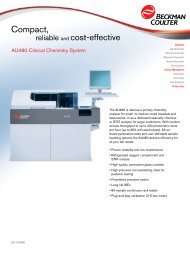
mobilization. In this experiment, chemical mobilizationwas achieved by first replac<strong>in</strong>g the catholyte vial witha 20 mM acetic acid vial at the end of the focus<strong>in</strong>gstep and then apply<strong>in</strong>g voltage across the capillary.Chemical mobilization can also aid <strong>in</strong> the preventionof spikes <strong>in</strong> the electropherogram commonly causedby the flow of air bubbles or prote<strong>in</strong> precipitateacross the detection w<strong>in</strong>dow (Fig. 3).0.300.25(A) Pressure MobilizationRun #1RACALGSpikesCCK0.20AU0.150.100.050.00Run #40 5 10 15 20 25 30 35 40 45 50 55M<strong>in</strong>utes0.450.40(B) Chemical MobilizationRun #1RACA LGCCK0.350.300.25AU0.200.150.100.050.00Run #40.0 2.5 5.0 7.5 10.0 12.5 15.0 17.5 20.0 22.5 25.0 27.5 30.0 32.5 35.0 37.5 40.0 42.5 45.0M<strong>in</strong>utesFigure 3: Four consecutive <strong>cIEF</strong> separations of a prote<strong>in</strong> mixture us<strong>in</strong>g (a) pressure and (b) chemical mobilization. Sample: 200 μL of<strong>cIEF</strong> gel, 4.0 μL of ampholytes 3-10, 5 μL of ribonuclease A (RA), 4 µL of β-lactoglobul<strong>in</strong> B (LG), 3 µL of CCK flank<strong>in</strong>g peptide, and 2µL of carbonic anhydrase II (CA). Focus<strong>in</strong>g: 15 kV for 6 m<strong>in</strong> us<strong>in</strong>g a 0.17 m<strong>in</strong> ramp. Pressure mobilization: 21 kV for 49 m<strong>in</strong> apply<strong>in</strong>g 0.5psi towards the outlet. Chemical mobilization: 21kV for 39 m<strong>in</strong> us<strong>in</strong>g 20 mM acetic acid as chemical mobilizer. Anolyte: 91 mMphosphoric acid. Catholyte: 20 mM sodium hydroxide.4
Clean<strong>in</strong>g the Capillary Surface. Hydrophobicprote<strong>in</strong>s can precipitate <strong>in</strong>side the capillary and/or beadsorbed to the capillary <strong>in</strong>ternal coat<strong>in</strong>g, adverselyaffect<strong>in</strong>g resolution and reproducibility. Electricalcurrent profiles can help <strong>in</strong>dicate changes <strong>in</strong>resistance with<strong>in</strong> the capillary, possibly due toprecipitated prote<strong>in</strong> redissolv<strong>in</strong>g dur<strong>in</strong>g separation(Fig. 4a). Fluctuations <strong>in</strong> the electrical current candecrease the efficacy of the focus<strong>in</strong>g and chemicalmobilization steps. In order to mitigate this, a 4.3 Murea solution <strong>in</strong> water can be used to cleanse thecapillary between <strong>cIEF</strong> separations. Urea aidssolubilization of precipitated prote<strong>in</strong>s <strong>in</strong>side thecapillary. Use of capillary clean<strong>in</strong>g solution beforeeach <strong>cIEF</strong> separation helps stabilize current profiles(Fig. 4b) and has been successful <strong>in</strong> improv<strong>in</strong>greproducibility. Implementation of this improvementrequires r<strong>in</strong>s<strong>in</strong>g the capillary with capillary clean<strong>in</strong>gsolution for 3 m<strong>in</strong> at 50 psi followed by DDI waterr<strong>in</strong>se for 2 m<strong>in</strong> at 50 psi, at the start of each <strong>cIEF</strong>separation.If buffer-exchange is not possible, desalt<strong>in</strong>g can beaccomplished dur<strong>in</strong>g focus<strong>in</strong>g by us<strong>in</strong>g the voltageramp option (Fig. 5) and establish<strong>in</strong>g a current limit of20 µA (Fig. 6) <strong>in</strong> the 32 Karat Software method. Theramp option <strong>in</strong>creases the voltage dur<strong>in</strong>g the specifiedtime <strong>in</strong>terval. However, focus<strong>in</strong>g time must be optimizedwhen employ<strong>in</strong>g the voltage ramp option <strong>in</strong> order toensure complete formation of the pH gradient.Concentration of Anolyte and Catholyte.Changes <strong>in</strong> conductivity and pH value of anolyte andcatholyte solutions can cause shifts <strong>in</strong> migration timebetween consecutive <strong>cIEF</strong> separations (Fig. 7). Forexample, mobilization time decreased with eachconsecutive separation when us<strong>in</strong>g 91 mMphosphoric acid as anolyte, 20 mM sodium hydroxideas catholyte, and 20 mM acetic acid as chemicalmobilizer. This shift <strong>in</strong> migration time was due to adecrease <strong>in</strong> conductivity of the catholyte (Table 1).Practically, the pH of the catholyte decreased from12108(A) Without Clean<strong>in</strong>g12108(B) With Clean<strong>in</strong>gFigure 4: Electrical current profiles of <strong>cIEF</strong>separations when (a) not r<strong>in</strong>s<strong>in</strong>g and (b)r<strong>in</strong>s<strong>in</strong>g with the capillary clean<strong>in</strong>g solutionbetween runs. Separations were carried outas described <strong>in</strong> Fig. 3 us<strong>in</strong>g chemicalmobilization, except (a) 5 m<strong>in</strong> and(b) 6 m<strong>in</strong> of focus<strong>in</strong>g.µA6µA6442200 2 4 6 8M<strong>in</strong>utes00 2 4 6 8M<strong>in</strong>utesSample Desalt<strong>in</strong>g. The <strong>cIEF</strong> separation is verysensitive to the amount of salt present <strong>in</strong> the sample.Rodriguez-Diaz et al 2 showed that high salt contentcan compress the pH gradient, decreas<strong>in</strong>g resolutionand slow<strong>in</strong>g the rates of focus<strong>in</strong>g and mobilization.Another disadvantage of high salt content is highelectrical current, which can deteriorate the capillarycoat<strong>in</strong>g if it <strong>in</strong>creases above 20 µA. Desalt<strong>in</strong>gsamples prior to separation can be performed byexchang<strong>in</strong>g the sample buffer with a low-ionicstrength buffer (e.g. 20 mM Tris, pH 8.0 buffer) us<strong>in</strong>ga concentrator such as the Microcon CentrifugalFilter Device. In general, the <strong>cIEF</strong> sample should havea salt concentration below 50 mM.pH 12 to 10, caus<strong>in</strong>g the loss of cathodic stabilizer<strong>in</strong>to the catholyte vial. Because of this, the migrationtime of the samples decreased over consecutive runs.Migration time shifts can be elim<strong>in</strong>ated by <strong>in</strong>creas<strong>in</strong>gthe concentration of the anolyte, catholyte andchemical mobiliz<strong>in</strong>g solutions. Recommendedconcentrations for <strong>cIEF</strong> separations are 200 mMphosphoric acid as anolyte, 300 mM sodiumhydroxide as catholyte, and 350 mM acetic acid aschemical mobiliz<strong>in</strong>g solution (Fig. 8). The pH andconductivity values of these highly concentratedsolutions have been found to be stable up to tenconsecutive <strong>cIEF</strong> separations (Table 2).5
Figure 5: Focus<strong>in</strong>g sett<strong>in</strong>gs used <strong>in</strong> the <strong>cIEF</strong> separation of hemoglob<strong>in</strong>s A and F (Figs. 1-2). Red arrow po<strong>in</strong>ts to the ramp time, whichis set on the time program of the <strong>cIEF</strong> method. The default value for the ramp time is 0.17 m<strong>in</strong>. Use the ramp time to control the rate ofvoltage <strong>in</strong>crease dur<strong>in</strong>g focus<strong>in</strong>g.Figure 6: Initial conditions of <strong>cIEF</strong> method. Red arrow po<strong>in</strong>ts to the maximum current sett<strong>in</strong>g. The default value of the maximum currentis 300 μA. Change this value to 20 μA when perform<strong>in</strong>g <strong>cIEF</strong> to prevent electrical current to <strong>in</strong>crease over 20 μA.6
0.450.400.35#1RACALGCCK0.300.25AU0.200.150.100.050.00#812 14 16 18 20 22 24 26 28 30 32 34 36 38 40M<strong>in</strong>utesFigure 7: Eight consecutive <strong>cIEF</strong> separations of prote<strong>in</strong> pI markers us<strong>in</strong>g 91 mM phosphoric acid as anolyte, 20 mM sodium hydroxideas catholyte and 20 mM acetic acid as chemical mobilizer. Separation conditions and sample as described <strong>in</strong> Fig. 3b.VialAnolyte:91mM H 3 PO 4Catolyte:20mM NaOHChemical Mobilizer:20 mM Acetic AcidConductivity of freshly preparedsolutions (mS/cm)6.954.9600.2243Conductivity after 10 <strong>cIEF</strong>separations (mS/cm)6.922.0980.2129Table 1: Conductivity values of anolyte, catholyte and chemical mobiliz<strong>in</strong>g solutions with low concentration before and after perform<strong>in</strong>geight consecutive <strong>cIEF</strong> separations.7
Stabilization of the pH Gradient. Follow<strong>in</strong>g theformation of the pH gradient, isotachophoresis cancause distortion by mov<strong>in</strong>g the ends of the gradient<strong>in</strong>to the anolyte and catholyte vials (Fig. 9a). Thisphenomenon can be prevented by the use ofstabilizers (Fig. 9b), similar to the s<strong>in</strong>gle-componentampholytes used <strong>in</strong> isoelectric trapp<strong>in</strong>g 3 .In this case, the stabilizers are UV-transparentchemical compounds that have a pI value above orbelow the pH range of the ampholytes and also havehigh conductivity. In order to be an effective anodicstabilizer, the reagent must have a pI above the pH ofthe anolyte (pH 1) and below pH 3 when us<strong>in</strong>g pH 3-10 ampholytes. IDA is a good anodic stabilizerbecause its pI is 2.2. Follow<strong>in</strong>g the same logic, aneffective cathodic stabilizer must have a pI below thepH of the catholyte (pH 12) and a pH above 10 whenus<strong>in</strong>g pH 3-10 ampholytes. In this case, arg<strong>in</strong><strong>in</strong>e is agood cathodic stabilizer because its pI is 10.7.Peptide pI Markers. Many prote<strong>in</strong>s do not functionas good pI markers because their pI values can beaffected by post-translation modifications,degradation and changes <strong>in</strong> three-dimensionalconformation. Therefore, short synthetic peptides canbe used as pI markers for maximum precision of thepI determ<strong>in</strong>ation. Shimura et al 4 designed and testedsynthetic peptides as pI markers <strong>in</strong> <strong>cIEF</strong>. Some ofthese peptide pI markers are listed <strong>in</strong> Table 3.The peptide pI markers (Table 3) were separatedus<strong>in</strong>g the <strong>cIEF</strong> method improvements discussed <strong>in</strong>this article (Fig. 10). L<strong>in</strong>earity above 0.99 wasobta<strong>in</strong>ed <strong>in</strong> the pH 3-10 range (Fig. 11), <strong>in</strong>dicat<strong>in</strong>gthat pI response is l<strong>in</strong>ear when apply<strong>in</strong>g these <strong>cIEF</strong>improvements.(A)(B)Figure 9: A diagram illustrat<strong>in</strong>g a capillary with ends submerged <strong>in</strong> anolyte (phosphoric acid) and catholyte (sodium hydroxide) vialsdur<strong>in</strong>g focus<strong>in</strong>g. Case (a): capillary is filled with ampholytes pH 3-10; gradient is decay<strong>in</strong>g <strong>in</strong>to the anolyte and catholyte vials. Case (b):capillary is filled with ampholytes pH 3-10, cathodic stabilizer and anodic stabilizer; pH gradient is protected by stabilizers.PeptideTrp-Tyr-Lys-LysTrp-Tyr-Tyr-Tyr-Lys-LysTrp-Glu-His-ArgTrp-Glu-His-HisTrp-Glu-HisTrp-Asp-Asp-ArgTrp-Asp-Asp-AsppI value10.09.57.06.75.54.13.4Table 3: List of peptides with am<strong>in</strong>o acid sequence andcorrespond<strong>in</strong>g pI values.9
ConclusionThis article describes a holistic approach to<strong>in</strong>creas<strong>in</strong>g resolution and reproducibility of <strong>cIEF</strong>. Keyareas of optimization for greater robustness are asfollows:• The use of a 200 μm aperture <strong>in</strong>stead ofthe 800 μm aperture <strong>in</strong> the capillarycartridge, to <strong>in</strong>crease resolution.• Replacement of pressure mobilization withchemical mobilization us<strong>in</strong>g 350 mM aceticacid solution to alleviate band broaden<strong>in</strong>gand obta<strong>in</strong> better resolution.• The use of a capillary clean<strong>in</strong>g solutionconsist<strong>in</strong>g of 4.3 M urea to reduce buildup ofprote<strong>in</strong> precipitate on capillary surfaces.References1. Manabe, T., Miyamoto, H., Iwasaki, A.Electrophoresis 18, 92 (1997).2. Rodriguez-Diaz, R., Wehr, T., Zhu, M.Electrophoresis 18, 2134 (1997).3. North, R.Y., Vigh, Gy. Electrophoresis 29, 1077(2008).4. Shimura, K., Wang, Z., Matsumoto, H., Kasai, K.Electrophoresis 21, 603 (2000).5. Thorman, W., Mosher, R. Electrophoresis 27, 968(2006).• Desalt<strong>in</strong>g of samples prior to <strong>cIEF</strong>separation to m<strong>in</strong>imize compression of thepH gradient.• Addition of cathodic and anodic stabilizers<strong>in</strong> the <strong>cIEF</strong> sample mixture to reducedistortions caused by isotachophoresis.•Increase of anolyte concentration to 200mM phosphoric acid.• Increase of catholyte concentration to 300mM NaOH.• The use of peptide pI markers to achievehighest accuracy <strong>in</strong> pI determ<strong>in</strong>ation.• The addition of urea to the <strong>cIEF</strong> sample tom<strong>in</strong>imize prote<strong>in</strong> precipitation.* All trademarks are the property of their respective owners.For Research Use Only; not for use <strong>in</strong> diagnostic procedures.Australia, Gladesville (61) 2 9844-6000 Canada, Mississauga (1) 905 819 1234 Ch<strong>in</strong>a, Beij<strong>in</strong>g (86) 10 6515 6028Czech Republic, Prague (420) 272 01 73 32 Eastern Europe, Middle East, North Africa, South West Asia: Switzerland, Nyon (41) 22 365 3707France, Villep<strong>in</strong>te (33) 1 49 90 90 00 Germany, Krefeld (49) 2151 33 35 Hong Kong (852) 2814 7431India, Mumbai (91) 22 3080 5101 Italy, Cass<strong>in</strong>a de’ Pecchi, Milan (39) 02 953921 Japan, Tokyo (81) 3 5530 8500 Korea, Seoul (82) 2 404 2146Lat<strong>in</strong> America (1) (305) 380 4709 Mexico, Mexico City (001) 52 55 9183 2800 Netherlands, Mijdrecht (31) 297 230630 Puerto Rico (787) 747 3335S<strong>in</strong>gapore (65) 6339 3633 South Africa/Sub-Saharan Africa, Johannesburg (27) 11 564 3203 Spa<strong>in</strong>, Madrid (34) 91 3836080Sweden, Bromma (46) 8 564 85 900 Switzerland, Nyon (41) 0800 850 810 Taiwan, Taipei (886) 2 2378 3456 Turkey, Istanbul (90) 216 570 17 17UK, High Wycombe (44) 01494 441181 USA, Fullerton, CA (1) 800 742 2345B2008-8783-PO-3K www.beckmancoulter.com © 2008 <strong>Beckman</strong> <strong>Coulter</strong>, Inc. BMR-PRINTED IN U.S.A.