Literacy Trends in Pakistan - UNESCO Islamabad
Literacy Trends in Pakistan - UNESCO Islamabad Literacy Trends in Pakistan - UNESCO Islamabad
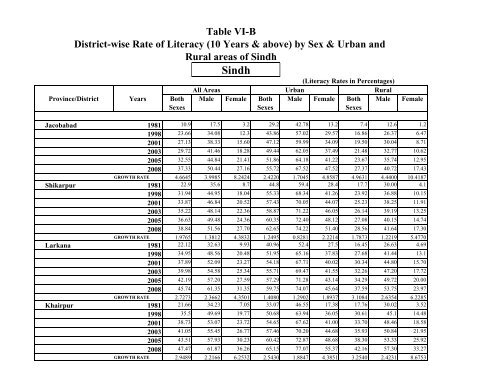
Table VI-BDistrict-wise Rate of Literacy (10 Years & above) by Sex & Urban andRural areas of SindhSindhProvince/DistrictYearsBothSexesAll AreasMale Female BothSexes(Literacy Rates in Percentages)UrbanRuralMale Female Both MaleSexesFemaleJacobabadShikarpurLarkanaKhairpur1981 10.9 17.5 3.2 29.2 42.78 13.2 7.4 12.6 1.21998 23.66 34.08 12.3 43.86 57.02 29.57 16.86 26.37 6.472001 27.13 38.33 15.60 47.12 59.99 34.09 19.50 30.04 8.712003 29.72 41.46 18.28 49.44 62.05 37.49 21.48 32.77 10.622005 32.55 44.84 21.41 51.86 64.18 41.22 23.67 35.74 12.952008 37.33 50.44 27.16 55.72 67.52 47.52 27.37 40.72 17.43GROWTH RATE 4.6645 3.9985 8.2424 2.4220 1.7045 4.8587 4.9631 4.4400 10.41871981 22.9 35.6 8.7 44.8 59.4 28.4 17.7 30.00 4.11998 31.94 44.95 18.04 55.33 68.34 41.26 23.92 36.88 10.152001 33.87 46.84 20.52 57.43 70.05 44.07 25.23 38.25 11.912003 35.22 48.14 22.36 58.87 71.22 46.05 26.14 39.19 13.252005 36.63 49.48 24.36 60.35 72.40 48.12 27.08 40.15 14.742008 38.84 51.56 27.70 62.65 74.22 51.40 28.56 41.64 17.30GROWTH RATE 1.9765 1.3812 4.3832 1.2495 0.8281 2.2214 1.7873 1.2219 5.47701981 22.12 32.63 9.93 40.96 52.4 27.5 16.45 26.63 4.691998 34.95 48.56 20.48 51.95 65.16 37.83 27.68 41.44 13.12001 37.89 52.09 23.27 54.18 67.71 40.02 30.34 44.80 15.702003 39.98 54.58 25.34 55.71 69.47 41.55 32.26 47.20 17.722005 42.19 57.20 27.59 57.29 71.28 43.14 34.29 49.72 20.002008 45.74 61.35 31.35 59.75 74.07 45.64 37.59 53.75 23.97GROWTH RATE 2.7273 2.3662 4.3501 1.4080 1.2902 1.8937 3.1084 2.6354 6.22851981 21.66 34.23 7.05 33.07 46.55 17.38 17.76 30.02 3.521998 35.5 49.69 19.77 50.68 63.94 36.05 30.61 45.1 14.482001 38.73 53.07 23.72 54.65 67.62 41.00 33.70 48.46 18.582003 41.05 55.45 26.77 57.46 70.20 44.68 35.93 50.84 21.952005 43.51 57.93 30.23 60.42 72.87 48.68 38.30 53.33 25.922008 47.47 61.87 36.26 65.15 77.07 55.37 42.16 57.30 33.27GROWTH RATE 2.9489 2.2166 6.2532 2.5430 1.8847 4.3851 3.2540 2.4231 8.6753
Province/DistrictSukkurGhotkiNawabshahNaushahro FerozeDaduAll Areas Urban RuralYears Both Male Female Both Male Female Both Male FemaleSexesSexesSexes1981 26.34 37.49 12.81 43.86 54.35 31.13 18.77 30.21 4.91998 46.62 59.83 31.22 59.76 70.59 46.9 31.72 47.4 13.782001 51.56 64.97 36.53 63.11 73.92 50.42 34.80 51.32 16.542003 55.14 68.65 40.57 65.45 76.23 52.91 37.01 54.11 18.682005 58.98 72.53 45.05 67.88 78.61 55.52 39.37 57.06 21.092008 65.23 78.76 52.72 71.69 82.33 59.69 43.19 61.78 25.32GROWTH RATE 3.4155 2.7878 5.3799 1.8363 1.5498 2.4402 3.1345 2.6851 6.27101981 22.44 37.00 5.00 32.10 47.95 13.39 20.66 35.00 3.441998 29.01 44.21 11.85 49.38 64.63 32.72 24.87 40.14 7.522001 30.35 45.62 13.80 53.28 68.13 38.31 25.70 41.12 8.632003 31.29 46.59 15.27 56.05 70.56 42.55 26.26 41.79 9.462005 32.25 47.57 16.91 58.96 73.08 47.27 26.84 42.47 10.382008 33.74 49.09 19.69 63.62 77.04 55.34 27.74 43.51 11.91GROWTH RATE 1.5220 1.0528 5.2069 2.5658 1.7715 5.3963 1.0969 0.8093 4.70801981 23.00 34.1 10.8 46.1 58.00 32.3 18.3 29.1 6.61998 34.13 47.62 19.62 54.26 64.94 42.69 26.47 41 10.892001 36.59 50.51 21.80 55.84 66.25 44.84 28.25 43.56 11.902003 38.33 52.53 23.39 56.92 67.13 46.34 29.51 45.35 12.622005 40.15 54.64 25.09 58.03 68.03 47.89 30.81 47.22 13.382008 43.05 57.96 27.87 59.72 69.40 50.30 32.89 50.16 14.62GROWTH RATE 2.3488 1.9839 3.5742 0.9633 0.6670 1.6541 2.1950 2.0371 2.98961981 − − − − − − − − −1998 39.14 54.27 22.6 53.34 66.15 39.57 35.99 51.66 18.82001 42.99 58.91 25.75 54.73 67.70 41.01 40.55 57.17 22.612003 45.76 62.22 28.08 55.68 68.76 42.00 43.91 61.16 25.582005 48.72 65.71 30.63 56.64 69.83 43.02 47.55 65.43 28.932008 53.51 71.33 34.89 58.12 71.47 44.59 53.58 72.41 34.80GROWTH RATE 3.1768 2.7711 4.4393 0.8618 0.7764 1.2013 4.0587 3.4338 6.35111981 21.5 32.5 8.6 39.6 50.6 26.2 18.5 29.4 5.71998 35.56 48.03 21.65 54.3 66.6 41.11 30.34 42.98 16.082001 38.86 51.46 25.48 57.41 69.91 44.51 33.11 45.96 19.312003 41.23 53.88 28.40 59.58 72.21 46.93 35.09 48.06 21.822005 43.75 56.41 31.66 61.84 74.58 49.49 37.19 50.25 24.652008 47.81 60.44 37.27 65.38 78.28 53.58 40.59 53.74 29.60GROWTH RATE 3.0041 2.3242 5.5810 1.8744 1.6293 2.6854 2.9527 2.2589 6.2906
- Page 42 and 43: Graph No.4LITERACY RATE DIRECTLY EF
- Page 44 and 45: 16. LITERACY AND NATIONAL PLAN OF A
- Page 46 and 47: 17.1 Why has it been established?Th
- Page 48 and 49: Table 16 - Focus Areas and Key Stra
- Page 50 and 51: 17.5 Resource MobilizationThe Liter
- Page 52 and 53: PART - IIStatistical Tables(Based o
- Page 57: Table IILiteracy Rates (10 Years &
- Page 62: Growth RateYearsAll Areas Urban Rur
- Page 66 and 67: N.W.F.P.1972 15.50 23.10 4.701981 1
- Page 71 and 72: Table VLiteracy Rates (10 Years & a
- Page 74 and 75: Table VI-ADistrict-wise Rate (10 Ye
- Page 76 and 77: Province/DistrictBoth Male Female B
- Page 78 and 79: Province/DistrictBoth Male Female B
- Page 80 and 81: Province/DistrictBoth Male Female B
- Page 82 and 83: All Areas Urban RuralProvince/Distr
- Page 84 and 85: All Areas Urban RuralProvince/Distr
- Page 86 and 87: Table VI-DDistrict-wise Rate of Lit
- Page 88 and 89: All Areas Urban RuralProvince/Distr
- Page 90 and 91: All Areas Urban RuralProvince/Distr
- Page 94 and 95: Province/DistrictHyderabadBadinThat
- Page 96 and 97: Province/DistrictKarachi SouthKarac
- Page 98 and 99: All AreasUrbanRuralProvince/Distric
- Page 100 and 101: All Areas Urban RuralProvince/Distr
- Page 102 and 103: All Areas Urban RuralProvince/Distr
- Page 105 and 106: Table VII-CDistrict-wise Rate of Li
- Page 107 and 108: All Areas Urban RuralProvince/Distr
- Page 109 and 110: Table VII-BDistrict-wise Rate of Li
- Page 111 and 112: All Areas Urban RuralProvince/Distr
- Page 113 and 114: IlliterateLiterate Matric & above D
- Page 115 and 116: Illiterate Literate Matric & above
- Page 117 and 118: Table VIII-BLinkage between Literac
- Page 119 and 120: IlliterateLiterate Matric & above D
- Page 121 and 122: IlliterateLiterate Matric & above D
- Page 123 and 124: Illiterate Literate Matric & above
- Page 125 and 126: Table VIII-DLinkage between Literac
- Page 127 and 128: IlliterateLiterate Matric & above D
- Page 129 and 130: Table IX-ADistrict-wise Participati
- Page 131 and 132: Province/District/ Population Schoo
- Page 133 and 134: Province/District/ Population Schoo
- Page 135 and 136: Province/District/ Population Schoo
- Page 137 and 138: Table IX-DDistrict-wise i i Partici
- Page 139 and 140: Table X-CDistrict-wise Participatio
- Page 141 and 142: Province/District/ All Areas Urban
Table VI-BDistrict-wise Rate of <strong>Literacy</strong> (10 Years & above) by Sex & Urban andRural areas of S<strong>in</strong>dhS<strong>in</strong>dhProv<strong>in</strong>ce/DistrictYearsBothSexesAll AreasMale Female BothSexes(<strong>Literacy</strong> Rates <strong>in</strong> Percentages)UrbanRuralMale Female Both MaleSexesFemaleJacobabadShikarpurLarkanaKhairpur1981 10.9 17.5 3.2 29.2 42.78 13.2 7.4 12.6 1.21998 23.66 34.08 12.3 43.86 57.02 29.57 16.86 26.37 6.472001 27.13 38.33 15.60 47.12 59.99 34.09 19.50 30.04 8.712003 29.72 41.46 18.28 49.44 62.05 37.49 21.48 32.77 10.622005 32.55 44.84 21.41 51.86 64.18 41.22 23.67 35.74 12.952008 37.33 50.44 27.16 55.72 67.52 47.52 27.37 40.72 17.43GROWTH RATE 4.6645 3.9985 8.2424 2.4220 1.7045 4.8587 4.9631 4.4400 10.41871981 22.9 35.6 8.7 44.8 59.4 28.4 17.7 30.00 4.11998 31.94 44.95 18.04 55.33 68.34 41.26 23.92 36.88 10.152001 33.87 46.84 20.52 57.43 70.05 44.07 25.23 38.25 11.912003 35.22 48.14 22.36 58.87 71.22 46.05 26.14 39.19 13.252005 36.63 49.48 24.36 60.35 72.40 48.12 27.08 40.15 14.742008 38.84 51.56 27.70 62.65 74.22 51.40 28.56 41.64 17.30GROWTH RATE 1.9765 1.3812 4.3832 1.2495 0.8281 2.2214 1.7873 1.2219 5.47701981 22.12 32.63 9.93 40.96 52.4 27.5 16.45 26.63 4.691998 34.95 48.56 20.48 51.95 65.16 37.83 27.68 41.44 13.12001 37.89 52.09 23.27 54.18 67.71 40.02 30.34 44.80 15.702003 39.98 54.58 25.34 55.71 69.47 41.55 32.26 47.20 17.722005 42.19 57.20 27.59 57.29 71.28 43.14 34.29 49.72 20.002008 45.74 61.35 31.35 59.75 74.07 45.64 37.59 53.75 23.97GROWTH RATE 2.7273 2.3662 4.3501 1.4080 1.2902 1.8937 3.1084 2.6354 6.22851981 21.66 34.23 7.05 33.07 46.55 17.38 17.76 30.02 3.521998 35.5 49.69 19.77 50.68 63.94 36.05 30.61 45.1 14.482001 38.73 53.07 23.72 54.65 67.62 41.00 33.70 48.46 18.582003 41.05 55.45 26.77 57.46 70.20 44.68 35.93 50.84 21.952005 43.51 57.93 30.23 60.42 72.87 48.68 38.30 53.33 25.922008 47.47 61.87 36.26 65.15 77.07 55.37 42.16 57.30 33.27GROWTH RATE 2.9489 2.2166 6.2532 2.5430 1.8847 4.3851 3.2540 2.4231 8.6753


