Literacy Trends in Pakistan - UNESCO Islamabad
Literacy Trends in Pakistan - UNESCO Islamabad Literacy Trends in Pakistan - UNESCO Islamabad
Part I – An Analysis of Literacy Trends in PakistanLiteracy Trends in PakistanTABLE OF CONTENTS1. Rationale, Need and Significance of Literacy2. Data Sources3. Expected Use4. Literacy defined in some other countries5. International Context of Definitions6. Changing Definitions of Literacy in Pakistan7. Functional Literacy8. Levels of Functional Literary and Programmes in a Global Perspective9. Literacy Scenario at the International level10. Literacy and Basic Education in Pakistan11. Current Literacy Situation in Pakistan12. Regions of Low and High Literacy Rate in Pakistan according to Census of 199813. Factors Affecting Literacy Rate in Pakistan13.1 Allocations for Education13.2 Public Expenditure on Primary Education13.3 Gender issues13.4 Participation Rate13.5 Lack of Institutional Infrastructure14 Literacy And Fertility-A Strong Correlation15. Dakar Framework for Action15.1 Six Goals of Dakar Framework for Action (2000)16. Literacy and National Plan of Action for EFA (2001-2015)17. United Nations Literacy Decade
List of Analytical Tables in Part-ITable – 1 Definitions of Literacy in Selected CountriesTable – 2 Definitions and Status of Literacy in Different Census Years of PakistanTable – 3 Comparison of Pakistan with other South Asian countries in respect of Literacy Rate and other related factors – Year 1998.Table – 4 Adult Literacy – Plan Allocations, Targets and StrategiesTable – 5 Adult Literacy – Policy, Targets and StrategiesTable – 6 Various Statistical Measures of Literacy in Pakistan in 1998 (age 10 + )Table – 7 Various Statistical Measures of Female Literacy in Pakistan in 1998 (age 10 + )Table – 8 Literacy Growth Rate Trends of Age 10 + – 1981-1998 (by Provinces)Table – 9 Measures of Variability for Rural Literacy in Pakistan – 1998Table – 10 Number of Districts in Various Literacy Regions – (1981-1998)Table – 11 Districts in Various Literacy Regions (Age 10 and above) in four Provinces of Pakistan during 1981 – 1998Table – 12 Public Expenditure on Primary and Basic Education in Pakistan.Table – 13 Allocations for Adult Literacy, Non-Formal and Mass Education in PakistanTable – 14 Participation Rate of School Going Children in Pakistan (by Provinces)Table – 15 Mean Fertility Rate Comparisons in Pakistan (by Provinces)List of Graphs in Part-I1. Line Graph - Growth of Literacy Rate in Pakistan.2. Bar Graph - Population of Literates/Illiterates in Pakistan (1972-1998)3. Line Graph - Literacy Rate – Male & Female4. Bar Graph - Literacy and Fertility – A Strong Co-relation (The Case of Sindh)
- Page 2 and 3: ContributorsDescription and Analysi
- Page 4 and 5: Literacy Trends in PakistanUNESCO O
- Page 8 and 9: Part II Statistical Tables (Based o
- Page 10 and 11: an education that includes learning
- Page 12 and 13: district. This information on liter
- Page 14 and 15: In the present day context, when pa
- Page 16 and 17: 7. FUNCTIONAL LITERACYThe definitio
- Page 18 and 19: Middle Level (Level II)A) TARGET GR
- Page 20 and 21: Table - 3Comparison of Pakistan wit
- Page 22 and 23: Previous attempts made for the enha
- Page 24 and 25: 11. CURRENT LITERACY SITUATION IN P
- Page 26 and 27: Graph No. 1Growth of Literacy Rate
- Page 28 and 29: Table 7 below indicates the highest
- Page 30 and 31: Table 8Literacy Growth Rate Trends
- Page 32 and 33: District has progressed from a very
- Page 34 and 35: Table 11Districts in Various Litera
- Page 36 and 37: 13.2 Public Expenditure on Primary
- Page 38 and 39: lowest female literacy rate in Paki
- Page 40 and 41: All this suggests that a considerab
- Page 42 and 43: Graph No.4LITERACY RATE DIRECTLY EF
- Page 44 and 45: 16. LITERACY AND NATIONAL PLAN OF A
- Page 46 and 47: 17.1 Why has it been established?Th
- Page 48 and 49: Table 16 - Focus Areas and Key Stra
- Page 50 and 51: 17.5 Resource MobilizationThe Liter
- Page 52 and 53: PART - IIStatistical Tables(Based o
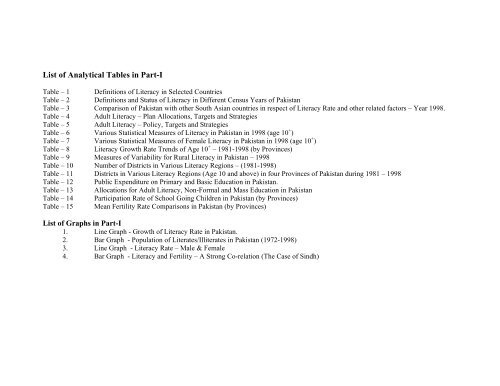
List of Analytical Tables <strong>in</strong> Part-ITable – 1 Def<strong>in</strong>itions of <strong>Literacy</strong> <strong>in</strong> Selected CountriesTable – 2 Def<strong>in</strong>itions and Status of <strong>Literacy</strong> <strong>in</strong> Different Census Years of <strong>Pakistan</strong>Table – 3 Comparison of <strong>Pakistan</strong> with other South Asian countries <strong>in</strong> respect of <strong>Literacy</strong> Rate and other related factors – Year 1998.Table – 4 Adult <strong>Literacy</strong> – Plan Allocations, Targets and StrategiesTable – 5 Adult <strong>Literacy</strong> – Policy, Targets and StrategiesTable – 6 Various Statistical Measures of <strong>Literacy</strong> <strong>in</strong> <strong>Pakistan</strong> <strong>in</strong> 1998 (age 10 + )Table – 7 Various Statistical Measures of Female <strong>Literacy</strong> <strong>in</strong> <strong>Pakistan</strong> <strong>in</strong> 1998 (age 10 + )Table – 8 <strong>Literacy</strong> Growth Rate <strong>Trends</strong> of Age 10 + – 1981-1998 (by Prov<strong>in</strong>ces)Table – 9 Measures of Variability for Rural <strong>Literacy</strong> <strong>in</strong> <strong>Pakistan</strong> – 1998Table – 10 Number of Districts <strong>in</strong> Various <strong>Literacy</strong> Regions – (1981-1998)Table – 11 Districts <strong>in</strong> Various <strong>Literacy</strong> Regions (Age 10 and above) <strong>in</strong> four Prov<strong>in</strong>ces of <strong>Pakistan</strong> dur<strong>in</strong>g 1981 – 1998Table – 12 Public Expenditure on Primary and Basic Education <strong>in</strong> <strong>Pakistan</strong>.Table – 13 Allocations for Adult <strong>Literacy</strong>, Non-Formal and Mass Education <strong>in</strong> <strong>Pakistan</strong>Table – 14 Participation Rate of School Go<strong>in</strong>g Children <strong>in</strong> <strong>Pakistan</strong> (by Prov<strong>in</strong>ces)Table – 15 Mean Fertility Rate Comparisons <strong>in</strong> <strong>Pakistan</strong> (by Prov<strong>in</strong>ces)List of Graphs <strong>in</strong> Part-I1. L<strong>in</strong>e Graph - Growth of <strong>Literacy</strong> Rate <strong>in</strong> <strong>Pakistan</strong>.2. Bar Graph - Population of Literates/Illiterates <strong>in</strong> <strong>Pakistan</strong> (1972-1998)3. L<strong>in</strong>e Graph - <strong>Literacy</strong> Rate – Male & Female4. Bar Graph - <strong>Literacy</strong> and Fertility – A Strong Co-relation (The Case of S<strong>in</strong>dh)


