Literacy Trends in Pakistan - UNESCO Islamabad
Literacy Trends in Pakistan - UNESCO Islamabad Literacy Trends in Pakistan - UNESCO Islamabad
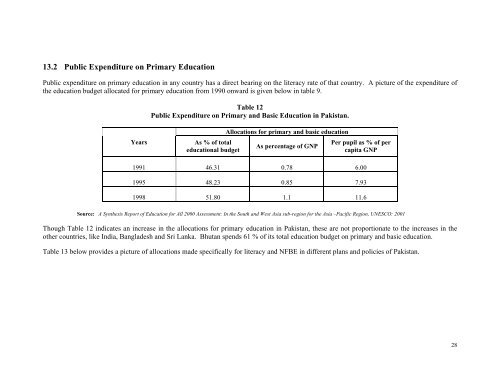
13.2 Public Expenditure on Primary EducationPublic expenditure on primary education in any country has a direct bearing on the literacy rate of that country. A picture of the expenditure ofthe education budget allocated for primary education from 1990 onward is given below in table 9.Table 12Public Expenditure on Primary and Basic Education in Pakistan.YearsAs % of totaleducational budgetAllocations for primary and basic educationAs percentage of GNPPer pupil as % of percapita GNP1991 46.31 0.78 6.001995 48.23 0.85 7.931998 51.80 1.1 11.6Source: A Synthesis Report of Education for All 2000 Assessment: In the South and West Asia sub-region for the Asia –Pacific Region, UNESCO: 2001Though Table 12 indicates an increase in the allocations for primary education in Pakistan, these are not proportionate to the increases in theother countries, like India, Bangladesh and Sri Lanka. Bhutan spends 61 % of its total education budget on primary and basic education.Table 13 below provides a picture of allocations made specifically for literacy and NFBE in different plans and policies of Pakistan.28
PlanTable 13Allocations for Adult Literacy, Non-Formal and Mass Education in PakistanTotal Allocations forEducational Sector(in Million Rs.)Allocations forLiteracy andMass Education(in Million Rs.)Literacy Allocationas Percentage oftotal Allocations forEducation SectorActualExpenditure(in Million Rs.)Percentage ofActualExpenditure toTotal LiteracyAllocations1 st . Plan to 5 th Plan (1955-83) 15,577.67 - - - -6 th Plan (1983-88) 18,830 750 4.0 % 724.00 96.53 % (0.038%)7 th Plan (1988-1993) 22,684.8 300 1.32 % 510.308 170.10 % (0.022%)8 th Plan (1993-98) 20,232.8 1750 8.6 % 409.164 23.34 % (0.02%)9 th Plan (1998-2003) 133,500 1000 0.74 % - -Source: National Education Policy (1998-2010), Govt. of Pakistan, Ministry of Education, Islamabad, P.134Note: Figures in parenthesis indicate the percentage of total allocation.Table 13 indicates that investment on adult literacy and mass education was not given serious consideration during the initial five 5 Years Planor upto 1983. In the 6 th Plan, the allocations for literacy and mass education were only 4.0 percent of the total allocation for the education sector.With such meagre funding a considerable rise in the literacy rate of the country cannot be expected. It was only in the 8 th Five Year Plan and theNational Education Policy of 1998-2010 in which literacy and mass education were seriously addressed and allocations increased for thispurpose. The 9 th five Year Plan has an allocation of Rs.1,000 million, which constitute less than one percent of the total education budget foreducation sector. But again it is uncertain that the entire amount allocated for literacy will actually be released or spent.13.3 Gender IssuesIn Pakistan, like most of the developing countries, the traditional ascription of feminine and masculine standards of behavior, division of laborand family responsibilities, have been the main barriers in achieving a female literacy rate equal to that of males. In the rural areas, the poorpeople send only their sons to school, and that too by making great personal sacrifice, but female children are kept without schooling. Thecountry has not been able to provide adequate opportunities for the girls to acquire education. This lack of providing adequate opportunity forfemale education is also reflected in the gender parity index in Pakistan which deteriorated from 54 per cent to 48 per cent between 1990 and1998 (Haque, 1998, p.5)*. As a result, the situation has not only hampered the overall process of national development, but has also adverselyaffected the management of the day-to-day affairs of women, like child-care/child rearing, economic participation and social mobility. The___________________________________________________________________________________________________________*Source: Human Development Report 1998, Mahbub-ul-Haq Human Development Center, Oxford University Press, Karachi.29
- Page 2 and 3: ContributorsDescription and Analysi
- Page 4 and 5: Literacy Trends in PakistanUNESCO O
- Page 6 and 7: Part I - An Analysis of Literacy Tr
- Page 8 and 9: Part II Statistical Tables (Based o
- Page 10 and 11: an education that includes learning
- Page 12 and 13: district. This information on liter
- Page 14 and 15: In the present day context, when pa
- Page 16 and 17: 7. FUNCTIONAL LITERACYThe definitio
- Page 18 and 19: Middle Level (Level II)A) TARGET GR
- Page 20 and 21: Table - 3Comparison of Pakistan wit
- Page 22 and 23: Previous attempts made for the enha
- Page 24 and 25: 11. CURRENT LITERACY SITUATION IN P
- Page 26 and 27: Graph No. 1Growth of Literacy Rate
- Page 28 and 29: Table 7 below indicates the highest
- Page 30 and 31: Table 8Literacy Growth Rate Trends
- Page 32 and 33: District has progressed from a very
- Page 34 and 35: Table 11Districts in Various Litera
- Page 38 and 39: lowest female literacy rate in Paki
- Page 40 and 41: All this suggests that a considerab
- Page 42 and 43: Graph No.4LITERACY RATE DIRECTLY EF
- Page 44 and 45: 16. LITERACY AND NATIONAL PLAN OF A
- Page 46 and 47: 17.1 Why has it been established?Th
- Page 48 and 49: Table 16 - Focus Areas and Key Stra
- Page 50 and 51: 17.5 Resource MobilizationThe Liter
- Page 52 and 53: PART - IIStatistical Tables(Based o
- Page 57: Table IILiteracy Rates (10 Years &
- Page 62: Growth RateYearsAll Areas Urban Rur
- Page 66 and 67: N.W.F.P.1972 15.50 23.10 4.701981 1
- Page 71 and 72: Table VLiteracy Rates (10 Years & a
- Page 74 and 75: Table VI-ADistrict-wise Rate (10 Ye
- Page 76 and 77: Province/DistrictBoth Male Female B
- Page 78 and 79: Province/DistrictBoth Male Female B
- Page 80 and 81: Province/DistrictBoth Male Female B
- Page 82 and 83: All Areas Urban RuralProvince/Distr
- Page 84 and 85: All Areas Urban RuralProvince/Distr
13.2 Public Expenditure on Primary EducationPublic expenditure on primary education <strong>in</strong> any country has a direct bear<strong>in</strong>g on the literacy rate of that country. A picture of the expenditure ofthe education budget allocated for primary education from 1990 onward is given below <strong>in</strong> table 9.Table 12Public Expenditure on Primary and Basic Education <strong>in</strong> <strong>Pakistan</strong>.YearsAs % of totaleducational budgetAllocations for primary and basic educationAs percentage of GNPPer pupil as % of percapita GNP1991 46.31 0.78 6.001995 48.23 0.85 7.931998 51.80 1.1 11.6Source: A Synthesis Report of Education for All 2000 Assessment: In the South and West Asia sub-region for the Asia –Pacific Region, <strong>UNESCO</strong>: 2001Though Table 12 <strong>in</strong>dicates an <strong>in</strong>crease <strong>in</strong> the allocations for primary education <strong>in</strong> <strong>Pakistan</strong>, these are not proportionate to the <strong>in</strong>creases <strong>in</strong> theother countries, like India, Bangladesh and Sri Lanka. Bhutan spends 61 % of its total education budget on primary and basic education.Table 13 below provides a picture of allocations made specifically for literacy and NFBE <strong>in</strong> different plans and policies of <strong>Pakistan</strong>.28


