Literacy Trends in Pakistan - UNESCO Islamabad
Literacy Trends in Pakistan - UNESCO Islamabad Literacy Trends in Pakistan - UNESCO Islamabad
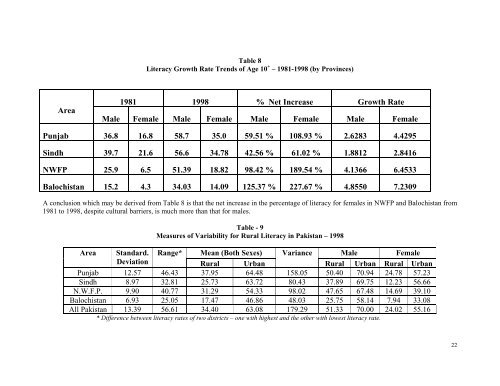
Table 8Literacy Growth Rate Trends of Age 10 + – 1981-1998 (by Provinces)Area1981 1998 % Net Increase Growth RateMale Female Male Female Male Female Male FemalePunjab 36.8 16.8 58.7 35.0 59.51 % 108.93 % 2.6283 4.4295Sindh 39.7 21.6 56.6 34.78 42.56 % 61.02 % 1.8812 2.8416NWFP 25.9 6.5 51.39 18.82 98.42 % 189.54 % 4.1366 6.4533Balochistan 15.2 4.3 34.03 14.09 125.37 % 227.67 % 4.8550 7.2309A conclusion which may be derived from Table 8 is that the net increase in the percentage of literacy for females in NWFP and Balochistan from1981 to 1998, despite cultural barriers, is much more than that for males.AreaStandard.DeviationTable - 9Measures of Variability for Rural Literacy in Pakistan – 1998Range* Mean (Both Sexes) Variance Male FemaleRural Urban Rural Urban Rural UrbanPunjab 12.57 46.43 37.95 64.48 158.05 50.40 70.94 24.78 57.23Sindh 8.97 32.81 25.73 63.72 80.43 37.89 69.75 12.23 56.66N.W.F.P. 9.90 40.77 31.29 54.33 98.02 47.65 67.48 14.69 39.10Balochistan 6.93 25.05 17.47 46.86 48.03 25.75 58.14 7.94 33.08All Pakistan 13.39 56.61 34.40 63.08 179.29 51.33 70.00 24.02 55.16* Difference between literacy rates of two districts – one with highest and the other with lowest literacy rate.22
A comparison between the urban and rural population of Pakistan and between males and females reveals that rural literacy (34.40 %) is lessthan that of urban literacy (63.08 %), and female literacy (31.58 %) is less than male illiteracy (54.43 %). But trends indicate that femaleliteracy has increased at a greater rate than male literacy during 1972-1998. Similarly the increase in literacy during the same period is alsobetter in rural areas than in urban areas. Rural literacy in 1981 was about one third of urban literacy. The gap between the two has slightlydecreased from 1972 to 1998.12. REGIONS OF LOW AND HIGH LITERACY RATE IN PAKISTAN ACCORDING TO CENSUS OF 1998On the basis of the data obtained from the Population Census Report (1998), an analysis of literacy for this profile has been carried out as pernational norms. As a first step the ‘Mean and Standard Deviations’ of the literacy rates were worked out which came out to be 43.92 and 13.98respectively. With the help of these two parameters, the country has been divided into the following four literacy regions as shown in the chartbelow:Region Literacy rate range Description of regionRegion of very low literacy Upto 29.96%One Standard Deviation (13.98) below the mean (43.92)(RVLL)(43.92 – 13.98 = 29.94)Region of low literacyBetween the value of an Standard Deviation (13.98) belowFrom 29.94% to 43.92%(RLL)upto MeanRegion of high literacy From 43.92% to 57.90%One Standard Deviation (13.98) above the Mean (43.92)(RHL)(43.92 + 13.98 = 57.90)Region of very high literacyMore than Mean (43.92) plus one Standard DeviationMore than 57.90(RVHL)(13.98)The analysis regarding the regions of low and high literacy based on 1981 and 1998 Censuses, alongwith a comparative situation of 1981 and1998, is given as under:Tables-10 and 11 indicate that only 3 districts of Punjab lie in the region of very low literacy rate and these are from the “Saraiki belt” ofSouthern Punjab. In Sindh, there are 6 districts, in NWFP 9 districts and almost the whole of Balochistan province (22 districts out of total 25)lies in this region. Only 04 districts of Punjab and 03 districts of Karachi in the Sindh Province fall into the category of the very high literacy rateregion. Districts of Gujranwala, Faisalabad, Jhelum and Gujrat in Punjab, which were in the region of low literacy rate in 1981 have progressedconsiderably and have jumped to the region of high literacy rate in 1998. The same is the case with Shikarpur and Larkana in Sindh, Malakand,Peshawar Mansehra, D.I.Khan, Bannu, Kohat, Hangu, Chitral, and Mardan in NWFP. However in the Province of Balochistan only Panjgur23
- Page 2 and 3: ContributorsDescription and Analysi
- Page 4 and 5: Literacy Trends in PakistanUNESCO O
- Page 6 and 7: Part I - An Analysis of Literacy Tr
- Page 8 and 9: Part II Statistical Tables (Based o
- Page 10 and 11: an education that includes learning
- Page 12 and 13: district. This information on liter
- Page 14 and 15: In the present day context, when pa
- Page 16 and 17: 7. FUNCTIONAL LITERACYThe definitio
- Page 18 and 19: Middle Level (Level II)A) TARGET GR
- Page 20 and 21: Table - 3Comparison of Pakistan wit
- Page 22 and 23: Previous attempts made for the enha
- Page 24 and 25: 11. CURRENT LITERACY SITUATION IN P
- Page 26 and 27: Graph No. 1Growth of Literacy Rate
- Page 28 and 29: Table 7 below indicates the highest
- Page 32 and 33: District has progressed from a very
- Page 34 and 35: Table 11Districts in Various Litera
- Page 36 and 37: 13.2 Public Expenditure on Primary
- Page 38 and 39: lowest female literacy rate in Paki
- Page 40 and 41: All this suggests that a considerab
- Page 42 and 43: Graph No.4LITERACY RATE DIRECTLY EF
- Page 44 and 45: 16. LITERACY AND NATIONAL PLAN OF A
- Page 46 and 47: 17.1 Why has it been established?Th
- Page 48 and 49: Table 16 - Focus Areas and Key Stra
- Page 50 and 51: 17.5 Resource MobilizationThe Liter
- Page 52 and 53: PART - IIStatistical Tables(Based o
- Page 57: Table IILiteracy Rates (10 Years &
- Page 62: Growth RateYearsAll Areas Urban Rur
- Page 66 and 67: N.W.F.P.1972 15.50 23.10 4.701981 1
- Page 71 and 72: Table VLiteracy Rates (10 Years & a
- Page 74 and 75: Table VI-ADistrict-wise Rate (10 Ye
- Page 76 and 77: Province/DistrictBoth Male Female B
- Page 78 and 79: Province/DistrictBoth Male Female B
Table 8<strong>Literacy</strong> Growth Rate <strong>Trends</strong> of Age 10 + – 1981-1998 (by Prov<strong>in</strong>ces)Area1981 1998 % Net Increase Growth RateMale Female Male Female Male Female Male FemalePunjab 36.8 16.8 58.7 35.0 59.51 % 108.93 % 2.6283 4.4295S<strong>in</strong>dh 39.7 21.6 56.6 34.78 42.56 % 61.02 % 1.8812 2.8416NWFP 25.9 6.5 51.39 18.82 98.42 % 189.54 % 4.1366 6.4533Balochistan 15.2 4.3 34.03 14.09 125.37 % 227.67 % 4.8550 7.2309A conclusion which may be derived from Table 8 is that the net <strong>in</strong>crease <strong>in</strong> the percentage of literacy for females <strong>in</strong> NWFP and Balochistan from1981 to 1998, despite cultural barriers, is much more than that for males.AreaStandard.DeviationTable - 9Measures of Variability for Rural <strong>Literacy</strong> <strong>in</strong> <strong>Pakistan</strong> – 1998Range* Mean (Both Sexes) Variance Male FemaleRural Urban Rural Urban Rural UrbanPunjab 12.57 46.43 37.95 64.48 158.05 50.40 70.94 24.78 57.23S<strong>in</strong>dh 8.97 32.81 25.73 63.72 80.43 37.89 69.75 12.23 56.66N.W.F.P. 9.90 40.77 31.29 54.33 98.02 47.65 67.48 14.69 39.10Balochistan 6.93 25.05 17.47 46.86 48.03 25.75 58.14 7.94 33.08All <strong>Pakistan</strong> 13.39 56.61 34.40 63.08 179.29 51.33 70.00 24.02 55.16* Difference between literacy rates of two districts – one with highest and the other with lowest literacy rate.22


