Literacy Trends in Pakistan - UNESCO Islamabad
Literacy Trends in Pakistan - UNESCO Islamabad Literacy Trends in Pakistan - UNESCO Islamabad
Table X-ADistrict-wise Participation Rates of School going Children (5-9 Years)by Sex, Urban and Rural1998I PunjabI(Participation Rates in Percentages)Province/Districtl All Areas Urban RuralAge Group Both Sexes Male Female Both Sexes Male Female Both Sexes Male FemalePUD.jab48.20 52.28 43.83 62.95 64.95 60.81 44.28 48.93 39.29Attock 51.77 57.78 45.43 64.6 67.31 61.7 48.51 55.34 41.325-9Rawalpindi74.55 76.74 72.24 82.17 84.11 80.1 66.59 68.92 64.185-9Jhelum 73.44 75.85 70.86 76.99 78.96 74.9 72.25 74.82 69.515-9Chakwal 60.61 62.9 58.2 73.09 74.84 71.24 58.97 61.33 56.495-9Sargodha53.2 57.11 48.99 62.99 65.35 60.45 49.58 54.06 44.735-9Bhakkar 37.05 43.07 30.48 57.69 60.42 54.75 33.26 39.9 25.995-9Khushab 46.56 53.72 38.94 60.97 65.43 56.23 41.76 49.82 33.165-9
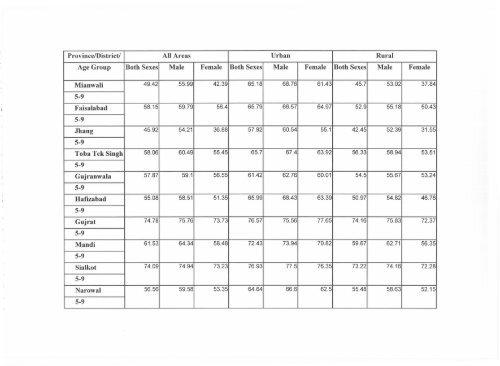
Province/District/ All Areas Urban RuralAge Group Both Sexes Male Female Both Sexes Male Female Both Sexes Male FemaleMianwali 49.42 55.99 42.39 65.18 68.76 61.43 45.7 53.02 37.845-9Faisalabad 58.15 59.79 56.4 65.79 66.57 64.97 52.9 55.18 50.435-9Jhang5-9Toba Tek Singh5-9Gujranwala5-945.92 54.21 36.88 57.92 60.54 55.1 42.45 52.39 31.5558.06 60.49 55.45 65.7 67.4 63.92 56.33 58.94 53.5157.87 59.1 56.55 61.42 62.76 60.01 54.5 55.67 53.24HafIzabad 55.08 58.51 51.35 65.99 68.43 63.39 50.97 54.82 46.765-9Gujrat74.78 75.76 73.73 76.57 75.56 77.65 74.16 75.83 72.375-9Mandi 61.53 64.34 58.48 72.43 73.94 70.82 59.67 62.71 56.355-9Sialkot 74.09 74.94 73.23 76.93 77.5 76.35 73.22 74.16 72.285-9Narowal 56.56 59.58 53.35 64.64 66.6 62.5 55.48 58.63 52.155-9
- Page 98 and 99: All AreasUrbanRuralProvince/Distric
- Page 100 and 101: All Areas Urban RuralProvince/Distr
- Page 102 and 103: All Areas Urban RuralProvince/Distr
- Page 105 and 106: Table VII-CDistrict-wise Rate of Li
- Page 107 and 108: All Areas Urban RuralProvince/Distr
- Page 109 and 110: Table VII-BDistrict-wise Rate of Li
- Page 111 and 112: All Areas Urban RuralProvince/Distr
- Page 113 and 114: IlliterateLiterate Matric & above D
- Page 115 and 116: Illiterate Literate Matric & above
- Page 117 and 118: Table VIII-BLinkage between Literac
- Page 119 and 120: IlliterateLiterate Matric & above D
- Page 121 and 122: IlliterateLiterate Matric & above D
- Page 123 and 124: Illiterate Literate Matric & above
- Page 125 and 126: Table VIII-DLinkage between Literac
- Page 127 and 128: IlliterateLiterate Matric & above D
- Page 129 and 130: Table IX-ADistrict-wise Participati
- Page 131 and 132: Province/District/ Population Schoo
- Page 133 and 134: Province/District/ Population Schoo
- Page 135 and 136: Province/District/ Population Schoo
- Page 137 and 138: Table IX-DDistrict-wise i i Partici
- Page 139 and 140: Table X-CDistrict-wise Participatio
- Page 141 and 142: Province/District/ All Areas Urban
- Page 143 and 144: Province/District/ All Areas Urban
- Page 145 and 146: Table X-DDistrict-wise Participatio
- Page 147: ProvincelDistrictl All Areas Urban
- Page 151 and 152: ProvincelDistrictl All Areas Urban
- Page 153 and 154: BIBLIOGRAPHYAdam Curle. Planning fo
- Page 155: Formulae used for Calculating the G
Prov<strong>in</strong>ce/District/ All Areas Urban RuralAge Group Both Sexes Male Female Both Sexes Male Female Both Sexes Male FemaleMianwali 49.42 55.99 42.39 65.18 68.76 61.43 45.7 53.02 37.845-9Faisalabad 58.15 59.79 56.4 65.79 66.57 64.97 52.9 55.18 50.435-9Jhang5-9Toba Tek S<strong>in</strong>gh5-9Gujranwala5-945.92 54.21 36.88 57.92 60.54 55.1 42.45 52.39 31.5558.06 60.49 55.45 65.7 67.4 63.92 56.33 58.94 53.5157.87 59.1 56.55 61.42 62.76 60.01 54.5 55.67 53.24HafIzabad 55.08 58.51 51.35 65.99 68.43 63.39 50.97 54.82 46.765-9Gujrat74.78 75.76 73.73 76.57 75.56 77.65 74.16 75.83 72.375-9Mandi 61.53 64.34 58.48 72.43 73.94 70.82 59.67 62.71 56.355-9Sialkot 74.09 74.94 73.23 76.93 77.5 76.35 73.22 74.16 72.285-9Narowal 56.56 59.58 53.35 64.64 66.6 62.5 55.48 58.63 52.155-9


