Literacy Trends in Pakistan - UNESCO Islamabad
Literacy Trends in Pakistan - UNESCO Islamabad
Literacy Trends in Pakistan - UNESCO Islamabad

Create successful ePaper yourself
Turn your PDF publications into a flip-book with our unique Google optimized e-Paper software.
ContributorsDescription and AnalysisProf. Dr. Zafar IqbalReview and ImprovementDr. Anjum Riyazul HaqueMr. Hassan Abdi KeynanDr. Iffat FarahDr. Eshya Mujahid MukhtarDr. S. M. AijazDr. Hamid Khan NiaziTabulation and ProjectionsMr. Saeed AhmedMr. Fakhar-ud-D<strong>in</strong>Coord<strong>in</strong>ationMr. Arshad Saeed KhanThe authors are responsible for the choice, presentation and <strong>in</strong>terpretation of data and <strong>in</strong>formation <strong>in</strong> this report, andfor the op<strong>in</strong>ions expressed there<strong>in</strong>, which are not necessarily those of <strong>UNESCO</strong>.1 st Pr<strong>in</strong>ted – March 2002, Repr<strong>in</strong>ted – August 2002, Revised Edition – May 2003
PREFACE<strong>Pakistan</strong> is one of the countries of the world where the highest number of illiterates are concentrated. Be<strong>in</strong>g illiterate is not an <strong>in</strong>dividualdisability alone, it has societal implications as well. Democratic <strong>in</strong>stitutions and values can hardly flourish <strong>in</strong> a society where half of the adultpopulation is illiterate, and most of the voters cannot access <strong>in</strong>formation and read a newspaper. The situation is particularly alarm<strong>in</strong>g for womenand those liv<strong>in</strong>g <strong>in</strong> rural areas. Illiteracy not only causes dependence, it deprives people of the development of their fullest potential ofparticipation <strong>in</strong> decision mak<strong>in</strong>g at different levels, and ultimately rises to breed oppression and exploitation. S<strong>in</strong>ce its <strong>in</strong>ception, thegovernments <strong>in</strong> <strong>Pakistan</strong> have been endeavour<strong>in</strong>g to eradicate illiteracy from the country. Although the overall literacy rate <strong>in</strong> the country has<strong>in</strong>creased gradually, the absolute number of illiterates has swelled significantly from 20.25 million <strong>in</strong> 1951 to 48.8 million <strong>in</strong> 1998. The<strong>in</strong>clusion of an adult literacy component <strong>in</strong> the Education Sector Reforms – ESR (2001-2005) and <strong>in</strong> the National Plan of Action (NPA) for EFA(2001-2015) are very important steps by the M<strong>in</strong>istry of Education, which deserve the support both of the public at large and the <strong>in</strong>ternationalcommunity.Eradication of illiteracy from the world is an important agenda of <strong>UNESCO</strong>, and one of the six goals of Dakar Framework of Action onEducation For All (EFA). The present publication is part of <strong>UNESCO</strong>’s <strong>in</strong>itiatives to raise awareness about the literacy situation <strong>in</strong> <strong>Pakistan</strong>.The document is a repository of historical data on literacy, and a unique source of district level statistics on literacy, fertility, and participationrates. It compares the literacy and basic education profile of <strong>Pakistan</strong> with other countries of Asia, and also presents an analytical picture of thegrowth of literacy <strong>in</strong> various developed and less-developed districts of the four prov<strong>in</strong>ces of <strong>Pakistan</strong>. Historical data, comparative view, districtlevel statistics and analysis of trends given <strong>in</strong> this book can offer both quantitative <strong>in</strong>formation and qualitative guidance to the policy makers andplanners for design<strong>in</strong>g corrective measures.A jo<strong>in</strong>t team of educators and researchers from <strong>Pakistan</strong>, alongwith <strong>UNESCO</strong> experts, have conceived, designed and compiled thisdocument. I particularly acknowledge the academic contribution of Prof. Dr. Zafar Iqbal for the analysis, and technical support from Mr. SaeedAhmed and Mr. Fakhar-ud-d<strong>in</strong> for computerization of census data and projections. I also acknowledge the valuable comments and <strong>in</strong>puts fromDr. Anjum Riyazul Haque, Mr. Arshad Saeed Khan, Dr. Iffat Farah, Dr. Eshya Mujahid Mukhtar, Dr. S. M. Aijaz, and Dr. Hamid Khan Niazi,which helped a lot <strong>in</strong> improv<strong>in</strong>g the quality of this publication.The first edition of this document was published <strong>in</strong> March 2002. This is a revised edition based on updated statistics of the 1998 Census.It is be<strong>in</strong>g brought out <strong>in</strong> the context of the launch<strong>in</strong>g of United Nations <strong>Literacy</strong> Decade (2003-2012) on 13 th February, 2003. We hope thissource book will contribute <strong>in</strong> rais<strong>in</strong>g awareness for the importance of literacy, and help mobilize <strong>in</strong>itiatives for achievement of the UNLDtargets <strong>in</strong> <strong>Pakistan</strong>. <strong>UNESCO</strong> <strong>Islamabad</strong> looks forward to a strengthened cooperation with different national and <strong>in</strong>ternational partners for theachievement of the def<strong>in</strong>ed literacy goals <strong>in</strong> <strong>Pakistan</strong>.20 May, 2003 Ms. Ingeborg Bre<strong>in</strong>esRepresentative<strong>UNESCO</strong> <strong>Islamabad</strong>
<strong>Literacy</strong> <strong>Trends</strong> <strong>in</strong> <strong>Pakistan</strong><strong>UNESCO</strong> Office, <strong>Islamabad</strong>May, 2003
PART – IAN ANALYSIS OF LITERACY TRENDS INPAKISTAN
Part I – An Analysis of <strong>Literacy</strong> <strong>Trends</strong> <strong>in</strong> <strong>Pakistan</strong><strong>Literacy</strong> <strong>Trends</strong> <strong>in</strong> <strong>Pakistan</strong>TABLE OF CONTENTS1. Rationale, Need and Significance of <strong>Literacy</strong>2. Data Sources3. Expected Use4. <strong>Literacy</strong> def<strong>in</strong>ed <strong>in</strong> some other countries5. International Context of Def<strong>in</strong>itions6. Chang<strong>in</strong>g Def<strong>in</strong>itions of <strong>Literacy</strong> <strong>in</strong> <strong>Pakistan</strong>7. Functional <strong>Literacy</strong>8. Levels of Functional Literary and Programmes <strong>in</strong> a Global Perspective9. <strong>Literacy</strong> Scenario at the International level10. <strong>Literacy</strong> and Basic Education <strong>in</strong> <strong>Pakistan</strong>11. Current <strong>Literacy</strong> Situation <strong>in</strong> <strong>Pakistan</strong>12. Regions of Low and High <strong>Literacy</strong> Rate <strong>in</strong> <strong>Pakistan</strong> accord<strong>in</strong>g to Census of 199813. Factors Affect<strong>in</strong>g <strong>Literacy</strong> Rate <strong>in</strong> <strong>Pakistan</strong>13.1 Allocations for Education13.2 Public Expenditure on Primary Education13.3 Gender issues13.4 Participation Rate13.5 Lack of Institutional Infrastructure14 <strong>Literacy</strong> And Fertility-A Strong Correlation15. Dakar Framework for Action15.1 Six Goals of Dakar Framework for Action (2000)16. <strong>Literacy</strong> and National Plan of Action for EFA (2001-2015)17. United Nations <strong>Literacy</strong> Decade
List of Analytical Tables <strong>in</strong> Part-ITable – 1 Def<strong>in</strong>itions of <strong>Literacy</strong> <strong>in</strong> Selected CountriesTable – 2 Def<strong>in</strong>itions and Status of <strong>Literacy</strong> <strong>in</strong> Different Census Years of <strong>Pakistan</strong>Table – 3 Comparison of <strong>Pakistan</strong> with other South Asian countries <strong>in</strong> respect of <strong>Literacy</strong> Rate and other related factors – Year 1998.Table – 4 Adult <strong>Literacy</strong> – Plan Allocations, Targets and StrategiesTable – 5 Adult <strong>Literacy</strong> – Policy, Targets and StrategiesTable – 6 Various Statistical Measures of <strong>Literacy</strong> <strong>in</strong> <strong>Pakistan</strong> <strong>in</strong> 1998 (age 10 + )Table – 7 Various Statistical Measures of Female <strong>Literacy</strong> <strong>in</strong> <strong>Pakistan</strong> <strong>in</strong> 1998 (age 10 + )Table – 8 <strong>Literacy</strong> Growth Rate <strong>Trends</strong> of Age 10 + – 1981-1998 (by Prov<strong>in</strong>ces)Table – 9 Measures of Variability for Rural <strong>Literacy</strong> <strong>in</strong> <strong>Pakistan</strong> – 1998Table – 10 Number of Districts <strong>in</strong> Various <strong>Literacy</strong> Regions – (1981-1998)Table – 11 Districts <strong>in</strong> Various <strong>Literacy</strong> Regions (Age 10 and above) <strong>in</strong> four Prov<strong>in</strong>ces of <strong>Pakistan</strong> dur<strong>in</strong>g 1981 – 1998Table – 12 Public Expenditure on Primary and Basic Education <strong>in</strong> <strong>Pakistan</strong>.Table – 13 Allocations for Adult <strong>Literacy</strong>, Non-Formal and Mass Education <strong>in</strong> <strong>Pakistan</strong>Table – 14 Participation Rate of School Go<strong>in</strong>g Children <strong>in</strong> <strong>Pakistan</strong> (by Prov<strong>in</strong>ces)Table – 15 Mean Fertility Rate Comparisons <strong>in</strong> <strong>Pakistan</strong> (by Prov<strong>in</strong>ces)List of Graphs <strong>in</strong> Part-I1. L<strong>in</strong>e Graph - Growth of <strong>Literacy</strong> Rate <strong>in</strong> <strong>Pakistan</strong>.2. Bar Graph - Population of Literates/Illiterates <strong>in</strong> <strong>Pakistan</strong> (1972-1998)3. L<strong>in</strong>e Graph - <strong>Literacy</strong> Rate – Male & Female4. Bar Graph - <strong>Literacy</strong> and Fertility – A Strong Co-relation (The Case of S<strong>in</strong>dh)
Part II Statistical Tables (Based on 1998 Census Data and Projections)Table-I <strong>Literacy</strong> Rates (10 Years & above) of <strong>Pakistan</strong> by Sex – 1972, 1981, 1998, 2001, 2003, 2005 and 2008Table-II <strong>Literacy</strong> Rates (10 Years & above) of <strong>Pakistan</strong> by Urban and Rural Areas – 1972, 1981, 1998, 2001, 2003, 2005 and 2008Table-III <strong>Literacy</strong> Rates (10 Years & above) by Sex & Urban and Rural Areas of <strong>Pakistan</strong> – 1972, 1981, 1998, 2001, 2003, 2005 and 2008Table-IV <strong>Literacy</strong> Rates (10 Years & above) of <strong>Pakistan</strong> by Sex and Prov<strong>in</strong>ce – 1972, 1981, 1998, 2001, 2003, 2005 and 2008Table-V <strong>Literacy</strong> Rates (10 Years & above) of <strong>Pakistan</strong> by Urban, Rural, Sex, and Prov<strong>in</strong>ce – 1981,1998, 2001, 2003, 2005 & 2008.Table-VI-A District-wise Rate (10 Years and above) of <strong>Literacy</strong> by Sex & Urban and Rural Areas of Punjab.Table-VI-B District-wise Rate (10 Years and above) of <strong>Literacy</strong> by Sex & Urban and Rural Areas of S<strong>in</strong>dh.Table-VI-C District-wise Rate (10 Years and above) of <strong>Literacy</strong> by Sex & Urban and Rural Areas of NWFP.Table-VI-D District-wise Rate (10 Years and above) of <strong>Literacy</strong> by Sex & Urban and Rural Areas of Balochistan.Table-VII-A District-wise Rate of <strong>Literacy</strong> by Sex & Urban and Rural Areas of Punjab, 1998.Table-VII-B District-wise Rate of <strong>Literacy</strong> by Sex & Urban and Rural Areas of S<strong>in</strong>dh, 1998.Table-VII-C District-wise Rate of <strong>Literacy</strong> by Sex & Urban and Rural Areas of NWFP, 1998.Table-VII-D District-wise Rate of <strong>Literacy</strong> by Sex & Urban and Rural Areas of Balochistan, 1998.Table-VII-E <strong>Literacy</strong> Rate by Sex & Urban and Rural Areas of <strong>Islamabad</strong>, 1998.Table-VIII-A L<strong>in</strong>kage between <strong>Literacy</strong> and Fertility – Prov<strong>in</strong>ce-wise and District-wise Rates of <strong>Literacy</strong> and Fertility, Punjab, 1998.Table-VIII-B L<strong>in</strong>kage between <strong>Literacy</strong> and Fertility – Prov<strong>in</strong>ce-wise and District-wise Rates of <strong>Literacy</strong> and Fertility, S<strong>in</strong>dh, 1998.Table-VIII-C L<strong>in</strong>kage between <strong>Literacy</strong> and Fertility – Prov<strong>in</strong>ce-wise and District-wise Rates of <strong>Literacy</strong> and Fertility, NWFP, 1998.Table-VIII-D L<strong>in</strong>kage between <strong>Literacy</strong> and Fertility – Prov<strong>in</strong>ce-wise and District-wise Rates of <strong>Literacy</strong> and Fertility, Balochistan, 1998.Table-VIII-E Fertility Rates of <strong>Islamabad</strong>, 1998.Table-IX-A District-wise Participation Rates of School Go<strong>in</strong>g Children (5-9 years) Punjab, 1998.Table-IX-B District-wise Participation Rates of School Go<strong>in</strong>g Children (5-9 years) S<strong>in</strong>dh, 1998.Table-IX-C District-wise Participation Rates of School Go<strong>in</strong>g Children (5-9 years) NWFP, 1998.Table-IX-D District-wise Participation Rates of School Go<strong>in</strong>g Children (5-9 years) Balochistan, 1998.Table-IX-E Participation Rates of School Go<strong>in</strong>g Children (5-9 years) <strong>Islamabad</strong>, 1998.Table-X-A District-wise Participation Rates of School Go<strong>in</strong>g Children (5-9 years) by Sex, Urban and Rural, Punjab, 1998.Table-X-B District-wise Participation Rates of School Go<strong>in</strong>g Children (5-9 years) by Sex, Urban and Rural, S<strong>in</strong>dh, 1998.Table-X-C District-wise Participation Rates of School Go<strong>in</strong>g Children (5-9 years) by Sex, Urban and Rural, NWFP, 1998.Table-X-D District-wise Participation Rates of School Go<strong>in</strong>g Children (5-9 years) by Sex, Urban and Rural, Balochistan, 1998.Table-X-E Participation Rates of School Go<strong>in</strong>g Children (5-9 years) by Sex, Urban and Rural, <strong>Islamabad</strong>, 1998.BibliographyAnnexure-1 Formulae used for Calculat<strong>in</strong>g the Growth Rate and Projections
1. RATIONALE, NEED AND SIGNIFICANCE<strong>Literacy</strong> <strong>Trends</strong> <strong>in</strong> <strong>Pakistan</strong>Education is the vehicle for human resource development and literacy is the pre-requisite to consult and benefit from major sources of<strong>in</strong>formation and knowledge <strong>in</strong> today’s world. Illiteracy and lack of knowledge of basic mathematics may not be responsible for lowquality of life for all, but they are def<strong>in</strong>itely a crucial part of <strong>in</strong>dividual development and social participation. Without education andliteracy, it is not possible to realize the goals of a balanced and susta<strong>in</strong>able development. Adam Curle observed “countries are under-developedbecause most of their people are under-developed, hav<strong>in</strong>g had no opportunity of expand<strong>in</strong>g their potential capacities <strong>in</strong> the service of society”. Indevelop<strong>in</strong>g countries, population growth, poverty, health and social problems consequently retard the pace of literacy. <strong>Literacy</strong> is considered apre-requisite for access to vast sources of knowledge <strong>in</strong> the present world. It provides build<strong>in</strong>g blocks for communication and understand<strong>in</strong>gbetween <strong>in</strong>dividuals, groups and nations.<strong>Literacy</strong> is considered as a key for susta<strong>in</strong>able development and peace. It is also an <strong>in</strong>strument of stability with<strong>in</strong> and among countries, and thusmay prove an <strong>in</strong>dispensable means of effective participation <strong>in</strong> the societies and the economies of the 21 st century, which are affected by therapid globalization. While science and technology have opened new avenues of life, illiterates and poor people still cannot fully realize theprogress of modern life because of their illiteracy and poverty. This is due to the fact that <strong>in</strong> modern life, communication is ma<strong>in</strong>ly throughsymbols, numbers, alphabets and signs which can be used effectively only by the literate persons. In today’s world, an illiterate will certa<strong>in</strong>lybe aware of his under-development and dependence, and his <strong>in</strong>ability to <strong>in</strong>dependently <strong>in</strong>teract with various sources of knowledge, or share thebenefits and progress of modern life. Mr. Koichiro Matsuura, Director General <strong>UNESCO</strong>, very rightly highlighted the impact of literacy <strong>in</strong>follow<strong>in</strong>g words:-“Given the pleasures and benefits that it br<strong>in</strong>gs, it is not surpris<strong>in</strong>g that the typical imagery of literacy is of open<strong>in</strong>g doors orw<strong>in</strong>dows, of light and space, of boundlessness. <strong>Literacy</strong> is <strong>in</strong>separable from opportunity, and opportunity is <strong>in</strong>separable fromfreedom. The freedom promised by literacy is both freedom from – from ignorance, oppression, poverty – and freedom to – to donew th<strong>in</strong>gs, to make choices, to learn.”(Mr. Koichiro Matsuura, Director General, <strong>UNESCO</strong> – Message on International <strong>Literacy</strong> Day, 8 th September, 2001)Article –3 of the Framework of Action adopted by the World Education Forum <strong>in</strong> Dakar, Senegal (26-28 April 2000) reaffirms the vision of theWorld Declaration on Education For All <strong>in</strong> Jomtien (1990) and the Universal Declaration of Human Rights that all children, young people andadults have the right to benefit from education as human be<strong>in</strong>gs, that will meet their basic learn<strong>in</strong>g needs <strong>in</strong> the best and fullest sense of the term,1
an education that <strong>in</strong>cludes learn<strong>in</strong>g to know, learn<strong>in</strong>g to do, learn<strong>in</strong>g to live together and learn<strong>in</strong>g to be. It is only through education that an<strong>in</strong>dividual’s potential and talent can be used to transform society, accord<strong>in</strong>g to the needs and chang<strong>in</strong>g circumstances.“Achiev<strong>in</strong>g EFA goals should be postponed no longer. The basic learn<strong>in</strong>g needs of all must be met as a matter of urgency”.In Dakar, the participants committed for achiev<strong>in</strong>g 50% improvement <strong>in</strong> levels of adult literacy by the year 2015, especially for women andensur<strong>in</strong>g that by the year 2015, all children particularly girls and those belong<strong>in</strong>g to ethnic m<strong>in</strong>orities have access to complete free, andcompulsory primary education of good quality.Mass literacy and basic education is considered a pre-requisite for socio-economic development worldwide. In <strong>Pakistan</strong>, every effort has beenmade for the quantitative expansion of formal school education with the assumption that it will contribute to enhance the literacy rate. Thisassumption has not held true dur<strong>in</strong>g the last five decades and the country is still far away from universal mass literacy.The ma<strong>in</strong> purpose of this document on literacy trends and statistics <strong>in</strong> <strong>Pakistan</strong> is to present a precise, brief and overall picture of the literacysituation <strong>in</strong> the country and to provide <strong>in</strong>formation on the literacy situation <strong>in</strong> various districts / prov<strong>in</strong>ces <strong>in</strong> <strong>Pakistan</strong>, and discuss the majorcauses for low literacy rates <strong>in</strong> certa<strong>in</strong> areas, as compared to other regions reflect<strong>in</strong>g higher levels of literacy. This document also presents ananalysis and forecast of trends of different parameters of literacy statistics upto 2008.2. DATA SOURCESThe results of the 1998 Census are the major source for the statistical part of this publication. In addition, the follow<strong>in</strong>g sources have also beenutilized for the purposes of data collection and analysis for this profile.1. Population Census Organization, Govt. of <strong>Pakistan</strong>, Statistics Division, Census Reports of 1998, <strong>Islamabad</strong>. May 2000 (105District Census Reports - DCRs)2. Population Census Organization, Govt. of <strong>Pakistan</strong>, Statistics Division, Census Reports of 1981, <strong>Islamabad</strong>. May 1984 (62District Census Reports - DCRs)3. <strong>Literacy</strong> and Mass Education Commission, <strong>Literacy</strong> Profile of <strong>Pakistan</strong> 1951-1981, Govt. of <strong>Pakistan</strong>, <strong>Islamabad</strong>, February, 19844. World Population Data Sheet 2000, Population Reference Bureau, Wash<strong>in</strong>gton, D.C, June 2000.5. <strong>Pakistan</strong> School Education Statistics 1997-1998, Academy of Educational Plann<strong>in</strong>g and Management, M<strong>in</strong>istry of Education,Govt. of <strong>Pakistan</strong>, November, 1999.2
6. Human Development Report,2002, UNDP, Oxford University Press, New York.7. N<strong>in</strong>th Five Year Plan (1998-2003), Report of the Work<strong>in</strong>g Group on Education, Govt. of <strong>Pakistan</strong>, Plann<strong>in</strong>g Commission<strong>Islamabad</strong>, February 1999.8. National Education Policy 1992-2002 Government of <strong>Pakistan</strong>, M<strong>in</strong>istry of Education, <strong>Islamabad</strong>.9. The Dakar Framework for Action, Education for All: Meet<strong>in</strong>g our Collective Commitments, World Education Forum, Dakar,Senegal, 26-28 April 2000.10. National Education Policy 1998-2010, Govt. of <strong>Pakistan</strong>, M<strong>in</strong>istry of Education, <strong>Islamabad</strong>, 1998.11. Five Year Developmental Plans, Government of <strong>Pakistan</strong>, Plann<strong>in</strong>g Commission of <strong>Pakistan</strong>, <strong>Islamabad</strong>.12. World Education Statistics, <strong>UNESCO</strong> 1998.13. Education for All 2000. Assessment: A Synthesis Report, <strong>UNESCO</strong>- PROAP, March 200014. Govt. of <strong>Pakistan</strong>, Education Sector Reforms (ESR), M<strong>in</strong>istry of Education, <strong>Islamabad</strong>, May 2001.15. National Action Plan: Our Roadmap to EFA, <strong>UNESCO</strong> & EFA W<strong>in</strong>g, Federal M<strong>in</strong>istry of Education, Govt. of <strong>Pakistan</strong>.16. Human Development <strong>in</strong> South Asia 2002, Mahbub-ul-Haq Human Development Center, Oxford University Press, Karachi.17. Report of the Secretary General, United Nations <strong>Literacy</strong> Decade: Education For All; International Plan of Action;Implementation of General Assembly Resolution 56/11618. Second Draft, National Plan of Action on Education For All (2001-2015) <strong>Pakistan</strong>, Govt. of <strong>Pakistan</strong>, M<strong>in</strong>istry of Education,<strong>Islamabad</strong>, August 2002.Projections have been made to estimate literacy rates for 2001, 2003, 2005 and 2008 on the basis of growth rate trends observed dur<strong>in</strong>g 1981-98.3. EXPECTED USEIt is difficult to f<strong>in</strong>d composite and comprehensive literacy data for <strong>Pakistan</strong> <strong>in</strong> a consolidated form, or <strong>in</strong> the form of a database. TheCensus Reports are the major source of literacy statistics <strong>in</strong> the country. However, district reports are usually not easily accessible and literacyfigures are not found <strong>in</strong> a s<strong>in</strong>gle document. National and prov<strong>in</strong>cial level statistics are available <strong>in</strong> national and prov<strong>in</strong>cial reports; but all the 125District Census Reports have to be consulted <strong>in</strong>dividually to obta<strong>in</strong> literacy <strong>in</strong>formation for <strong>in</strong>ter-district comparison, or for analysis of regionaldisparities. The current publication, the first of its k<strong>in</strong>d s<strong>in</strong>ce 1983, not only provides district-wise and gender-wise <strong>in</strong>formation on recent (1998)literacy rates, but also presents statistics on past trends as well. Added values are the estimates for primary level participation rates <strong>in</strong> each3
district. This <strong>in</strong>formation on literacy and participation rate will be useful for district level planners under the new Devolution Order or system ofLocal Government. Inter-district comparisons and analyses of regional disparities of literacy and primary education also offer valuable guidanceto prov<strong>in</strong>cial and national level planners and policy-makers, and provide an <strong>in</strong>valuable tool for the researchers.4. LITERACY DEFINED IN SOME OTHER COUNTRIESDef<strong>in</strong>itions of literacy, as adopted or followed <strong>in</strong> some countries, are given below:-Table – 1Def<strong>in</strong>itions of <strong>Literacy</strong> <strong>in</strong> Selected CountriesS.No. Country Def<strong>in</strong>ition1. Bangladesh Ability to read and write <strong>in</strong> any language2. Canada In Canada 9 th grade pass is considered as literate and accord<strong>in</strong>g to this def<strong>in</strong>ition illiterates are only 1 % <strong>in</strong> that country.3. India Literate is def<strong>in</strong>ed as the one who can read with accuracy at a speed of approximately 40 words per m<strong>in</strong>ute and write orcopy at a speed of 10 words per m<strong>in</strong>ute and take dictation at the speed of not less than 7 words per m<strong>in</strong>ute <strong>in</strong> anylanguage.4. Indonesia A person is considered as literate who can recognize alphabets, read simple words, signs his / her name (eligibility forvot<strong>in</strong>g) able to read and understand a letter, or able to read certa<strong>in</strong> part of certa<strong>in</strong> magaz<strong>in</strong>e or of a certa<strong>in</strong> newspaper.5 Nepal <strong>Literacy</strong> is def<strong>in</strong>ed as the ability to read and write <strong>in</strong> any language, a short statement on every day life of 06 years andabove persons6. Vietnam The def<strong>in</strong>ition of literacy consists of three components viz-a-viz:-a. Read<strong>in</strong>g and writ<strong>in</strong>g the pr<strong>in</strong>ted materials without spell<strong>in</strong>g each word.b. Writ<strong>in</strong>g 80 words <strong>in</strong> 45 m<strong>in</strong>utes without mak<strong>in</strong>g too many mistakes.c. Read<strong>in</strong>g four digit numbers and write legibly the first ten numbers.The above cited def<strong>in</strong>itions from different countries <strong>in</strong>dicate that despite the broaden<strong>in</strong>g of the description of literacy <strong>in</strong> literature, thework<strong>in</strong>g def<strong>in</strong>ition of literacy, as adopted by different countries, has rema<strong>in</strong>ed fairly simple at the skill level.4
5. INTERNATIONAL CONTEXT OF DEFINITIONSThe def<strong>in</strong>ition of literacy is context specific. The parameters of literacy may vary from one geographical region to another, and from one era toanother. It can be as simple as just recognition of the alphabets, or sign<strong>in</strong>g of one’s own name, or may be broader <strong>in</strong> order to <strong>in</strong>clude handl<strong>in</strong>g ofequipment by study<strong>in</strong>g manuals. <strong>Literacy</strong> has multiple mean<strong>in</strong>gs rang<strong>in</strong>g from simple ability to read and write, to <strong>in</strong>terpret<strong>in</strong>g and implement<strong>in</strong>gideas, knowledge and skills that a person may require to possess for effective participation <strong>in</strong> daily life.Some def<strong>in</strong>itions of literacy focus on perception and decod<strong>in</strong>g. For example, Spache (1964) described literacy as “a series of word perceptionsi.e. read<strong>in</strong>g only”. Kaestle (1985), described literacy as “the ability to decode and comprehend language at a rudimentary level, that is the abilityto look at written words correspond<strong>in</strong>g to ord<strong>in</strong>ary oral discourse, to say them, and to understand them”. These two def<strong>in</strong>itions emphasize theaspect of hav<strong>in</strong>g the skills to read the pr<strong>in</strong>ted symbols and to map those symbols <strong>in</strong>to the understand<strong>in</strong>g of oral language. This def<strong>in</strong>ition isconsistent with the teach<strong>in</strong>g of read<strong>in</strong>g through an emphasis on sound-symbol correspondence, and help<strong>in</strong>g readers make connections to theiroral vocabulary and comprehension abilities. But this def<strong>in</strong>ition lacks the important component of writ<strong>in</strong>g.It is observed that <strong>in</strong>itially, the def<strong>in</strong>ition of literacy was conf<strong>in</strong>ed to the acquisition of the basic skills of the 3 R’s (read<strong>in</strong>g, writ<strong>in</strong>g andarithmetic). Over a period of time, basic literacy was upgraded to functional literacy, expand<strong>in</strong>g further <strong>in</strong>to know<strong>in</strong>g to do th<strong>in</strong>gs by us<strong>in</strong>g<strong>in</strong>sight. This transformation of literacy is, <strong>in</strong>fact, associated with its importance for the society as a whole, and to enable a person to effectivelyparticipate <strong>in</strong> the lifeThough def<strong>in</strong><strong>in</strong>g literacy is complex, yet it is important to deliberate upon it, s<strong>in</strong>ce the def<strong>in</strong>ition has far-reach<strong>in</strong>g implications. Some expertshave emphasized cognitive processes <strong>in</strong> describ<strong>in</strong>g literacy, some more generally and others more specifically. For example, Goodman (1976)suggested that “read<strong>in</strong>g is a psychol<strong>in</strong>guistic guess<strong>in</strong>g game”. Venezky (1991) states that it is “a cognitive skill”. Calfee and Nelson-Barber(1991) describe it as “the capacity to employ language as a tool for oral communication”. These def<strong>in</strong>itions are consistent with teach<strong>in</strong>g read<strong>in</strong>gand writ<strong>in</strong>g as a cognitive process that <strong>in</strong>volve the process<strong>in</strong>g of <strong>in</strong>formation through such strategies as activat<strong>in</strong>g background knowledge,encourag<strong>in</strong>g readers to make predictions, or writers to organize their ideas <strong>in</strong>to categories.<strong>Literacy</strong>, Politics and Democracy“Although literacy may not be the great panacea that leads to happ<strong>in</strong>ess and wealth, it could lead to a change <strong>in</strong> theway power is distributed <strong>in</strong> society”.(<strong>UNESCO</strong>, 1991, A Literate World, International Bureau of Education, Geneva)“Survival <strong>in</strong> relation to political <strong>in</strong>stitutions is once aga<strong>in</strong> dependent on literacy. In many countries the right to vote isdenied to the illiterate. Responsible vot<strong>in</strong>g is not easy without literacy. <strong>Literacy</strong> makes democracy possible andhistorical responses to the tribal drum less likely”.(H.S. Bhola, <strong>UNESCO</strong>, 1990)5
In the present day context, when paper and pencil are be<strong>in</strong>g replaced by the key board, calculators are perform<strong>in</strong>g mathematical functions andthe <strong>in</strong>ternet has become the source of <strong>in</strong>formation, there is every possibility that books may loose their relative value. This element while<strong>in</strong>creas<strong>in</strong>g the access of people to vast sources of knowledge, may hamper other equally important skills.Literacies of the FutureThe enormous range of potential applications for computers makes it likely that an element of re-def<strong>in</strong>ition will<strong>in</strong>evitably accrue <strong>in</strong> respect of what is understood by “basic literacy”. Familiarity with keyboards or other <strong>in</strong>putdevices could replace the pen or pencil, not as the most commonly available physical means of produc<strong>in</strong>g writtentexts, but tested <strong>in</strong> schools and other formal educational sett<strong>in</strong>gs. Such shifts <strong>in</strong> the physical means of produc<strong>in</strong>g textare by no means unprecedented, but the advent of micro-computers is significant because their purchase and supportwill always entail relatively large expenditures (at least compared to pens and pencils) with the result<strong>in</strong>g scope for<strong>in</strong>creased national and <strong>in</strong>ternational disparities <strong>in</strong> access to the new variants of literacy.<strong>UNESCO</strong>, 1990, “ The Future of <strong>Literacy</strong> and Literacies of the Future” , <strong>in</strong> <strong>Literacy</strong> Lessons, IBE, <strong>UNESCO</strong> Geneva/France , page .6.With this overview of def<strong>in</strong>itions of literacy <strong>in</strong> m<strong>in</strong>d, we now see as how it has been def<strong>in</strong>ed <strong>in</strong> <strong>Pakistan</strong> over a period of time.6
6. CHANGING DEFINITIONS OF LITERACY IN PAKISTANThe def<strong>in</strong>ition of literacy, <strong>in</strong> <strong>Pakistan</strong>, has evolved and improved s<strong>in</strong>ce the first Census <strong>in</strong> 1951. The follow<strong>in</strong>g table <strong>in</strong>dicates the chang<strong>in</strong>gdef<strong>in</strong>itions of literacy.Table – 2Def<strong>in</strong>itions and Status of <strong>Literacy</strong> <strong>in</strong> Different Census Years of <strong>Pakistan</strong>Year ofDef<strong>in</strong>ition of <strong>Literacy</strong>Age<strong>Literacy</strong> rate (%)CensusgroupTotal Urban Rural1951 “One who can read a clear pr<strong>in</strong>t <strong>in</strong> any language”. All Both Sexes 17.9Ages Female 13.91961 “One who is able to read with understand<strong>in</strong>g a simple letter <strong>in</strong> Age 5 Both Sexes 16.9 34.8 10.6any language.”andaboveFemale 6.7 21.3 2.21972 “One who is able to read and write <strong>in</strong> some language withunderstand<strong>in</strong>g.”Age10 andabove1981 “One who can read newspaper and write a simple letter.” Age10 andabove1998 “One who can read newspaper and write a simple letter, <strong>in</strong> anylanguage.Age10 andaboveBoth Sexes 21.7 41.5 14.3Female 11.6 30.9 4.7Both Sexes 26.2 47.1 17.3Female 16.0 37.3 7.3Both Sexes 43.92 63.08 33.64Female 32.02 55.16 20.097
7. FUNCTIONAL LITERACYThe def<strong>in</strong>ition of literacy as well as the specific age group of the literate population, for census purposes, kept on chang<strong>in</strong>g both at the nationaland <strong>in</strong>ternational levels. Two def<strong>in</strong>itions of functional literacy are provided below as an example.Functionally literate: is a person “who can with understand<strong>in</strong>g, both read and write a short simple statement on his everydaylife”. (<strong>UNESCO</strong>. IBE.1976)Another def<strong>in</strong>ition of functionally literate person by Gray (1956) is provided below:‘A person is functionally literate when he has acquired the knowledge and skills <strong>in</strong> read<strong>in</strong>g and writ<strong>in</strong>g, which enable him toengage effectively <strong>in</strong> all those activities <strong>in</strong> which literacy is normally assumed <strong>in</strong> his culture or group’.Gray, W.S. The Teach<strong>in</strong>g of Read<strong>in</strong>g and Writ<strong>in</strong>g, Paris, <strong>UNESCO</strong>, 1956. (Monographs on Fundamental Education, X)This def<strong>in</strong>ition appears to be very simple and old, however the phrase “every day life” conta<strong>in</strong>s the seeds for evolution and transformation. Aslife patterns, <strong>in</strong>clud<strong>in</strong>g amenities, gadgets, and procedures of transaction etc. change with time, the def<strong>in</strong>ition of functional literacy will have tocorrespond to them.8. LEVELS OF FUNCTIONAL LITERACY AND PROGRAMMES IN A GLOBAL PERSPECTIVEThere are three levels with specific programmes. These are described below:-Basic Level (Level-I)A) TARGET GROUPi) Adults who have never been to school or who have dropped out of school before acquir<strong>in</strong>g literacy skills.ii) Adults unable to read and write simple words, paragraphs or any other type of written statement without the help of ateacher.8
PROGRAMME REQUIREMENTS OF BASIC LEVEL (LEVEL I)Read<strong>in</strong>g Writ<strong>in</strong>g Numeracy OtherRead newspaperheadl<strong>in</strong>es andsub-head<strong>in</strong>gs.Write one’s ownname andaddress.Count and reorganize/recognize figures1-1000.Communicate clearly.Read and understandposters.Communicate <strong>in</strong>Writ<strong>in</strong>g, us<strong>in</strong>gsimple language.Add andSubtract up to 3 digits.Use literacyskills <strong>in</strong> dailylife.Read and understandsimple pr<strong>in</strong>tedparagraphs.Write simpleletters.Understand thepr<strong>in</strong>ciples of simple‘Addition’,‘Subtraction’,‘Multiplication’ and‘Division’.-Read and recognizenumbers 1-1000Write numericalNumbers 1-1000. - -9
Middle Level (Level II)A) TARGET GROUPAdults who have completed the basic level and/or have acquired basic skills of literacy.B) PROGRAMME REQUIREMENTSWhen adults have completed this level (i.e. Level-II) they should have mastered the follow<strong>in</strong>g skills.PROGRAMME REQUIREMENTS - MIDDLE LEVEL (LEVEL-II)Read<strong>in</strong>g Writ<strong>in</strong>g Numeracy OtherRead and comprehend stories, songs,directions, <strong>in</strong>structions and simple partsof newspapers.Identify the ma<strong>in</strong> idea of what has beenread.Write simple notes andletters.Fill out simple formsand receipts (bills)Demonstrate proficiency<strong>in</strong> add<strong>in</strong>g and subtract<strong>in</strong>g.Apply basic skills <strong>in</strong>multiply<strong>in</strong>g and divid<strong>in</strong>g. -Further improvement <strong>in</strong>communication andliteracy.Understand basic measurements(money, weight, length, volume) andsolve simple numerical problems e.g.family budget, market<strong>in</strong>g, etc.- - -Self Learn<strong>in</strong>g Level (level III)A) TARGET GROUPAdults who have completed level II (Middle Level), or can study <strong>in</strong>dependently and who are will<strong>in</strong>g to use books and otherresources <strong>in</strong> search of new knowledge.10
B) PROGRAMME REQUIRMENTSWhen adults have completed this level, they should have mastered skills such as the follow<strong>in</strong>g:PROGRAMME REQUIRMENTS OF SELF LEARNING LEVEL (LEVEL-III)Read<strong>in</strong>g Writ<strong>in</strong>g Numeracy OtherAnalyze and synthesizema<strong>in</strong> ideas of what theyread.Write one or two pages oncerta<strong>in</strong> topics.Add and subtract large numberswith accuracy and speed.Further improvement <strong>in</strong>communications and literacyskills.Discuss with others whatthey have read.Write personal letters,applications, reports,<strong>in</strong>quiries, etc.Multiply up to 5 digit numbersand functions.-Read and <strong>in</strong>terpret simplegraphsDraw graphs and geometricfiguresDivide up to 3 digit numbersand functions -9. LITERACY SCENARIO AT THE INTERNATIONAL LEVELTable-1, given below provides an overview of an <strong>in</strong>ternational comparison of selected countries (with specific reference to Asian and Pacificcountries) for literacy rates and the factors affect<strong>in</strong>g literacy levels <strong>in</strong>clud<strong>in</strong>g Public Expenditure on Education as Percentage of GNP, PublicExpenditure on Primary Education as Percentage of GNP, Public Expenditure on Primary Education as Percentage of the Total EducationBudget, Public expenditure on Primary Education Per Pupil as Percentage of Per Capita GNP, <strong>Literacy</strong> Rate, Participation Rate <strong>in</strong> Grade 1, andSurvival Rate to Grade 5.11
Table - 3Comparison of <strong>Pakistan</strong> with other South Asian countries <strong>in</strong> respect of literacy rate and other related factors – Year 1998CountryPer capitaGNP(US.$)Public exp.on educationas % of GNPPublicExpenditureon PrimaryEducation %of GNPPublic Expenditureon PrimaryEducationas % of totalEducational BudgetPublic exp. onprimary educationper pupil as % ofper capita GNPAdult <strong>Literacy</strong>rateParticipation rate<strong>in</strong>Grade 1Survival rateto Grade 5Azerbaijan 480 3.00 1.9 57.8 9.3 97.3 81.3 98.1Bangladesh 370 2.2 1.2 43.6 8.1 41.0 64.6 70.0Bhutan 590 4.1 1.8 61.1 14.7 47.0 17.5 86.0Cambodia 260 2.1 0.9 89.9 5.2 68.0 62.4 45.2India 450 3.2 1.5 50.4 9.4 57.0 67.5 52.0Indonesia 640 4.0 2.6 30.4 17.9 87.9 48.3 85.3Iran 1650 4.0 2.5 34.4 6.2 75.5 95.7 94.8Japan 32350 3.8 2.7 53.00 16.5 99.9 99.9 99.9Kazakhstan 1340 4.5 1.8 26.2 12.2 99.9 98.3 92.0Kyrgyzstan 380 6.8 1.0 22.12 11.7 97.0 52.9 73.9Malaysia 3670 5.3 1.5 40.1 11.6 93.7 63.2 93.4Maldives 1960 6.4 2.4 38.9 12.1 97.0 96.8 98.0Mongolia 310 5.6 1.7 24.4 16.1 97.2 82.7 61.3Nepal 240 3.2 1.4 61.0 8.8 42.0 53.7 44.0<strong>Pakistan</strong> 440 2.7 1.1 51.8 11.6 43.2 66.1 50.0Philipp<strong>in</strong>es 1050 2.2 1.9 51.9 11.3 93.6 52.4 69.4Sri Lanka 850 3.4 2.43 16.60 4.64 92.0 94.0 97.0South Asia 444 3.2 2.13 43.73 8.97 54.0 73.8 54.0(WeightedAverage)Develop<strong>in</strong>g 1230 1.8 1.11 36.81 6.84 74.0 70.08 73.0CountriesSource: 1. World Education Statistics <strong>UNESCO</strong> 19982. A Synthesis Report of Education for All 2000 Assessment: In the South and West Asia sub-region for the Asia –Pacific Region3. UNDP Human Development Report 2001, Newyork: Pages 141-1444. Human Development <strong>in</strong> South Asia 2002, Mahbub-ul-Haq Human Development Center, Oxford University Press, Karachi.12
Table-3 above, <strong>in</strong>dicates that countries like Malaysia, Maldives, Indonesia, Iran, Japan and Thailand who spend about 4 percent of GNP oneducation have literacy rates between 75 and 100 percent. A major <strong>in</strong>dicator is the percentage of GNP spent on primary education, which has adirect bear<strong>in</strong>g on the literacy rate. Countries like Bhutan, Bangladesh, Nepal, <strong>Pakistan</strong> and India, <strong>in</strong>vest about 1-2 percent of GNP on primaryand basic education, and have relatively low literacy rates as compared to the other countries listed <strong>in</strong> the table. Central Asian countries likeAzerbaijan, Kazakhstan, Kyrghyzstan, Mongolia, and a few others are exceptions due to an emphasis on literacy and consequent achievement <strong>in</strong>the past dur<strong>in</strong>g the socialist regime. <strong>Pakistan</strong> is ranked at 138 (out of 172) position <strong>in</strong> HDI rank (with HDI <strong>in</strong>dex 0.499)* <strong>in</strong> the globe.When we glance at the global scenario of literacy, it appears that another important factor <strong>in</strong> rais<strong>in</strong>g both literacy and participation rates <strong>in</strong> 2000at primary level is public expenditure on primary education per pupil as a simple percentage of per capita GNP. Majority of the countries arespend<strong>in</strong>g from 8 to 15 percent of their per capita GNP per pupil <strong>in</strong> primary education. East Asian countries spent most of their education budgetson basic education — as much as 70 per cent. Forged alliances with the private sector, NGOs, civil organizations and many grassrootsmovements to spread education at a faster pace and <strong>in</strong> a more cost-effective manner, has also proved helpful <strong>in</strong> ris<strong>in</strong>g the literacy rate of most ofthe East Asian and other develop<strong>in</strong>g countries.In the early 1980s, under the umbrella of <strong>UNESCO</strong> an <strong>in</strong>vestigation <strong>in</strong>to the factors that contributed to accelerated growth of literacy and basiceducation <strong>in</strong> countries of the region that were low <strong>in</strong> literacy, revealed that either the progress was due to the authoritarian nature of the systemof government like <strong>in</strong> Myanmar where the ruler, an Army General, had put literacy high on- his agenda, therefore the entire system was gearedto achiev<strong>in</strong>g long strides <strong>in</strong> literacy, or the delivery of literacy and basic education programmes was through the local cells of a politicalprogramme <strong>in</strong> which basic education was part of the rul<strong>in</strong>g party's manifesto like <strong>in</strong> Vietnam and Laos.The <strong>in</strong>ternational comparisons have a clear message that <strong>Pakistan</strong> lags beh<strong>in</strong>d many nations <strong>in</strong> its literacy efforts even at the dawn of the 21 stcentury. Therefore, if <strong>Pakistan</strong> has to make progress and achieve a respectable position <strong>in</strong> the world community, it has to accelerate efforts forthe realization of higher rates of literacy through basic education for specific age groups of children, and eradicat<strong>in</strong>g illiteracy among adults by anation-wide literacy campaign, and a literacy program on a war foot<strong>in</strong>g.10. LITERACY AND BASIC EDUCATION IN PAKISTANAdult literacy has rema<strong>in</strong>ed a neglected area <strong>in</strong> terms of planned action <strong>in</strong> <strong>Pakistan</strong>. The overall strategy, from 1947 to 1998 has been restrictedto formal <strong>in</strong>stitutions only. Thus reflected replication of the exist<strong>in</strong>g formal model has been the major approach for the solution of the problemsof the basic education sector. Low <strong>in</strong>vestment <strong>in</strong> basic and primary education, successive failure of the promises made <strong>in</strong> every plan andeducation policy, and the practice of miss<strong>in</strong>g well marked deadl<strong>in</strong>es, have created a credibility gap.13
Previous attempts made for the enhancement of literacy, as a planned effort <strong>in</strong> terms of targets, and allocations <strong>in</strong> various Developmental Plansof <strong>Pakistan</strong> are listed below <strong>in</strong> Table 4.Table-4Adult <strong>Literacy</strong> – Plan Allocations, Targets And StrategiesPlanFirst Five YearPlan 1955-60Second FiveYear Plan1960 – 65Third Five YearPlan 1965-70Non-Plan Period1970-78Fifth Five YearPlan 1978-83Sixth Five YearPlan 1983-88Seventh FiveYear Plan1988-93Eighth Five YearPlan 1993-98N<strong>in</strong>th Five YearPlan 1998-2003Allocation (Rs. InMillion)Target (Million Persons)StrategiesNil Nil • Through Village Aid Programme.• School as a community center.Nil Nil • School as a community centerNil Nil • Pilot projects of <strong>in</strong>tensive nature on experimental basis2.3 5.0 • Advisory Council for Adult <strong>Literacy</strong> and Adult Education recommended.• National Education Corps,.• Armed forces to play a role.• Industrial establishments to run literacy classes for workers.50.0 8.5 • Population 12-45 years to be covered.750.0834.0 (ActualExpenditure)• <strong>Pakistan</strong> Television <strong>Literacy</strong> Program to be augmented.15.0 • Population 10-24 years to be covered.• Establishment of LAMEC• NGOs and local governments to be <strong>in</strong>volved.• Fresh matriculates to take up literacy work for one year.• Debarr<strong>in</strong>g illiterates form employment.300.0 12.5 • Universilazation of Primary Education.• Non-formal Education Programs• NGOs.1750.0 (SAP) 16.86 • Universalization of Primary Education.• NGOs to develop and launch community based literacy programs.• Integration of literacy <strong>in</strong> Rural and Urban Community Development programs.12455.00 55% literacy by 200370% literacy by 2010• Functional <strong>Literacy</strong> Centers for Education of Adults.• Establishment of new 75000 NFBE schools___________________________________________________________________________________________________________*Source: Human Development <strong>in</strong> South Asia 2002, Mahbub-ul-Haq Human Development Center, Oxford University Press, Karachi.14
Policy1947<strong>Pakistan</strong> EducationConference1959Commission onNational Education1970The New EducationPolicy1972The Education Policy1979National EducationPolicy1992National EducationPolicy, 1992-2002National EducationPolicy, 1998-2002Target (Literates/<strong>Literacy</strong> Rate)NilNil5.0Millionto be madeliterateTable-5Adult <strong>Literacy</strong> – Policy Targets and Strategies (1947-2010)Strategies• Adult education by prov<strong>in</strong>ces• College students to participate <strong>in</strong> literacy campaign• Exist<strong>in</strong>g school build<strong>in</strong>gs and staff to be used• Use of school children as the teachers of their illiterate parents• College students as adult literacy teachers• Each one teach one• Media use for adult education• Functional education• Employers to make the employees literate• National Education Corps• Non-Formal Education Programmes11.0 • Massive literacy Programmes• <strong>Literacy</strong> Centers <strong>in</strong> schools, factories, farms, union council halls and other community places.• Media use for literacy• 35 % by 1982-85• 40 %by 1992-93• 80 % by 2000• 50 % by 1995• 70 % by 2002By 2002 – 2003• 55 %• 70 % Male• 40 % FemaleBy 2010• 70 %• 85 %• 55.5 Female• Mosque schools and Mohalla schools.• Student volunteers corps• Use of television for literacy• Creation of <strong>Literacy</strong> and Mass Education Commissions• Primary Education Compulsory.• Involvement of NGOs• Massive efforts to enhance literacy rate• <strong>Literacy</strong> programmes will be <strong>in</strong>tegrated with skill based community programmes• Use of electronic and pr<strong>in</strong>t media• Awards to meritorious work <strong>in</strong> adult literacy• Appropriate legislation to allocate funds for promotion of adult literacy, non transferable and non lapsable• Decentralization of plann<strong>in</strong>g mechanism.• Special attention to out-of-school children• Emphasis on maximum utilization of resources e.g. GoP, NGO community <strong>in</strong>itiatives, Boy Scouts and Girl Guides.• Increase <strong>in</strong> Non-Formal Basic Edu-Community centers from 70000 to 82000 by 2000• Media <strong>in</strong>volvement to impart life skills to the neo-literate.15
11. CURRENT LITERACY SITUATION IN PAKISTANThe overall literacy rate <strong>in</strong> <strong>Pakistan</strong> has been improv<strong>in</strong>g albeit at a very slow pace. In 1951, the overall literacy rate <strong>in</strong> <strong>Pakistan</strong> was 16.41 %.After 50 years, the current estimated literacy rate for 2003 is 51.13%. Roughly, and on an average, literacy rate <strong>in</strong> <strong>Pakistan</strong> has been grow<strong>in</strong>g atthe rate of 3.085* % annually. On the other hand, the total number of illiterates <strong>in</strong> <strong>Pakistan</strong> has almost doubled <strong>in</strong> absolute numbers. In 1951,there were only 22.54 million illiterates <strong>in</strong> <strong>Pakistan</strong>, 1998 Census results show that illiterate population has risen to 48.84 million. In terms ofprov<strong>in</strong>cial comparisons, dur<strong>in</strong>g the period of 1981 to 1998, the literacy rate <strong>in</strong> the prov<strong>in</strong>ce of Punjab <strong>in</strong>creased at a rate of 3.1681* %, while thatof the prov<strong>in</strong>ce of S<strong>in</strong>dh marked the slowest/lowest rate of literacy growth, of 2.1588* %. The analysis becomes more <strong>in</strong>terest<strong>in</strong>g andastonish<strong>in</strong>g when we study the district level trends, particularly the male-female disparities.The literacy scenario based on the 1998 census, has been presented <strong>in</strong> detailed statistical tables <strong>in</strong> PART-II of this report. Analysis <strong>in</strong> respect ofmale–female and rural-urban disparities is presented <strong>in</strong> the follow<strong>in</strong>g tables (6-9).* Formula used for calculat<strong>in</strong>g the annual growth rate is given <strong>in</strong> the Annex-A at the end.16
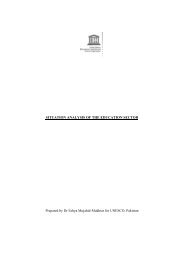
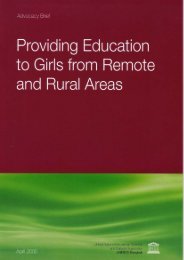
Table-6Various statistical measures of literacy <strong>in</strong> <strong>Pakistan</strong> <strong>in</strong> 1998 (Age 10 + )Area Number of Districts *Range Mean Standard. VarianceDeviationPunjab 34 51.02 46.56 11.55 133.49S<strong>in</strong>dh 21 57.68 45.29 16.68 278.23N.W.F.P. 24 45.53 35.41 11.14 124.23Balochistan 26 25.91 24.83 6.92 47.95All <strong>Pakistan</strong> 105 66.13 43.92 13.98 217.65* Difference between the literacy rates of two districts – one with highest and the other with lowest literacy rate.Table 6 shows the greatest variance (278.23) of literacy rate <strong>in</strong> different areas of S<strong>in</strong>dh, while the least <strong>in</strong> the prov<strong>in</strong>ce of Balochistan (47.95). Itis an astonish<strong>in</strong>g conclusion that factors promot<strong>in</strong>g literacy rate are unevenly distributed <strong>in</strong> all the other three prov<strong>in</strong>ces except Balochistanwhere the situation is quite contrary. In Balochistan, the same factors seem to be affect<strong>in</strong>g urban district of Quetta and the remote rural areas ofTurbat and Panjgur equally. <strong>Literacy</strong> growth and the total population of literates/illiterates from 1972-1998 <strong>in</strong> <strong>Pakistan</strong> is reflected <strong>in</strong> thefollow<strong>in</strong>g graphs.17
Graph No. 1Growth of <strong>Literacy</strong> Rate <strong>in</strong> <strong>Pakistan</strong><strong>Literacy</strong> Rate (%)504540353025201510501972 1981 1998All <strong>Pakistan</strong>PunjabS<strong>in</strong>dhN.W.F.PBalochistanYears18
Graph No. 2Population of Literates and Illiterates <strong>in</strong> <strong>Pakistan</strong> (1972-1998)5048.848454038.6 40.037Population(In Millions)353025201520.430.627.4LiteratesIlliterates10501972 1981 1998Years19
Table 7 below <strong>in</strong>dicates the highest variance (398.27), and range (62.52) of female literacy <strong>in</strong> the S<strong>in</strong>dh prov<strong>in</strong>ce while the same values are thelowest for the prov<strong>in</strong>ce of Balochistan, with variance be<strong>in</strong>g (23.231) and range (19.93).Table - 7Various statistical measures of Female literacy <strong>in</strong> <strong>Pakistan</strong> <strong>in</strong> 1998 (Age 10+)Area Number of Range * Mean Standard VarianceDistrictsDeviationPunjab 34 49.31 35.10 (57.20) 12.09 146.316S<strong>in</strong>dh 21 62.52 34.78 (54.50) 19.96 398.279N.W.F.P. 24 36.13 18.82 (51.39) 9.55 91.178Balochistan 26 19.33 14.09 (34.03) 4.88 23.23All <strong>Pakistan</strong> 105 71.69 31.58 (54.43) 14.99 224.567* Difference between literacy rates of two districts – one with highest and the other with lowest literacy rate.Note: Figures <strong>in</strong> Parenthesis <strong>in</strong> column of Mean <strong>in</strong>dicates the male literacy rate.The above Table 7 shows a wide range of disparity <strong>in</strong> the literacy rate for males and females. It provides the reader with a regional coverage ofthe districts and a systematic look at the conditions of women.Rural women are an important component <strong>in</strong> the complex process of rural development <strong>in</strong> <strong>Pakistan</strong>. There is a grow<strong>in</strong>g realization on the part ofthe government that the participation of girls and women, who constitute half the population, is essential for any planned and rapid progress <strong>in</strong>all the districts of <strong>Pakistan</strong>.20
Graph No. 3<strong>Literacy</strong> Rate – Male & Female<strong>Literacy</strong> Rate (%)605040302010054.8135.130.23226.121.41613.911.66.71951 1961 1972 1981 1998MaleFemaleYears21
Table 8<strong>Literacy</strong> Growth Rate <strong>Trends</strong> of Age 10 + – 1981-1998 (by Prov<strong>in</strong>ces)Area1981 1998 % Net Increase Growth RateMale Female Male Female Male Female Male FemalePunjab 36.8 16.8 58.7 35.0 59.51 % 108.93 % 2.6283 4.4295S<strong>in</strong>dh 39.7 21.6 56.6 34.78 42.56 % 61.02 % 1.8812 2.8416NWFP 25.9 6.5 51.39 18.82 98.42 % 189.54 % 4.1366 6.4533Balochistan 15.2 4.3 34.03 14.09 125.37 % 227.67 % 4.8550 7.2309A conclusion which may be derived from Table 8 is that the net <strong>in</strong>crease <strong>in</strong> the percentage of literacy for females <strong>in</strong> NWFP and Balochistan from1981 to 1998, despite cultural barriers, is much more than that for males.AreaStandard.DeviationTable - 9Measures of Variability for Rural <strong>Literacy</strong> <strong>in</strong> <strong>Pakistan</strong> – 1998Range* Mean (Both Sexes) Variance Male FemaleRural Urban Rural Urban Rural UrbanPunjab 12.57 46.43 37.95 64.48 158.05 50.40 70.94 24.78 57.23S<strong>in</strong>dh 8.97 32.81 25.73 63.72 80.43 37.89 69.75 12.23 56.66N.W.F.P. 9.90 40.77 31.29 54.33 98.02 47.65 67.48 14.69 39.10Balochistan 6.93 25.05 17.47 46.86 48.03 25.75 58.14 7.94 33.08All <strong>Pakistan</strong> 13.39 56.61 34.40 63.08 179.29 51.33 70.00 24.02 55.16* Difference between literacy rates of two districts – one with highest and the other with lowest literacy rate.22
A comparison between the urban and rural population of <strong>Pakistan</strong> and between males and females reveals that rural literacy (34.40 %) is lessthan that of urban literacy (63.08 %), and female literacy (31.58 %) is less than male illiteracy (54.43 %). But trends <strong>in</strong>dicate that femaleliteracy has <strong>in</strong>creased at a greater rate than male literacy dur<strong>in</strong>g 1972-1998. Similarly the <strong>in</strong>crease <strong>in</strong> literacy dur<strong>in</strong>g the same period is alsobetter <strong>in</strong> rural areas than <strong>in</strong> urban areas. Rural literacy <strong>in</strong> 1981 was about one third of urban literacy. The gap between the two has slightlydecreased from 1972 to 1998.12. REGIONS OF LOW AND HIGH LITERACY RATE IN PAKISTAN ACCORDING TO CENSUS OF 1998On the basis of the data obta<strong>in</strong>ed from the Population Census Report (1998), an analysis of literacy for this profile has been carried out as pernational norms. As a first step the ‘Mean and Standard Deviations’ of the literacy rates were worked out which came out to be 43.92 and 13.98respectively. With the help of these two parameters, the country has been divided <strong>in</strong>to the follow<strong>in</strong>g four literacy regions as shown <strong>in</strong> the chartbelow:Region <strong>Literacy</strong> rate range Description of regionRegion of very low literacy Upto 29.96%One Standard Deviation (13.98) below the mean (43.92)(RVLL)(43.92 – 13.98 = 29.94)Region of low literacyBetween the value of an Standard Deviation (13.98) belowFrom 29.94% to 43.92%(RLL)upto MeanRegion of high literacy From 43.92% to 57.90%One Standard Deviation (13.98) above the Mean (43.92)(RHL)(43.92 + 13.98 = 57.90)Region of very high literacyMore than Mean (43.92) plus one Standard DeviationMore than 57.90(RVHL)(13.98)The analysis regard<strong>in</strong>g the regions of low and high literacy based on 1981 and 1998 Censuses, alongwith a comparative situation of 1981 and1998, is given as under:Tables-10 and 11 <strong>in</strong>dicate that only 3 districts of Punjab lie <strong>in</strong> the region of very low literacy rate and these are from the “Saraiki belt” ofSouthern Punjab. In S<strong>in</strong>dh, there are 6 districts, <strong>in</strong> NWFP 9 districts and almost the whole of Balochistan prov<strong>in</strong>ce (22 districts out of total 25)lies <strong>in</strong> this region. Only 04 districts of Punjab and 03 districts of Karachi <strong>in</strong> the S<strong>in</strong>dh Prov<strong>in</strong>ce fall <strong>in</strong>to the category of the very high literacy rateregion. Districts of Gujranwala, Faisalabad, Jhelum and Gujrat <strong>in</strong> Punjab, which were <strong>in</strong> the region of low literacy rate <strong>in</strong> 1981 have progressedconsiderably and have jumped to the region of high literacy rate <strong>in</strong> 1998. The same is the case with Shikarpur and Larkana <strong>in</strong> S<strong>in</strong>dh, Malakand,Peshawar Mansehra, D.I.Khan, Bannu, Kohat, Hangu, Chitral, and Mardan <strong>in</strong> NWFP. However <strong>in</strong> the Prov<strong>in</strong>ce of Balochistan only Panjgur23
District has progressed from a very low to only a low literacy level region. This transition is probably due to the <strong>in</strong>crease <strong>in</strong> participation rate <strong>in</strong>these districts as compared to that of 1981.From total scenario, it is apparent from Table 10 that a total of 83 districts of <strong>Pakistan</strong> are <strong>in</strong> the region of “low literacy” and “very low literacy”,while only 21 districts are <strong>in</strong> the region of high literacy or very high literacy. None of the districts of the prov<strong>in</strong>ces of NWFP and Balochistanare <strong>in</strong> the region of “very high literacy”, while only 2 districts of NWFP and none of the districts of Balochistan lie <strong>in</strong> the region of “high literacyrate”. It is also <strong>in</strong>dicative that shifts of districts to high literacy regions from low literacy regions, between 1981 to 1988, were mostly <strong>in</strong> theprov<strong>in</strong>ces of the Punjab and S<strong>in</strong>dh. The prov<strong>in</strong>ces of Balochistan and NWFP have progressed very slowly <strong>in</strong> respect of literacy rate, dur<strong>in</strong>g thisperiod of 17 years (1981-98).It is also observed from prov<strong>in</strong>cial statistics that <strong>in</strong> 1981 a higher percentage (26.15) of the districts were <strong>in</strong> the region of high literacy ascompared to 1998 (20.19). Major shifts as revealed <strong>in</strong> Table No. 9 are from regions of “very low literacy” to the region of low literacy. About23 districts from all over <strong>Pakistan</strong> have moved from the region of “very low literacy” to the region of “low literacy”, dur<strong>in</strong>g these 17 years. Thefollow<strong>in</strong>g table presents further details:-Table 10Number of Districts <strong>in</strong> Various <strong>Literacy</strong> Regions (1981-98)Area Years Number of Districts <strong>in</strong>:Very High literacyRegions (60.70 % andHigh literacy Regions(45.93 to 60.70 %)above)Low literacy regions(45.93 % to 60.70 %)Very low literacy regions(30.16 % to 45.93%)PUNJAB 1981 03 07 15 ---- 251998 04 09 18 03 34SINDH 1981 02 03 03 01 091998 03 03 09 06 21NWFP 1981 --- 01 08 03 121998 --- 02 13 09 24BALO-CHISTANALLPAKIS-TANTotalDistricts1981 --- 01 --- 15 161998 --- 01 03 22 261981 05 12 26 19 621998 07 15 43 40 10524
Variations <strong>in</strong> the literacy rates of different districts of <strong>Pakistan</strong> deserve special consideration for develop<strong>in</strong>g future strategies for the promotion ofliteracy <strong>in</strong> the country. As far as under-developed districts are concerned, unless these are not brought at par with comparatively developeddistricts, gender disparities are not likely to be elim<strong>in</strong>ated. Further, it is <strong>in</strong>conceivable to promote balanced socio-economic development <strong>in</strong> thecountry without remov<strong>in</strong>g such sharp disparities <strong>in</strong> the field of literacy and basic education. The challenge has to be taken up by the new districtgovernments, as well as new elected government as a jo<strong>in</strong>t venture with a strong “political will” which is required for promotion of literacy.25
Table 11Districts <strong>in</strong> Various <strong>Literacy</strong> Regions (Age 10 and above) <strong>in</strong> Four Prov<strong>in</strong>ces of <strong>Pakistan</strong> dur<strong>in</strong>g 1981 and 1998:VeryHigh59.77%andaboveHighLevel45.00%-59.77%PUNJAB SINDH NWFP BALOCHISTANRawalp<strong>in</strong>di, *Gujrat, *Jhelum, Lahore. Karachi East, Karachi SouthKarachi Central**Attock, Chakwal, **Sargodha,*Faisalabad, Toba Tek S<strong>in</strong>gh, MandiBhaudd<strong>in</strong>, *Gujranwala, Narowal, SialkotKarachi West , *Sukkur, Malir. *Abbotabad, Haripur QuettaLowlevel30.23%-45 %Bhakkar, Khushab, **Mianwali,Hafizabad, **Sheikhupura, **Shahiwal,**Multan, Khanewal, **Kasur, **Vehari,Pakpattan, Layyah, **Bhawalpur,*Bhawalnagar, **Jhang, D.G.Khan,Okara, Rahimyarkhan.Nausharo Feroze, **Shikarpur,**Larkana, Khairpur, Nawabshah,Dadu, Hyderabad, Sanghar,Mirpurkhas**Malakand P.A., **Chitral,**Peshawar, Nowshehra,Mansehra, Swabi, **Kohat,**Bannu, Charsadda, **D.I. Khan,Karak, **Mardan, HanguZiarat, **Panjgur, Pish<strong>in</strong>VeryLowlevel30.23 %andbelowLodhran, Muzfargarh, RajanpurJacobabad, Ghotki, Bad<strong>in</strong>,Thatta, Umerkot, Tharparkar.Upper Dir, Swat, Lower Dir,Shangla,Kohistan, Tank, Buner,Batagram, Hangu, Laki MarwartKilla Abdullah, Chaghi, KohluLoralai, Barkhan, Zhob, Sibi,Musakhel, Killa Saifullah,Kech, Jafarabad , Dera BugtiNasirabad, Jhal Magsi, Gwadar,Bolan, Kalat, Mastung, KhuzdarAwaran, Kharan, Lesbela,* These districts were <strong>in</strong> the Region of Low <strong>Literacy</strong> <strong>in</strong> 1981.** These districts were <strong>in</strong> the Region of Very Low <strong>Literacy</strong> <strong>in</strong> 1981.Highest: Karachi Central (76.00%) Lowest: Musakhel (10.37%)26
13. FACTORS AFFECTING LITERACY RATE IN PAKISTANThough several factors have been affect<strong>in</strong>g the literacy situation <strong>in</strong> <strong>Pakistan</strong>, both positively and negatively, the follow<strong>in</strong>g are the mostsignificant:-13.1 Allocations for EducationIn <strong>Pakistan</strong>, allocations for education <strong>in</strong> general and for enhancement of literacy <strong>in</strong> particular, have, always been very low with, 2.3 % of GNPbe<strong>in</strong>g the highest figure <strong>in</strong> 9 th Plan (1998-2003). The allocations for education <strong>in</strong> terms of percentage of GNP, have been cont<strong>in</strong>uously decl<strong>in</strong><strong>in</strong>gfor the last many years (e.g. 2.34 <strong>in</strong> 1997-98, 2.2 % <strong>in</strong> 1998-99 and 2.14 % for 1999-2000). The first three Development Plans (1955-1970) didnot conta<strong>in</strong> any allocations for literacy. Separate allocations for literacy started with the non-plan period (1970-78) <strong>in</strong> which Rs. 2.3 million wereallocated for literacy but actually only Rs. 5.00 million were spent. Rs. 12.5 million and Rs.8.5 millions, were respectively spent dur<strong>in</strong>g the 7 thand 8 th plans periods for the first time.The message aris<strong>in</strong>g out of EFA 2000 Assessment noted that, “Education is characterized by the need to make tough choices between compet<strong>in</strong>goptions of nearly equal attractiveness. There will never be sufficient funds to do all that educational planners would wish. The challengetherefore is to f<strong>in</strong>d new ways of meet<strong>in</strong>g objectives. It may imply the need for thorough structural reforms; put another way, it may mean do<strong>in</strong>gth<strong>in</strong>gs <strong>in</strong> different way. Sometimes this <strong>in</strong>volves th<strong>in</strong>k<strong>in</strong>g the unth<strong>in</strong>kable, question<strong>in</strong>g the long-accepted practices”. Fund<strong>in</strong>g constra<strong>in</strong>ts alsoimpose a greater demand on the adm<strong>in</strong>istration of the public education system and the rapid <strong>in</strong>crease of literacy <strong>in</strong> develop<strong>in</strong>g countries like<strong>Pakistan</strong>.The N<strong>in</strong>th Five Year Plan (1998-2003) has the provision of an additional 0.35 % <strong>in</strong>crease <strong>in</strong> the allocation for education every year, so that bythe end of the plan period (2002-2003) it will reach the level of 4 % of GNP, which is the m<strong>in</strong>imum requirement as per <strong>UNESCO</strong>recommendations. The 9 th Plan also targets to <strong>in</strong>crease the literacy rate to 60% by the year 2003, and 75 % by the year 2010 by <strong>in</strong>creas<strong>in</strong>g theallocations for education. The National Education Policy (1998-2010) also aims at achiev<strong>in</strong>g a 55% literacy rate by 2003, by spend<strong>in</strong>g a total ofRs. 559,290.00 million on the education sector and 5,000.00 million specifically on literacy by 2003. As per data provided by EFA W<strong>in</strong>g of theM<strong>in</strong>istry of Education, about 81 adult literacy/tra<strong>in</strong><strong>in</strong>g projects, will be completed <strong>in</strong> three phases upto 2015 for which about Rs. 178 million willbe spent. Accord<strong>in</strong>g to National Plan of Action the total number of literates <strong>in</strong> the country will be raised to 126 million, and the number ofilliterates will shr<strong>in</strong>k to 20.4 million by the year 2015*. Though the allocations for literacy are meager yet if 4 % of GNP as planned <strong>in</strong> theEducation Policy is actually spent, we can hope for a more positive picture. However, if resources allow, more allocations should be madeespecially (e.g. at least 1% of GNP) for adult literacy and non-formal basic education programs <strong>in</strong> <strong>Pakistan</strong>.Source: National Action Plan: Our Roadmap to EFA, <strong>UNESCO</strong> & EFA W<strong>in</strong>g, Federal M<strong>in</strong>istry of Education, Govt. of <strong>Pakistan</strong>. p.7-827
13.2 Public Expenditure on Primary EducationPublic expenditure on primary education <strong>in</strong> any country has a direct bear<strong>in</strong>g on the literacy rate of that country. A picture of the expenditure ofthe education budget allocated for primary education from 1990 onward is given below <strong>in</strong> table 9.Table 12Public Expenditure on Primary and Basic Education <strong>in</strong> <strong>Pakistan</strong>.YearsAs % of totaleducational budgetAllocations for primary and basic educationAs percentage of GNPPer pupil as % of percapita GNP1991 46.31 0.78 6.001995 48.23 0.85 7.931998 51.80 1.1 11.6Source: A Synthesis Report of Education for All 2000 Assessment: In the South and West Asia sub-region for the Asia –Pacific Region, <strong>UNESCO</strong>: 2001Though Table 12 <strong>in</strong>dicates an <strong>in</strong>crease <strong>in</strong> the allocations for primary education <strong>in</strong> <strong>Pakistan</strong>, these are not proportionate to the <strong>in</strong>creases <strong>in</strong> theother countries, like India, Bangladesh and Sri Lanka. Bhutan spends 61 % of its total education budget on primary and basic education.Table 13 below provides a picture of allocations made specifically for literacy and NFBE <strong>in</strong> different plans and policies of <strong>Pakistan</strong>.28
PlanTable 13Allocations for Adult <strong>Literacy</strong>, Non-Formal and Mass Education <strong>in</strong> <strong>Pakistan</strong>Total Allocations forEducational Sector(<strong>in</strong> Million Rs.)Allocations for<strong>Literacy</strong> andMass Education(<strong>in</strong> Million Rs.)<strong>Literacy</strong> Allocationas Percentage oftotal Allocations forEducation SectorActualExpenditure(<strong>in</strong> Million Rs.)Percentage ofActualExpenditure toTotal <strong>Literacy</strong>Allocations1 st . Plan to 5 th Plan (1955-83) 15,577.67 - - - -6 th Plan (1983-88) 18,830 750 4.0 % 724.00 96.53 % (0.038%)7 th Plan (1988-1993) 22,684.8 300 1.32 % 510.308 170.10 % (0.022%)8 th Plan (1993-98) 20,232.8 1750 8.6 % 409.164 23.34 % (0.02%)9 th Plan (1998-2003) 133,500 1000 0.74 % - -Source: National Education Policy (1998-2010), Govt. of <strong>Pakistan</strong>, M<strong>in</strong>istry of Education, <strong>Islamabad</strong>, P.134Note: Figures <strong>in</strong> parenthesis <strong>in</strong>dicate the percentage of total allocation.Table 13 <strong>in</strong>dicates that <strong>in</strong>vestment on adult literacy and mass education was not given serious consideration dur<strong>in</strong>g the <strong>in</strong>itial five 5 Years Planor upto 1983. In the 6 th Plan, the allocations for literacy and mass education were only 4.0 percent of the total allocation for the education sector.With such meagre fund<strong>in</strong>g a considerable rise <strong>in</strong> the literacy rate of the country cannot be expected. It was only <strong>in</strong> the 8 th Five Year Plan and theNational Education Policy of 1998-2010 <strong>in</strong> which literacy and mass education were seriously addressed and allocations <strong>in</strong>creased for thispurpose. The 9 th five Year Plan has an allocation of Rs.1,000 million, which constitute less than one percent of the total education budget foreducation sector. But aga<strong>in</strong> it is uncerta<strong>in</strong> that the entire amount allocated for literacy will actually be released or spent.13.3 Gender IssuesIn <strong>Pakistan</strong>, like most of the develop<strong>in</strong>g countries, the traditional ascription of fem<strong>in</strong><strong>in</strong>e and mascul<strong>in</strong>e standards of behavior, division of laborand family responsibilities, have been the ma<strong>in</strong> barriers <strong>in</strong> achiev<strong>in</strong>g a female literacy rate equal to that of males. In the rural areas, the poorpeople send only their sons to school, and that too by mak<strong>in</strong>g great personal sacrifice, but female children are kept without school<strong>in</strong>g. Thecountry has not been able to provide adequate opportunities for the girls to acquire education. This lack of provid<strong>in</strong>g adequate opportunity forfemale education is also reflected <strong>in</strong> the gender parity <strong>in</strong>dex <strong>in</strong> <strong>Pakistan</strong> which deteriorated from 54 per cent to 48 per cent between 1990 and1998 (Haque, 1998, p.5)*. As a result, the situation has not only hampered the overall process of national development, but has also adverselyaffected the management of the day-to-day affairs of women, like child-care/child rear<strong>in</strong>g, economic participation and social mobility. The___________________________________________________________________________________________________________*Source: Human Development Report 1998, Mahbub-ul-Haq Human Development Center, Oxford University Press, Karachi.29
lowest female literacy rate <strong>in</strong> <strong>Pakistan</strong> <strong>in</strong> district Kohistan (2.95 %), and highest <strong>in</strong> Karachi Central (73.92 %), <strong>in</strong>dicates the sharp variations ofattitude of the populace towards the education of girls. It is desirable that adult female literacy projects are <strong>in</strong>itiated by the government or NGOs<strong>in</strong> Balochistan, NWFP and the three districts of S<strong>in</strong>dh where the female literacy rate is very low. It may be synthesized from the statisticspresented here that significant reductions <strong>in</strong> adult illiteracy can be achieved most cost-effectively by allocat<strong>in</strong>g a large percentage of resourcesfor the education of women. In particular, it is argued that money spent on the education of women who are mothers, or likely to becomemothers, is more as effective as compared to the same money spent on the education of fathers. Resources <strong>in</strong>vested on the education of womencontribute not only to the development of the women themselves, but also significantly improve the participation and educational achievementof their children.The trends <strong>in</strong> respect of male and female literacy rates from 1981 to 1998 for various prov<strong>in</strong>ces of <strong>Pakistan</strong> also <strong>in</strong>dicate that the male literacyrate <strong>in</strong> 1981 for Punjab has <strong>in</strong>creased form 36.82 to 57.20 percent aga<strong>in</strong>st a rise <strong>in</strong> the female literacy rate from 16.82 to 35.10 % (i.e. more thandouble). In the S<strong>in</strong>dh Prov<strong>in</strong>ce, the male literacy rate has <strong>in</strong>creased from 39.70% <strong>in</strong> 1981 to 45.29 % <strong>in</strong> 1998, while <strong>in</strong> the same prov<strong>in</strong>ce thefemale literacy rate has <strong>in</strong>creased from 21.60 to 34.78 percent. In NWFP, the <strong>in</strong>crease <strong>in</strong> the male literacy rate has been from 25.80 % to51.39%, whereas the female literacy rate has <strong>in</strong>creased from 6.5 to 18.82 % (i.e. three times) for the same period. In Balochistan, the <strong>in</strong>creasefor the male literacy rate is from 15.2% to 34.03% and for females from 4.30 to 14.09 % (more than three times), for the same period.13.4 Participation RateTable VII and IX of Part II of this profile, and Table 14 (Part-I) given below, <strong>in</strong>dicate that participation rates <strong>in</strong> various prov<strong>in</strong>ces have asignificant co-relation with literacy rates (r = 0.93). The Table further reveals that there are 30 districts <strong>in</strong> <strong>Pakistan</strong> which have less than 20percent and only 7 districts which have more than 60 percent participation rate at primary level. All districts <strong>in</strong> the NWFP and Balochistanprov<strong>in</strong>ce have less than 60 percent participation rate. The participation rate <strong>in</strong> this section has been worked out on the basis of statistics given <strong>in</strong>the Population Census Reports. The population of 5-9 years old children and enrolment figures has been taken from District Census Reports(Table No.15) of the 1998 Population Census. In spite of the achievements, the participation rate <strong>in</strong> <strong>Pakistan</strong> did not exceed 60 percent, setaga<strong>in</strong>st the target of 100 percent net participation rate by the year 2000. This implies that 8 million children of 5-9 age group were never enrolled<strong>in</strong> school and half of the 12 million that are enrolled may drop out before complet<strong>in</strong>g-primary education. Of all the E-9 countries, <strong>Pakistan</strong> hasthe lowest survival rate at the fifth grade. At that rate, the total number of out-of-school children may reach 14 million by the year 2003.30
Table 14Participation Rate of School Go<strong>in</strong>g Children <strong>in</strong> <strong>Pakistan</strong> (by Prov<strong>in</strong>ces) 1998Area<strong>Literacy</strong>rateNumber of districts with participation rate:Lessthan20%20 to 40%40-60 % Above 60%Districts with lowest participationrate.Punjab 46.56 ---- 10 17 7 D.G.Khan (23.69 %), Rajanpur(25.01 %), Muzzarfargarh (27.49 %)S<strong>in</strong>dh 45.29 4 13 4 --- Thatta (16.29 %),Shikarpur (18.20 %),Bad<strong>in</strong> (18.35 %)NWFP 35.41 10 10 4 ---- Kohistan, (4.49 %) Shangla (6.39 %),Batagram (12.19 %)Balochistan 24.8 16 8 02 ---- Jhal Magsi (3.04 %),Kohlu (4.68 %),Dera Bughti (7.25 %)All <strong>Pakistan</strong> 43.92 30 41 27 7 Jhal Magsi (3.04 %),Kohlu (4.68 %),Dera Bughti (7.25 %)Districts with highestparticipation rate.Gujrat (74.78 %),Rawalp<strong>in</strong>di (74.55 %),Sialkot (74.09 %)Karachi Central (68.92 %),Karachi South (64.51 %),Karachi East (62.02 %)Abbotabad (48.86 %),Haripur 42.07 %), Kohat(41.80 %),Quetta(56.68%)Ziarat (42.45 %),Panjgur (39.64 %),Gujrat (74.78 %),Rawalp<strong>in</strong>di (74.55 %),Sialkot (74.09 %)Not only the low primary participation rate affects the process of promotion of literacy <strong>in</strong> <strong>Pakistan</strong>, a major problem is the retentionof children who get admitted to primary schools. The survival rate up to grade 5 <strong>in</strong> <strong>Pakistan</strong> is only 49.7% while the repetition rate foreach grade <strong>in</strong> the primary schools <strong>in</strong> <strong>Pakistan</strong> is about 15.74 %. Recent announcement of free education upto 10 th grade <strong>in</strong> all publicschool and 2% quota of free education <strong>in</strong> private schools by Punjab prov<strong>in</strong>ce may prove helpful; <strong>in</strong> enhanc<strong>in</strong>g the participation rate,survival rate and literacy rate.(Source: 1. World Education Statistics <strong>UNESCO</strong> 1998; 2. A synthesis Report of Education for All 2000 Assessment: In the South and West Asia sub-region for the Asia –Pacific Region p-58).31
All this suggests that a considerable number of non-literates, <strong>in</strong> the form of non-enrolled and dropout children, are be<strong>in</strong>g added every year to thealready massive pool of illiterates. It has been estimated that if past trends cont<strong>in</strong>ue, and no significant acceleration occurs <strong>in</strong> the rate ofpromotion of literacy, <strong>Pakistan</strong> could well end up with the dubious dist<strong>in</strong>ction of be<strong>in</strong>g home to more than 108.7 million non-literates by 2025AD, as per projection procedures adopted <strong>in</strong> National Education Policy (1998-2010), keep<strong>in</strong>g <strong>in</strong> view the population growth factor. To preventsuch a denouncement, it is important to launch, a massive national effort aimed simultaneously at the eradication of illiteracy, and Education ForAll (EFA) <strong>in</strong> accordance with the goals of Dakar Framework of Action.13.5 Lack of Institutional InfrastructureOne of the root causes of sporadic, staggered and half-hearted programmes of adult literacy <strong>in</strong> the country is that adult literacy and non-formalbasic education have not been <strong>in</strong>stitutionalized <strong>in</strong> <strong>Pakistan</strong>. There never existed permanent organizational set-up at national and prov<strong>in</strong>cial level.In 1981, a <strong>Literacy</strong> Commission was created at federal level, on adhoc basis, under development budget. Neither was this Commissionconverted <strong>in</strong>to a permanent body (i.e. under re-current budget) nor was any efforts made to staff this important organization with competentexperts and specialists. Dur<strong>in</strong>g 1982-2000, most of the time, the executive posts of the Commission were filled on political grounds but notbased on professional competence or experience of <strong>in</strong>cumbents <strong>in</strong> the field of literacy and mass education. Dur<strong>in</strong>g 1990s, Balochistan created askeleton structure <strong>in</strong> the form of Directorate of <strong>Literacy</strong> and Non-formal Education. After the abolition of National <strong>Literacy</strong> Commission atFederal level <strong>in</strong> 2001-2002, Punjab has recently started to shape literacy and mass education <strong>in</strong> an <strong>in</strong>stitutionalized form. Punjab earlierconstituted the Punjab Commission for <strong>Literacy</strong> and EFA, and now <strong>in</strong> 2003 a separate Department of <strong>Literacy</strong> and Non-formal Education headedby a separate M<strong>in</strong>ister, but it is still <strong>in</strong> its <strong>in</strong>fancy. S<strong>in</strong>dh and NWFP have not established any <strong>in</strong>stitution on a permanent basis for this importanttask. The absence of a system of equivalence of certification for Non-formal basic education <strong>in</strong>stitutions is another constra<strong>in</strong>t. The formaleducation system rema<strong>in</strong>ed reluctant to accept<strong>in</strong>g and recogniz<strong>in</strong>g any equivalence for entry <strong>in</strong>to the formal system.14. LITERACY AND FERTILITY-A STRONG CORRELATIONTable VIII-A to VIII-E <strong>in</strong> Part II of this profile and Table 15 (Part-I), shows that literacy rate has strong correlation with fertility rate. Statisticson literacy rate and fertility rate <strong>in</strong> <strong>Pakistan</strong> <strong>in</strong>dicate that the fertility rate is directly dependent on the level of education of mothers. In otherwords, the educational level of mothers <strong>in</strong>versely <strong>in</strong>fluences family size. The illiterate women <strong>in</strong> <strong>Pakistan</strong> have 4.71 children on an average,while literate and secondary school certificate holder women have 3.63 –3.21 children. This correlation is quite significant and emphasizes theimportance of literacy and school<strong>in</strong>g because studies suggests that school<strong>in</strong>g of girls also affects fertility. Table 15 reveals that among illiteratewomen, S<strong>in</strong>dh has the highest fertility rate while <strong>in</strong> the prov<strong>in</strong>ce of Punjab as well as <strong>in</strong> other prov<strong>in</strong>ces, literate women and specifically thedegree holders have the lowest fertility rate.32
Area<strong>Literacy</strong>rateTable 15Mean Fertility Rate Comparison <strong>in</strong> <strong>Pakistan</strong> (By Prov<strong>in</strong>ces)Female literacyrateAverage numbers of children born by women who are:Illiterate Literate Matric & above Degree Holders &abovePunjab 46.56 35.10 4.46 3.97 3.02 1.97S<strong>in</strong>dh 45.29 34.78 5.33 4.01 3.68 2.38NWFP 35.41 18.82 5.03 3.41 3.07 2.98Balochistan 24.83 14.09 4.13 3.11 2.91 2.12All <strong>Pakistan</strong> 43.92 31.58 4.71 3.63 3.21 2.59Source: Census Report of 1998.Table 15 also shows that <strong>in</strong> comparison to women <strong>in</strong> prov<strong>in</strong>ces, a Balochistani woman has the lowest fertility rate at all levels (except degreelevel), while a S<strong>in</strong>dhi woman has the highest. Another <strong>in</strong>terest<strong>in</strong>g outcome of the analysis of this table is that from among all the prov<strong>in</strong>ces,Balochistan has the lowest fertility rates for illiterate, literate and women educated upto the secondary level and beyond.33
Graph No.4LITERACY RATE DIRECTLY EFFECTS THE FERTILITYThe Case of S<strong>in</strong>dhAverage Number of Children6543210Illiterate Literate Matric &aboveDegreeHoldersAverage Number ofChildren34
15. DAKAR FRAMEWORK OF ACTION (2000)The Dakar Framework for Action provided a guidel<strong>in</strong>e for enhanc<strong>in</strong>g literacy by declar<strong>in</strong>g that, education is a fundamental human right. “It isthe key to susta<strong>in</strong>able development and peace and stability with<strong>in</strong> and among countries, and thus an <strong>in</strong>dispensable means for effectiveparticipation <strong>in</strong> the societies and economies of the twenty-first century, which are affected by rapid globalization”. The Declaration furtheraffirms that “political will and stronger national leadership” are needed for the effective and successful implementation of National Plans <strong>in</strong> eachof the countries concerned. However, political will must be underp<strong>in</strong>ned by resources. The <strong>in</strong>ternational community acknowledges that manycountries currently lack the resources to achieve education for all with<strong>in</strong> an acceptable time frame. New f<strong>in</strong>ancial resources preferably <strong>in</strong> theform of grants and concessional assistance, must therefore be mobilized by bilateral and multilateral fund<strong>in</strong>g agencies, <strong>in</strong>clud<strong>in</strong>g the World Bankand regional development banks, and the private sector”.15.1 Six Goals of Dakar Framework of Action for EFA:1. Expand<strong>in</strong>g and improv<strong>in</strong>g comprehensive early childhood care and education, especially for the most vulnerable and disadvantaged children.2. Ensur<strong>in</strong>g that by 2015 all children, particularly girls, <strong>in</strong> difficult circumstances and those belong<strong>in</strong>g to ethnic m<strong>in</strong>orities, have access to andcomplete free and compulsory primary education of good quality;3. Ensur<strong>in</strong>g that the learn<strong>in</strong>g needs of all young people and adults are met through equitable access to appropriate learn<strong>in</strong>g of life skillsprogrammes;4. Achiev<strong>in</strong>g a 50 percent improvement <strong>in</strong> levels of adult literacy by 2015, especially for women, and equitable access to basic and cont<strong>in</strong>u<strong>in</strong>geducation for all adults;5. Elim<strong>in</strong>at<strong>in</strong>g gender disparities <strong>in</strong> primary and secondary education by 2005, and achiev<strong>in</strong>g gender equality <strong>in</strong> education by 2015, with afocus on ensur<strong>in</strong>g girls’ full and equal access to and achievement <strong>in</strong> basic education of good quality;6. Improv<strong>in</strong>g all aspects of the quality of education and ensur<strong>in</strong>g excellence of all so that recognized and measurable learn<strong>in</strong>g outcomes areachieved by all, especially <strong>in</strong> literacy, numeracy and essential life skills.35
16. LITERACY AND NATIONAL PLAN OF ACTION FOR EFA (2001-2015)Consequent upon the World Conference on Education For All (Jomtien, Thailand 1990) and as a follow up of Dakar Framework of Action 2000,M<strong>in</strong>istry of Education, Govt. of <strong>Pakistan</strong>, had developed a National Plan of Action for EFA (2001-2015). Thrust areas of NPA for EFA <strong>in</strong>cludeprimary education, adult literacy, and early childhood education. The NPA for EFA has been focused to achieve the follow<strong>in</strong>g ma<strong>in</strong> objectives:1. To reach the disadvantaged population groups <strong>in</strong> rural and urban areas with emphasis on out of school girls, and illiterate women.2. To promote community participation and ownership of basic education programs at grassroots level.3. To improve the relevance and quality of basic education through enhanc<strong>in</strong>g learn<strong>in</strong>g achievements of the children, youth and adults.The NPA (2001-2015) derives its roots from Article 37-B of “Constitution of <strong>Pakistan</strong>” which states that State shall “remove illiteracy andprovide free and compulsory secondary education with<strong>in</strong> m<strong>in</strong>imum possible period”. In addition to the Constitution of <strong>Pakistan</strong>, the NPA forEFA derives its directions from major policy documents of <strong>Pakistan</strong>, like National Education Policy 1998-2010, Education Sector Reforms(ESR), and Education Sector Development Program under Perspective Development Plan (2001-2011) etc.The NPA for EFA (2001-2015) aims to:i. Increase literacy rate upto 86 %.ii. Impart literacy skill to 81 million illiterate adults.iii. A total of 525,000 literacy courses or classes/cycles will be organized dur<strong>in</strong>g 2001-2015.iv. About 90,000 Non Formal Basic Education schools and 110,000 Vocational/Trade Centres will be opened.v. An estimated amount of Rs.180.0 Billion will be needed for the component of Adult <strong>Literacy</strong>.The National Plan of Action for EFA (2001-2015) was f<strong>in</strong>alized and launched on 3 rd April 2003, by the M<strong>in</strong>istry of Education. The actualimplementation of NPA will however be l<strong>in</strong>ked with the provision of substantial resources needed for this purpose. It is estimated that anadditional amount of Rs.430 billion will be needed to achieve EFA targets. The NPA envisages to mobilize Rs.178 billion from nationalresources, and there exist a f<strong>in</strong>ance gap of Rs.253 billion. Now the question arises that who will fill this gap ? In case the Government of<strong>Pakistan</strong> can not succeed <strong>in</strong> mobiliz<strong>in</strong>g additional resources, this NPA will merely rema<strong>in</strong> a plann<strong>in</strong>g document, and will not transform <strong>in</strong>toreality.36
17. UNITED NATIONS LITERACY DECADE – A NEW GLOBAL THRUSTUnited Nations <strong>Literacy</strong> Decade (UNLD, 2003-2012) was launched jo<strong>in</strong>tly by UN Secretary General Mr. Kofi Annan, and Director General<strong>UNESCO</strong>, Mr. Koïchiro Matsuura, <strong>in</strong> February 2003. The UN General Assembly at its 56 th session proclaimed the United Nations <strong>Literacy</strong>Decade for the period towards 2003-2012.<strong>Literacy</strong> is Crucial“literacy is crucial to the acquisition, by every child, youth and adult, of essential life skills that enable them to address the challenges they canface <strong>in</strong> life and represents an essential step <strong>in</strong> basic education, which is an <strong>in</strong>dispensable means for effective participation <strong>in</strong> the societies andeconomies of the twenty first century…… literacy for all is at heart of basic education for all and creat<strong>in</strong>g literate environments and societies isessential for achiev<strong>in</strong>g the goals of eradicat<strong>in</strong>g poverty, reduc<strong>in</strong>g child mortality, curb<strong>in</strong>g population growth, achiev<strong>in</strong>g gender equality andensur<strong>in</strong>g susta<strong>in</strong>able development, peace and democracy”.(Un General Assembly Resolution – 56 th Session)The United Nations <strong>Literacy</strong> Decade (2003-2012) aims to extend the use of literacy to those who do not currently have access to it. Over 861million adults are <strong>in</strong> that position, and over 113 million children are not <strong>in</strong> school and therefore not ga<strong>in</strong><strong>in</strong>g access to literacy either. The Decadewill focus on the needs of adults with the goal that people everywhere should be able to use literacy to communicate with<strong>in</strong> their owncommunity, <strong>in</strong> the wider society and beyond. <strong>Literacy</strong> efforts have so far failed to reach the poorest and most marg<strong>in</strong>alised groups of people –the Decade will particularly address such populations, under the banner of <strong>Literacy</strong> for all: voice for all, learn<strong>in</strong>g for all.The outcome of the Decade will be locally susta<strong>in</strong>able literate environments. These environments will give people opportunities to express theirideas and views, engage <strong>in</strong> effective learn<strong>in</strong>g, participate <strong>in</strong> the written communication which characterises democratic societies, and exchangeknowledge with others. This will <strong>in</strong>clude <strong>in</strong>creas<strong>in</strong>gly the use of electronic media and <strong>in</strong>formation technologies, both as a means of selfexpressionand for access<strong>in</strong>g and assess<strong>in</strong>g the vast stores of knowledge available today.<strong>Literacy</strong> is a plural concept, with diverse literacies shaped by their use <strong>in</strong> particular contexts. The Decade will work to promote literacies acrossthe full range of purposes, contexts, languages, and modes of acquisition which communities of learners identify for themselves.37
17.1 Why has it been established?There are three reasons which justify the Decade:• One <strong>in</strong> five people over the age of 15 cannot communicate through literacy or take any part <strong>in</strong> the surround<strong>in</strong>g literate environment. TheEFA Global Monitor<strong>in</strong>g Report 2002 spelled out the scope of the challenge – over 862 million people without access to literacy. Two thirdsof these people are women, with illiteracy thus add<strong>in</strong>g to the deprivation and subord<strong>in</strong>ation to which women are already subject. In an<strong>in</strong>terconnected world where literacy is a key to communication such exclusion is unacceptable.• <strong>Literacy</strong> is a human right. Basic education, with<strong>in</strong> which literacy is the key learn<strong>in</strong>g tool, was recognised as a human right over 50 yearsago, <strong>in</strong> the Universal Declaration of Human Rights. It is a scandal that this right cont<strong>in</strong>ues to be violated for such a large proportion ofhumanity.• <strong>Literacy</strong> efforts up to now have proved <strong>in</strong>adequate, at national and <strong>in</strong>ternational levels. The Decade is an opportunity to make a susta<strong>in</strong>edcollective effort which will go beyond one-shot programmes or campaigns.The <strong>Literacy</strong> Decade is an <strong>in</strong>itiative of the United Nations General Assembly, adopted unanimously <strong>in</strong> a resolution of December 2001. Thus itexpresses strongly the collective will of the <strong>in</strong>ternational community, both those who face a big literacy challenge and those who may be <strong>in</strong> aposition to give assistance <strong>in</strong> meet<strong>in</strong>g it. The nations of the world recognise that the promotion of literacy is <strong>in</strong> the <strong>in</strong>terest of all, as part ofefforts towards peace, respect and exchange <strong>in</strong> a globalis<strong>in</strong>g world.The <strong>Literacy</strong> Decade is also part of broader <strong>in</strong>ternational work <strong>in</strong> education and development. The Education for All (EFA) goal of <strong>in</strong>creas<strong>in</strong>gliteracy rates by 50% by 2015 provides the overall target for the Decade, and the Millennium Development Goals (MDG) set the Decade <strong>in</strong> thecontext of poverty reduction. <strong>Literacy</strong> promotion is at the heart of both EFA and MDG goals.17.2 How will it make a difference?The International Plan of Action for the <strong>Literacy</strong> Decade proposes six l<strong>in</strong>es of action to implement literacy for all:Policy change: policies must provide a framework for local participation <strong>in</strong> literacy, <strong>in</strong>clud<strong>in</strong>g multil<strong>in</strong>gual approaches and freedom ofexpression. National policy environments must l<strong>in</strong>k literacy promotion with strategies of poverty reduction and with programmes <strong>in</strong> agriculture,health, HIV/AIDS prevention, conflict resolution and other social concerns.38
Flexible programmes: diverse and mean<strong>in</strong>gful literacies require flexible modes of acquisition and delivery, us<strong>in</strong>g appropriate materials andlanguages, focus<strong>in</strong>g on relevant purposes, and generat<strong>in</strong>g <strong>in</strong>terest<strong>in</strong>g, culturally relevant and gender-sensitive materials at the local level. Welltra<strong>in</strong>ednon-formal facilitators will respect learners’ needs. Programmes should enable learners to move on to more formal learn<strong>in</strong>gopportunities.Capacity-build<strong>in</strong>g: as well as <strong>in</strong>creas<strong>in</strong>g and improv<strong>in</strong>g the tra<strong>in</strong><strong>in</strong>g of literacy facilitators, capacity-build<strong>in</strong>g will focus on areas which needstrengthen<strong>in</strong>g <strong>in</strong> particular countries. These may <strong>in</strong>clude the plann<strong>in</strong>g and management of programmes, research and documentation, materialproduction and curriculum design.Research: new policies for literacy will be most effective when they are based on the results of empirical research. This will answer questionssuch as: what is the long-term impact of literacy? How can local communities better participate? What is the extent of civil society engagement<strong>in</strong> literacy? Studies, databases and papers will make the outcomes of this research widely available.Community participation: strong community ownership of the purposes and processes of literacy will result <strong>in</strong> its effective use. This requiresgood communication between government and communities, <strong>in</strong>ter-community networks, community learn<strong>in</strong>g centres and other ways of ensur<strong>in</strong>gthat literacies are relevant and useful to people <strong>in</strong> their daily lives and serve their aspirations.Monitor<strong>in</strong>g and evaluation: better literacy <strong>in</strong>dicators are necessary to show what progress is made dur<strong>in</strong>g the Decade, both <strong>in</strong> terms of literacyrates and numbers, and <strong>in</strong> terms of the impact of literacy. <strong>UNESCO</strong> will work with its <strong>in</strong>stitutes and its partners to f<strong>in</strong>d improved ways ofmeasur<strong>in</strong>g literacy, <strong>in</strong> local contexts and worldwide.Who will be <strong>in</strong>volved? A key feature of the Decade will be the prom<strong>in</strong>ent role which learners take <strong>in</strong> the design of literacy strategies for theirown situations. Standardised, one-size-fits-all literacy programmes have not on the whole been effective or led to susta<strong>in</strong>able literateenvironments. Other partners should participate <strong>in</strong> literacy promotion on the understand<strong>in</strong>g that they will work <strong>in</strong> respectful ways with learnersand their communities, jo<strong>in</strong>tly negotiat<strong>in</strong>g strategies, methods and approaches. Community-based organisations, NGOs and civil society willprovide channels for collective action. Governments will have the responsibility to work closely with them, negotiat<strong>in</strong>g resource provision:tra<strong>in</strong><strong>in</strong>g <strong>in</strong>put, f<strong>in</strong>ancial support, <strong>in</strong>stitutional recognition and validation. At the <strong>in</strong>ternational level, the UN General Assembly asked <strong>UNESCO</strong> totake on the coord<strong>in</strong>at<strong>in</strong>g role, br<strong>in</strong>g<strong>in</strong>g partners together for jo<strong>in</strong>t action and policy debate. The whole of the UN system is implicated, each partpromot<strong>in</strong>g literacy components with<strong>in</strong> its own area of specialisation. International civil society networks have a responsibility both to sensitisetheir own members and to raise the awareness of governments and the general public about literacy.39
Table 16 – Focus Areas and Key Strategies of UNLDFocus AreasKey Strategies of UNLD1. Policy and plann<strong>in</strong>g: • plan for the <strong>Literacy</strong> Decade through <strong>in</strong>corporat<strong>in</strong>g a <strong>Literacy</strong> for All component <strong>in</strong> Educationfor All plans, with a realistic time frame for the entire 10-year period of the <strong>Literacy</strong> Decade2. Advocacy: • draw up plans for advocacy actions at all levels <strong>in</strong> cooperation with all stakeholders, such asgovernment functionaries, NGOs, civil society, <strong>in</strong>stitutions, fund<strong>in</strong>g agencies, localcommunities, local governments and potential learners3. Capacity-build<strong>in</strong>g: • develop tra<strong>in</strong><strong>in</strong>g progrmames for all categories of stakeholders <strong>in</strong> the areas of plann<strong>in</strong>g,research, tra<strong>in</strong><strong>in</strong>g, curriculum development, materials development, monitor<strong>in</strong>g andevaluation4. Partnership: • build effective partnerships with other m<strong>in</strong>istries, NGOs, civil society, <strong>in</strong>stitutions,universities, the private sector, fund<strong>in</strong>g agencies, <strong>in</strong>ternational agencies, United Nationsagencies and the media5. Research: • carry out basel<strong>in</strong>e study for priority identification; support action research for develop<strong>in</strong>galternative models and process research to review programme implementation6. Monitor<strong>in</strong>g and evaluation: • establish and activate realistic monitor<strong>in</strong>g and evaluation mechanisms; develop databases andkeep track of current status of literacy7. Celebration: • plan regular celebrations of the <strong>Literacy</strong> Decade on International <strong>Literacy</strong> Day <strong>in</strong> order toma<strong>in</strong>ta<strong>in</strong> momentum and commitment; plan regular media events as part of the celebrations8. Resource support: • ensure adequate human and f<strong>in</strong>ancial resources.17.3 <strong>Literacy</strong> for All: the visionIn the rapidly chang<strong>in</strong>g world of today’s knowledge society, with the progressive use of newer and <strong>in</strong>novative technological means ofcommunication, literacy requirements cont<strong>in</strong>ue to expand regularly. In order to survive <strong>in</strong> today’s globalized world, it has become necessary forall people to learn new literacies and develop the ability to locate, evaluate and effectively use <strong>in</strong>formation <strong>in</strong> multiple manners. As recalled <strong>in</strong>paragraph 8 of the draft proposal and plan for a United Nations literacy decade, “<strong>Literacy</strong> policies and programmes today require go<strong>in</strong>g beyondthe limited view of literacy that has dom<strong>in</strong>ated <strong>in</strong> the past. <strong>Literacy</strong> for all requires a reviewed vision of literacy …..”.40
The vision for the <strong>Literacy</strong> Decade situates <strong>Literacy</strong> for All at the heart of Education for All. <strong>Literacy</strong> is central to all levels of education,especially basic education, through all delivery modes – formal, non-formal and <strong>in</strong>formal. <strong>Literacy</strong> for All encompasses the educational needsof all human be<strong>in</strong>gs <strong>in</strong> all sett<strong>in</strong>gs and contexts, <strong>in</strong> the North and the South, the urban and the rural, those <strong>in</strong> school and those out-of-school,adults and children, boys and girls, and men and women.<strong>Literacy</strong> for All has to address the literacy needs of the <strong>in</strong>dividual as well as the family, literacy <strong>in</strong> the workplace and <strong>in</strong> the community, as wellas <strong>in</strong> society and <strong>in</strong> the nation, <strong>in</strong> tune with the goals of economic, social and cultural development of all people <strong>in</strong> all countries. <strong>Literacy</strong> for Allwill be effectively achieved only when it is planned and implemented <strong>in</strong> local contexts of language and culture, ensur<strong>in</strong>g gender equity andequality, fulfill<strong>in</strong>g learn<strong>in</strong>g aspirations of local communities and groups of people. <strong>Literacy</strong> must be related to various dimensions of personaland social life, as well as to development. Thus, literacy efforts must be related to a comprehensive package of economic, social and culturalpolicies cutt<strong>in</strong>g across multiple sectors. <strong>Literacy</strong> policies must also recognize the significance of the mother tongue <strong>in</strong> acquir<strong>in</strong>g literacy andprovide for literacy <strong>in</strong> multiple languages wherever necessary.17.4 Implementation at the National levelThe State must play the central and crucial role <strong>in</strong> plann<strong>in</strong>g, coord<strong>in</strong>at<strong>in</strong>g, implement<strong>in</strong>g and f<strong>in</strong>anc<strong>in</strong>g programmes for <strong>Literacy</strong> for All. In orderto fulfill this role, the State must build symbiotic partnership with a variety of stakeholders. It is therefore necessary to mobilize the localcommunities, NGOs, teachers’ associations and workers’ unions, universities and research <strong>in</strong>stitutions, the private sector and other stakeholdersto contribute to and participate <strong>in</strong> all stage of literacy programmes.The successful implementation of the <strong>Literacy</strong> Decade requires that <strong>Literacy</strong> for All be the central focus of all Education for All plans andprogrammes. Thus, it is necessary to remember that a plan for the <strong>Literacy</strong> Decade and its implementation at the national level must be<strong>in</strong>corporated <strong>in</strong> the national Education for All plan and its implementation. Where the national Education for All plan has already beenformulated, the <strong>Literacy</strong> for All component can be added as a supplement. Where the national Education for All plan is be<strong>in</strong>g f<strong>in</strong>alized, it wouldbe appropriate to <strong>in</strong>corporate the <strong>Literacy</strong> for All component with<strong>in</strong> it. In the process of <strong>in</strong>corporat<strong>in</strong>g a <strong>Literacy</strong> for All component <strong>in</strong> theEducation for All plans, a checklist of questions and key elements can be a useful guide.The <strong>Literacy</strong> Decade must be viewed as a unity, not as a sum of 10 successive s<strong>in</strong>gle years. Every country, therefore, must plan with<strong>in</strong> its own10-year perspective for implement<strong>in</strong>g <strong>Literacy</strong> for All. In so do<strong>in</strong>g, attention should be paid to ensur<strong>in</strong>g that the <strong>in</strong>itial period of the Decade isdevoted to the creation of comprehensive and reliable databases on literacy.41
17.5 Resource MobilizationThe <strong>Literacy</strong> for All <strong>in</strong>tervention must not suffer or languish on account of <strong>in</strong>sufficient fund<strong>in</strong>g. Governments need to mobilize adequateresources <strong>in</strong> support of <strong>Literacy</strong> for All. The follow<strong>in</strong>g strategies may be adopted at the national level:a) Incorporate the <strong>Literacy</strong> for All component across the budget for all levels of education, from basic to higher education;b) Attract additional fund<strong>in</strong>g through coord<strong>in</strong>ation and resource shar<strong>in</strong>g with other m<strong>in</strong>istries and departments where literacy is acomponent of programmes of advocacy, extension education and poverty reduction;c) Mobilize the private sector and civil society to support the <strong>Literacy</strong> for All programme.At the <strong>in</strong>ternational level, successful resource mobilization will require:a) Ongo<strong>in</strong>g consultation among United Nations agencies <strong>in</strong> support of <strong>Literacy</strong> for All as a component of Education for All;b) Involvement of bilateral agencies for their f<strong>in</strong>ancial support and commitment;c) Mobilization of <strong>in</strong>ternational civil society <strong>in</strong> support of <strong>Literacy</strong> for All.A special role should be given to the World Bank with the task of <strong>in</strong>tegrat<strong>in</strong>g the Decade <strong>in</strong> Poverty Reduction Strategy Papers and prepar<strong>in</strong>g aspecial fund<strong>in</strong>g chapter with Education for All. At the regional level, it is also possible to attract f<strong>in</strong>ancial resources from regional organizationsand regional banks. In order to attract <strong>in</strong>ternational fund<strong>in</strong>g, it is essential to formulate credible projects based on research, justify<strong>in</strong>g <strong>in</strong>vestment<strong>in</strong> literacy. These projects must also have carefully worked out costs and effects based on actual studies.17.6 International support and coord<strong>in</strong>ationThe United Nations system as a whole sets the promotion of literacy <strong>in</strong> the context of human rights, seen as <strong>in</strong>divisible and <strong>in</strong>terdependent. Theright to education, enshr<strong>in</strong>ed <strong>in</strong> the Universal Declaration of Human Rights, of which literacy is both a crucial element and a tool, connects withthe right to equality (especially gender equality), to development, to health and to freedom of expression, United Nations agencies as well as theWorld Bank engaged <strong>in</strong> these various sectors recognize these connections and frequently <strong>in</strong>clude literacy as one of the problems to be addressedand solved <strong>in</strong> conjunction with the fulfillment of other rights. As the coord<strong>in</strong>at<strong>in</strong>g agency at the <strong>in</strong>ternational level for the achievement of thegoals of the Dakar Framework for Action for Education for All, as well as for the <strong>Literacy</strong> Decade, <strong>UNESCO</strong> will work with<strong>in</strong> the Education forAll coord<strong>in</strong>ation mechanism already established, through which it will identify literacy components <strong>in</strong> the ongo<strong>in</strong>g development programmes ofvarious <strong>in</strong>ternational and bilateral agencies and forge jo<strong>in</strong>t mobilization and maximum use of resources among these agencies <strong>in</strong> support of theDecade.42
In consultation with the relevant United Nations agencies, <strong>UNESCO</strong> will work towards creat<strong>in</strong>g mean<strong>in</strong>gful and goal-oriented partnerships <strong>in</strong>order to encourage <strong>in</strong>clusive plann<strong>in</strong>g and implementation of the <strong>Literacy</strong> Decade. Such a partnership will ensure efficient delivery of different<strong>in</strong>puts provided by the United Nations agencies. A key partner will be the United Nations Children’s Fund (UNICEF), the lead agency <strong>in</strong> theUnited Nations Girls’ Education Initiative. The World Bank will work with <strong>UNESCO</strong> <strong>in</strong> literacy assessment and cost and f<strong>in</strong>anc<strong>in</strong>g analysis forliteracy, for which OECD and UNICEF can also be key partners. <strong>UNESCO</strong> will facilitate cooperation among other United Nations agencieswhose mandates and programme are strongly relevant to achiev<strong>in</strong>g <strong>Literacy</strong> for All, such as those listed below:• Food and Agriculture Organization of the United Nations: rural development, agricultural extension programmes.• International Labour Organization: learn<strong>in</strong>g and tra<strong>in</strong><strong>in</strong>g for work, elim<strong>in</strong>ation of child labour.• Office of the United Nations High Commissioner for Human Rights: right to education, gender equality, right to development, rightto freedom of expression, <strong>in</strong>digenous peoples (languages, cultures, knowledge).• Jo<strong>in</strong>t United Nations Programme on HIV/AIDS: education about HIV/AIDS.• United Nations Development Programme: rural development, participatory citizenship, democratic governance, poverty reduction,susta<strong>in</strong>able livelihood.• United Nations Population Fund: teacher tra<strong>in</strong><strong>in</strong>g and curriculum development regard<strong>in</strong>g reproductive health and population.• Office of the United Nations Higher Commissioner for Refugees: education as a key issue <strong>in</strong> support<strong>in</strong>g refugee children.• World Food Programme: Food for Education.• World Health Organization: Health for All, primary healthcare education, access to health <strong>in</strong>formation, safe motherhood, HIV/AIDSprevention.However, political will and commitment at all levels, a broad coord<strong>in</strong>ated, multidiscipl<strong>in</strong>ary efforts to reach the unreached, consistent andcoherent policy, susta<strong>in</strong>able resource mobilization, encourag<strong>in</strong>g progress of literacy teachers and prioritiz<strong>in</strong>g adult literacy <strong>in</strong> formal educationsystem are suggested as core strategies for <strong>Pakistan</strong> to achieve the targets of UNLD (2003-2012) to maximum possible extent.In <strong>Pakistan</strong>, <strong>UNESCO</strong>, JICA and M<strong>in</strong>istry of Education have jo<strong>in</strong>ed hands to prepare a Strategic Framework of Action for UNLD. It is hopedthat this Strategic Framework of Action will mobilize support required for implementation of Adult <strong>Literacy</strong> component of NPA (2001-2015)and achievement of EFA goals by <strong>Pakistan</strong>.43
PART – IIStatistical Tables(Based on 1998 Census data and projections)44
Table I<strong>Literacy</strong> Rates (10 Years & above) of <strong>Pakistan</strong> by Sex1972, 1981,1998, 2001, 2003, 2005 and 2008(<strong>Literacy</strong> Rates <strong>in</strong> Percentage)Years Both Sexes Male Female1972 21.70 30.20 11.601981 26.20 35.10 16.001998 43.92 54.43 31.582001 (Estimated) 48.11 58.81 35.612003 (Estimated) 51.13 61.93 38.572005 (Estimated) 54.33 65.21 41.782008 (Estimated) 59.52 70.46 47.11N.B: projections are based upon the follow<strong>in</strong>g growth rates.Parameter Both Sexes Male FemaleGrowth Rate 3.0855 2.6143 4.0807
Table II<strong>Literacy</strong> Rates (10 Years & above) of <strong>Pakistan</strong> by Urban & Rural Areas1972, 1981, 1998, 2001, 2003, 2005 and 2008(<strong>Literacy</strong> Rates <strong>in</strong> Percentage)Years All Areas Urban Rural1972 21.70 41.50 14.301981 26.20 47.10 17.301998 43.92 63.08 33.642001 (Estimated) 48.11 66.42 37.832003 (Estimated) 51.13 68.74 40.912005 (Estimated) 54.33 71.14 44.242008 (Estimated) 59.52 74.91 49.74N.B: projections are based upon the follow<strong>in</strong>g growth rates.Parameter All Areas Urban RuralGrowth Rate 3.0855 1.7333 3.9893
Table III<strong>Literacy</strong> Rates (10 Years & above) by Sex & Urban and Rural Areas of <strong>Pakistan</strong>1972, 1981, 1998, 2001, 2003, 2005 and 2008<strong>Literacy</strong> Rates <strong>in</strong> PercentageYearsAll Areas Urban RuralBoth Sexes Male Female Both Sexes Male Female Both Sexes Male Female1972 21.70 30.20 11.60 41.50 49.90 30.90 14.30 22.60 4.701981 26.20 35.10 16.00 47.10 55.30 37.30 17.30 26.20 7.301998 43.92 54.81 32.02 63.08 70.00 55.16 33.64 46.38 20.092001 (Estimated) 48.11 59.29 36.19 66.42 72.97 59.10 37.83 51.30 24.022003 (Estimated) 51.13 62.49 39.27 68.74 75.03 61.89 40.91 54.86 27.062005 (Estimated) 54.33 65.85 42.61 71.14 77.14 64.80 44.24 58.68 30.482008 (Estimated) 59.52 71.24 48.16 74.91 80.41 69.43 49.74 64.90 36.44N.B: projections are based upon the follow<strong>in</strong>g growth rates.ParameterAll Areas Urban RuralBoth Sexes Male Female Both Sexes Male Female Both Sexes Male FemaleGrowth Rate 3.0855 2.6563 4.1654 1.7333 1.3963 2.3281 3.9893 3.4165 6.1359
Growth RateYearsAll Areas Urban RuralBoth Sexes Male Female Both Sexes Male Female Both Sexes Male Female1998 3.0855 2.6563 4.1654 1.7333 1.3963 2.3281 3.9893 3.4165 6.1359
PROVINCE Years Both Sexes Male FemalePUNJABTable IV<strong>Literacy</strong> Rates (10 Years & above) of <strong>Pakistan</strong> by Sex and Prov<strong>in</strong>ce1972, 1981,1998, 2001, 2003, 2005 and 2008(<strong>Literacy</strong> Rates <strong>in</strong> Percentages)All Areas1972 20.70 29.10 10.101981 27.40 36.80 16.801998 46.56 57.20 35.102001 (Estimated) 51.13 61.83 39.972003 (Estimated) 54.42 65.12 43.592005 (Estimated) 57.92 68.59 47.542008 (Estimated) 63.60 74.14 54.14SINDH1972 30.20 39.10 19.201981 31.50 39.70 21.601998 45.29 54.50 34.782001 (Estimated) 48.29 57.63 37.832003 (Estimated) 50.39 59.82 40.012005 (Estimated) 52.59 62.10 42.322008 (Estimated) 56.07 65.67 46.03
N.W.F.P.1972 15.50 23.10 4.701981 16.70 25.80 6.501998 35.41 51.39 18.822001 (Estimated) 40.43 58.03 22.702003 (Estimated) 44.17 62.94 25.732005 (Estimated) 48.25 68.25 29.162008 (Estimated) 55.10 77.07 35.17BALOCHISTAN1972 10.10 14.80 4.30PunjabS<strong>in</strong>dhN.W.F.P.Balochistan1981 10.30 15.20 4.301998 24.83 34.03 14.092001 (Estimated) 29.00 39.23 17.372003 (Estimated) 32.16 43.13 19.982005 (Estimated) 35.67 47.42 22.972008 (Estimated) 41.66 54.67 28.32N.B: projections are based upon the follow<strong>in</strong>g growth rates.Growth RateAll AreasBoth Sexes Male Female3.1681 2.6284 4.42952.1588 1.8813 2.84174.5203 4.1366 6.45335.3122 4.8550 7.2309
Growth RatePUNJAB 1998 3.1680 2.6284 4.4295SIND 1998 2.1588 1.8813 2.8417N.W.F.P. 1998 4.5203 4.1366 6.4533BALOCHISTAN 1998 5.3122 4.8550 7.2309
Table V<strong>Literacy</strong> Rates (10 Years & above) of <strong>Pakistan</strong> by Urban, Rural,Sex and Prov<strong>in</strong>ce1981,1998,2001, 2003, 2005 and 2008PUNJABSINDHN.W.F.P.(<strong>Literacy</strong> Rates <strong>in</strong> Percentages)All Areas Urban RuralYears Both Sexes Male Female Both Sexes Male Female Both Sexes Male Female1981 27.40 36.80 16.80 46.70 55.20 36.70 20.00 29.60 9.401998 46.56 57.20 35.10 64.48 70.94 57.23 37.95 50.40 24.78(Estimated) 2001 51.13 61.83 39.97 68.26 74.15 61.90 42.49 55.36 29.40(Estimated) 2003 54.42 65.12 43.59 70.90 76.37 65.22 45.82 58.94 32.95(Estimated) 2005 57.92 68.59 47.54 73.64 78.66 68.72 49.40 62.75 36.94(Estimated) 2008 63.60 74.14 54.14 77.95 82.22 74.32 55.32 68.93 43.831981 31.50 39.70 21.60 50.80 57.80 42.20 15.60 24.50 5.201998 45.29 54.50 34.78 63.72 69.75 56.66 25.73 37.89 12.23(Estimated) 2001 48.29 57.63 37.83 66.32 72.10 59.68 28.11 40.92 14.22(Estimated) 2003 50.39 59.82 40.01 68.11 73.71 61.79 29.81 43.07 15.73(Estimated) 2005 52.59 62.10 42.32 69.95 75.36 63.97 31.62 45.34 17.39(Estimated) 2008 56.07 65.67 46.03 72.81 77.90 67.38 34.54 48.97 20.231981 16.70 25.90 6.50 35.80 47.00 21.90 13.20 21.70 3.801998 35.41 51.39 18.82 54.33 67.48 39.10 31.29 47.65 14.69(Estimated) 2001 40.43 58.00 22.70 58.48 71.93 43.31 36.44 54.75 18.65(Estimated) 2003 44.17 62.86 25.73 61.42 75.05 46.37 40.33 60.05 21.86(Estimated) 2005 48.25 68.14 29.16 64.51 78.32 49.64 44.64 65.88 25.63(Estimated) 2008 55.10 76.90 35.17 69.44 83.48 54.99 51.99 75.68 32.54
BALOCHISTAN1981 10.30 15.20 4.30 32.20 42.40 18.50 6.20 9.80 1.801998 24.83 34.03 14.09 46.86 58.14 33.08 17.47 25.75 7.94(Estimated) 2001 29.00 39.23 17.37 50.07 61.47 36.65 20.97 30.54 10.32(Estimated) 2003 32.16 43.13 19.98 52.33 63.80 39.25 23.69 34.21 12.29(Estimated) 2005 35.67 47.42 22.97 54.69 66.21 42.02 26.76 38.33 14.63(Estimated) 2008 41.66 54.67 28.32 58.43 70.00 46.56 32.13 45.45 19.01N.B: projections are based upon the follow<strong>in</strong>g growth rates.Growth RatePUNJABSINDHN.W.F.P.BALOCHISTANAll Areas Urban RuralBoth Sexes Male Female Both Sexes Male Female Both Sexes Male Female3.1681 2.6284 4.4295 1.9158 1.4867 2.6481 3.8398 3.1802 5.86762.1588 1.8813 2.8417 1.3419 1.1116 1.7483 2.9872 2.5981 5.15954.5203 4.1129 6.4533 2.4841 2.1503 3.4684 5.2081 4.7356 8.27885.3122 4.8550 7.2309 2.2316 1.8744 3.4777 6.2832 5.8472 9.1226Growth RatePUNJAB 1998 3.1680 2.6284 4.4295 1.9158 1.4867 2.6480 3.8398 3.1802 5.8676SIND 1998 2.1588 1.8813 2.8417 1.3419 1.1116 1.7483 2.9872 2.5980 5.1595N.W.F.P. 1998 4.5203 4.1129 6.4533 2.4840 2.1503 3.4684 5.2080 4.7356 8.2788BALOCHISTAN 1998 5.3122 4.8550 7.2309 2.2316 1.8744 3.4777 6.2832 5.8472 9.1226
Table VI-ADistrict-wise Rate (10 Years & above) of <strong>Literacy</strong> by Sex & Urban andRural areas of PunjabPunjab(<strong>Literacy</strong> Rates <strong>in</strong> Percentages)All AreasUrbanRuralProv<strong>in</strong>ce/District Year Both Male Female Both Male Female Both Male FemaleSexesSexesSexesAttock 1981 24.10 37.00 11.10 48.50 59.70 34.60 20.20 32.90 7.801998 49.27 66.94 31.99 69.41 80.83 56.32 43.65 62.66 25.872001 55.90 74.32 38.56 73.94 85.27 61.38 50.01 70.20 31.972003 60.80 79.69 43.67 77.13 88.36 65.00 54.75 75.73 36.812005 66.14 85.45 49.47 80.45 91.57 68.83 59.95 81.70 42.382008 75.04 94.87 59.62 85.70 96.60 75.01 68.68 91.53 52.37GROWTH RATE 4.2962 3.5490 6.4243 2.1310 1.7984 2.9073 4.6368 3.8624 7.3074Rawalp<strong>in</strong>di 1981 46.60 60.80 31.30 56.80 66.40 45.20 37.20 55.00 20.001998 70.45 81.19 59.18 76.01 82.21 68.84 63.94 79.86 49.022001 75.78 85.44 66.22 80.02 85.37 74.15 70.35 85.29 57.422003 79.56 88.40 71.37 82.81 87.54 77.91 74.98 89.12 63.812005 83.52 91.46 76.93 85.70 89.77 81.86 79.92 93.12 70.912008 89.84 96.25 86.08 90.22 93.22 88.17 87.93 99.45 83.06GROWTH RATE 2.4610 1.7157 3.8179 1.7285 1.2643 2.5055 3.2374 2.2180 5.4150Jhelum 1981 39.97 53.39 24.73 55.90 63.70 46.70 35.10 50.80 20.401998 63.92 77.66 50.47 77.21 84.85 68.00 58.55 74.31 44.382001 69.44 82.97 57.24 81.74 89.25 72.66 64.08 79.47 50.902003 73.39 86.71 62.25 84.90 92.32 75.95 68.06 83.11 55.782005 77.55 90.62 67.70 88.19 95.48 79.38 72.28 86.91 61.122008 84.25 96.81 76.78 93.36 100.44 84.82 79.11 92.94 70.11GROWTH RATE 2.8003 2.2287 4.2855 1.9180 1.7008 2.2350 3.0556 2.2626 4.6782Chakwal 1981 39.69 54.63 25.66 56.60 63.75 49.15 37.44 53.34 22.711998 56.72 73.42 42.15 70.72 79.82 61.81 54.75 72.45 39.552001 60.41 77.35 46.01 73.55 83.05 64.36 58.55 76.47 43.622003 63.00 80.09 48.77 75.51 85.28 66.12 61.22 79.28 46.562005 65.70 82.92 51.71 77.51 87.56 67.93 64.02 82.19 49.702008 69.98 87.36 56.44 80.62 91.10 70.73 68.47 86.75 54.81GROWTH RATE 2.1224 1.7541 2.9625 1.3187 1.3312 1.3573 2.2607 1.8176 3.3171
Prov<strong>in</strong>ce/District Year Both Male Female Both Male Female Both Male FemaleSexesSexesSexesSargodha 1981 24.90 35.90 12.80 41.50 51.60 30.10 19.30 30.50 7.001998 46.30 59.16 32.66 64.17 72.34 55.26 23.72 53.74 39.092001 51.66 64.61 38.53 69.30 76.78 61.51 24.60 59.39 52.952003 55.57 68.52 43.02 72.95 79.90 66.07 25.20 63.48 64.832005 59.77 72.67 48.03 76.78 83.14 70.97 25.82 67.86 79.372008 66.69 79.37 56.66 82.92 88.24 79.00 26.78 74.99 107.51GROWTH RATE 3.7161 2.9819 5.6647 2.5969 2.0073 3.6383 1.2204 3.3881 10.6469Bhakkar 1981 17.72 27.50 6.61 36.68 50.56 20.73 14.42 23.46 4.181998 34.17 49.72 17.55 55.13 67.65 41.54 30.07 46.18 12.912001 38.37 55.20 20.85 59.24 71.22 46.96 34.23 52.04 15.752003 41.45 59.18 23.39 62.15 73.70 50.96 37.33 56.36 17.992005 44.78 63.45 26.24 65.20 76.27 55.31 40.70 61.03 20.542008 50.28 70.44 31.17 70.06 80.29 62.52 46.33 68.78 25.06GROWTH RATE 3.9382 3.5450 5.9121 2.4258 1.7276 4.1734 4.4178 4.0642 6.8584Khushab 1981 21.37 34.60 7.50 31.40 45.04 17.10 18.48 31.60 4.741998 40.50 59.83 21.77 51.64 65.91 37.39 36.70 57.71 16.552001 45.34 65.90 26.27 56.38 70.49 42.93 41.42 64.18 20.642003 48.88 70.29 29.78 59.78 73.72 47.06 44.91 68.89 23.912005 52.70 74.96 33.76 63.38 77.10 51.60 48.68 73.95 27.692008 58.99 82.57 40.75 69.20 82.46 59.24 54.95 82.25 34.53GROWTH RATE 3.8323 3.2739 6.4690 2.9696 2.2649 4.7094 4.1184 3.6063 7.6322Mianwali 1981 21.40 33.70 8.00 37.60 52.80 20.50 18.00 29.60 5.501998 42.76 63.78 22.07 57.07 73.49 39.93 38.30 60.98 17.292001 48.32 71.38 26.40 61.43 77.91 44.92 43.76 69.28 21.162003 52.42 76.94 29.75 64.52 81.00 48.58 47.82 75.42 24.222005 56.86 82.94 33.52 67.77 84.21 52.54 52.27 82.12 27.712008 64.25 92.82 40.09 72.95 89.27 59.10 59.72 93.29 33.92GROWTH RATE 4.1559 3.8239 6.1510 2.4849 1.9640 3.9997 4.5418 4.3433 6.9697Faisalabad 1981 31.76 41.61 20.68 46.20 54.64 36.45 25.60 35.95 14.081998 51.94 60.85 42.16 64.18 69.81 57.89 42.53 53.85 30.272001 56.65 65.07 47.81 68.01 72.89 62.81 46.52 57.83 34.652003 60.02 68.05 51.99 70.69 75.03 66.33 49.38 60.65 37.912005 63.60 71.16 56.53 73.48 77.22 70.04 52.42 63.60 41.482008 69.37 76.10 64.10 77.87 80.63 75.99 57.33 68.30 47.48GROWTH RATE 2.9357 2.2609 4.2790 1.9524 1.4517 2.7586 3.0310 2.4054 4.6053
Prov<strong>in</strong>ce/DistrictBoth Male Female Both Male Female Both Male FemaleSexesSexesSexesJhang 1981 20.35 30.04 9.30 41.70 53.97 27.60 14.27 23.20 4.121998 37.12 51.53 21.43 57.50 66.82 47.29 30.73 46.72 13.362001 41.27 56.68 24.83 60.85 69.39 52.00 35.18 52.86 16.442003 44.30 60.39 27.39 63.20 71.15 55.41 38.51 57.40 18.882005 47.54 64.35 30.22 65.63 72.96 59.03 42.14 62.33 21.692008 52.86 70.78 35.02 69.46 75.76 64.91 48.25 70.52 26.69GROWTH RATE 3.5990 3.2252 5.0330 1.9079 1.2642 3.2182 4.6156 4.2037 7.1651Toba Tek S<strong>in</strong>gh 1981 30.25 40.85 18.67 43.05 53.30 31.90 27.78 38.45 16.111998 50.50 61.34 39.13 63.15 70.70 55.19 47.51 59.12 35.342001 55.28 65.90 44.59 67.57 74.31 60.80 52.23 63.78 40.602003 58.72 69.13 48.64 70.68 76.83 64.85 55.63 67.09 44.532005 62.36 72.52 53.07 73.94 79.42 69.17 59.26 70.58 48.842008 68.27 77.91 60.47 79.11 83.48 76.19 65.14 76.14 56.10GROWTH RATE 3.0605 2.4201 4.4489 2.2794 1.6757 3.2771 3.2070 2.5629 4.7295Gujranwala 1981 29.90 38.20 20.50 43.10 50.80 34.30 21.40 29.90 11.701998 56.55 63.60 48.80 63.97 68.78 58.59 48.65 57.99 38.592001 63.28 69.59 56.87 68.59 72.56 64.40 56.24 65.18 47.642003 68.21 73.89 62.98 71.85 75.19 68.58 61.94 70.46 54.822005 73.52 78.45 69.75 75.27 77.92 73.04 68.23 76.17 63.082008 82.27 85.84 81.28 80.70 82.20 80.28 78.87 85.62 77.87GROWTH RATE 3.8198 3.0441 5.2342 2.3501 1.7984 3.1996 4.9495 3.9735 7.2723Hafizabad 1981 19.64 28.26 9.75 35.24 45.80 23.19 15.06 23.12 5.781998 40.74 51.79 28.67 54.68 63.13 45.47 35.47 47.52 22.322001 46.34 57.63 34.68 59.09 66.81 51.21 41.26 53.96 28.332003 50.49 61.89 39.37 62.22 69.38 55.43 45.63 58.74 33.212005 55.02 66.46 44.70 65.52 72.05 60.00 50.47 63.93 38.932008 62.58 73.96 54.07 70.80 76.25 67.57 58.71 72.60 49.41GROWTH RATE 4.3855 3.6275 6.5502 2.6179 1.9056 4.0403 5.1682 4.3290 8.2719Gujrat 1981 31.30 42.80 18.70 49.80 58.90 38.60 26.80 38.70 14.301998 62.18 72.98 51.55 72.79 79.28 65.37 57.93 70.17 46.572001 70.19 80.19 61.65 77.83 83.55 71.74 66.37 77.94 57.362003 76.09 85.38 69.46 81.39 86.52 76.33 72.67 83.59 65.912005 82.49 90.91 78.26 85.10 89.60 81.21 79.57 89.65 75.732008 93.11 99.89 93.60 91.00 94.42 89.12 91.16 99.58 93.27GROWTH RATE 4.1204 3.1889 6.1464 2.2578 1.7633 3.1474 4.6387 3.5625 7.1921
Prov<strong>in</strong>ce/DistrictBoth Male Female Both Male Female Both Male FemaleSexesSexesSexesMandi 1981 23.44 33.40 12.07 44.58 54.48 33.66 21.30 31.30 9.841998 47.44 58.77 35.64 67.08 75.35 58.64 43.83 55.76 31.362001 53.73 64.93 43.14 72.10 79.79 64.68 49.78 61.74 38.482003 58.37 69.40 49.01 75.65 82.89 69.04 54.19 66.08 44.102005 63.42 74.17 55.66 79.37 86.11 73.70 58.99 70.73 50.542008 71.82 81.94 67.38 85.31 91.19 81.28 67.01 78.31 62.01GROWTH RATE 4.2344 3.3798 6.5763 2.4327 1.9260 3.3192 4.3362 3.4550 7.0559Sialkot 1981 30.80 40.10 20.60 52.50 59.10 44.80 25.00 34.90 14.301998 58.92 65.96 51.52 72.32 75.98 68.19 53.84 61.98 45.522001 66.07 72.01 60.57 76.53 79.42 73.44 61.65 68.59 55.842003 71.30 76.36 67.46 79.46 81.81 77.16 67.47 73.39 63.992005 76.96 80.96 75.15 82.52 84.26 81.07 73.84 78.52 73.332008 86.29 88.39 88.34 87.31 88.08 87.31 84.54 86.89 89.95GROWTH RATE 3.8894 2.9708 5.5403 1.9019 1.4889 2.5019 4.6160 3.4361 7.0484Narowal 1981 25.53 34.70 15.47 47.60 56.21 38.17 21.73 31.01 11.571998 52.65 65.60 39.76 67.46 75.45 59.32 50.52 64.17 36.992001 59.82 73.40 46.97 71.74 79.47 64.12 58.63 72.96 45.412003 65.14 79.11 52.48 74.75 82.27 67.53 64.75 79.47 52.062005 70.93 85.27 58.65 77.88 85.17 71.13 71.50 86.57 59.692008 80.60 95.41 69.28 82.82 89.71 76.88 82.98 98.43 73.28GROWTH RATE 4.3497 3.8171 5.7098 2.0724 1.7467 2.6274 5.0880 4.3706 7.0758Lahore 1981 48.40 54.60 40.90 53.40 59.30 46.40 20.20 28.40 10.601998 64.66 69.05 59.68 69.15 72.73 65.10 41.70 50.35 31.742001 68.05 71.97 63.80 72.38 75.40 69.11 47.39 55.70 38.522003 70.41 73.99 66.70 74.61 77.23 71.92 51.61 59.59 43.822005 72.85 76.06 69.73 76.92 79.11 74.84 56.20 63.74 49.862008 76.67 79.28 74.54 80.50 82.01 79.45 63.87 70.52 60.50GROWTH RATE 1.7184 1.3907 2.2476 1.5320 1.2081 2.0119 4.3558 3.4257 6.6640Kasur 1981 18.70 26.80 9.50 30.40 40.00 19.60 15.30 23.30 6.701998 36.21 47.64 23.44 49.36 57.20 40.60 32.15 44.69 18.122001 40.69 52.73 27.49 53.77 60.93 46.17 36.65 50.13 21.602003 43.98 56.42 30.57 56.92 63.55 50.30 40.00 54.13 24.282005 47.53 60.37 34.00 60.26 66.28 54.80 43.65 58.44 27.292008 53.41 66.82 39.87 65.64 70.59 62.31 49.76 65.55 32.53GROWTH RATE 3.9637 3.4419 5.4563 2.8922 2.1263 4.3768 4.4648 3.9055 6.0270
Prov<strong>in</strong>ce/DistrictBoth Male Female Both Male Female Both Male FemaleSexesSexesSexesOkara 1981 24.84 34.54 13.74 43.33 52.87 31.94 20 29.62 9.111998 37.79 49.27 24.99 58.74 68.18 47.35 31.26 43.08 18.392001 40.69 52.46 27.77 61.98 71.31 50.76 33.82 46.02 20.822003 42.75 54.70 29.80 64.24 73.48 53.16 35.65 48.10 22.612005 44.92 57.03 31.97 66.58 75.71 55.68 37.57 50.27 24.562008 48.37 60.72 35.53 70.25 79.18 59.69 40.65 53.70 27.80GROWTH RATE 2.4989 2.1114 3.5813 1.8060 1.5072 2.3430 2.6619 2.2280 4.2185Sheikhupura 1981 22.4 30.9 12.5 39.4 48.3 28.7 18.7 27 9.11998 43.78 53.28 33.33 57.56 64.34 50.09 38.78 49.26 27.252001 49.28 58.66 39.63 61.54 67.68 55.26 44.11 54.77 33.072003 53.32 62.54 44.47 64.35 70.00 59.01 48.06 58.79 37.622005 57.69 66.68 49.91 67.28 72.40 63.00 52.36 63.10 42.812008 64.93 73.41 59.34 71.94 76.16 69.51 59.56 70.16 51.95GROWTH RATE 4.0206 3.2566 5.9386 2.2548 1.7011 3.3303 4.3838 3.6002 6.6643Vehari 1981 19.2 27.9 9.2 37.6 47.5 26.1 16.3 24.8 6.61998 36.79 49.4 23.18 56.66 66.12 46.48 32.9 46.13 18.62001 41.26 54.64 27.29 60.91 70.09 51.46 37.24 51.47 22.332003 44.54 58.44 30.42 63.92 72.88 55.08 40.45 55.37 25.232005 48.09 62.50 33.91 67.08 75.77 58.95 43.93 59.56 28.502008 53.93 69.13 39.92 72.12 80.32 65.27 49.73 66.46 34.21GROWTH RATE 3.8995 3.4178 5.5863 2.4415 1.9646 3.4529 4.2177 3.7182 6.2842Sahiwal 1981 21.7 30.5 11.7 43.6 52.8 32.9 17.5 26.1 7.61998 43.9 54.72 32.25 65.76 70.91 60.1 39.42 51.36 26.622001 49.71 60.67 38.57 70.71 74.70 66.84 45.49 57.88 33.212003 54.01 64.98 43.46 74.21 77.34 71.75 50.05 62.67 38.492005 58.68 69.61 48.96 77.88 80.07 77.02 55.07 67.87 44.602008 66.45 77.17 58.55 83.74 84.34 85.66 63.56 76.48 55.65GROWTH RATE 4.2318 3.4980 6.1457 2.4468 1.7498 3.6079 4.8928 4.0622 7.6523Pakpattan 1981 16.92 24.99 7.8 40.69 51.08 28.88 13.24 20.93 4.541998 34.7 46.98 21.33 57.63 66.08 48.47 30.75 43.7 16.652001 39.39 52.52 25.47 61.28 69.15 53.11 35.68 49.76 20.942003 42.86 56.56 28.67 63.84 71.28 56.44 39.40 54.26 24.402005 46.64 60.93 32.28 66.51 73.47 59.99 43.50 59.17 28.432008 52.94 68.10 38.55 70.72 76.89 65.73 50.48 67.38 35.76GROWTH RATE 4.3155 3.7830 6.0962 2.0685 1.5261 3.0927 5.0817 4.4255 7.9438
Prov<strong>in</strong>ce/DistrictBoth Male Female Both Male Female Both Male FemaleSexesSexesSexesMultan 1981 23.5 32.6 12.9 41.3 50.3 30.1 16.7 25.8 6.21998 43.38 53.25 32.28 60.9 67.51 53.21 29.47 41.61 16.182001 48.34 58.07 37.95 65.22 71.11 58.84 32.58 45.27 19.162003 51.95 61.52 42.28 68.27 73.61 62.92 34.83 47.89 21.452005 55.84 65.17 47.09 71.46 76.21 67.28 37.23 50.66 24.022008 62.21 71.07 55.37 76.53 80.27 74.39 41.16 55.12 28.45GROWTH RATE 3.6717 2.9284 5.5436 2.3108 1.7461 3.4081 3.3974 2.8515 5.8047Khanewal 1981 25.64 36.28 13.65 43.41 53.68 31.76 21.37 32.08 9.331998 39.94 53.63 25.11 60.68 70.55 49.97 35.38 49.9 19.642001 43.19 57.46 27.96 64.37 74.04 54.13 38.67 53.95 22.402003 45.50 60.16 30.04 66.96 76.45 57.10 41.04 56.82 24.452005 47.94 62.99 32.27 69.65 78.95 60.22 43.54 59.86 26.682008 51.84 67.49 35.94 73.89 82.85 65.24 47.59 64.71 30.43GROWTH RATE 2.6415 2.3257 3.6505 1.9897 1.6205 2.7018 3.0101 2.6328 4.4757Lodhran 1981 14.87 23.06 5.34 30.76 42.77 16.99 13.1 20.88 4.031998 29.9 42.68 15.96 47.66 59.24 35.05 26.83 39.82 12.652001 33.82 47.58 19.36 51.49 62.75 39.83 30.45 44.63 15.482003 36.72 51.15 22.02 54.21 65.20 43.37 33.13 48.15 17.712005 39.86 54.99 25.05 57.08 67.74 47.23 36.04 51.95 20.262008 45.09 61.31 30.39 61.66 71.75 53.66 40.90 58.21 24.79GROWTH RATE 4.1945 3.6877 6.6523 2.6092 1.9347 4.3517 4.3073 3.8705 6.9603Dera Ghazi 1981 16.3 23.2 8.12 42.26 53.88 28.7 12.75 19.04 5.271998 30.61 42.09 18.05 61.79 69.34 53.63 25 37.22 11.582001 34.21 46.76 20.78 66.07 72.50 59.89 28.15 41.89 13.312003 36.84 50.15 22.83 69.09 74.68 64.46 30.48 45.33 14.602005 39.68 53.79 25.08 72.25 76.93 69.38 32.99 49.05 16.012008 44.35 59.75 28.88 77.26 80.43 77.47 37.15 55.21 18.40GROWTH RATE 3.7764 3.5660 4.8111 2.2599 1.4950 3.7462 4.0403 4.0217 4.7398Rajanpur 1981 10.95 15.52 5.32 33.76 44.47 20.7 8.34 12.21 3.541998 20.73 29.01 11.35 49.95 60.07 38.93 15.47 23.55 6.262001 23.20 32.40 12.97 53.53 63.34 43.52 17.25 26.44 6.922003 25.01 34.87 14.18 56.05 65.62 46.88 18.55 28.57 7.402005 26.96 37.53 15.51 58.69 67.99 50.49 19.95 30.86 7.922008 30.18 41.91 17.72 62.89 71.69 56.45 22.25 34.66 8.75GROWTH RATE 3.8257 3.7480 4.5582 2.3311 1.7845 3.7854 3.7012 3.9396 3.4101
Prov<strong>in</strong>ce/DistrictBoth Male Female Both Male Female Both Male FemaleSexesSexesSexesLayyah 1981 18.9 28.58 7.78 45.68 58.28 31.38 16.01 25.39 5.221998 38.68 52.98 23.39 62.45 72.6 51.54 34.92 49.86 18.952001 43.89 59.08 28.40 65.99 75.47 56.26 40.07 56.17 23.792003 47.75 63.53 32.33 68.47 77.45 59.64 43.92 60.81 27.692005 51.95 68.31 36.80 71.03 79.47 63.22 48.14 65.83 32.222008 58.94 76.17 44.69 75.06 82.62 69.01 55.25 74.16 40.46GROWTH RATE 4.3027 3.6973 6.6892 1.8565 1.3008 2.9618 4.6942 4.0496 7.8792Muzaffargarh 1981 16.8 25.8 6.3 40.3 51.1 27.7 14.1 22.9 3.91998 28.45 40.87 14.77 55.53 64.83 44.92 24.12 36.96 10.052001 31.22 44.33 17.17 58.76 67.61 48.92 26.52 40.22 11.882003 33.22 46.79 18.98 61.02 69.53 51.78 28.25 42.55 13.282005 35.34 49.39 20.98 63.37 71.50 54.81 30.09 45.01 14.842008 38.78 53.57 24.38 67.05 74.57 59.70 33.08 48.98 17.54GROWTH RATE 3.1472 2.7430 5.1398 1.9036 1.4098 2.8847 3.2084 2.8559 5.7262Bahawalpur 1981 20.43 27.44 12.21 42.85 52.22 31.86 13.67 19.96 6.291998 35.03 44.86 23.95 57 65.28 47.12 26.31 36.44 15.132001 38.53 48.93 26.97 59.94 67.90 50.49 29.53 40.52 17.662003 41.05 51.84 29.20 61.99 69.71 52.87 31.90 43.50 19.592005 43.74 54.92 31.61 64.11 71.56 55.36 34.45 46.69 21.722008 48.10 59.90 35.60 67.42 74.44 59.32 38.67 51.92 25.36GROWTH RATE 3.2226 2.9336 4.0426 1.6927 1.3217 2.3287 3.9266 3.6042 5.2987Bahawalnagar 1981 19.53 28.33 9.6 30.31 40.33 18.71 17.21 25.71 7.671998 35.07 45.52 23.78 52.86 61.22 43.86 30.81 41.77 18.962001 38.89 49.49 27.91 58.31 65.90 50.98 34.14 45.50 22.242003 41.66 52.33 31.05 62.25 69.22 56.35 36.57 48.18 24.742005 44.63 55.34 34.55 66.46 72.70 62.29 39.16 51.01 27.522008 49.49 60.17 40.55 73.32 78.26 72.40 43.40 55.57 32.29GROWTH RATE 3.5035 2.8289 5.4807 3.3257 2.4856 5.1391 3.4849 2.8958 5.4679Rahim Yar 1981 20.00 28.00 10.6 44.5 53.6 33.7 15.1 22.9 6.11998 33.09 43.4 21.82 57.03 64.97 48.45 26.92 37.88 14.912001 36.16 46.89 24.78 59.58 67.21 51.66 29.81 41.40 17.462003 38.37 49.37 26.98 61.35 68.75 53.91 31.91 43.92 19.392005 40.71 51.98 29.37 63.16 70.33 56.26 34.16 46.60 21.542008 44.50 56.16 33.37 65.99 72.75 59.98 37.83 50.93 25.22GROWTH RATE 3.0061 2.6115 4.3384 1.4700 1.1381 2.1585 3.4595 3.0048 5.3980
Table VI-CDistrict-wise Rate of <strong>Literacy</strong> (10 Years & above) by Sex & Urban andRural areas of NWFPNWFP(<strong>Literacy</strong> Rates <strong>in</strong> Percentages)All Areas Urban RuralProv<strong>in</strong>ce/District Years Both Male Female Both Male Female Both Male FemaleSexesSexesSexesChitral 1981 12.70 21.90 2.30 − − − 14.10 24.10 2.901998 40.30 58.02 22.09 56.65 71.53 38.19 38.40 56.29 20.422001 49.41 68.90 32.93 − − − 45.83 65.38 28.822003 56.60 77.27 42.97 51.56 72.24 36.252005 64.83 86.66 56.07 58.01 79.82 45.612008 79.49 102.92 83.58 69.23 92.71 64.37GROWTH RATE 7.0287 5.8986 14.2332 6.0706 5.1166 12.1663Upper Dir 1981 14.80 24.94 3.93 − − − 14.80 24.94 3.931998 21.21 36.10 6.10 41.05 58.59 22.61 20.34 35.09 5.382001 22.60 38.53 6.59 − − − 21.51 37.27 5.692003 23.58 40.25 6.94 22.33 38.80 5.902005 24.60 42.04 7.31 23.19 40.39 6.122008 26.21 44.87 7.90 24.52 42.90 6.47GROWTH RATE 2.1393 2.1992 2.6199 1.8880 2.0288 1.8645Lower Dir 1981 5.93 10.08 1.31 − − − 5.93 10.08 1.311998 29.90 48.76 12.25 43.51 60.54 24.12 28.97 47.86 11.522001 39.78 64.40 18.17 − − − 38.33 63.00 16.912003 48.12 77.52 23.64 46.19 75.67 21.832005 58.21 93.32 30.75 55.67 90.89 28.202008 77.44 123.25 45.63 73.65 119.65 41.39GROWTH RATE 9.9842 9.7162 14.0538 9.7800 9.5960 13.6423Swat 1981 8.70 15.10 1.70 23.70 35.90 9.20 7.60 13.40 1.201998 28.75 43.16 13.45 48.05 62.89 31.18 25.53 39.75 10.622001 35.50 51.95 19.37 54.43 69.43 38.67 31.62 48.16 15.602003 40.86 58.78 24.71 59.15 74.16 44.65 36.46 54.73 20.172005 47.03 66.51 31.52 64.28 79.22 51.54 42.05 62.20 26.062008 58.08 80.05 45.41 72.82 87.46 63.93 52.07 75.36 38.30GROWTH RATE 7.2844 6.3726 12.9379 4.2451 3.3529 7.4439 7.3878 6.6052 13.6848
All Areas Urban RuralProv<strong>in</strong>ce/District Years Both Male Female Both Male Female Both Male FemaleSexesSexesSexesShangla 1981 4.82 8.64 0.55 − − − 4.82 8.64 0.551998 14.73 25.16 3.71 − − − 14.73 25.16 3.712001 17.94 30.38 5.20 − − − 17.94 30.38 5.202003 20.46 34.45 6.50 − − − 20.46 34.45 6.502005 23.33 39.07 8.14 − − − 23.33 39.07 8.142008 28.42 47.18 11.40 − − − 28.42 47.18 11.40GROWTH RATE 6.7920 6.4892 11.8833 − − − 6.7920 6.4892 11.8833Buner 1981 7.77 13.90 1.35 − − − 7.70 13.90 1.351998 22.62 38.18 7.65 − − − 22.62 38.18 7.652001 27.31 45.63 10.39 − − − 27.36 45.63 10.392003 30.97 51.39 12.74 − − − 31.06 51.39 12.742005 35.12 57.88 15.63 − − − 35.25 57.88 15.632008 42.41 69.18 21.22 − − − 42.64 69.18 21.22GROWTH RATE 6.4874 6.1239 10.7423 − − − 6.5441 6.1239 10.7423Malakand P.A. 1981 16.30 26.40 5.41 − − − 16.30 26.40 5.401998 39.50 55.21 22.74 39.29 51.40 25.26 39.52 55.64 22.482001 46.18 62.89 29.30 − − − 46.21 63.46 28.912003 51.25 68.59 34.69 51.28 69.28 34.202005 56.87 74.81 41.07 56.91 75.63 40.442008 66.48 85.21 52.92 66.54 86.27 52.02GROWTH RATE 5.3446 4.4354 8.8133 5.3477 4.4831 8.7515Kohistan 1981 1.40 1.87 0.73 − − − 1.40 1.90 0.701998 11.08 17.23 2.95 − − − 11.08 17.23 2.952001 15.96 25.50 3.77 − − − 15.96 25.43 3.802003 20.36 33.11 4.45 20.36 32.95 4.502005 25.97 42.99 5.24 25.97 42.71 5.332008 37.41 63.62 6.71 37.41 63.03 6.88GROWTH RATE 12.9400 13.9546 8.5616 12.9400 13.8480 8.8300Mansehra 1981 14.13 20.92 6.52 44.28 54.00 33.35 12.99 19.66 5.511998 36.32 50.90 22.71 68.49 76.74 59.65 34.40 49.24 20.652001 42.90 59.55 28.30 73.97 81.65 66.10 40.85 57.90 26.072003 47.94 66.11 32.78 77.86 85.10 70.77 45.81 64.50 30.462005 53.58 73.40 37.96 81.96 88.69 75.79 51.37 71.86 35.582008 63.29 85.88 47.32 88.52 94.36 83.97 61.00 84.50 44.92GROWTH RATE 5.7104 5.3695 7.6169 2.5988 2.0888 3.4794 5.8960 5.5492 8.0814
All Areas Urban RuralProv<strong>in</strong>ce/District Years Both Male Female Both Male Female Both Male FemaleSexesSexesSexesBatagram 1981 3.52 5.63 0.71 − − − − − −1998 18.31 29.40 6.48 − − − 18.31 29.40 6.482001 24.49 39.36 9.57 − − − 19.45 31.56 6.672003 29.74 47.81 12.42 − − − 20.26 33.09 6.802005 36.11 58.07 16.11 − − − 21.09 34.70 6.932008 48.30 77.73 23.79 − − − 22.41 37.25 7.13GROWTH RATE 10.1859 10.2112 13.8909 − − − 2.0397 2.3953 0.9584Abbottabad 1981 26.70 41.60 10.90 48.84 59.50 33.90 23.20 38.40 7.901998 56.61 74.52 39.11 76.73 85.69 64.71 51.85 71.33 34.182001 64.64 82.59 49.00 83.10 91.39 72.53 59.76 79.57 44.262003 70.61 88.46 56.95 87.63 95.39 78.26 65.69 85.58 52.592005 77.14 94.74 66.19 92.42 99.58 84.45 72.20 92.05 62.482008 88.08 105.00 82.92 100.09 106.20 94.65 83.21 102.68 80.90GROWTH RATE 4.5199 3.4887 7.8050 2.6929 2.1688 3.8762 4.8443 3.7099 8.9984Haripur 1981 24.85 39.02 10.45 39.69 51.43 26.18 22.91 37.28 8.541998 53.72 70.45 37.40 69.73 79.36 59.54 51.39 69.09 34.342001 61.55 78.19 46.84 77.02 85.67 68.83 59.26 77.04 43.902003 67.39 83.82 54.42 82.30 90.16 75.82 65.17 82.84 51.712005 73.79 89.85 63.22 87.94 94.88 83.51 71.67 89.07 60.902008 84.54 99.73 79.18 97.14 102.43 96.54 82.65 99.32 77.86GROWTH RATE 4.6393 3.5366 7.7889 3.3704 2.5844 4.9520 4.8669 3.6958 8.5299Mardan 1981 15.95 26.10 5.10 26.90 38.82 13.62 14.10 23.80 3.601998 36.45 53.50 18.38 48.27 62.83 31.86 33.31 50.92 14.932001 42.17 60.72 23.05 53.52 68.40 37.01 38.77 58.23 19.192003 46.48 66.07 26.80 57.33 72.39 40.91 42.89 63.69 22.692005 51.23 71.90 31.16 61.41 76.61 45.21 47.46 69.65 26.822008 59.27 81.60 39.07 68.08 83.40 52.52 55.23 79.65 34.47GROWTH RATE 4.9818 4.3124 7.8330 3.4991 2.8728 5.1259 5.1870 4.5755 8.7273Swabi 1981 14.93 25.22 4.36 16.64 28.15 4.94 14.76 24.92 4.301998 36.03 53.99 18.28 43.35 60.95 25.52 34.45 52.47 16.742001 42.09 61.75 23.54 51.33 69.85 34.10 40.01 59.84 21.282003 46.69 67.54 27.87 57.45 76.50 41.36 44.20 65.32 24.972005 51.79 73.86 32.98 64.30 83.78 50.18 48.84 71.30 29.302008 60.50 84.48 42.48 76.14 96.01 67.05 56.72 81.31 37.24GROWTH RATE 5.3189 4.5792 8.7970 5.7940 4.6490 10.1413 5.1122 4.4772 8.3235
All Areas Urban RuralProv<strong>in</strong>ce/District Years Both Male Female Both Male Female Both Male FemaleSexesSexesSexesCharsadda 1981 13.29 21.43 4.71 19.19 30.06 7.02 11.70 19.11 3.401998 31.11 46.92 14.07 39.82 55.26 23.07 28.97 44.87 11.882001 36.15 53.88 17.07 45.29 61.53 28.46 34.00 52.16 14.812003 39.95 59.08 19.41 49.36 66.10 32.74 37.82 57.67 17.162005 44.16 64.79 22.08 53.78 71.01 37.65 42.08 63.77 19.892008 51.31 74.40 26.78 61.18 79.06 46.45 49.38 74.13 24.80GROWTH RATE 5.1303 4.7176 6.6491 4.3875 3.6464 7.2494 5.4782 5.1491 7.6369Peshawar 1981 21.80 31.30 10.90 36.00 46.10 23.30 13.10 21.60 3.801998 41.79 55.97 25.85 54.09 65.27 41.11 29.19 46.14 10.742001 46.88 62.02 30.11 58.12 69.40 45.44 33.62 52.75 12.902003 50.61 66.40 33.32 60.97 72.30 48.58 36.95 57.68 14.582005 54.63 71.10 36.89 63.96 75.32 51.94 40.60 63.07 16.472008 61.28 78.78 42.96 68.73 80.08 57.41 46.76 72.11 19.79GROWTH RATE 3.9021 3.4779 5.2109 2.4238 2.0665 3.3964 4.8259 4.5658 6.3022Nowshehra 1981 23.79 36.82 8.72 43.52 58.09 21.15 16.17 27.06 4.861998 42.50 60.55 22.68 55.64 70.42 36.62 37.59 56.48 18.062001 47.08 66.11 26.85 58.11 72.85 40.35 43.62 64.31 22.772003 50.41 70.09 30.04 59.81 74.52 43.04 48.18 70.13 26.572005 53.97 74.31 33.62 61.56 76.23 45.91 53.20 76.47 31.012008 59.79 81.13 39.80 64.29 78.86 50.58 61.74 87.07 39.09GROWTH RATE 3.4721 2.9693 5.7838 1.4557 1.1387 3.2818 5.0874 4.4235 8.0275Kohat 1981 19.40 32.10 6.40 36.80 51.30 18.20 15.40 27.00 4.001998 44.06 65.00 23.48 67.02 79.10 51.45 34.52 57.95 13.942001 50.92 73.62 29.53 74.50 85.38 61.81 39.80 66.31 17.382003 56.08 79.99 34.41 79.94 89.84 69.84 43.77 72.55 20.122005 61.76 86.91 40.10 85.78 94.54 78.93 48.13 79.37 23.312008 71.38 98.44 50.44 95.36 102.05 94.81 55.50 90.82 29.05GROWTH RATE 4.9435 4.2375 7.9461 3.5893 2.5799 6.3036 4.8626 4.5951 7.6203Hangu 1981 12.20 21.82 2.91 20.78 33.02 7.91 10.19 19.06 1.801998 30.50 53.48 9.84 45.90 65.71 25.33 26.23 49.75 5.912001 35.85 62.65 12.20 52.79 74.19 31.11 30.99 58.93 7.292003 39.93 69.61 14.08 57.95 80.45 35.67 34.64 65.97 8.382005 44.48 77.36 16.25 63.61 87.23 40.90 38.71 73.85 9.642008 52.29 90.62 20.15 73.16 98.50 50.23 45.74 87.48 11.89GROWTH RATE 5.5378 5.4149 7.4295 4.7720 4.1309 7.0860 5.7193 5.8059 7.2436
All Areas Urban RuralProv<strong>in</strong>ce/District Years Both Male Female Both Male Female Both Male FemaleKarak 1981 19.3 34.75 3.57 24.75 40.01 7.39 18.93 34.37 3.321998 41.92 68.15 18.12 53.84 75.59 31.78 41.07 67.59 17.202001 48.07 76.75 24.14 61.75 84.57 41.11 47.09 76.16 22.992003 52.66 83.08 29.22 67.67 91.14 48.81 51.58 82.46 27.902005 57.69 89.93 35.37 74.15 98.23 57.94 56.50 89.29 33.862008 66.16 101.28 47.11 85.05 109.90 74.96 64.77 100.61 45.26GROWTH RATE 4.6684 4.0415 10.0270 4.6778 3.8132 8.9595 4.6614 4.0583 10.1598Bannu 1981 16.04 27.20 3.40 34.40 47.50 17.20 14.20 24.90 2.101998 32.11 50.79 12.18 60.47 72.25 45.05 29.63 48.71 9.622001 36.29 56.71 15.26 66.80 77.80 53.39 33.74 54.83 12.582003 39.38 61.03 17.73 71.38 81.74 59.80 36.79 59.34 15.052005 42.73 65.68 20.60 76.28 85.87 66.97 40.11 64.21 18.002008 48.30 73.34 25.80 84.26 92.47 79.37 45.67 72.28 23.55GROWTH RATE 4.1673 3.7417 7.7949 3.3738 2.4978 5.8274 4.4217 4.0261 9.3654Lakki Marwat 1981 14.26 25.35 1.89 27.46 42.81 10.42 13.27 24.04 1.251998 29.71 50.32 8.63 48.81 66.64 29.29 27.54 48.40 6.382001 33.82 56.79 11.28 54.02 72.05 35.15 31.33 54.76 8.512003 36.87 61.56 13.49 57.81 75.90 39.69 34.14 59.46 10.302005 40.19 66.73 16.13 61.85 79.96 44.83 37.20 64.56 12.482008 45.75 75.32 21.09 68.46 86.45 53.80 42.31 73.05 16.64GROWTH RATE 4.4124 4.1155 9.3445 3.4415 2.6373 6.2681 4.3885 4.2023 10.0631Dera Ismail Khan 1981 18.40 27.30 8.00 38.40 50.30 24.60 13.70 21.80 4.101998 31.28 43.19 17.86 65.17 75.02 53.80 24.70 36.93 11.002001 34.35 46.83 20.58 71.55 80.50 61.77 27.41 40.53 13.092003 36.56 49.43 22.62 76.14 84.38 67.72 29.38 43.12 14.702005 38.92 52.17 24.86 81.03 88.44 74.25 31.48 45.88 16.522008 42.74 56.57 28.65 88.96 94.91 85.25 34.94 50.35 19.66GROWTH RATE 3.1706 2.7351 4.8376 3.1603 2.3793 4.7107 3.5279 3.1492 5.9772Tank 1981 15.80 25.86 3.85 27.10 39.63 11.54 13.35 22.80 2.231998 26.25 42.44 8.59 43.14 59.38 24.71 23.15 39.27 5.712001 28.71 46.32 9.90 46.83 63.77 28.26 25.51 43.22 6.742003 30.48 49.10 10.88 49.46 66.88 30.91 27.22 46.08 7.532005 32.35 52.04 11.95 52.24 70.14 33.81 29.04 49.12 8.412008 35.38 56.80 13.77 56.71 75.33 38.67 32.00 54.07 9.93GROWTH RATE 3.0312 2.9570 4.8339 2.7725 2.4072 4.5806 3.2911 3.2499 5.6865
Table VI-DDistrict-wise Rate of <strong>Literacy</strong> (10 Years & above) by Sex & Urban andRural areas of BalochistanBalochistan(<strong>Literacy</strong> Rates <strong>in</strong> Percentages)All Areas Urban RuralProv<strong>in</strong>ce/District Years Both Male Female Both Male Female Both Male FemaleSexesSexesSexesQuetta 1981 36.70 46.30 23.20 42.80 52.50 29.20 17.10 26.50 4.101998 57.07 67.27 44.53 64.23 73.82 52.28 34.13 45.71 20.582001 61.69 71.85 49.96 69.00 78.40 57.94 38.56 50.33 27.362003 64.98 75.08 53.94 72.38 81.60 62.05 41.82 53.66 33.082005 68.45 78.46 58.24 75.92 84.94 66.45 45.37 57.21 39.992008 73.99 83.80 65.35 81.55 90.21 73.64 51.25 62.99 53.16GROWTH RATE 2.6311 2.2218 3.9099 2.4166 2.0250 3.4855 4.1490 3.2589 9.9551Pish<strong>in</strong> 1981 9.00 15.00 1.80 10.60 15.80 4.50 8.80 14.90 1.501998 31.14 47.29 13.15 37.13 47.21 24.92 30.71 47.30 12.332001 38.77 57.91 18.68 46.32 57.27 33.71 38.29 58.00 17.882003 44.86 66.29 23.60 53.68 65.14 41.23 44.35 66.44 22.912005 51.91 75.88 29.82 62.22 74.09 50.42 51.38 76.11 29.352008 64.63 92.92 42.36 77.62 89.88 68.20 64.06 93.32 42.57GROWTH RATE 7.5748 6.9877 12.4095 7.6526 6.6506 10.5925 7.6290 7.0312 13.1921Chaman 1981 6.96 9.96 3.33 4.21 6.74 1.06 4.21 6.74 1.061998 16.10 23.75 6.77 29.06 39.78 14.70 13.66 20.58 5.372001 18.67 27.69 7.67 40.87 54.42 23.38 16.81 25.06 7.152003 20.60 30.67 8.34 51.29 67.05 31.86 19.31 28.58 8.652005 22.74 33.97 9.07 64.38 82.63 43.41 22.18 32.59 10.472008 26.37 39.60 10.28 90.54 113.03 69.04 27.30 39.68 13.95GROWTH RATE 5.0569 5.2447 4.2620 12.0350 11.0077 16.7286 7.1689 6.7866 10.0148Chagai 1981 10.10 17.00 1.90 19.70 30.50 6.10 9.10 15.50 1.501998 26.99 37.99 13.76 45.42 58.64 30.07 22.95 33.55 10.102001 32.10 43.78 19.51 52.63 65.81 39.85 27.02 38.45 14.142003 36.04 48.13 24.63 58.07 71.07 48.07 30.13 42.10 17.702005 40.46 52.90 31.09 64.07 76.75 58.00 33.59 46.11 22.152008 48.12 60.97 44.10 74.24 86.14 76.85 39.55 52.84 31.01GROWTH RATE 5.9524 4.8437 12.3519 5.0365 3.9201 9.8381 5.5922 4.6471 11.8715
All Areas Urban RuralProv<strong>in</strong>ce/District Years BothSexesMale Female BothSexesMale Female BothSexesMale FemaleLoralai 1981 5.50 8.70 1.60 32.60 42.30 16.90 4.00 6.60 0.801998 20.47 30.12 9.24 53.28 66.15 33.39 15.82 24.25 6.392001 25.81 37.50 12.59 58.11 71.58 37.65 20.16 30.51 9.222003 30.13 43.40 15.48 61.56 75.45 40.79 23.70 35.56 11.772005 35.17 50.23 19.02 65.22 79.52 44.20 27.87 41.4444 15.032008 44.35 62.53 25.92 71.13 86.05 49.84 35.52 52.14 21.69GROWTH RATE 8.0373 7.5785 10.8657 2.9319 2.6651 4.0868 8.4242 7.9556 13.0012Musakhel 1981 1.40 2.50 0.00 − − − − − −1998 10.37 14.34 4.80 16.05 23.80 6.28 9.86 13.53 4.662001 14.77 19.52 - 14.16 21.50 5.27 11.56 15.36 6.362003 18.69 23.97 - 13.03 20.10 4.69 12.86 16.71 7.822005 23.65 29.44 - 11.99 18.78 4.18 14.30 18.18 9.632008 33.68 40.07 - 10.58 16.97 3.51 16.76 20.64 13.14GROWTH RATE 12.5009 10.8215 - -4.0826 -3.3264 -5.6569 5.4504 4.3130 10.9219Barkhan a 1981 4.10 6.90 0.80 − − − − − −1998 15.67 23.69 6.41 37.14 49.48 21.15 13.95 21.51 5.322001 19.85 29.45 9.25 38.00 50.87 22.00 17.39 26.50 7.432003 23.24 34.05 11.82 38.59 51.82 22.59 20.14 30.45 9.292005 27.22 39.37 15.10 39.19 52.78 23.20 23.33 34.99 11.612008 34.48 48.94 21.80 40.10 54.26 24.13 29.09 43.10 16.22GROWTH RATE 8.2062 7.5258 13.0220 0.7699 0.9265 1.3283 7.6249 7.1969 11.7896Killa Saifullah 1981 5.1 7.9 1.5 − − − − − −1998 17.55 24.98 8.92 33.88 43.12 23.18 15.08 22.24 6.752001 21.83 30.61 12.22 34.11 43.27 24.51 19.06 27.56 9.832003 25.24 35.05 15.07 34.27 43.36 25.44 22.28 31.79 12.642005 29.19 40.13 18.59 34.42 43.46 26.40 26.04 36.68 16.242008 36.31 49.17 25.46 34.66 43.61 27.91 32.92 45.44 23.67GROWTH RATE 7.5402 7.0064 11.0569 0.2268 0.1130 1.8761 8.1191 7.4075 13.3661Zhob 1981 5.90 9.00 2.00 25.40 38.70 7.40 4.00 6.00 1.401998 16.78 24.53 6.90 47.84 63.37 24.22 10.40 15.80 3.752001 20.18 29.2828 859 8.59 53.49 69.13 29.86 12.31 18.74 446 4.462003 22.82 32.94 9.93 57.63 73.26 34.33 13.77 21.01 5.012005 25.81 37.07 11.49 62.09 77.64 39.46 15.41 23.54 5.632008 31.03 44.24 14.30 69.43 84.70 48.65 18.24 27.93 6.69GROWTH RATE 6.3414 6.0755 7.5564 3.7944 2.9434 7.2237 5.7816 5.8609 5.9670
All Areas Urban RuralProv<strong>in</strong>ce/District Years BothSexesMale Female BothSexesMale Female BothSexesMale FemaleSibi 1981 11.50 17.60 4.40 25.30 33.60 15.00 7.50 12.80 1.601998 25.47 35.25 13.60 41.63 52.25 29.08 17.92 27.44 6.192001 29.31 39.85 16.60 45.45 56.48 32.68 20.90 31.39 7.862003 32.18 43.24 18.95 48.20 59.50 35.33 23.15 34.34 9.222005 35.3434 46.92 21.64 51.1111 62.6767 38.19 25.65 37.56 10.812008 40.66 53.04 26.41 55.80 67.75 42.93 29.91 42.97 13.72GROWTH RATE 4.7885 4.1703 6.8633 2.9728 2.6312 3.9709 5.2571 4.5878 8.2837Ziarat 1981 8.60 14.90 1.50 − − − − − −1998 34.34 51.38 17.02 51.49 65.71 19.87 33.93 50.91 16.982001 43.84 63.92 26.13 58.37 73.97 20.88 44.29 64.96 25.762003 51.60 73.95 34.77 63.46 80.04 21.58 52.89 76.41 34.012005 60.73 85.54 46.27 68.99 86.61 22.31 63.17 89.89 44.912008 77.54 106.42 71.03 78.21 97.49 23.44 82.45 114.68 68.13GROWTH RATE 8.4853 7.5534 15.3589 4.2685 4.0243 1.6676 9.2849 8.4601 14.9059Kohlu 1981 3.96 6.12 1.37 − − − − − −1998 12.15 17.83 4.85 39.84 55.15 17.76 9.19 13.61 3.572001 14.81 21.53 6.06 − − − − − −2003 16.90 24.42 7.03 − − − − − −2005 19.28 27.69 8.16 − − − − − −2008 23.50 33.44 10.20 − − − − − −GROWTH RATE 6.8169 6.4922 7.7198 − − − − − −Dera Bugti 1981 3.90 6.70 0.70 − − − − − −1998 11.73 18.89 2.97 28.71 41.94 12.94 10.05 16.64 1.962001 14.25 22.68 3.83 43.16 60.19 18.30 9.53 13.76 4.112003 16.22 25.62 4.54 29.80 44.77 12.39 10.95 17.97 2.082005 18.46 28.95 5.39 30.24 45.95 12.18 11.34 18.54 2.132008 22.42 34.76 6.95 30.93 47.78 11.86 11.94 19.42 2.21GROWTH RATE 6.6919 6.2869 8.8732 0.7465 1.3127 -0.8652 1.7365 1.5553 1.2009Jafarabad 1981 6.10 10.50 1.30 19.50 31.10 5.20 4.40 7.80 0.801998 18.51 27.50 8.64 27.46 38.24 15.56 16.26 24.80 6.922001 22.52 32.59 12.07 29.17 39.66 18.8888 20.48 30.42 10.13132003 25.66 36.50 15.08 30.37 40.64 21.48 23.88 34.85 13.052005 29.24 40.88 18.85 31.62 41.64 24.43 27.85 39.93 16.822008 35.56 48.45 26.33 33.59 43.18 29.65 35.08 48.97 24.62GROWTH RATE 6.7474 5.8270 11.7858 2.0340 1.2232 6.6597 7.9922 7.0411 13.5321
All Areas Urban RuralProv<strong>in</strong>ce/District Years BothSexesMale Female BothSexesMale Female BothSexesMale FemaleNasirabad 1981 4.70 8.10 0.80 17.40 27.20 4.70 3.70 6.60 0.501998 12.69 19.51 5.06 21.78 32.77 8.86 11.05 17.06 4.392001 15.12 22.78 7.01 22.66 33.87 9.91 13.40 20.17 6.442003 17.00 25.27 8.70 23.27 34.62 10.68 15.24 22.56 8.322005 19.1010 28.02 10.81 23.89 35.3838 11.50 17.34 25.2222 10.742008 22.76 32.72 14.97 24.86 36.57 12.86 21.03 29.83 15.76GROWTH RATE 6.0167 5.3070 11.4606 1.3295 1.1019 3.7997 6.6475 5.7453 13.6317Jhal Magsi 1981 4.80 8.10 1.10 19.80 29.60 7.70 3.60 6.20 0.601998 12.28 17.64 5.97 24.36 34.45 13.30 11.31 16.34 5.362001 14.49 20.24 8.05 25.27 35.38 14.65 13.84 19.39 7.892003 16.19 22.18 9.82 25.89 36.02 15.62 15.84 21.73 10.212005 18.08 24.30 11.98 26.53 36.67 16.66 18.12 24.35 13.212008 21.34 27.88 16.15 27.52 37.67 18.34 22.18 28.89 19.43GROWTH RATE 5.6811 4.6847 10.4614 1.2266 0.8966 3.2672 6.9657 5.8660 13.7475Bolan 1981 3.80 6.60 0.80 19.90 32.60 4.50 3.00 5.30 0.601998 15.74 23.08 6.93 36.24 48.93 21.54 12.34 18.87 4.452001 20.23 28.79 10.14 40.28 52.57 28.40 15.84 23.61 6.342003 23.91 33.35 13.08 43.23 55.14 34.14 18.71 27.41 8.022005 28.26 38.65 16.86 46.39 57.84 41.04 22.09 31.83 10.162008 36.31 48.20 24.68 51.56 62.13 54.11 28.35 39.83 14.46GROWTH RATE 8.7194 7.6420 13.5417 3.5890 2.4175 9.6483 8.6749 7.7559 12.5094Kalat 1981 6.20 10.60 1.10 19.40 32.20 5.40 5.00 8.70 0.701998 19.86 29.24 9.44 44.67 60.20 28.14 15.69 24.17 6.212001 24.39 34.97 13.79 51.75 67.23 37.66 19.20 28.95 9.132003 27.97 39.41 17.76 57.09 72.36 45.73 21.96 32.64 11.802005 32.07 44.40 22.88 62.97 77.89 55.53 25.13 36.81 15.262008 39.39 53.11 33.43 72.96 86.98 74.31 30.74 44.09 22.43GROWTH RATE 7.0879 6.1505 13.4792 5.0284 3.7492 10.1977 6.9584 6.1948 13.7010Mastung 1981 9 15.1 1.8 19.8 32.7 6.1 7.4 12.7 1.21998 27.58 37.66 15.73 53.19 66.12 38.97 23.05 32.81 11.442001 33.61 44.25 23.06 63.3232 74.87 54.06 28.17 38.79 17.032003 38.34 49.27 29.76 71.13 81.33 67.24 32.20 43.38 22.202005 43.74 54.87 38.40 79.90 88.36 83.63 36.80 48.50 28.952008 53.29 64.47 56.30 95.12 100.05 116.01 44.97 57.34 43.10GROWTH RATE 6.8093 5.5230 13.6004 5.9851 4.2287 11.5261 6.9118 5.7419 14.1833
All Areas Urban RuralProv<strong>in</strong>ce/District Years BothSexesMale Female BothSexesMale Female BothSexesMale FemaleKhuzdar 1981 4.20 7.00 0.70 15.30 23.30 3.70 3.20 5.40 0.401998 17.46 25.33 8.39 30.71 42.01 17.57 12.28 18.77 4.832001 22.45 31.78 13.01 34.73 46.62 23.13 15.57 23.39 7.502003 26.55 36.98 17.42 37.69 49.96 27.78 18.24 27.08 10.052005 31.3939 43.02 23.3333 40.91 53.5555 33.3737 21.36 31.3535 13.472008 40.37 53.97 36.16 46.27 59.42 43.93 27.09 39.06 20.91GROWTH RATE 8.7426 7.8587 15.7313 4.1836 3.5282 9.5969 8.2320 7.6038 15.7818Awaran 1981 2.60 4.60 0.40 15.30 23.30 3.70 − − −1998 14.79 23.16 5.60 − − − 14.79 23.16 5.602001 20.10 30.80 8.92 − − − 19.38 29.95 8.922003 24.66 37.26 12.17 − − − 23.20 35.54 12.172005 30.26 45.06 16.60 − − − 27.78 42.18 16.602008 41.12 59.93 26.45 − − − 36.39 54.54 26.45GROWTH RATE 10.7673 9.9748 16.7937 − − − 9.4226 8.9424 16.7937Kharan 1981 4.40 7.70 0.40 17.10 32.50 1.60 3.30 5.70 0.301998 15.05 23.73 5.69 31.75 48.89 13.91 12.50 19.97 4.412001 18.70 28.94 9.09 35.41 52.54 20.37 15.81 24.92 7.092003 21.61 33.04 12.42 38.09 55.13 26.28 18.49 28.88 9.722005 24.97 37.72 16.98 40.96 57.84 33.89 21.63 33.46 13.342008 31.02 46.01 27.13 45.69 62.16 49.64 27.36 41.75 21.43GROWTH RATE 7.5020 6.8448 16.9033 3.7071 2.4310 13.5658 8.1492 7.6539 17.1293Lasbela 1981 6.40 10.30 1.40 15.60 22.10 5.60 4.50 7.70 0.701998 22.30 32.16 10.46 34.88 45.79 20.54 14.88 23.59 4.982001 27.80 39.32 14.92 40.20 52.07 25.83 18.38 28.74 7.042003 32.19 44.95 18.90 44.19 56.73 30.10 21.15 32.79 8.872005 37.28 51.40 23.94 48.58 61.81 35.08 24.35 37.41 11.172008 46.47 62.83 34.14 55.99 70.29 44.12 30.07 45.58 15.79GROWTH RATE 7.6192 6.9269 12.5581 4.8470 4.3784 7.9446 7.2883 6.8076 12.2342Kech(Turbat) 1981 5.80 9.50 0.80 17.10 28.40 3.00 4.10 6.70 0.401998 27.51 38.07 16.28 45.34 59.71 28.80 23.74 33.29 13.772001 36.21 48.64 27.7171 53.85 68.08 42.93 32.3636 44.18 25.712003 43.48 57.27 39.49 60.40 74.30 56.01 39.79 53.34 38.992005 52.22 67.42 56.30 67.74 81.08 73.09 48.93 64.42 59.122008 68.73 86.14 95.81 80.46 92.45 108.94 66.70 85.48 110.40GROWTH RATE 9.5894 8.5081 19.3918 5.9036 4.4682 14.2301 10.8829 9.8893 23.1415
All Areas Urban RuralProv<strong>in</strong>ce/District Years BothSexesMale Female BothSexesMale Female BothSexesMale FemaleGwadar 1981 6.10 10.80 0.90 11.60 20.60 1.80 2.80 4.90 0.301998 25.47 35.52 13.81 34.07 46.27 19.87 14.84 22.19 6.382001 32.78 43.82 22.36 41.20 53.37 30.36 19.92 28.97 10.942003 38.78 50.41 30.83 46.77 58.70 40.27 24.24 34.60 15.682005 45.88 57.99 42.51 53.09 64.57 53.41 29.49 41.33 22.472008 59.04 71.55 68.84 64.21 74.48 81.60 39.58 53.95 38.53GROWTH RATE 8.7706 7.2543 17.4253 6.5429 4.8751 15.1724 10.3074 9.2914 19.7016Panjgur 1981 7.00 11.20 1.20 16.00 26.50 3.70 6.50 10.40 1.101998 31.35 39.35 22.34 44.32 54.13 33.75 29.93 37.77 21.062001 40.85 49.12 37.43 53.05 61.40 49.85 39.19 47.42 35.462003 48.72 56.94 52.79 59.81 66.78 64.66 46.90 55.19 50.182005 58.12 66.02 74.47 67.42 72.64 83.87 56.13 64.24 71.022008 75.73 82.41 124.76 80.70 82.40 123.89 73.49 80.65 119.57GROWTH RATE 9.2200 7.6717 18.7682 6.1765 4.2909 13.8872 9.3985 7.8817 18.9640
Table VI-BDistrict-wise Rate of <strong>Literacy</strong> (10 Years & above) by Sex & Urban andRural areas of S<strong>in</strong>dhS<strong>in</strong>dhProv<strong>in</strong>ce/DistrictYearsBothSexesAll AreasMale Female BothSexes(<strong>Literacy</strong> Rates <strong>in</strong> Percentages)UrbanRuralMale Female Both MaleSexesFemaleJacobabadShikarpurLarkanaKhairpur1981 10.9 17.5 3.2 29.2 42.78 13.2 7.4 12.6 1.21998 23.66 34.08 12.3 43.86 57.02 29.57 16.86 26.37 6.472001 27.13 38.33 15.60 47.12 59.99 34.09 19.50 30.04 8.712003 29.72 41.46 18.28 49.44 62.05 37.49 21.48 32.77 10.622005 32.55 44.84 21.41 51.86 64.18 41.22 23.67 35.74 12.952008 37.33 50.44 27.16 55.72 67.52 47.52 27.37 40.72 17.43GROWTH RATE 4.6645 3.9985 8.2424 2.4220 1.7045 4.8587 4.9631 4.4400 10.41871981 22.9 35.6 8.7 44.8 59.4 28.4 17.7 30.00 4.11998 31.94 44.95 18.04 55.33 68.34 41.26 23.92 36.88 10.152001 33.87 46.84 20.52 57.43 70.05 44.07 25.23 38.25 11.912003 35.22 48.14 22.36 58.87 71.22 46.05 26.14 39.19 13.252005 36.63 49.48 24.36 60.35 72.40 48.12 27.08 40.15 14.742008 38.84 51.56 27.70 62.65 74.22 51.40 28.56 41.64 17.30GROWTH RATE 1.9765 1.3812 4.3832 1.2495 0.8281 2.2214 1.7873 1.2219 5.47701981 22.12 32.63 9.93 40.96 52.4 27.5 16.45 26.63 4.691998 34.95 48.56 20.48 51.95 65.16 37.83 27.68 41.44 13.12001 37.89 52.09 23.27 54.18 67.71 40.02 30.34 44.80 15.702003 39.98 54.58 25.34 55.71 69.47 41.55 32.26 47.20 17.722005 42.19 57.20 27.59 57.29 71.28 43.14 34.29 49.72 20.002008 45.74 61.35 31.35 59.75 74.07 45.64 37.59 53.75 23.97GROWTH RATE 2.7273 2.3662 4.3501 1.4080 1.2902 1.8937 3.1084 2.6354 6.22851981 21.66 34.23 7.05 33.07 46.55 17.38 17.76 30.02 3.521998 35.5 49.69 19.77 50.68 63.94 36.05 30.61 45.1 14.482001 38.73 53.07 23.72 54.65 67.62 41.00 33.70 48.46 18.582003 41.05 55.45 26.77 57.46 70.20 44.68 35.93 50.84 21.952005 43.51 57.93 30.23 60.42 72.87 48.68 38.30 53.33 25.922008 47.47 61.87 36.26 65.15 77.07 55.37 42.16 57.30 33.27GROWTH RATE 2.9489 2.2166 6.2532 2.5430 1.8847 4.3851 3.2540 2.4231 8.6753
Prov<strong>in</strong>ce/DistrictSukkurGhotkiNawabshahNaushahro FerozeDaduAll Areas Urban RuralYears Both Male Female Both Male Female Both Male FemaleSexesSexesSexes1981 26.34 37.49 12.81 43.86 54.35 31.13 18.77 30.21 4.91998 46.62 59.83 31.22 59.76 70.59 46.9 31.72 47.4 13.782001 51.56 64.97 36.53 63.11 73.92 50.42 34.80 51.32 16.542003 55.14 68.65 40.57 65.45 76.23 52.91 37.01 54.11 18.682005 58.98 72.53 45.05 67.88 78.61 55.52 39.37 57.06 21.092008 65.23 78.76 52.72 71.69 82.33 59.69 43.19 61.78 25.32GROWTH RATE 3.4155 2.7878 5.3799 1.8363 1.5498 2.4402 3.1345 2.6851 6.27101981 22.44 37.00 5.00 32.10 47.95 13.39 20.66 35.00 3.441998 29.01 44.21 11.85 49.38 64.63 32.72 24.87 40.14 7.522001 30.35 45.62 13.80 53.28 68.13 38.31 25.70 41.12 8.632003 31.29 46.59 15.27 56.05 70.56 42.55 26.26 41.79 9.462005 32.25 47.57 16.91 58.96 73.08 47.27 26.84 42.47 10.382008 33.74 49.09 19.69 63.62 77.04 55.34 27.74 43.51 11.91GROWTH RATE 1.5220 1.0528 5.2069 2.5658 1.7715 5.3963 1.0969 0.8093 4.70801981 23.00 34.1 10.8 46.1 58.00 32.3 18.3 29.1 6.61998 34.13 47.62 19.62 54.26 64.94 42.69 26.47 41 10.892001 36.59 50.51 21.80 55.84 66.25 44.84 28.25 43.56 11.902003 38.33 52.53 23.39 56.92 67.13 46.34 29.51 45.35 12.622005 40.15 54.64 25.09 58.03 68.03 47.89 30.81 47.22 13.382008 43.05 57.96 27.87 59.72 69.40 50.30 32.89 50.16 14.62GROWTH RATE 2.3488 1.9839 3.5742 0.9633 0.6670 1.6541 2.1950 2.0371 2.98961981 − − − − − − − − −1998 39.14 54.27 22.6 53.34 66.15 39.57 35.99 51.66 18.82001 42.99 58.91 25.75 54.73 67.70 41.01 40.55 57.17 22.612003 45.76 62.22 28.08 55.68 68.76 42.00 43.91 61.16 25.582005 48.72 65.71 30.63 56.64 69.83 43.02 47.55 65.43 28.932008 53.51 71.33 34.89 58.12 71.47 44.59 53.58 72.41 34.80GROWTH RATE 3.1768 2.7711 4.4393 0.8618 0.7764 1.2013 4.0587 3.4338 6.35111981 21.5 32.5 8.6 39.6 50.6 26.2 18.5 29.4 5.71998 35.56 48.03 21.65 54.3 66.6 41.11 30.34 42.98 16.082001 38.86 51.46 25.48 57.41 69.91 44.51 33.11 45.96 19.312003 41.23 53.88 28.40 59.58 72.21 46.93 35.09 48.06 21.822005 43.75 56.41 31.66 61.84 74.58 49.49 37.19 50.25 24.652008 47.81 60.44 37.27 65.38 78.28 53.58 40.59 53.74 29.60GROWTH RATE 3.0041 2.3242 5.5810 1.8744 1.6293 2.6854 2.9527 2.2589 6.2906
Prov<strong>in</strong>ce/DistrictHyderabadBad<strong>in</strong>ThattaSangharMirpurkhasAll Areas Urban RuralYears Both Male Female Both Male Female Both Male FemaleSexesSexesSexes1981 28.7 36.5 19.8 41.2 48.3 33 18.1 26.4 9.001998 44.25 52.63 34.97 61.3 67.32 54.58 24.84 35.76 12.892001 47.76 56.14 38.66 65.75 71.38 59.65 26.27 37.73 13.732003 50.26 58.61 41.34 68.90 74.23 63.29 27.26 39.10 14.332005 52.89 61.19 44.20 72.20 77.18 67.14 28.30 40.52 14.942008 57.08 65.27 48.87 77.44 81.84 73.38 29.92 42.75 15.92GROWTH RATE 2.5795 2.1761 3.4025 2.3648 1.9723 3.0040 1.8795 1.8011 2.13561981 14.83 21.84 6.79 37.03 49.02 23.51 12.06 18.4 4.851998 24.63 35.07 12.9 44.76 56.24 31.33 20.52 30.66 9.232001 26.94 38.13 14.45 46.28 57.62 32.96 22.54 33.55 10.342003 28.59 40.31 15.58 47.33 58.56 34.09 23.99 35.63 11.152005 30.35 42.62 16.80 48.39 59.51 35.26 25.54 37.83 12.032008 33.19 46.34 18.82 50.04 60.97 37.10 28.05 41.40 13.48GROWTH RATE 3.0292 2.8251 3.8473 1.1215 0.8115 1.7035 3.1759 3.0491 3.85771981 17.78 26.47 7.72 35.39 49.92 18.83 15.84 23.9 6.471998 22.14 31.58 11.4 45.92 56.98 33.9 18.99 28.31 8.342001 23.01 32.58 12.21 48.08 58.33 37.61 19.61 29.17 8.722003 23.62 33.26 12.78 49.58 59.24 40.30 20.03 29.76 8.992005 24.23 33.96 13.38 51.12 60.17 43.19 20.46 30.35 9.262008 25.19 35.04 14.34 53.52 61.59 47.91 21.13 31.28 9.68GROWTH RATE 1.2984 1.0437 2.3194 1.5440 0.7811 3.5191 1.0726 1.0011 1.50471981 19.24 28.46 8.48 41.00 53.95 26.03 13.21 21.44 3.551998 30.87 42.88 17.45 53.15 64.65 40.55 23.94 36.18 10.172001 33.56 46.10 19.82 55.64 66.75 43.85 26.59 39.68 12.252003 35.48 48.37 21.58 57.37 68.18 46.20 28.51 42.20 13.862005 37.50 50.76 23.49 59.14 69.65 48.67 30.58 44.88 15.692008 40.77 54.57 26.68 61.92 71.91 52.63 33.96 49.22 18.89GROWTH RATE 2.8202 2.4405 4.3363 1.5385 1.0700 2.6419 3.5594 3.1258 6.38681981 25.26 34.34 14.98 38.65 48.47 27.42 14.75 23.15 5.311998 35.97 45.99 25.05 59.8 68.02 50.92 23.13 34.21 10.982001 38.29 48.42 27.43 64.59 72.21 56.80 25.04 36.65 12.482003 39.91 50.12 29.14 67.99 75.15 61.09 26.40 38.37 13.602005 41.61 51.87 30.96 71.57 78.20 65.70 27.84 40.18 14.812008 44.28 54.61 33.90 77.30 83.02 73.29 30.14 43.04 16.83GROWTH RATE 2.1010 1.7332 3.0707 2.6006 2.0133 3.7082 2.6817 2.3238 4.3661
Prov<strong>in</strong>ce/DistrictTharparkarUmerkotKarachi EastKarachi WestAll Areas Urban RuralYears Both Male Female Both Male Female Both Male FemaleSexesSexesSexes1981 16.4 23.7 7.9 38.2 49.2 25.5 11.9 18.4 4.21998 18.32 28.33 6.91 57.27 71.14 41.68 16.35 26.17 5.142001 18.68 29.24 6.75 61.51 75.92 45.46 17.29 27.85 5.332003 18.93 29.86 6.64 64.51 79.29 48.16 17.95 29.03 5.452005 19.17 30.49 6.54 67.66 82.81 51.03 18.63 30.26 5.592008 19.55 31.47 6.39 72.67 88.37 55.65 19.71 32.20 5.79GROWTH RATE 0.6534 1.0552 -0.7845 2.4106 2.1929 2.9324 1.8863 2.0938 1.19511981 16.24 24.04 7.02 30.87 42.35 16.89 13.62 20.71 5.281998 24.83 36.32 11.94 49.5 64.27 31.79 19.51 30.06 7.842001 26.76 39.06 13.11 53.80 69.18 35.54 20.79 32.10 8.412003 28.13 41.01 13.96 56.87 72.66 38.29 21.69 33.54 8.812005 29.57 43.05 14.86 60.12 76.31 41.25 22.62 35.04 9.232008 31.87 46.30 16.32 65.35 82.14 46.12 24.10 37.43 9.89GROWTH RATE 2.5290 2.4570 3.1736 2.8165 2.4840 3.7902 2.1366 2.2158 2.35261981 53.79 58.91 47.21 57.95 62.90 51.57 13.78 20.26 5.531998 73.11 75.72 70.05 73.11 75.72 70.05 − − −2001 77.18 79.15 75.10 76.17 78.24 73.94 − − −2003 80.02 81.52 78.67 78.28 79.97 76.652005 82.96 83.97 82.41 80.45 81.73 79.472008 87.57 87.77 88.35 83.82 84.45 83.88GROWTH RATE 1.8216 1.4876 2.3483 1.3764 1.0971 1.81791981 57.37 61.33 52.53 57.85 61.79 53.02 32.19 37.39 25.481998 56.04 62.14 48.32 57.13 63.22 49.38 45.1 50.98 38.112001 55.81 62.28 47.61 57.00 63.48 48.76 47.87 53.85 40.922003 55.65 62.38 47.15 56.92 63.65 48.36 49.80 55.85 42.902005 55.50 62.48 46.69 56.84 63.82 47.95 51.82 57.92 44.982008 55.27 62.62 46.00 56.71 64.08 47.36 55.00 61.18 48.29GROWTH RATE -0.1379 0.0772 -0.4902 -0.0736 0.1347 -0.4175 2.0035 1.8404 2.3964
Prov<strong>in</strong>ce/DistrictKarachi SouthKarachi CentralAll AreasUrbanRuralYears Both Male Female Both Male Female Both Male FemaleSexesSexesSexes1981 53.15 59.48 45.33 53.15 59.48 45.33 − − −1998 67.59 71.63 62.67 67.59 71.63 62.67 − − −2001 70.52 74.02 66.36 70.52 74.02 66.36 − − −2003 72.54 75.65 68.93 72.54 75.65 68.932005 74.62 77.33 71.61 74.62 77.33 71.612008 77.85 79.91 75.82 77.85 79.91 75.82GROWTH RATE 1.4238 1.0994 1.9236 1.4238 1.0994 1.92361981 − − − − − − − − −1998 76.00 77.83 73.92 76.00 77.83 73.92 − − −2001 − − − − − − − − −Malir1981 − − − − − − − − −1998 53.56 61.44 42.87 55.65 62.69 45.43 49.16 58.57 38.052001 − − − − − − − − −
Table VII-ADistrict-wise Rate of <strong>Literacy</strong> by Sex & Urban andRural areas of PunjabPunjab1998(<strong>Literacy</strong> Rates <strong>in</strong> Percentages)All AreasUrbanRuralProv<strong>in</strong>ce/District Age Group Both Sexes Male Female Both Sexes Male Female Both Sexes Male FemaleAttockRawalp<strong>in</strong>diJhelumChakwalSargodhaBhakkarKhushabMianwali10 & above 49.27 66.94 31.99 69.41 80.83 56.32 43.65 62.66 25.8715-24 63.91 82.78 45.81 81.61 88.91 72.78 58.59 80.61 38.8310 & above 70.45 81.19 59.18 76.01 82.21 68.84 63.94 79.86 49.0215-24 82.14 87.81 76.25 84.48 86.83 81.83 79.22 89.10 69.9010 & above 63.92 77.66 50.47 77.21 84.85 68.00 58.55 74.31 44.3815-24 78.79 87.93 70.02 88.45 89.06 83.48 75.53 87.32 64.9410 & above 56.72 73.42 42.15 70.72 79.82 61.81 54.75 72.45 39.5515-24 73.22 86.57 61.74 85.58 86.55 78.81 71.77 86.55 59.2410 & above 46.30 59.16 32.66 64.17 72.34 55.26 23.72 53.74 39.0915-24 59.52 73.32 45.77 76.07 80.60 71.34 52.34 70.04 35.0510 & above 34.17 49.72 17.55 55.13 67.65 41.54 30.07 46.18 12.9115-24 44.21 64.24 24.32 65.43 76.06 54.43 39.91 61.80 18.2110 & above 40.50 59.83 21.77 51.64 65.91 37.39 36.70 57.71 16.5515-24 52.42 75.62 31.38 63.74 76.99 51.38 48.42 75.12 24.4410 & above 42.76 63.78 22.07 57.07 73.49 39.93 39.79 60.98 17.2915-24 53.30 78.15 30.25 69.01 83.39 54.68 48.82 76.54 23.55
All AreasUrbanRuralProv<strong>in</strong>ce/District Age Group Both Sexes Male Female Both Sexes Male Female Both Sexes Male FemaleFaisalabadJhangToba Tek S<strong>in</strong>ghGujranwalaHafizabadGujratMandiB h ddiSialkotNarowalLahoreKasur10 & above 51.94 60.85 42.16 64.18 69.81 57.89 42.53 53.85 30.2715-24 64.74 71.81 57.36 74.94 76.57 73.20 55.96 67.60 44.0910 & above 37.12 51.53 21.43 57.50 66.82 47.29 30.73 46.72 13.3615-24 47.96 65.31 30.38 68.32 75.16 61.17 41.07 61.91 20.1210 & above 50.50 61.34 39.13 63.15 70.70 55.19 47.51 59.12 35.3415-24 64.94 74.78 55.31 75.55 79.46 71.73 62.26 73.60 51.1610 & above 56.55 63.60 48.80 63.97 68.78 58.59 48.65 57.99 38.5915-24 69.89 74.47 65.08 74.91 75.78 73.95 64.34 72.99 55.4110 & above 40.74 51.79 28.67 54.68 63.13 45.47 35.47 47.52 22.3215-24 54.32 66.82 41.39 66.43 72.28 60.44 49.51 64.68 33.7710 & above 62.18 72.98 51.55 72.79 79.28 65.37 57.93 70.17 46.5715-24 79.59 85.67 73.88 84.76 86.17 83.21 77.37 85.38 70.2310 & above 47.44 58.77 35.64 67.08 75.35 58.64 43.83 55.76 31.3615-24 64.61 75.55 53.91 81.19 84.70 77.78 61.32 73.74 49.1410 & above 58.92 65.96 51.52 72.32 75.98 68.19 53.84 61.98 45.5215-24 74.52 78.78 70.32 83.60 83.40 83.76 71.09 76.98 65.3510 & above 52.65 65.60 39.76 67.46 75.45 59.32 50.52 64.17 36.9915-24 70.11 84.14 56.95 81.23 85.42 77.24 68.51 83.95 54.0610 & above 64.66 69.05 59.68 69.15 72.73 65.10 41.70 50.35 31.7415-24 73.06 74.81 71.15 77.31 77.71 76.85 50.90 59.88 40.8210 & above 36.21 47.64 23.44 49.36 57.20 40.60 32.15 44.69 18.1215-24 47.69 61.32 32.83 60.35 66.37 53.88 43.70 59.75 26.11
All Areas Urban RuralProv<strong>in</strong>ce/District Age Group Both Sexes Male Female Both Sexes Male Female Both Sexes Male FemaleOkaraSheikhupuraVehariSahiwalPakpattanMultanKhanewalLodhranDera GhaziKhRajanpurLayyah10 & above 37.79 49.27 24.99 58.74 68.18 47.35 31.26 43.08 18.3915-24 49.31 62.52 41.57 68.96 74.86 62.42 43.04 58.42 27.4810 & above 43.78 53.28 33.33 57.56 64.34 50.09 38.78 49.26 27.2515-24 55.61 65.15 45.50 68.19 72.01 64.08 50.92 62.58 38.4510 & above 36.79 49.40 23.18 56.66 66.12 46.48 32.90 46.13 18.6015-24 48.64 63.60 33.34 68.47 74.78 61.91 44.56 61.29 27.5310 & above 43.90 54.72 32.25 65.76 70.91 60.10 39.42 51.36 26.6215-24 56.81 68.22 45.34 76.06 77.75 74.31 52.60 66.10 39.0610 & above 34.70 46.98 21.33 57.63 66.08 48.47 30.75 43.70 16.6515-24 46.54 62.12 30.64 69.11 74.70 63.41 42.42 59.83 24.6410 & above 43.38 53.25 32.28 60.90 67.51 53.21 29.47 41.61 16.1815-24 52.78 62.56 42.30 69.27 72.57 65.61 38.82 53.91 22.9210 & above 39.94 53.63 25.11 60.68 70.55 49.97 35.38 49.90 19.6415-24 51.55 67.07 35.49 71.68 78.27 64.87 46.93 64.51 28.7310 & above 29.90 42.68 15.96 47.66 59.24 35.05 26.83 39.82 12.6515-24 39.80 55.92 22.72 57.34 67.44 46.66 36.60 53.82 18.3610 & above 30.61 42.09 18.05 61.79 69.34 53.63 25.00 37.22 11.5815-24 39.28 53.42 24.40 71.38 75.56 67.09 33.01 49.16 15.8610 & above 20.73 29.01 11.35 49.95 60.07 38.93 15.47 23.55 6.2615-24 27.50 37.96 16.14 60.11 68.69 51.20 21.14 32.14 9.0310 & above 38.68 52.98 23.39 62.45 72.60 51.54 34.92 49.86 18.9515-24 49.90 68.83 32.92 73.18 79.71 66.45 40.07 64.67 27.50
All Areas Urban RuralProv<strong>in</strong>ce/District Age Group Both Sexes Male Female Both Sexes Male Female Both Sexes Male FemaleMuzaffargarhBahawalpurBahawalnagarRahim YarKh10 & above 28.45 40.87 14.77 55.53 64.83 44.92 24.12 36.96 10.0515-24 35.60 50.66 19.76 64.45 70.99 57.11 30.73 47.09 13.7410 & above 35.03 44.86 23.95 57.00 65.28 47.12 26.31 36.44 15.1315-24 44.60 55.90 32.77 65.24 70.98 58.87 36.12 49.50 22.3610 & above 35.07 45.52 23.78 52.86 61.22 43.86 30.81 41.77 18.8615-24 46.88 59.02 34.76 64.20 69.40 58.93 42.54 56.37 28.7710 & above 33.09 43.40 21.82 57.03 64.97 48.45 26.92 37.88 14.9115-24 42.62 54.37 30.58 67.56 72.85 62.12 35.87 49.38 22.02
Table VII-DDistrict-wise Rate of <strong>Literacy</strong> by Sex & Urban andRural areas of Balochistan1998Balochistan(<strong>Literacy</strong> Rates <strong>in</strong> Percentages)All AreasUrbanRuralProv<strong>in</strong>ce/District Age Group Both Sexes Male Female Both Sexes Male Female Both Sexes Male FemaleQuetta 10 & above 57.07 67.27 44.53 64.23 73.82 52.28 34.13 45.71 20.5815-24 63.49 72.46 53.42 66.11 73.66 57.55 55.45 68.71 41.01Pish<strong>in</strong> 10 & above 31.14 47.29 13.15 37.13 47.21 24.92 30.71 47.3 12.3315-24 34.91 55.73 15.11 41.59 53.84 27.04 34.47 55.84 14.43Qilla Abdullah 10 & above 16.1 23.75 6.77 29.06 39.78 14.7 13.66 20.58 5.3715-24 17.78 27.53 7.13 31.41 42.14 17.5 15.28 24.58 5.42Chagai 10 & above 26.99 37.99 13.76 45.42 58.64 30.07 22.95 33.55 10.115-24 33.96 48.81 16.68 54.46 70.35 37.01 29.39 24.18 11.96Loralai 10 & above 20.47 30.12 9.24 53.28 66.15 33.39 15.82 24.25 6.3915-24 24 35.99 11.2 60.76 76.46 38.62 18.12 28.2 7.98Musakhel 10 & above 10.37 14.34 4.8 16.05 23.8 6.28 9.86 13.53 4.6615-24 15.07 19.77 8.09 24.55 34.64 11.63 14.28 18.64 7.74Barkhan 10 & above 15.67 23.69 6.41 37.14 49.48 21.15 13.95 21.51 5.3215-24 23.3 35.13 9.43 51.58 69.03 29.58 20.97 32.26 7.81Killa Saifullah 10 & above 17.55 24.98 8.92 33.88 43.12 23.18 15.08 22.24 6.7515-24 22.48 33.19 12.05 41.33 53.04 30.33 19.4 29.95 9.05
All Areas Urban RuralProv<strong>in</strong>ce/District Age Group Both Sexes Male Female Both Sexes Male Female Both Sexes Male FemaleZhob 10 & above 16.78 24.53 6.9 47.84 63.37 24.22 10.4 15.8 3.7515-24 21.12 30.95 9.03 57.72 74.99 31.23 12.73 19.75 4.59Sibi 10 & above 25.47 35.25 13.6 41.63 52.25 29.08 17.92 27.44 6.1915-24 31.67 93.54 17.86 50.21 67.71 37.07 22.7 34.86 8.4Ziarat 10 & above 34.34 51.38 17.02 51.49 65.71 19.87 33.93 50.91 16.9815-24 41.92 65.22 23.1 61.21 77.55 27.45 41.5 64.84 23.06Kohlu 10 & above 12.15 17.83 4.85 39.84 55.15 17.76 9.19 13.61 3.5715-24 17.31 25.35 7.41 51.54 70.64 25.61 13.18 19.64 5.32Dera Bugti 10 & above 11.73 18.89 2.97 28.71 41.94 12.94 10.05 16.64 1.9615-24 15.67 26.22 3.41 35.44 51.7 15.13 13.5 23.42 2.18Jafarabad 10 & above 18.51 27.5 8.64 27.46 38.24 15.56 16.26 24.8 6.9215-24 25.4 38.57 11.8 34.03 47.46 20.08 23.15 36.24 9.66Nasirabad 10 & above 12.69 19.51 5.06 21.78 32.77 8.86 11.05 17.06 4.3915-24 18.33 28.97 6.95 27.17 40.97 11.28 16.61 26.52 1.55Jhal Magsi 10 & above 12.28 17.64 5.97 24.36 34.45 13.3 11.31 16.34 5.3615-24 18.33 25.92 9.48 32.5 44.72 18.95 17.16 24.42 8.66Bolan 10 & above 15.74 23.08 6.93 36.24 48.93 21.54 12.34 18.87 4.4515-24 21.95 32.49 9.75 44.76 60.42 28.3 17.83 27.76 6.12Kalat 10 & above 19.86 29.24 9.44 44.67 60.2 28.14 15.69 24.17 6.2115-24 24.6 37.77 11.22 51.54 71.35 32.89 19.91 32.18 7.25Mastung 10 & above 27.58 37.66 15.73 53.19 66.12 38.97 23.05 32.81 11.4415-24 33.87 47.06 19.06 61.32 74.57 47.19 29.1 42.42 13.99
All Areas Urban RuralProv<strong>in</strong>ce/District Age Group Both Sexes Male Female Both Sexes Male Female Both Sexes Male FemaleKhuzdar 10 & above 17.46 25.33 8.39 30.71 42.01 17.57 12.28 18.77 4.8315-24 22.34 33.41 10.81 35.91 49.86 21.76 16.48 26.45 6.12Awaran 10 & above 14.79 23.16 5.6 - - - 14.79 23.16 5.615-24 20.77 34.57 6.9 - - - 20.77 34.57 6.9Kharan 10 & above 15.05 23.73 5.69 31.75 48.89 13.91 12.5 19.97 4.4115-24 19.53 32.53 7.34 37.94 59.65 17.98 16.44 27.99 5.57Lasbela 10 & above 22.3 32.16 10.46 34.88 45.79 20.54 14.88 23.59 4.9815-24 30.01 43.79 14.1 43.75 56.92 26.6 21.07 34.45 6.74Kech 10 & above 27.51 38.07 16.28 45.34 59.71 28.8 23.74 33.29 13.7715-24 35.84 51.59 21.57 56.86 74.7 38.6 31.44 46.35 18.26Gwadar 10 & above 25.47 35.52 13.81 34.07 46.27 19.87 14.84 22.19 6.3815-24 32.27 46.18 17.52 42.19 57.93 26.64 19.36 30.93 6.85Panjgur 10 & above 31.35 39.35 22.34 44.32 54.13 33.75 29.93 37.77 21.0615-24 38.85 49.77 28.84 51.19 62.71 40.22 37.33 48.21 27.43
Table VII-CDistrict-wise Rate of <strong>Literacy</strong> by Sex & Urban andRural areas of NWFP1998N.W.F.P.(<strong>Literacy</strong> Rates <strong>in</strong> Percentages)All Areas Urban RuralProv<strong>in</strong>ce/District Age Group Both Sexes Male Female Both Sexes Male Female Both Sexes Male FemaleChitral 10 & above 40.30 58.02 22.09 56.65 71.53 38.19 38.40 56.29 20.4215-24 55.05 79.24 32.90 70.46 86.82 52.41 53.18 78.21 30.79Upper Dir 10 & above 21.21 36.10 6.10 41.05 58.59 22.61 20.34 35.09 5.3815-24 30.34 52.14 8.20 52.46 73.65 31.46 29.30 51.15 7.09Lower Dir 10 & above 29.90 48.76 12.25 43.51 60.54 24.12 28.97 47.86 11.5215-24 40.38 66.99 16.38 56.96 77.22 33.46 39.21 66.16 15.30Swat 10 & above 28.75 43.16 13.45 48.05 62.89 31.18 25.53 39.75 10.6215-24 37.08 56.84 17.49 56.19 73.23 38.02 33.80 53.92 14.08Shangla 10 & above 14.73 25.16 3.71 - - - 14.73 25.16 3.7115-24 21.20 36.50 5.72 - - - 21.20 36.50 5.72Buner 10 & above 22.62 38.18 7.65 - - - 22.62 38.18 7.6515-24 30.06 52.71 9.62 - - - 30.06 52.71 9.62Malakand P.A. 10 & above 39.50 55.21 22.74 39.29 51.40 25.26 39.52 55.64 22.4815-24 50.14 70.86 29.07 46.77 63.29 29.49 50.52 71.72 29.03Kohistan 10 & above 11.08 17.23 2.95 - - - 11.08 17.23 2.9515-24 14.34 22.01 3.34 - - - 14.34 22.01 3.34
All Areas Urban RuralProv<strong>in</strong>ce/District Age Group Both Sexes Male Female Both Sexes Male Female Both Sexes Male FemaleMansehra 10 & above 36.32 50.90 22.71 68.49 76.74 59.65 34.87 49.24 20.6515-24 46.53 65.56 30.79 80.25 85.62 74.88 44.40 64.14 28.27Batagram 10 & above 18.31 29.40 6.48 - - - 18.31 29.40 6.4815-24 24.44 40.69 7.92 - - - 24.44 40.69 7.92Abbottabad 10 & above 56.61 74.52 39.11 76.73 85.69 64.71 51.85 71.33 34.1815-24 71.21 88.73 54.29 88.46 93.42 80.69 66.44 86.98 49.01Haripur 10 & above 53.72 70.45 37.40 69.73 79.36 59.54 51.39 69.09 34.3415-24 69.69 86.48 53.57 84.42 88.95 79.72 67.45 86.09 49.76Mardan 10 & above 36.45 53.50 18.38 48.27 62.83 31.86 33.31 50.92 14.9315-24 45.84 68.33 23.30 57.98 74.19 40.31 42.39 66.55 18.72Swabi 10 & above 36.03 53.99 18.28 43.35 60.95 25.52 34.45 52.47 16.7415-24 46.70 70.02 24.52 55.69 76.15 35.24 44.75 68.64 22.24Charsadda 10 & above 31.11 46.92 14.07 39.82 55.26 23.07 28.97 44.87 11.8815-24 40.02 62.01 17.88 50.49 69.24 30.48 37.46 60.18 14.90Peshawar 10 & above 41.79 55.97 25.85 54.09 65.27 41.11 29.19 46.14 10.7415-24 48.84 65.64 30.64 61.44 72.96 48.60 35.80 57.80 12.67Nowshehra 10 & above 42.50 60.55 22.68 55.64 70.42 36.62 37.59 56.48 18.0615-24 51.72 73.56 28.26 65.81 81.08 45.12 46.16 70.01 22.67Kohat 10 & above 44.06 65.00 23.48 67.02 79.10 51.45 34.52 57.95 13.9415-24 54.39 78.81 29.62 77.58 87.09 63.77 43.64 73.64 17.84Hangu 10 & above 30.50 53.48 9.84 45.90 65.71 25.33 26.23 49.75 5.9115-24 38.37 66.74 12.18 54.44 76.20 31.49 33.96 63.89 7.32
All Areas Urban RuralProv<strong>in</strong>ce/District Age Group Both Sexes Male Female Both Sexes Male Female Both Sexes Male FemaleKarak 10 & above 41.92 68.15 18.12 53.84 75.59 31.78 41.07 67.59 17.2015-24 54.00 86.08 25.28 65.19 87.81 43.50 53.18 85.95 23.97Bannu 10 & above 32.11 50.79 12.18 60.47 72.25 45.05 29.63 48.71 9.6215-24 39.02 62.43 15.80 68.41 78.55 56.59 36.51 60.93 12.58Lakki Marwat 10 & above 29.71 50.32 8.63 48.81 66.64 29.29 27.54 48.40 6.3815-24 37.45 65.21 11.13 58.73 77.47 38.88 35.02 63.71 8.12Dera Ismail 10 & above 31.28 43.19 17.86 65.17 75.02 53.80 24.70 36.93 11.00Kh15-24 40.06 55.18 23.82 75.78 82.53 68.35 32.94 49.67 14.96Tank 10 & above 26.25 42.44 8.59 43.14 59.38 24.71 23.15 39.27 5.7115-24 32.96 53.64 11.27 51.28 68.19 32.80 29.44 50.78 7.21
Table VII-E<strong>Literacy</strong> Rates by Sex & Urban and RuralAreas of <strong>Islamabad</strong><strong>Islamabad</strong>1998(<strong>Literacy</strong> Rates <strong>in</strong> Percentages)All Areas Urban RuralProv<strong>in</strong>ce/District Age Group Both Sexes Male Female Both Sexes Male Female Both Sexes Male Female<strong>Islamabad</strong>10 & above 72.38 80.64 62.39 77.25 83.2 69.68 62.52 75.09 48.7815-24 81.31 86.62 74.86 84.1 87.88 79.31 75.68 83.95 66.49
Table VII-BDistrict-wise Rate of <strong>Literacy</strong> by Sex & Urban andRural areas of S<strong>in</strong>dh1998S<strong>in</strong>dh(<strong>Literacy</strong> Rates <strong>in</strong> Percentages)All AreasUrbanRuralProv<strong>in</strong>ce/District Age Group Both Sexes Male Female Both Sexes Male Female Both Sexes Male FemaleJacobabadShikarpurLarkanaKhairpurSukkurGhotkiNawabshahNaushahro Feroze10 & above 23.66 34.08 12.30 43.86 57.02 29.57 16.86 26.37 6.4715-24 29.03 42.65 15.94 50.15 64.11 36.62 21.44 34.93 8.4710 & above 31.94 44.95 18.04 55.33 68.34 41.26 23.92 36.88 10.1515-24 36.47 51.76 21.98 62.38 74.38 50.33 27.50 43.63 12.5310 & above 34.95 48.56 20.48 51.95 65.16 37.83 27.68 41.44 13.1015-24 40.94 56.97 25.89 58.86 71.82 46.25 32.94 50.17 17.0010 & above 35.50 49.69 19.77 50.68 63.94 36.05 30.61 45.10 14.4815-24 41.54 58.02 25.03 57.70 71.00 44.19 36.30 53.77 18.8510 & above 46.62 59.83 31.22 59.76 70.59 46.90 31.72 47.40 13.7815-24 51.99 65.36 37.78 65.77 74.67 56.09 36.09 54.39 16.9610 & above 29.01 44.21 11.85 49.38 64.63 32.72 24.87 40.14 7.5215-24 34.91 53.05 15.59 56.89 71.37 32.28 30.33 49.27 10.0310 & above 34.13 47.62 19.62 54.26 64.94 42.69 26.47 41.00 10.8915-24 40.07 55.99 24.98 63.22 72.34 54.08 30.84 49.20 13.8210 & above 39.14 54.27 22.60 53.34 66.15 39.57 35.99 51.66 18.8015-24 45.19 62.64 28.34 60.93 72.89 49.14 41.61 60.28 23.67
All Areas Urban RuralProv<strong>in</strong>ce/District Age Group Both Sexes Male Female Both Sexes Male Female Both Sexes Male FemaleDaduHyderabadBad<strong>in</strong>ThattaSangharMirpurkhasTharparkarUmerkotKarachi EastKarachi WestKarachi South10 & above 35.56 48.03 21.65 54.30 66.60 41.11 30.34 42.98 16.0815-24 40.86 54.29 27.57 60.56 72.02 49.82 35.12 49.30 20.8810 & above 44.25 52.63 34.97 61.30 67.32 54.58 24.84 35.76 12.8915-24 50.94 59.31 42.54 69.46 73.19 65.55 29.17 42.49 16.7010 & above 24.63 35.07 12.90 44.76 56.24 31.33 20.52 30.66 9.2315-24 29.95 42.77 16.82 51.15 62.28 39.46 25.59 38.70 12.2010 & above 22.14 31.58 11.40 45.92 56.98 33.90 18.99 28.31 8.3415-24 25.10 36.19 14.04 51.08 61.80 40.79 21.53 32.76 10.2610 & above 30.87 42.88 17.45 53.15 64.65 40.55 23.94 36.18 10.1715-24 37.01 50.63 23.06 62.28 72.56 51.71 28.80 43.51 13.7010 & above 35.97 45.99 25.05 59.80 68.02 50.92 23.13 34.21 10.9815-24 43.39 54.39 32.25 69.41 75.34 63.38 28.89 42.73 14.8510 & above 18.32 28.33 6.91 57.27 71.14 41.68 16.35 26.17 5.1415-24 24.85 39.35 9.21 65.90 79.20 51.24 22.56 37.11 6.8510 & above 24.83 36.32 11.94 49.50 64.27 31.79 19.51 30.06 7.8415-24 30.44 45.01 15.39 56.17 71.31 39.44 24.80 39.01 10.2410 & above 73.11 75.72 70.05 73.11 75.72 70.05 - - -15-24 78.82 79.06 78.50 78.82 79.06 78.50 - - -10 & above 56.04 62.14 48.32 57.13 63.22 49.38 45.10 50.98 38.1115-24 64.21 68.45 58.88 65.42 69.47 60.27 51.39 57.18 44.8010 & above 67.59 71.63 62.67 67.59 71.63 62.67 - - -15-24 74.58 76.16 72.64 74.58 76.16 72.64 - - -
All Areas Urban RuralProv<strong>in</strong>ce/District Age Group Both Sexes Male Female Both Sexes Male Female Both Sexes Male FemaleKarachi CentralMalir10 & above 76.00 77.83 73.92 76.00 77.83 73.92 - - -15-24 81.17 80.56 81.82 81.17 80.56 81.82 - - -10 & above 53.56 61.44 42.87 55.65 62.69 45.43 49.16 58.57 38.0515-24 59.79 66.69 50.15 61.77 67.61 52.91 55.13 64.38 44.69
Table VIII-AL<strong>in</strong>kage between <strong>Literacy</strong> & FertilityProv<strong>in</strong>ce-wise and District-wise Rates of <strong>Literacy</strong> & Fertility1998PUNJAB(<strong>Literacy</strong> Rates <strong>in</strong> Percentages)Illiterate Literate Matric & above Degree & aboveProv<strong>in</strong>ce/District Age Group %Woman Av_Child %Woman Av_Child %Woman Av_Child %Woman Av_ChildAttock 15 & above 77.25 4 22.55 3 4.98 2 0.76 215-19 69.36 1 30.64 1 4.83 0 0.55 020-24 70.93 1 28.81 1 7.03 1 0.75 0Rawalp<strong>in</strong>di 15 & above 49.09 4 50.33 3 14.39 3 3.36 315-19 44.54 2 55.11 1 7.56 1 0.00 020-24 40.81 2 58.86 2 20.82 2 1.29 3Jhelum 15 & above 55.07 4 44.66 4 9.31 3 1.35 315-19 42.20 2 57.55 1 11.82 1 0.19 020-2424 42.062 57.7171 2 14.55 2 123 1.23 1Chakwal 15 & above 69.59 5 30.13 4 6.20 3 0.91 315-19 60.58 2 38.75 2 6.84 1 0.17 120-24 60.33 3 39.37 2 11.03 2 1.12 4Sargodha 15 & above 76.85 5 22.88 4 4.51 4 0.57 415-19 70.70 1 29.06 1 4.71 1 0.08 120-24 70.83 3 29.02 2 5.95 2 0.78 2Bhakkar 15 & above 89.86 5 9.98 4 1.84 3 0.22 315-19 84.94 1 15.00 1 1.77 0 0.00 020-24 88.04 2 11.90 2 2.53 3 0.11 2
IlliterateLiterate Matric & above Degree & aboveProv<strong>in</strong>ce/District Age Group %Woman Av_Child%Woman Av_Child %Woman Av_Child %Woman Av_ChildKhushab 15 & above 86.36 4 13.27 3 2.74 3 0.53 315-19 78.51 2 21.49 1 2.96 1 0.00 020-24 83.20 2 16.31 2 3.42 1 0.49 2Mianwali 15 & above 86.89 5 12.89 4 3.36 3 0.51 315-19 84.30 2 15.36 2 3.18 2 0.41 020-24 82.51 2 17.08 2 4.79 1 0.36 1Faisalabad 15 & above 62.88 5 36.85 4 9.65 4 1.88 315-19 65.01 2 34.80 2 6.46 1 0.21 120-24 57.80 3 41.92 2 10.25 2 1.67 2Jhang 15 & above 84.96 4 14.61 4 3.49 3 0.80 315-19 81.472 18.08 1 2.65 2 0.06 020-24 83.19 2 16.55 2 4.55 2 0.57 1Toba Tek S<strong>in</strong>gh 15 & above 67.20 5 32.51 4 6.86 3 0.98 315-19 66.30 2 33.62 2 5.20 2 0.00 020-2424 59.022 40.74 2 902 9.02 2 117 1.17 2Gujranwala 15 & above 63.52 5 36.21 4 7.71 3 0.88 315-19 59.06 2 40.73 2 9.13 1 0.12 120-24 56.09 3 43.66 3 10.51 2 0.63 2Hafizabad 15 & above 79.98 5 19.65 4 3.63 3 0.49 315-19 73.04 1 26.55 1 4.33 1 0.19 120-24 73.40 2 26.01 2 4.39 2 0.61 2Gujrat 15 & above 55.785 43.95 4 10.24 3 1.63 315-19 43.57 1 56.15 2 8.63 1 0.59 320-24 40.39 2 59.39 2 14.47 2 1.87 1
IlliterateLiterate Matric & above Degree & aboveProv<strong>in</strong>ce/District Age Group %Woman Av_Child%Woman Av_Child %Woman Av_Child %Woman Av_ChildMandi Bahaudd<strong>in</strong> 15 & above 75.62 5 24.23 4 3.99 3 0.55 415-19 69.16 1 30.84 1 2.87 1 0.00 020-24 63.85 2 36.09 2 6.81 1 0.54 2Sialkot 15 & above 54.50 6 45.29 4 32.40 5 1.45 415-19 41.07 1 58.78 1 12.53 1 0.39 120-24 44.31 3 55.45 2 15.59 2 1.13 2Narowal 15 & above 72.27 5 27.45 4 4.74 3 0.48 315-19 51.36 1 48.07 1 6.48 1 0.00 020-24 60.23 2 39.42 2 7.25 2 0.51 2Lahore 15 & above 78.46 6 21.29 4 4.30 4 0.84 315-19 74.351 25.65 3 3.45 1 0.00 020-24 74.50 3 25.26 2 5.51 2 0.33 2Kasur 15 & above 83.25 5 16.37 4 4.05 3 0.57 315-19 78.44 2 21.35 2 4.61 1 0.00 020-2424 79.112 20.67 2 487 4.87 2 070 0.70 2Okara 15 & above 82.52 5 17.33 4 3.61 4 0.55 415-19 79.77 1 20.12 2 3.16 1 0.19 120-24 79.58 3 20.34 2 4.38 2 0.46 2Sheikhupura 15 & above 73.66 5 25.98 4 5.32 3 0.83 315-19 70.81 2 28.87 1 5.51 2 0.16 120-24 68.68 3 31.07 2 7.84 2 0.51 2Vehari 15 & above 84.475 14.85 4 2.61 3 0.55 315-19 81.06 2 18.83 1 2.15 1 0.37 120-24 82.11 2 17.46 2 3.31 2 0.50 2
Illiterate Literate Matric & above Degree & aboveProv<strong>in</strong>ce/District Age Group %Woman Av_Child%Woman Av_Child %Woman Av_Child %Woman Av_ChildSahiwal 15 & above 76.92 6 22.74 5 5.22 3 0.88 415-19 75.53 1 24.14 1 4.44 1 0.00 020-24 74.72 3 25.04 2 6.60 2 0.49 2Pakpattan 15 & above 86.19 4 13.35 4 2.57 3 0.46 315-19 80.32 1 19.31 1 2.19 1 0.31 120-24 83.16 2 16.38 2 2.87 2 0.41 1Multan 15 & above 81.09 5 18.57 4 4.18 4 0.60 415-19 78.98 2 20.23 1 3.73 1 0.18 020-24 75.81 3 24.08 3 5.25 2 0.68 5Khanewal 15 & above 83.28 5 16.56 4 3.87 3 0.77 315-19 80.071 19.66 1 4.18 1 0.14 220-24 79.70 2 20.23 2 4.76 2 0.68 2Lodhran 15 & above 90.19 5 9.68 4 1.71 3 0.34 415-19 86.68 1 13.32 1 2.47 1 0.28 120-2424 87.503 12.33 2 276 2.76 2 037 0.37 3Dera Ghazi Khan 15 & above 88.66 5 11.03 4 3.15 4 0.89 415-19 88.96 2 10.74 2 2.70 2 0.28 220-24 88.37 3 11.48 2 3.77 2 0.59 2Rajanpur 15 & above 92.56 5 7.32 4 1.85 4 0.44 415-19 91.94 2 7.96 2 1.40 2 0.07 120-24 92.28 3 7.65 3 2.25 2 0.31 2Layyah 15 & above 84.555 14.95 4 3.52 4 0.59 415-19 80.67 2 18.43 1 2.95 1 0.00 020-24 80.43 3 19.15 3 4.60 3 0.51 2
Illiterate Literate Matric & above Degree & aboveProv<strong>in</strong>ce/District Age Group %Woman Av_Child%Woman Av_Child %Woman Av_Child %Woman Av_ChildMuzaffargarh 15 & above 90.03 5 9.90 5 2.24 4 0.32 315-19 88.99 2 11.01 2 1.71 1 0.07 020-24 88.47 3 11.40 3 2.75 2 - -Bahawalpur 15 & above 83.83 5 15.88 4 3.58 3 0.64 315-19 82.50 2 17.28 1 3.17 1 0.15 120-24 82.50 3 17.27 2 4.28 2 0.30 2Bahawalnagar 15 & above 82.50 5 17.16 4 3.68 3 0.66 315-19 77.83 1 22.03 1 5.41 1 0.34 020-24 80.65 2 19.01 2 4.35 3 0.30 2Rahim Yar Khan 15 & above 83.31 5 15.64 4 4.20 4 1.10 315-19 85.392 14.03 2 3.17 2 0.63 120-24 81.23 3 17.56 2 5.22 3 0.85 3
Table VIII-BL<strong>in</strong>kage between <strong>Literacy</strong> & FertilityProv<strong>in</strong>ce-wise and District-wise Rates of <strong>Literacy</strong> & Fertility1998S<strong>in</strong>dh(<strong>Literacy</strong> Rates <strong>in</strong> Percentages)Illiterate Literate Matric & above Degree & aboveProv<strong>in</strong>ce/District Age Group %Woman Av_Child %Woman Av_Child %Woman Av_Child %Woman Av_ChildJacobabad 15 & above 90.58 3 9.19 3 1.79 3 0.54 315-19 89.83 1 9.99 1 2.15 1 0.38 220-24 90.02 2 9.78 2 2.47 2 0.59 2Shikarpur 15 & above 91.32 2 8.46 3 1.38 2 0.71 115-1919 92.680 720 7.20 1 132 1.32 0 024 0.24 320-24 82.97 1 8.27 1 1.82 1 0.58 0Larkana 15 & above 88.76 4 10.96 4 2.38 3 0.75 -15-19 84.89 1 14.93 1 3.93 1 0.26 120-24 88.13 2 11.62 2 3.52 2 0.56 2Khairpur 15 & above 86.92 4 12.72 4 2.85 4 0.98 315-19 85.49 1 14.25 1 4.00 1 0.17 120-24 86.18 2 13.65 2 3.45 2 1.09 2Sukkur 15 & above 82.10 4 16.95 4 3.69 3 1.36 315-19 84.07 1 15.24 1 3.42 1 0.07 120-24 82.33 2 16.59 2 4.12 2 0.98 1Ghotki 15 & above 90.654 8.78 3 1.76 3 0.61 315-19 88.47 1 10.95 1 2.35 1 0.81 120-24 89.18 2 10.36 2 2.71 2 0.43 2
IlliterateLiterate Matric & above Degree & aboveProv<strong>in</strong>ce/District Age Group %Woman Av_Child%Woman Av_Child %Woman Av_Child %Woman Av_ChildNawabshah 15 & above 88.30 4 11.02 4 2.45 3 1.20 415-19 85.24 2 14.40 1 3.79 1 0.95 120-24 86.74 2 12.92 2 3.21 2 1.38 3Naushahro Feroze 15 & above 87.73 734 11.86 4 177 1.77 3 095 0.95 415-19 86.54 1 13.15 1 2.63 1 0.76 120-24 86.03 2 13.57 2 2.94 3 - -Dadu 15 & above 83.54 4 14.78 4 2.75 3 1.54 415-19 84.66 2 14.22 1 3.61 2 0.25 220-24 82.92 3 15.64 2 3.53 2 1.28 2Hyderabad 15 & above 84.15 4 15.47 4 3.11 3 1.49 315-19 85.04 1 14.66 1 2.92 1 0.33 020-24 84.41 2 15.28 2 3.89 2 0.69 3Bad<strong>in</strong> 15 & above 91.29 4 8.37 4 1.55 3 1.04 315-19 90.33 1 9.51 2 2.43 1 0.82 120-24 90.942 8.75 2 2.03 2 0.72 2Thatta 15 & above 93.50 3 6.25 3 1.25 3 0.66 315-19 93.25 1 6.53 1 1.33 2 0.89 220-24 93.79 2 6.01 2 1.00 1 0.31 2Sanghar 15 & above 88.924 10.85 4 247 2.47 4 094 0.94 315-19 88.26 1 11.34 2 3.26 1 0.68 120-24 88.97 2 10.87 2 3.20 2 0.67 2Mirpurkhas 15 & above 84.35 4 15.22 4 4.08 4 1.36 415-19 87.41 1 12.30 2 3.61 2 0.05 120-24 84.37 2 15.00 3 5.03 3 0.83 2
IlliterateLiterate Matric & above Degree & aboveProv<strong>in</strong>ce/District Age Group %Woman Av_Child%Woman Av_Child %Woman Av_Child %Woman Av_ChildTharparkar 15 & above 96.27 5 3.63 4 1.08 3 0.14 415-19 92.87 2 7.11 1 2.59 1 0.0020-24 95.77 3 4.12 2 1.43 3 0.08 2Umerkot 15 & above 91.784 783 7.83 4 166 1.66 3 044 0.44 315-19 90.98 1 8.79 1 2.50 2 0.17 020-24 92.16 2 7.61 2 2.18 2 0.44 2Karachi East 15 & above 42.76 6 56.62 4 22.14 4 10.06 315-19 56.45 3 43.25 2 16.72 2 1.07 320-24 44.24 3 55.19 3 24.04 2 6.88 2Karachi West 15 & above 61.63 6 37.56 5 9.61 5 1.80 315-19 62.61 7 36.53 6 7.60 5 1.52 420-24 70.99 7 27.97 7 4.96 7 0.98 5Karachi South 15 & above 44.65 5 54.62 4 17.90 3 5.81 315-19 48.45 2 50.78 2 18.66 1 0.56 220-24 39.933 59.60 2 23.24 2 4.62 2Karachi Central 15 & above 32.33 5 66.61 4 27.16 4 11.22 315-19 41.72 2 57.92 2 28.09 2 1.25 120-24 32.31 2 67.27 2 29.73 2 8.47 2Malir 15 & above 71.645 27.62 5 899 8.99 5 416 4.16 315-19 69.58 6 29.42 5 9.79 4 4.33 620-24 74.16 7 25.01 5 7.30 4 3.98 3
Table VIII-CL<strong>in</strong>kage between <strong>Literacy</strong> & FertilityProv<strong>in</strong>ce-wise and District-wise Rates of <strong>Literacy</strong> & Fertility1998NWFP(<strong>Literacy</strong> Rates <strong>in</strong> Percentages)Illiterate Literate Matric & above Degree & aboveProv<strong>in</strong>ce/District Age Group %Woman Av_Child %Woman Av_Child %Woman Av_Child %Woman Av_ChildChitral 15 & above 87.955 12.00 3 4.61 3 0.68 415-19 71.16 1 28.64 2 9.90 2 0.00 020-24 77.36 3 22.64 2 11.62 2 0.96 2Upper Dir 15 & above 98.14 5 5.16 1 0.55 3 0.04 215-1919 95.97972 403 4.03 2 155 1.55 2 000 0.00 020-24 96.85 3 3.14 2 0.75 3 0.02 5Lower Dir 15 & above 94.94 6 4.97 4 1.26 4 0.19 515-19 90.33 2 9.58 2 1.67 2 0.02 220-24 91.31 4 8.46 3 2.56 3 0.29 6Swat 15 & above 92.37 5 7.49 4 2.00 3 0.24 415-19 87.11 2 12.79 2 3.33 2 0.02 220-24 2489.34 3 10.52 3 3.31 3 0.23 3Shangla 15 & above 98.54 5 1.37 4 0.55 5 0.27 115-19 99.50 6 0.50 9 0.12 10 0.00 -20-24 99.76 7 0.24 6 0.00 - 0.00 -Buner 15 & above 96.93935 284 2.84 4 067 0.67 3 003 0.03 215-19 92.90 2 6.90 2 1.29 1 0.00 -20-24 95.74 3 4.20 3 1.30 2 0.06 0
IlliterateLiterate Matric & above Degree & aboveProv<strong>in</strong>ce/District i t Age Group %Woman Av_Child%Woman Av_Child %Woman Av_Child %Woman Av_ChildMalakand P.A. 15 & above 88.76 5 10.14 4 3.46 3 0.49 415-19 81.32 2 17.39 2 4.94 2 0.09 120-24 84.18 3 14.71 3 6.11 2 0.23 2Khi Kohistan 15 & above 99.444 053 0.53 3 014 0.14 3 - -15-19 99.73 1 0.27 2 0.00 - 0.00 -20-24 98.28 2 1.72 2 0.44 2 0.00 -Mansehra 15 & above 86.14 5 13.80 4 3.08 4 0.36 315-19 85.85 6 14.07 6 2.59 5 0.17 320-24 87.23 6 12.47 6 1.21 4 0.15 3Batagram 15 & above 97.86 4 1.99 3 0.80 3 0.10 215-19 19 95.80 1 4.01 3 0.89 2 0.00-20-24 97.91 2 1.85 2 0.90 1 0.00 -Abbottabad 15 & above 80.25 5 19.61 5 3.60 4 0.20 315-19 84.50 6 15.41 5 2.97 5 0.25 420-2424 86.096 13.82 6 168 1.68 6 - -Haripur 15 & above 78.54 5 21.07 3 5.13 3 0.93 315-19 65.96 2 33.82 1 6.09 1 0.05 220-24 68.06 2 31.43 2 8.94 2 0.93 1Mardan 15 & above 88.07 5 11.83 4 3.98 4 0.86 315-19 84.88 3 15.01 2 4.05 2 0.15 120-24 86.41 3 13.51 3 5.02 3 0.81 2Swabi15 & above91.14 5 8.56 4 2.22 3 0.19 215-19 86.71 2 13.09 1 2.87 1 0.24 020-24 87.15 3 12.68 2 4.21 2 0.21 1
IlliterateLiterate Matric & above Degree & aboveProv<strong>in</strong>ce/District i t Age Group %Woman Av_Child%Woman Av_Child %Woman Av_Child %Woman Av_ChildCharsadda 15 & above 93.08 5 6.58 4 2.43 3 0.51 315-19 88.48 2 11.42 2 3.83 2 0.29 420-24 90.86 3 8.73 2 3.49 2 0.33 2Peshawar 15 & above 57.78785 42.27 27 4 17.78 78 4 17.66 315-19 62.78 3 37.10 3 19.45 2 3.63 020-24 58.24 4 41.73 3 18.04 3 17.86 2Nowshehra 15 & above 87.46 5 12.26 4 3.71 3 0.93 315-19 83.89 2 15.69 2 3.47 1 0.10 120-24 84.97 3 14.78 3 5.18 2 1.04 2Kohat 15 & above 86.04 5 13.75 4 4.67 4 0.73 415-19 19 83.77 2 15.83 2 4.49 .9 3 0.50220-24 84.11 3 15.68 2 6.24 2 0.50 2Hangu 15 & above 95.11 5 4.56 4 1.24 3 0.25 415-19 92.89 2 6.44 2 1.82 2 0.0020-2424 94.093 564 5.64 2 185 1.85 2 017 0.17 1Karak 15 & above 92.86 6 6.86 4 2.67 3 0.36 415-19 84.12 2 15.49 2 4.50 2 0.0020-24 88.38 3 11.45 2 5.49 2 0.48 2Bannu 15 & above 94.93 6 4.99 5 1.55 5 0.26 415-19 93.70 3 6.26 3 1.63 3 0.05 420-24 93.67 4 6.26 4 2.15 4 0.19 3Lakki Marwat 15 & above95.84 5 4.10 4 1.31 3 0.17 415-19 94.66 2 5.30 2 1.88 1 0.0020-24 94.22 3 5.78 2 1.48 2 0.18 1
Illiterate Literate Matric & above Degree & aboveProv<strong>in</strong>ce/District i t Age Group %Woman Av_Child%Woman Av_Child %Woman Av_Child %Woman Av_ChildDera Ismail Khan 15 & above 87.28 5 12.37 4 3.96 4 1.15 315-19 87.57 2 12.12 2 4.12 2 0.59 120-24 88.05 3 11.51 2 4.05 2 0.87 2Tank 15 & above 95.745 404 4.04 4 125 1.25 3 020 0.20 315-19 93.00 2 6.79 2 2.21 1 0.0020-24 95.19 3 4.67 2 1.76 3 0.14 3
Table VIII-EFertility Rates of <strong>Islamabad</strong><strong>Islamabad</strong>1998IlliterateLiterate(<strong>Literacy</strong> Rates <strong>in</strong> Percentages)Matric & above Degree & aboveProv<strong>in</strong>ce/District Age Group %Woman Av_Child %Woman Av_Child %Woman Av_Child %Woman Av_Child<strong>Islamabad</strong> 15 & above 44.36 3 54.94 3 18.88 2 11.24 215-19 46.02 1 53.98 1 20.51 1 1.32 120-24 41.24 1 58.26 1 21.09 1 8.61 1
Table VIII-DL<strong>in</strong>kage between <strong>Literacy</strong> & FertilityProv<strong>in</strong>ce-wise and District-wise Rates of <strong>Literacy</strong> & Fertility1998Balochistan(<strong>Literacy</strong> Rates <strong>in</strong> Percentages)IlliterateLiterate Matric & above Degree & aboveProv<strong>in</strong>ce/District Age Group %Woman Av_Child %Woman Av_Child %Woman Av_Child %Woman Av_ChildQuetta 15 & above 66.93 4 33.06 3 12 5 5.126 115-19 66.93 1 34.01 2 11.92 1 1.06 020-24 66.93 2 30.06 2 12.89 1 3.44 0Pish<strong>in</strong> 15 & above 93.37 5 6.34 4 1.26 5 0.15 415-19 90.51 1 9.29 1 1.93 2 0.02 020-24 92.49 3 7.51 2 1.10 2 0.12 5Qilla Abdullah 15 & above 96.97 5 2.92 5 0.43 5 0.07 315-19 97.00 2 2.87 2 0.69 2 0.00 020-2424 96.93933 293 2.93 3 033 0.33 2 009 0.09 0Chagai 15 & above 92.93 5 6.61 5 1.18 6 0.13 415-19 89.18 2 10.70 4 1.10 1 0.00 020-24 91.80 3 7.78 5 1.38 5 - -Loralai 15 & above 93.36 5 6.61 4 1.62 4 - -15-19 91.20 1 8.80 1 3.66 2 0.06 020-24 91.72 2 8.24 3 2.51 3 0.49 2Musakhel 15 & above 93.77 4 5.85 3 2.77 3 0.67 2
IlliterateLiterate Matric & above Degree & aboveProv<strong>in</strong>ce/District Age Group %Woman Av_Child%Woman Av_Child %Woman Av_Child %Woman Av_ChildBarkhan 15 & above 96.41 4 2.67 3 0.81 3 - -15-19 96.35 1 3.65 1 1.28 1 0.06 120-24 95.17 2 3.97 2 0.98 2 0.24 0Killa Saifullah 15 & above 93.12 4 6.88 3 1.53 4 0.04 015-19 92.23 2 7.77 0 0.83 0 0.00 -20-24 90.27 2 9.73 2 2.45 3 0.21 0Zhob 15 & above 97.53 5 2.45 5 0.81 4 - -15-19 97.85 1 2.09 1 0.46 2 0.00 -20-24 97.32 2 2.65 3 0.99 2 0.28 3Sibi 15 & above 92.74 4 7.02 4 1.65 3 - -15-19 90.512 9.38 3 2.19 3 0.00 -20-24 91.88 3 7.75 3 1.95 2 - -Ziarat 15 & above 89.38 5 10.35 4 1.38 2 - -15-19 78.49 2 21.51 2 2.45 1 0.00 -20-2424 85.452 14.55 2 234 2.34 2 - -Kohlu 15 & above 98.33 3 1.49 3 0.37 4 0.07 315-19 98.62 1 1.34 1 0.13 3 0.0020-24 96.72 2 2.75 3 0.80 3 0.03 2Dera Bugti 15 & above 98.34 3 1.62 4 0.13 2 0.07 315-19 98.70 2 1.30 2 0.02 2 0.16 320-24 98.44 2 1.41 2 0.36 1 0.15 2Jafarabad 15 & above 95.82 4 4.03 3 1.22 3 - -
IlliterateLiterate Matric & above Degree & aboveProv<strong>in</strong>ce/District Age Group %Woman Av_Child%Woman Av_Child %Woman Av_Child %Woman Av_ChildNasirabad 15 & above 98.67 3 1.31 3 0.36 3 - -15-19 98.03 1 1.97 2 0.57 2 0.00 -20-24 97.77 2 2.19 2 0.76 2 - -Jhal Magsi 15 & above 97.87 4 1.63 4 0.45 3 - -15-19 97.46 1 2.11 1 0.42 0 0.85 020-24 97.39 3 1.45 1 0.58 2 0.58 1Bolan 15 & above 96.66 5 3.14 4 0.53 5 0.07 315-19 94.18 2 4.60 1 0.39 1 0.0020-24 96.98 2 2.77 2 0.76 4 0.06 2Kalat 15 & above 96.83 4 3.06 4 0.53 3 0.19 315-19 95.741 4.24 1 0.85 1 0.26 120-24 96.37 2 3.57 3 0.75 2 0.23 0Mastung 15 & above 94.16 5 5.34 4 1.10 3 0.39 415-19 91.65 3 7.74 2 1.64 1 0.0020-2424 91.90904 765 7.65 3 225 2.25 2 020 0.20 5Khuzdar 15 & above 94.08 4 5.80 4 1.12 4 - -15-19 91.80 1 8.18 1 1.62 2 0.22 220-24 93.57 2 6.19 3 1.52 2 0.22 1Awaran 15 & above 98.57 4 1.30 2 0.24 2 0.18 215-19 96.24 2 3.76 0 0.54 0 0.54 120-24 97.35 2 2.00 1 0.98 2 0.00Kharan 15 & above 93.10 5 5.60 4 1.88 5 1.23 4
IlliterateLiterate Matric & above Degree & aboveProv<strong>in</strong>ce/District Age Group %Woman Av_Child%Woman Av_Child %Woman Av_Child %Woman Av_ChildLasbela 15 & above 94.31 4 5.53 4 1.06 4 0.23 -15-19 91.56 2 8.14 1 1.37 2 0.00 -20-24 91.76 2 7.91 3 1.55 4 0.05 1Kech 15 & above 91.07 5 8.63 4 2.17 4 0.34 415-19 80.56 2 19.21 1 4.17 1 0.42 120-24 8.72 4 1.23 3 0.39 2 0.03 2Gwadar 15 & above 92.77 5 6.79 4 1.32 4 0.68 415-19 87.00 1 12.85 1 2.14 2 1.29 120-24 90.10 3 9.42 3 2.07 5 0.66 2Panjgur 15 & above 85.21 4 14.33 5 3.78 4 0.64 415-19 80.782 18.85 2 5.37 2 0.12 020-24 82.48 3 17.26 4 6.00 4 0.77 2
Table IX-ADistrict-wise Participation Rates of School go<strong>in</strong>g Children (5-9 Years)PUNJAB1998(Participation i Rates <strong>in</strong> Percentages)Prov<strong>in</strong>ce/District/ Population School Go<strong>in</strong>g Participation RateAge Group (5-9) Upto Primary Level 1998%Attock 175822 91029 51.77Rawalp<strong>in</strong>di 446658 332982 74.55Jhelum 129878 95379 73.44Chakwal 146372 88710 60.61Sargodha 398241 211872 53.2Bhakkar 171569 63572 37.05Khushab 132203 61550 46.56Mianwali 165724 81905 49.42Faisalabad 785067 456548 58.15Jhang 435090 199798 45.92Toba Tek S<strong>in</strong>gh 240332 139539 58.06
Prov<strong>in</strong>ce/District/ Population School Go<strong>in</strong>g Participation RateAge Group (5-9) Upto Primary Level 1998%Gujranwala 505867 292733 57.87Hfi Hafizabad bd 121681 67016 55.08Gujrat 290755 217418 74.78Mandi Bahaudd<strong>in</strong>170797 105098 61.53Sialkot 394937 292715 74.12Narowal 195331 110472 56.56Lahore 852697 546198 64.06Kasur 376300 156472 41.58Okara 342641 149834 43.733Sheikhupura 502341 249129 49.59Vehari330026 129491 39.24Sahiwal 274500 118291 43.09Pakpattan 200703 70225 34.99Multan 498255 215483 43.25Khanewal 326027 131187 40.24
Prov<strong>in</strong>ce/District/ Population School Go<strong>in</strong>g Participation RateAge Group (5-9) Upto Primary Level 1998%Lodhran 199103 62903 31.59Dera Ghazi Khan 297694 70523 23.69Rajanpur 200718 50190 25.01Layyah186680 70319 37.67Muzaffargarh 472666 129959 27.49Bahawalpur 401406 139172 34.67Bahawalnagar 319195 123385 38.66Rahim Yar Khan 539221 173083 32.1
Table IX-BDistrict-wise Participation Rates of School go<strong>in</strong>g Children (5-9 Years)S<strong>in</strong>dh1998(Participation Rates <strong>in</strong> Percentages)Prov<strong>in</strong>ce/District/ Population School Go<strong>in</strong>g Participation RateAge Group (5-9) Upto Primary Level 1998%Jacobabad 253851 5531521.79Shikarpur 152483 27753 18.2Larkana335866 9566928.48Khairpur 266382 89299 33.52Sukkur 144862 5239736.17Ghotki 170176 41587 24.44Nawabshah 177431 5306329.91Naushahro Feroze 184084 70633 38.37Dadu 2749128857632.22Hyderabad 438506 157471 35.91Bad<strong>in</strong> 193106 35427 18.35
Prov<strong>in</strong>ce/District/ Population School Go<strong>in</strong>g Participation RateAge Group (5-9) Upto Primary Level 1998%Thatta187145 3048916.29Sanghar242843 73582 30.3Mirpurkhas148380 4259628.71Tharparkar 166329 21589 12.98Umerkot114391 2666523.31Karachi East 342780 212576 62.02Karachi West298909 16013953.57Karachi South 209556 135178 64.51Karachi Central274155 188934 68.92Malir 144447 5112535.39
Table IX-CDistrict-wise Participation Rates of School go<strong>in</strong>g Children (5-9 Years)N.W.F.P1998(Participation Rates <strong>in</strong> Percentages)Prov<strong>in</strong>ce/District/ Population School Go<strong>in</strong>g Participation RateAge Group (5-9) Upto Primary Level 1998%Chitral 54711 2282141.71Upper Dir 107687 15695 14.57Lower DirSwatShanglaBunerMalakand P.A.KohistanMansehra135330 21178 15.65221583 42767 19.3077656 8843 11.3990131 14749 16.3679174 16582 20.9486790 3899 4.49190576 67554 35.45Batagram 54734 6670 12.19
Prov<strong>in</strong>ce/District/ Population School Go<strong>in</strong>g Participation RateAge Group (5-9) Upto Primary Level 1998%Abbottabad 132384 64682 48.86Haripur101670 42777 42.07Mardan 247479 70885 28.64Swabi169383 43912 25.92Charsadda 175101 32565 18.60PeshawarNowshehraKohat331410 138532 41.80139399 42608 30.5792003 30178 32.80Hangu56089 1114819.88Karak76413 20659 27.04Bannu120758 2520320.87Lakki Marwat 89486 22275 24.89Dera Ismail Khan148066 3090020.87Tank42728 7191 16.83
Table IX-EParticipation Rates of School go<strong>in</strong>g Children (5-9 Years)<strong>Islamabad</strong>1998Prov<strong>in</strong>ce/District/Age Group<strong>Islamabad</strong>5-9 Years(Paricipation Rates <strong>in</strong> Percentages)Population (5-9 Years) School Go<strong>in</strong>g upto primary level Participation Rate105553 63880 60.52
Table IX-DDistrict-wise i i Participation i i Rates of School go<strong>in</strong>g Children (5-9 Years)Balochistan1998(<strong>Literacy</strong> Rates <strong>in</strong> Percentages)Population PopulationSchool Go<strong>in</strong>g Participation Rate(5-9) (5-9)Upto Primary Level 1998%Quetta 112442 64864 57.68Pish<strong>in</strong>68489 2195732.06Qilla Abdullah 67543 10730 15.89Chagai 360031005327.92Loralai 49591 10080 20.33Musakhel 27174279610.29Barkhan 18276 2994 16.38Killa Saifullah 36388789921.71Zhob 53472 7673 14.35Sibi 29089514917.7Ziarat 5666 2405 42.45
Population PopulationSchool Go<strong>in</strong>g Participation Rate(5-9)Upto Primary Level 1998%Kohlu 16771785 4.68Dera Bugti 33234 2411 7.25Jafarabad 7457013191 17.69Nasirabad 43163 3211 7.44Jhal Magsi 200767513.74Bolan 50073 9863 19.7Klt Kalat 42672545012.77Mastung 27545 6181 22.44Khuzdar 739781394918.86Awaran 20698 2915 14.08Kharan 37089513513.85Lasbela 49635 10629 21.41Kech 711592754038.7Gwadar 30282 10338 34.14Panjgur 459991823439.64
Table X-CDistrict-wise Participation Rates of School go<strong>in</strong>g Children (5-9 Years)by Sex, Urban and Rural1998IN.W.F.P. I(Participation Rates <strong>in</strong> Percentages)Prov<strong>in</strong>celDistrictl All Areas Urban RuralAge Group Both Sexes Male Female Both Sexes Male Female Both Sexes Male FemaleN.W.F.P. 24.65 30.05 18.73 40.83 44.40 36.98 22.62 28.34 16.34Chitral 41.71 46.31 36.85 55.88 60.14 51.34 40.38 45 35.55-9Upper Dir14.57 19.66 9.14 35.96 36.67 35.19 13.77 19.02 8.165-9Lower Dir 15.65 19.54 11.46 19.63 22.55 16.52 15.4 19.36 11.155-9Swat 19.3 22.95 15.32 37.82 42.58 32.66 16.53 20.03 12.725-9Shangla11.39 17.23 4.97 - - -11.39 17.23 4.975-9Buner 16.36 22.17 9.96 - - -16.36 22.17 9.965-9Malakand P.A. 20.94 23.14 18.55 17.11 18.23 15.87 21.34 23.66 18.835-9
Prov<strong>in</strong>celDistrictl All Areas Urban RuralAge Group Both Sexes Male Female Both Sexes Male Female Both Sexes Male FemaleKohistan 4.49 6.81 1.47 - - - 4.49 6.81 1.475-9Mansehra 35.45 39.56 30.97 64.28 67.15 61.28 34.06 38.27 29.485-9Batagram12.19 16.73 7.25 - - - 12.19 16.73 7.255-9Abbottabad 48.86 51.98 45.5 56.48 57.53 55.3 47.52 50.97 43.835-9Haripur42.07 44.23 39.79 60.04 61.76 58.18 40.02 42.21 37.725-9Mardan 28.64 34.72 21.97 36.47 40.28 32.38 26.85 33.47 19.555-9Swabi 25.92 31.75 19.65 31.22 37.76 24.15 24.85 30.53 18.745-9Charsadda 18.6 23.4 13.26 38.31 46.06 29.87 14.48 18.72 9.755-9Peshawar 41.8 46.57 36.62 61.94 63.74 60.01 25.43 32.74 17.435-9Nowshehra 30.57 37.11 23.5 33.6 36.31 30.72 29.64 37.36 21.275-9
Prov<strong>in</strong>ce/District/ All Areas Urban RuralAge Group Both Sexes Male Female Both Sexes Male Female Both Sexes Male FemaleKohat 32.8 39.86 25.21 52.01 55.4 48.28 27.26 35.3 18.675-9Hangu19.88 29.14 9.73 22.91 29.49 15.62 19.2 29.06 8.425-9Karak 27.04 32.14 21.53 35.28 40.18 30.46 26.48 31.63 20.95-9Bannu 20.87 29.63 11.11 47.29 50.63 43.55 19.35 28.42 9.255-9Lakki Marwat 24.89 36.65 11.88 27.39 31.01 23.58 24.64 37.2 10.685-9Dera Ismail Khan 20.87 26.02 15.19 53.95 56.69 51.09 16.39 21.99 10.185-9Tank 16.83 23.99 8.63 29.1 33.9 23.51 14.78 22.32 6.185-9
District-wiseTable X-BParticipation Rates of School go<strong>in</strong>g Children (5-9 Years)by Sex, Urban and Rural1998I S<strong>in</strong>dhI(Participation Rates <strong>in</strong> Percentages)Prov<strong>in</strong>ce/District/ All Areas Urban RuralAge Group Both Sexes Male Female Both Sexes Male Female Both Sexes Male FemaleS<strong>in</strong>d 33.97 37.49 29.97 48.32 51.33 45.02 22.85 27.12 17.94Jacobabad 21.79 25.98 16.67 40.4 44.76 35.41 16.16 20.52 10.745-9Shikarpur18.2 20.9 15.03 35.92 38.58 33.06 13.2 16.19 9.595-9Larkana 28.48 32.45 24.02 49.53 52.63 46.11 20.53 24.92 15.565-9Khairpur33.52 38.27 28.05 47.44 48.67 46.06 29.49 35.3 22.765-9Sukkur 36.17 40.98 30.81 47.1 51.26 42.63 26.57 32.25 20.025-9Ghotki 24.44 28.8 19.47 48.32 52.59 43.67 20.17 24.65 15.025-9Nawabshah 29.91 34.42 24.77 53.98 57.34 50.34 22.22 27.32 16.325-9
Prov<strong>in</strong>ce/District/ All Areas Urban RuralAge Group Both Sexes Male Female Both Sexes Male Female Both Sexes Male FemaleNaushahro Feroze 38.37 45.38 30.29 53.12 59.01 46.52 35.33 42.62 26.895-9Dadu 32.22 36.74 27 52.27 57.26 46.69 27.08 31.57 21.845-9Hyderabad 35.91 40.46 30.92 48.96 53.25 44.37 24.91 29.91 19.315-9Bad<strong>in</strong> 18.35 20.96 15.41 39.13 41.11 36.96 14.56 17.35 11.425-9Thatta 16.29 19.73 12.29 38.39 40.13 36.42 13.78 17.46 9.55-9Sanghar30.3 35.06 24.97 49.54 52.96 45.8 25.14 30.34 19.285-9Mirpurkhas28.71 31.89 25.2 46.34 47.37 45.25 21.17 25.44 16.45-9Tharparkar5-912.98 15.41 9.84 43.24 46.74 39.54 11.87 14.37 8.63Umerkot 23.31 27.65 18.42 40.24 46.75 32.84 20.27 24.2 15.845-9Karachi East 62.02 61.54 62.52 62.02 61.54 62.525-9
Prov<strong>in</strong>celDistrictl All Areas Urban RuralAge Group Both Sexes Male Female Both Sexes Male Female Both Sexes Male FemaleKarachi West 53.57 56.27 50.72 54.14 56.59 51.55 48.49 53.41 43.235-9Karachi South 64.51 66.27 62.66 64.51 66.27 62.66 - - -5-9Karachi Central 68.92 70.11 67.66 68.92 70.11 67.665-9Malir 35.39 37.98 32.6 31.25 32.92 29.45 43.2 47.51 38.545-9
Table X-DDistrict-wise Participation Rates of School go<strong>in</strong>g Children (5-9 Years)by Sex, Urban and Rural1998I BalochistanI(Participation Rates <strong>in</strong> Percentages)Prov<strong>in</strong>celDistrictl All Areas Urban RuralAge Group Both Sexes Male Female Both Sexes Male Female Both Sexes Male FemaleBalochistan 24.29 28.48 19.29 46.57 51.25 41.26 18.20 22.43 13.08Quetta 57068 61.87 53.09 62.29 67.61 57.78 45.19 48.31 41.685-9Pish<strong>in</strong> 32.06 41.35 19.98 31.56 37.61 24.41 32.09 41.57 19.75-9Qilla Abdullah 15.89 22.46 6.92 20.89 25.87 14.39 15.03 21.89 5.65-9Chagai27.92 31.57 23.84 44.76 52.15 36.55 24.45 27.35 21.215-9Loralai 20.33 25.64 13.85 55.97 58.83 52.57 16.36 21.99 9.475-9Musakhel 10.29 11.76 8.41 45.54 52.72 33.94 7.05 7.57 6.45-9Barkhan 16.38 21.41 10.78 36.59 44.54 27.65 14.73 19.5 9.415-9
Prov<strong>in</strong>celDistrictl All Areas Urban RuralAge Group Both Sexes Male Female Both Sexes Male Female Both Sexes Male FemaleKilla Saifullah 21.71 25.04 17.17 43.35 44.59 41.71 18.52 22.21 13.475-9Zhob 14.35 18.59 9.15 48.32 54.81 39.52 9.14 12.74 4.785-9Sibi 17.7 20.59 14.4 30.05 32.96 26.77 11.98 14.92 8.585-9Ziarat 42.45 48.8 34.61 17.19 20 13.79 42.73 49.13 34.855-9Kohlu 4.68 5.92 3.12 40.12 48.55 29.4 1.24 1.76 0.595-9Dera Bugti7.25 9.97 3.83 17.84 22.28 12.64 6.33 8.93 3.025-9Jafarabad 17.69 22.01 12.67 26.58 30.79 21.68 15.64 19.99 10.595-9Nasirabad 7.44 10.19 4.13 18.45 21.59 14.67 5.44 8.12 2.215-9Jhal Magsi3.74 5.38 1.76 16.47 31.54 0 2.74 3.44 1.95-9Bolan 19.7 24.14 14.43 36.81 42 31.31 17.3 21.79 11.95-9
Prov<strong>in</strong>celDistrictl All Areas Urban RuralAge Group Both Sexes Male Female Both Sexes Male Female Both Sexes Male FemaleKalat 12.77 16.74 8.38 47.76 56.46 38.67 7.38 10.81 3.555-9Mastung22.44 28.08 16.22 49.72 53.98 44.99 17.98 23.83 11.525-9Khuzdar 18.86 21.41 16 30.95 34.3 27.21 14.23 16.48 11.735-9Awaran 14.08 15.92 11.93 - - - 14.08 15.92 11.935-9Kharan 13.85 17.72 9.39 34.08 44.89 22.32 10.79 13.74 7.375-9Lasbela 21.41 26.92 15.37 41.2 48.05 33.59 10.34 14.98 5.275-9Kech 38.7 42.08 34.6 66.29 67.94 64.31 33.4 37.14 28.855-9Gwadar 34.14 38.84 28.65 47.78 52.85 42.07 19.53 24.37 13.645-9Panjgur39.64 43.45 34.63 52.83 55.1 50.31 38.48 42.5 33.095-9
Table X-ADistrict-wise Participation Rates of School go<strong>in</strong>g Children (5-9 Years)by Sex, Urban and Rural1998I PunjabI(Participation Rates <strong>in</strong> Percentages)Prov<strong>in</strong>ce/Districtl All Areas Urban RuralAge Group Both Sexes Male Female Both Sexes Male Female Both Sexes Male FemalePUD.jab48.20 52.28 43.83 62.95 64.95 60.81 44.28 48.93 39.29Attock 51.77 57.78 45.43 64.6 67.31 61.7 48.51 55.34 41.325-9Rawalp<strong>in</strong>di74.55 76.74 72.24 82.17 84.11 80.1 66.59 68.92 64.185-9Jhelum 73.44 75.85 70.86 76.99 78.96 74.9 72.25 74.82 69.515-9Chakwal 60.61 62.9 58.2 73.09 74.84 71.24 58.97 61.33 56.495-9Sargodha53.2 57.11 48.99 62.99 65.35 60.45 49.58 54.06 44.735-9Bhakkar 37.05 43.07 30.48 57.69 60.42 54.75 33.26 39.9 25.995-9Khushab 46.56 53.72 38.94 60.97 65.43 56.23 41.76 49.82 33.165-9
Prov<strong>in</strong>ce/District/ All Areas Urban RuralAge Group Both Sexes Male Female Both Sexes Male Female Both Sexes Male FemaleMianwali 49.42 55.99 42.39 65.18 68.76 61.43 45.7 53.02 37.845-9Faisalabad 58.15 59.79 56.4 65.79 66.57 64.97 52.9 55.18 50.435-9Jhang5-9Toba Tek S<strong>in</strong>gh5-9Gujranwala5-945.92 54.21 36.88 57.92 60.54 55.1 42.45 52.39 31.5558.06 60.49 55.45 65.7 67.4 63.92 56.33 58.94 53.5157.87 59.1 56.55 61.42 62.76 60.01 54.5 55.67 53.24HafIzabad 55.08 58.51 51.35 65.99 68.43 63.39 50.97 54.82 46.765-9Gujrat74.78 75.76 73.73 76.57 75.56 77.65 74.16 75.83 72.375-9Mandi 61.53 64.34 58.48 72.43 73.94 70.82 59.67 62.71 56.355-9Sialkot 74.09 74.94 73.23 76.93 77.5 76.35 73.22 74.16 72.285-9Narowal 56.56 59.58 53.35 64.64 66.6 62.5 55.48 58.63 52.155-9
Prov<strong>in</strong>ce/District/ All Areas Urban RuralAge Group Both Sexes Male Female Both Sexes Male Female Both Sexes Male FemaleLahore 64.01 65.55 62.46 67.36 68.53 66.19 51.07 54.17 47.985-9Kasur 41.58 44.57 38.37 58.8 59.69 57.85 36.84 40.42 335-9Okara 43.56 48.7 38.41 56.83 57.48 56.18 39.87 46.28 33.465-9Sheikhupura 49.59 51.92 47.1 60.03 61.17 58.82 46.01 48.75 43.065-9Vehari 39.24 43.51 34.63 55.36 58.12 52.38 36.3 40.85 31.395-9Sahiwal 43.09 47.64 38.2 59.33 61.01 57.56 40.22 45.3 34.735-9Pakpattan34.99 42.14 27.28 52.36 56.05 48.37 32.31 39.99 24.035-9Multan 43.25 49.34 36.69 51.59 55.09 47.84 38.25 45.91 29.965-9Khanewal 40.24 45.5 34.57 57.32 59.68 54.82 36.82 42.68 30.495-9Lodhran 31.59 36.7 26.05 48.78 52.23 45.1 28.78 34.18 22.95-9
Prov<strong>in</strong>celDistrictl All Areas Urban RuralAge Group Both Sexes Male Female Both Sexes Male Female Both Sexes Male FemaleDera Ghazi 23.69 28.61 . 18.26 74.18 74.8 73.53 16.86 22.49 10.635-9Rajanpur25.01 30.72 18.57 55.66 59.24 51.86 20.24 26.43 13.25-9Layyah37.67 43.03 31.84 58.82 60.73 56.77 34.92 40.75 28.575-9Muzaffargarh27.49 33.27 21.21 57.61 58.9 56.21 23.51 29.89 16.565-9Bahawalpur34.67 38.26 30.77 56.7 58.75 54.51 27.31 31.48 22.755-9Bahawalnagar38.66 42.46 34.57 55.07 57.43 52.56 34.9 39.05 30.445-9Rahim Yar 31.89 35.64 28.15 63.29 65.05 61.53 25 29.32 20.685-9
Table X-EParticipation Rates of Schoolgo<strong>in</strong>gChildrenby Sex,Urban and Rural <strong>Islamabad</strong>I <strong>Islamabad</strong>I1998(participation Rates <strong>in</strong> Percentages)Prov<strong>in</strong>celDistrictl All Areas Urban RuralAge Group Both Sexes Male Female Both Sexes Male Female Both Sexes Male Female<strong>Islamabad</strong> 60.52 61.26 59.73 62.75 62.68 62.83 56.8 58.88 54.5909-May
BIBLIOGRAPHYAdam Curle. Plann<strong>in</strong>g for Education <strong>in</strong> <strong>Pakistan</strong>: A Personal Case Study, Replica Books, 1999.Bhola H.S. <strong>Literacy</strong> Lessons: <strong>Literacy</strong> for Survival and for More Than Mere Survival. (<strong>Literacy</strong> Lessons, International <strong>Literacy</strong> Year),International Bureau of Education. Geneva, 1989.Bouge, Donald J. Pr<strong>in</strong>ciples of Demography, New York: John Wiley and Sons, Inc, 1961.Calfee, Robert, and Nelson-Barber, Sharon, Cross-cultural perspectives on classroom discourse and literacy, NY: Teachers College Press,1991.Geraldo, Nasimento. Illiteracy <strong>in</strong> Figures: <strong>UNESCO</strong>, Paris, France. 1992Ghafoor, Abdul. Quest for <strong>Literacy</strong>, National Education and Tra<strong>in</strong><strong>in</strong>g Commission , M<strong>in</strong>istry of Education , Govt. of <strong>Pakistan</strong> , <strong>Islamabad</strong>,August 1994.Ghafoor, Abdul and Khan, Arshad Saeed, <strong>Literacy</strong> Efforts <strong>in</strong> <strong>Pakistan</strong>, National Education and Tra<strong>in</strong><strong>in</strong>g Commission, <strong>Islamabad</strong>-<strong>Pakistan</strong> 1994.Goodman, K., and Y. Goodman. Learn<strong>in</strong>g to Read Is Natural, Paper presented at Conference on Theory and Practice of Beg<strong>in</strong>n<strong>in</strong>g Read<strong>in</strong>gInstruction, Pittsburgh, April 13, 1976.Lev<strong>in</strong>e, Kenneth. <strong>Literacy</strong> Lesson: The Future of <strong>Literacy</strong> and Literacies of the Future: (<strong>Literacy</strong> Lessons)Myers, Robert. World Education Forum: Education For All 2000 Assessment. Thematic Studies. Early Childhood Care and Development,<strong>UNESCO</strong> Paris 2000.Richard L. Venezky, Carl F. Kaestle, and Andrew Sum, The Subtle Danger: Reflections on the <strong>Literacy</strong> Abilities of America's Young Adults,Educational Test<strong>in</strong>g Service, 1987.Spache, G.D. Read<strong>in</strong>g <strong>in</strong> the Elementry School, Bosten, MA: Allyn & Bacon, 1964.Skilbeck, M.. Education for All. <strong>Trends</strong> and Issues from an OECD Perspective, Western Europe and North America. Regional Report for theEFA 2000 Assessment, 2000.
<strong>UNESCO</strong>. 50 Years of Education. United Nations Educational, Scientific and Cultural Organization,. Paris:1997.<strong>UNESCO</strong>. World Education Forum, F<strong>in</strong>al Report, Paris: 2000Venezky, R. L., Wagner, D. A., & Ciliberti, B. S. (Eds.), Toward def<strong>in</strong><strong>in</strong>g literacy. Newark, DE: International Read<strong>in</strong>g Association, 1991.Wagner, Daniel A. ; <strong>Literacy</strong> Lesson: <strong>Literacy</strong> and Research: past, present and future. (<strong>Literacy</strong> Lessons, International <strong>Literacy</strong> Year)International Bureau of Education. Geneva, 1990.Wagner, Daniel A. World Education Forum: Education For All 2000 Assessment .The Thematic Studies. <strong>Literacy</strong> and Adult Education.<strong>UNESCO</strong>, Paris: 2000.Whitman, Cheryl V<strong>in</strong>ce. et al. World Education Forum: Education For All 2000 Assessment. Thematic Studies. School Heath and Nutrition,<strong>UNESCO</strong>, Paris: 2000.
Formulae used for Calculat<strong>in</strong>g the Growth Rate and ProjectionsGrowth Rates of <strong>Literacy</strong> <strong>in</strong> <strong>Pakistan</strong>Annexure - 1S.No. Year of census Litracy Rate Growth Rate1 1951 16.42 1961 16.3 -0.061143573 1972 21.7 2.6354678464 1981 26.2 2.1159322195 1998 43.92 3.085530026Formula Used= ( t √P t /P 0 - 1 ) x 100= The average annual growth rateP t = The census count for later censusP 0 = The census count for earlier yeart = The <strong>in</strong>terval <strong>in</strong> yearsExcepted <strong>Literacy</strong> Rate for 2001Excepted <strong>Literacy</strong> Rate for 200348.112226651.12706621Formula Used P t = P 0 x ( 1 + /100) t= The average annual growth rateP t = The census count for later censusP 0 = The census count for earlier yeart = The <strong>in</strong>terval <strong>in</strong> yearsSource:Bogue, Donald J. Pr<strong>in</strong>cipes of Demography, New York: Jhon Wiley and Sons, Inc. 1