Homework Assignment 4 - McCombs School of Business
Homework Assignment 4 - McCombs School of Business
Homework Assignment 4 - McCombs School of Business

Create successful ePaper yourself
Turn your PDF publications into a flip-book with our unique Google optimized e-Paper software.
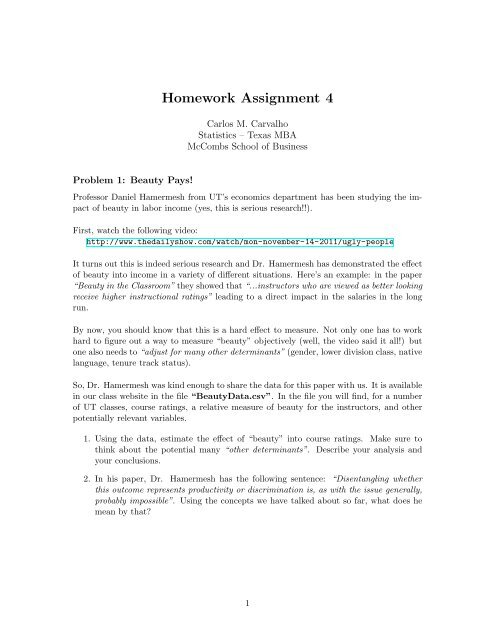
Problem 3: What causes what??Listen to this podcast:http://www.npr.org/blogs/money/2013/04/23/178635250/episode-453-what-causes-what1. Why can’t I just get data from a few different cities and run the regression <strong>of</strong> “Crime”on “Police” to understand how more cops in the streets affect crime? (“Crime” refersto some measure <strong>of</strong> crime rate and “Police” measures the number <strong>of</strong> cops in a city)2. How were the researchers from UPENN able to isolate this effect? Briefly describetheir approach and discuss their result in the “Table 2” below.3. Why did they have to control for METRO ridership? What was that trying to capture?4. In the next page, I am showing you “Table 4” from the research paper. Just focuson the first column <strong>of</strong> the table. Can you describe the model being estimated here?What is the conclusion?effect <strong>of</strong> police on crime 271TABLE 2Total Daily Crime Decreases on High-Alert Days(1) (2)High Alert7.316*(2.877)6.046*(2.537)Log(midday ridership) 17.341**(5.309)R 2 .14 .17Note.—The dependent variable is the daily total number <strong>of</strong> crimes(aggregated over type <strong>of</strong> crime and district where the crime wasFigurecommitted) 1: The in dependent Washington, variable D.C., during is the theperiod daily March total 12, number 2002– <strong>of</strong> crimes in D.C. This tablepresent July the 30, estimated 2003. Both regressions coefficients contain anday-<strong>of</strong>-the-week their standard fixederrors effects. in parenthesis. The first columnrefersThe to anumber model<strong>of</strong> where observations the only is 506. variable Robust used standard in errors the High are inAlert dummy whereas the modelparentheses.in column * Significantly (2) controls different formfrom the zero METRO at the 5ridership. percent level. * refers to a significant coeficient at the5% level, ** ** Significantly at the 1% different level. from zero at the 1 percent level.local <strong>of</strong>ficials. In addition to increasing its physical presence, the policedepartment increases its virtual street presence by activating a closed-circuitcamera system that covers sensitive areas <strong>of</strong> the National Mall. The camerasystem is not permanent; it is activated only during heightened terror alertperiods or during major events such as presidential inaugurations. 10IV.ResultsThe results from our most basic regression are presented in Table 2, wherewe regress daily D.C. crime totals against the terror alert level (1 p high,0 p elevated) and a day-<strong>of</strong>-the-week indicator. The coefficient on the alertlevel is statistically significant at the 5 percent level and indicates that onhigh-alert days, total crimes decrease by an average 3 <strong>of</strong> seven crimes per day,or approximately 6.6 percent. We use dummy variables (not shown) for eachday <strong>of</strong> the week to control for day effects (crime is highest on Fridays).
274 the journal <strong>of</strong> law and economicsTABLE 4Reduction in Crime on High-Alert Days: Concentration on the National MallCoefficient(Robust)High Alert # District 12.621**(.044)High Alert # Other Districts .571(.455)Log(midday ridership) 2.477*(.364)Constant11.058**(4.211)Coefficient(HAC)2.621*(1.19).571(.366)2.477**(.522)11.058(5.87)Coefficient(Clustered by AlertStatus and Week)2.621*(1.225).571(.364)2.477**(.527)11.058 (5.923)Note.—The dependent variable is daily crime totals by district. Standard errors (in parentheses) areclustered by district. All regressions contain day-<strong>of</strong>-the-week fixed effects and district fixed effects. The2number <strong>of</strong> observations is 3,542. R p .28. HAC p heteroskedastic autocorrelation consistent.Significantly different from zero at the 10 percent level.* Significantly different from zero at the 5 percent level.** Significantly different from zero at the 1 percent level.Figure 2: The dependent variable is the daily total number <strong>of</strong> crimes in D.C. District 1refers to a dummy variable associated with crime incidents in the first police district area.This table present the estimated coefficients and their standard errors in parenthesis.* refersto a significant coeficient at the 5% level, ** at the 1% level.an <strong>of</strong>ficial news release from February 27, 2003. 17 Un<strong>of</strong>ficially, we were toldthat during heightened alert periods, the police department switches fromthree 8-hour shifts a day to two 12-hour shifts, thus increasing the effectivepolice presence by 50 percent. 18 Despite several requests, however, the D.C.police would neither confirm nor deny this exact procedure. Nevertheless, ifwe take 50 percent as an approximate figure, then we estimate an elasticity<strong>of</strong> crime with respect to police presence <strong>of</strong> 15 percent/50 percent p .3.As it turns out, this is exactly the figure estimated by Thomas Marvell andCarlisle Moody and is also consistent with a range <strong>of</strong> elasticities on differentcrimes from approximately .2 to .9 analyzed by Levitt, Corman and Mocan,and Di Tella and Schargrodsky. 19Crime may come in waves; we control for some <strong>of</strong> this using day-<strong>of</strong>-theweekeffects, but there may be other sources <strong>of</strong> dependence that result inserial correlation and thus downwardly biased standard errors. 20 To addressthis problem, the second column <strong>of</strong> Table 4 reruns the regression using hetero-17See Metropolitan Police Department, supra note 10.18With three shifts <strong>of</strong> x police, there are 3x police on the street per day; with two shifts,there are 2y, assuming that 2y p 3x (the same number 4<strong>of</strong>police are allocated over the day);then y p 3/2x, an increase <strong>of</strong> 50 percent.19Marvell & Moody, supra note 4; Levitt, Reply, supra note 4; Corman & Mocan, supranote 4; Di Tella & Schargrodsky, supra note 7.20