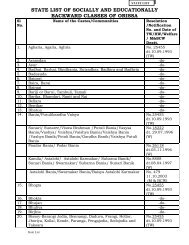
Annual Report <strong>2012</strong>-<strong>13</strong>64. Nagarchi65. Namasudra66. Paidi67. Pa<strong>in</strong>da68. Pamidi69. Pan, Pano, Buna Pana, Desua Pana70. Panchama71. Panika72. Panka73. Pantanti74. Pap75. Pasi76. Patial, Patikar, Patratanti, Patua77. Rajna78. Relli79. Sabakhia80. Samasi81. Sanei82. Sapari83. Sauntia, Santia84. Sidhria85. S<strong>in</strong>dhuria86. Siyal, Khajuria87. Tamadia88. Tamudia89. Tanla90. Deleted2.3 S.E.B.C PROFILENo disaggregated data is available for theSocially and Educationally Backward Classes(SEBC) of Orissa. In fact, Census has notenumerated this section of population as aseparate category for which disaggregated datais not available. But it can be said for sure thatthere is a sizable chunk of SEBC population <strong>in</strong>the State of Orissa. There are 209 communitieswho have been enlisted as SEBC <strong>in</strong> State list ofOrissa so far, whereas 200 communities havebeen specified <strong>in</strong> the list of Other BackwardClasses (OBC) prepared by Government of Indiafor Orissa.2.4 MINORITY POPULATIONAs per 2001 census, m<strong>in</strong>orities account for 5.64%of Orissa’s population which <strong>in</strong>clude Christians(2.44 %), Muslims (2.07 %), Sikhs (0.05 %), Ja<strong>in</strong>s(0.02 %), Buddhists (0.03 %) and others (0.05%).The literacy rate among the m<strong>in</strong>oritycommunities <strong>in</strong> Orissa is as follows:M<strong>in</strong>ority Community Literacy RateMuslims 71.30 %Sikhs 90.50 %Budhists 70.98 %Christians 54.91 %Ja<strong>in</strong>s 93.25 %Others 42.36 %91. Turi92. Ujia93. Valamiki, Valmiki94. Mangali (<strong>in</strong> Koraput & Kalahandidistricts)95. Mirgan (<strong>in</strong> Navrangpur district)11
Annual Report <strong>2012</strong>-<strong>13</strong>III. THE SCHEDULED AREA AND TRIBAL SUB-PLAN (TSP)3.1 IntroductionAbout 44.70% of the area of the state has beennotified as the Scheduled Area <strong>in</strong> accordancewith the orders of the President of India, issuedunder paragraph 6 of the Fifth Schedule to theConstitution. The Scheduled Area <strong>in</strong> Orissacomprises the entire districts of Mayurbhanj,Koraput, Malkangiri, Rayagada, Nawarangapur,Sundargarh, and Kandhamals district,R.Udayagiri Tahasil, Gumma & RayagadaBlocks, of Gajapati Soroda Tahasil, exclud<strong>in</strong>gGazalbadi and Gochha Panchayats of Ganjamdistrict, Kuch<strong>in</strong>da Tahasil of Sambalpur district,Telkoi, Keonjhar, Champua and Barbil Tahasilsof Keonjhar district, Th. Rampur and Lanjigarhblocks of Kalahandi district and Nilagiri block ofBalasore district.3.2 Tribal Sub-Plan ApproachThe Tribal Sub-Plan strategy has been adopteds<strong>in</strong>ce the beg<strong>in</strong>n<strong>in</strong>g of the Fifth Five Year Plan(1974-75), which cont<strong>in</strong>ues to shape the corestrategy for tribal development. This strategy isbased on area development approach withadequate emphasis on family oriented <strong>in</strong>comegenerat<strong>in</strong>g activities tak<strong>in</strong>g a comprehensive viewof tribal problems with the objective to narrowdown the gap of socio-economic developmentbetween Tribals and others, with<strong>in</strong> theframework of Nation’s Five Year Plans. TheTribal Sub-Plan (TSP) approach envisages<strong>in</strong>tegrated development of the Tribal areas,where<strong>in</strong> all programmes irrespective of theirsources of fund<strong>in</strong>g operate <strong>in</strong> unison to achievethe common goal of br<strong>in</strong>g<strong>in</strong>g the area at par withthe rest of the State and to improve the qualityof life of the Tribals. The orig<strong>in</strong>al strategy wasoriented towards tak<strong>in</strong>g-up family oriented<strong>in</strong>come generat<strong>in</strong>g schemes <strong>in</strong> the sphere ofagriculture, horticulture, animal husbandry,elim<strong>in</strong>ation of exploitation, human resourcesdevelopment through education and tra<strong>in</strong><strong>in</strong>gprogrammes and <strong>in</strong>frastructure developmentprogrammes. This tribal development strategyhas been reoriented to cover the employmentcum-<strong>in</strong>comegeneration activities thereto. Thestrategies more or less cont<strong>in</strong>ue with ref<strong>in</strong>ementover the years with greater emphasis on tribaldevelopment.3.3 Special Projects for Tribal DevelopmentThe ma<strong>in</strong> <strong>in</strong>strument for achiev<strong>in</strong>g theconstitutional objectives of welfare anddevelopment of Scheduled Tribes is the TribalSub-Plan, which is carried out through wellplanned out <strong>in</strong>stitutional mechanism. Besides,there are 21 ITDAs, which cover 55.46 lakhtribals (about 68% of the total tribal population)of the state. The rema<strong>in</strong><strong>in</strong>g tribals live outsidethe Scheduled areas. Beyond the Scheduled area,there are 46 MADA pockets, 14 Clusters. Therema<strong>in</strong><strong>in</strong>g tribal population of the State liveoutside the major project areas <strong>in</strong> dispersedmanner and are covered under the DTDP. Inaddition to this, 17 Micro Projects have beenfunction<strong>in</strong>g for the all round development of <strong>13</strong>Particularly Vulnarable Tribal Groups. Of thetotal 17 Micro Projects, <strong>13</strong> Micro Projects arelocated with<strong>in</strong> the Scheduled Area and therema<strong>in</strong><strong>in</strong>g 4 are located outside the ScheduledArea.3.4 Objective and StrategyThe objectives of the TSP strategy are basicallytwo fold, i.e. (i) socio- economic developmentof the Scheduled Tribes and their habitats, and(ii) protection of tribals from exploitation. Itis envisaged to enhance the level ofdevelopment of the Scheduled Tribes byadopt<strong>in</strong>g a multi-pronged strategy so as to12