Combined full field stress and strain ... - Geo-Engineering
Combined full field stress and strain ... - Geo-Engineering
Combined full field stress and strain ... - Geo-Engineering

You also want an ePaper? Increase the reach of your titles
YUMPU automatically turns print PDFs into web optimized ePapers that Google loves.
<strong>Combined</strong> <strong>full</strong> <strong>field</strong> <strong>stress</strong> <strong>and</strong> <strong>strain</strong> measurement methodsfor granular materialsJ. Dijkstra 1,a <strong>and</strong> W. Broere 1Delft University of Technology, <strong>Geo</strong>-<strong>Engineering</strong> Section, P.O. Box 5048, 2600 GA Delft, The Netherl<strong>and</strong>sAbstract. The current paper re-introduces the photoelastic measurement method in experimentalgeomechanics. A <strong>full</strong>-<strong>field</strong> phase stepping polariscope suitable for geomechanicalmodel tests has been developed. Additional con<strong>strain</strong>ts on the measurement <strong>and</strong> mechanicalsetup arising from geomechanical test conditions are outlined as well as the opportunityto measure the displacement <strong>field</strong>s in the sample with digital image correlation.The capability of the current setup in retrieving the <strong>stress</strong> <strong>and</strong> <strong>strain</strong> <strong>field</strong> in a granularmaterial is demonstrated.1 IntroductionPerforming <strong>full</strong> <strong>field</strong> <strong>stress</strong> measurements in natural soils is very difficult. For a decent spatial resolutionthe size <strong>and</strong> amount of the required sensors embedded in the soil simply would negativelyinfluence the characterisation of the <strong>stress</strong> state. The physical size of the sensors prohibits a realisticfailure mechanism. Full <strong>field</strong> soil <strong>stress</strong> measurements, therefore, can only practically be obtained witha photoelastic measurement method.Photoelasticity is a well established measurement method in experimental mechanics for obtainingthe <strong>stress</strong> <strong>field</strong> in photoelastic materials (i.e. a transparent material with a noncrystalline molecularstructure). The method, introduced in engineering in the beginning of last century, e.g. [1], was pioneeredin geomechanics by [2] [3], [4] . Over the years the originally qualitative methods graduallybecame more quantitative by the introduction of more advanced measurement equipment <strong>and</strong> postprocessing which is summarized in [5].Interestingly, these newer methods stayed in the realm of experimental mechanics <strong>and</strong> did not entergeomechanics. Some ideas were addressed in the work of [6] <strong>and</strong> [7] <strong>and</strong> more recently in physicsby [8] <strong>and</strong> [9]. However, <strong>stress</strong> measurements in granular media using photoelasticity are still verylimited.The current paper aims to re-introduce a more advanced quantitative phase stepping measurementmethod into geomechanics <strong>and</strong> combines it a with the digital image correlation method to measurethe displacements <strong>field</strong>s (using the natural contrast of the granular material), e.g. [10]. Together thesemethods could potentially offer the combined <strong>stress</strong>-<strong>strain</strong> response of the granular material.2 Photoelastic MeasurementsThe <strong>stress</strong> measurements consists of three steps: (1) acquiring the photoelastic parameters in the sampleby measuring the retardation <strong>and</strong> the isoclinic angle of the polarized light, (2) unwrapping the phaseof this experimental data, (3) deriving the individual <strong>stress</strong> components in the <strong>stress</strong> seperation routine.ae-mail:j.dijkstra@tudelft.nl
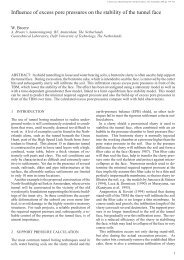
EPJ Web of ConferencesBefore presenting the details of these steps in more detail, first the limitations of the geotechnical setupwill be discussed.2.1 Limitations imposed by geomechanicsCompared to homogeneous materials generally used in experimental mechanics, the granular materialas studied in geomechanics poses additional challenges. The particulate nature results in a nonhomogeneoussample with voids between the grains. These grains are not bonded <strong>and</strong> therefore willrequire a plane <strong>strain</strong> strongbox to contain the sample. The front <strong>and</strong> back wall of this strongboxshould be transparent <strong>and</strong> have minimal influence on the photelastic effect. The <strong>stress</strong>-optic law isequally applicable in plane-<strong>strain</strong> conditions as shown in [11].In the current study the granular material, or soil, is replaced by grains of a photoelastic material. Astrongbox is filled with crushed glass particles. The voids are filled with a liquid, Exxon-Mobil Marcol82, which is matching the refractive index of the glass, in order to prevent light scatter in the sample.The other properties of this matching liquid, such as viscosity <strong>and</strong> density, are as close as possible towater. In [11] the similarity in mechanical behaviour between broken glass <strong>and</strong> s<strong>and</strong> is shown usingtriaxial test results. The crushed glass grains, however, are more angular than s<strong>and</strong> <strong>and</strong> as a result theaggregate properties are slightly different (as are strength <strong>and</strong> stiffness of the individual grains, whichcould render the material more prone to crushing). On the whole, they are a reasonable substitutematerial to investigate s<strong>and</strong> behaviour.A remaining fundamental consideration is that multiple grains are stacked over the thickness ofthe sample. For the current setup, where the light passes multiple grains, this implies that the observedlight intensity is the sum of the light intensity changes (due to the mechanical shear <strong>stress</strong>) in everysingle grain along the path of the light ray. The <strong>stress</strong> <strong>field</strong>, therefore, is a 2D <strong>stress</strong> representation inthe plane perpendicular to the light ray of an averaged intensity reading over the depth of the sample.This 2D cross-section does not present the <strong>full</strong> <strong>stress</strong> tensor. Out of plane <strong>stress</strong> components are notdetected, i.e. the <strong>stress</strong> state is measured in a plane perpendicular to the light ray as the method isinsensitive for polarization changes along the light ray.The photoelastic effect is measured using a transmission polariscope. This apparatus projects lightwith a pre-defined polarization state on the sample. The <strong>stress</strong>ed sample will alter the polarizationof the incident light <strong>and</strong> this alteration of the light polarization is subsequently measured. For sevenorientations of the wave plates <strong>and</strong> the polarizer in the polariscope a light intensity measurement isrequired in order to collect sufficient data for the subsequent analysis.The size of the physical models as used in geomechanics tends to be quite large in order to preservea reasonable grain size to structure size ratio. This size typically is larger than the size of availableretardation <strong>and</strong> or polarization plates. Therefore, most of the methods listed by [5] are not suitablewithout modifications. The most straightforward modification, moving the sample or the polariscopewith respect to each other, are not feasible options due to mechanical limitations <strong>and</strong> would in any casesignificantly increase the required number of polarisation state acquisitions. The new setup describedhere does not need to move sample <strong>and</strong> polariscope with respect to each other <strong>and</strong> only needs sevenacquisitions for the <strong>full</strong> <strong>field</strong>. This reduces the acquisition time considerably <strong>and</strong> improves the spatialresolution.2.2 Acquiring the photoelastic parametersThe polariscope used in this research consists of two linear polarizers <strong>and</strong> two retardation plates (alsocalled λ 4plate) <strong>and</strong> is shown in Fig. 1. The proposed optical arrangement <strong>and</strong> configuration of [12]is used for the measurement of the photoelastic parameters in the sample, i.e. the retardationδ<strong>and</strong>isoclinic angleφin Fig. 1. This method allows to compensate for poor wave plate performance.The <strong>full</strong> polarization state of the emerging light is measured from seven polariscope configurations.In these configurations the polarization of the incident light <strong>and</strong> positions of the second λ 4plate <strong>and</strong> theanalyzer are varied. The current method incorporates the retardation∆of the non-ideal retarders before
14th International Conference on Experimental Mechanicslight sourcepolarizerretardersampleretarderpolarizercameraP π 2R β (∆)R φ (δ)R γ (∆)P θFig. 1. Arrangement of optical elements in a polariscope.Table 1. Seven configurations for the photoelastic measurement.intensity β (rad) γ (rad) θ (rad)I 1π0 04I 2 − π 0 04πI 3 − π − π 4 4 4I 4 − π − π − π 4 4 4I 5 − π − π π4 4 2I 6 − π 4I 7π4π4π4π2π2<strong>and</strong> after the sample in the analysis. The fast axis of the first polarizer is set at an angle π 2 (counterclockwise) with respect to the horizontal plane of the sample, the fast axis of the first λ 4plate has anangleβ, the second λ 4plate an angleγ<strong>and</strong> the analyzer an angleθ. The seven configurations are shownin Table 1.Using Jones calculus the emerging light intensities I 1 to I 7 are calculated by multiplying the Jonesvector of the emerging light a e with its conjugate ā e :I= ā e a e (1)The emerging light intensity I is a scalar <strong>and</strong> generally I≤ 1. The Jones vector for the emerging lighta e can be obtained by multiplying the Jones Matrices of each optical element (Fig. 1) with the Jonesvector of the incident light a i which is vertically polarized,a e = P θ R γ (∆)R φ (δ)R β (∆)a i (2)where, the Jones Matrix for a retarder with angleζ=β,γorφ<strong>and</strong> retardationη=∆orδis given byR ζ (η)=( )e iη cos 2 (ζ)+sin 2 (ζ) (e iη − 1) sin(ζ) cos(ζ)(e iη − 1) sin(ζ) cos(ζ) e iη sin 2 (ζ)+cos 2 (ζ)The Jones Matrix for the linear polarizer before the camera which makes an angleθwith thereference axis is given by:( )cosP θ =2 (θ) sin(θ) cos(θ)sin(θ) cos(θ) sin 2 (θ)The Jones vector of the linearly polarized incident light is given by:(0a i =1)
EPJ Web of ConferencesFollowing the work of [12] these equations yield the isoclinic angleφ<strong>and</strong> retardationδin the samplefrom seven measured light intensities (3) – (5):tanδ=tan 2φ= I 1−I 2I 3 − I 4(3)cos∆= I 5−I 72(I 1 − I 2 )2(I 3 − I 4 ) sin∆(−I 5 + 2I 6 − I 7 ) cos 2φIn these equations∆is the retardation of the retarders. The sign of sin∆ is always taken positive as theretardation needs to be positive. At positions where∆cannot be obtained for example when I 1 = I 2 ,a representative average value for the domain is taken. Due to the trigonometric functions in (3) – (5)the phase data is still wrapped in the domains− π 4
14th International Conference on Experimental Mechanics2.4 Stress-separationThe <strong>stress</strong> difference (σ 1 −σ 2 ) is derived directly from the measured photoelastic parameters usingthe <strong>stress</strong>-optic law:σ 1 −σ 2 = δ C 0(10)whereas at the same time the shear <strong>stress</strong> relates to retardationδ<strong>and</strong> the isoclinic angleφ:0.5δ sin(2φ)σ xy = (11)C 0Therefore, the individual <strong>stress</strong> components need to be derived using a <strong>full</strong> <strong>field</strong> <strong>stress</strong>-separationmethod. In the current research the method proposed by [15] is used. In this procedure the equilibriumequations for plane <strong>strain</strong> are solved with the incorporated measured <strong>field</strong> data. An additional materialconstant is derived from (12)C 0;n = 2π(1−n)dC(12)λwhere n is the porosity, d the thickness of the sample <strong>and</strong> C the <strong>stress</strong>-optic constant. Thickness d=21 mm in the current setup <strong>and</strong> C is taken as 2.7·10 −12 Pa −1 [16]. The wavelengthλof the HeNe laserused as a light source is 632.8 nm. By directly incorporating this material parameter in the analysis,an absolute <strong>stress</strong> reading is obtained given that no multiple phasewraps in the retardation data haveoccurred.3 Digital Image CorrelationFor the extraction of the displacement data from the recorded images the minimum quadratic differencemethod [17] is used. The method proves to be more robust in case of illumination <strong>and</strong> noise differencesin the subsequent images. Also the method proves to be more reliable with densely packed particles(soil). In the current research a Gaussian sub-pixel fit is used.C s,t = 1MNM∑i=1N∑j=1| f (1)i, j− f (2)i+s, j+t |2 (13)where the subscript denotes the column i <strong>and</strong> row j on a rectangular grid with M columns <strong>and</strong> N rows,<strong>and</strong> f (1) denotes an intensity reading in the first image <strong>and</strong> f (2) is an intensity reading in the secondimage. The location of the minimum value for C s,t yields the most probable displacement.The <strong>strain</strong>s are derived from the displacement <strong>field</strong>s after correction for rigid body rotations <strong>and</strong>translations by polar decomposition of the deformation gradient tensor (obtained from the displacements).This yields the stretch tensor U <strong>and</strong> subsequently the engineering <strong>strain</strong>s from the biot <strong>strain</strong>tensor E:E biot = U−I (14)where I is the identity tensor. The Biot <strong>strain</strong> tensor is composed of the engineering <strong>strain</strong>s. For thetwo dimensional case E biot is a 2x2 matrix. The horizontal <strong>strain</strong>ε xx , the vertical <strong>strain</strong>ε yy , the shear<strong>strain</strong>ε xy <strong>and</strong> volumetric <strong>strain</strong>ε v are given byε xx = E 11 (15)ε yy = E 22 (16)ε xy = E 12 + E 21 (17)ε v = E 11 + E 22 (18)
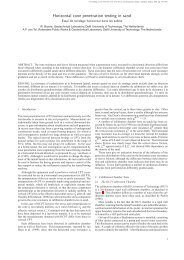
EPJ Web of ConferencesTRANSPARENTWINDOWSSOURCEDICq 1Pileq 2PEPLANESTRAINSAMPLEFig. 2. Schematized plan view of PE model test setup; laser source, plane <strong>strain</strong> sample, <strong>and</strong> photoelastic acquisition.4 Example: pile in granular mediumThe newly developed polariscope was mainly developed to study the <strong>stress</strong> <strong>and</strong> <strong>strain</strong> behaviour inplane <strong>strain</strong> physical models in which the non-cohesive soil (like s<strong>and</strong>) is substituted by broken glass.An example setup studies pile installation. A square model pile with a surface area of 16 x 20 mm 2 ispushed into a plane <strong>strain</strong> strongbox with inner dimensions 400 x 400 x 21 mm 3 . The box is filled withbroken glass. After each 1 mm increment a photoelastic measurement is made <strong>and</strong> an additional photois taken for the digital image correlation. Meanwhile the forces on the pile head <strong>and</strong> of the surchargeload on the surface level are monitored.4.1 SetupThe setup, as sketched in plan view in Fig. 2, can be divided in three parts. The source of the polarizedlight, <strong>and</strong> the camera for the digital image correlation (DIC) are located at one side of the sample.The light source is offset from the center line of the sample to reduce reflections <strong>and</strong> glare effects thatinterfere with the measurements. The sample is contained in a glass <strong>and</strong> steel strongbox <strong>and</strong> loadedwith two surcharges q 1 <strong>and</strong> q 2 . The pile is centered in the strongbox. On the other side of the samplethe remaining components of the photoelastic (PE) setup are situated. As seen in the sketch only abouthalf of the sample is within the <strong>field</strong> of vision of the cameras. The pile is completely in the view,but only half of the soil surrounding the pile. This improves the spatial resolution of the DIC <strong>and</strong> PEanalysis, as less surface area is covered with the fixed resolution of the camera.The two retardation plates <strong>and</strong> the analyser are mounted in a computer controlled rotational stage.A st<strong>and</strong>ard prosumer DSLR camera was used for the image acquisition for the DIC <strong>and</strong> the PE measurements.These camera were also remotely controlled. All polarisation optics were sourced fromNewport <strong>and</strong> 2” in diameter.4.2 ResultsThe resulting <strong>stress</strong> <strong>and</strong> <strong>strain</strong> <strong>field</strong>s after 40 mm of pile installation are shown in Figs. 3(a) <strong>and</strong> 3(b)for the <strong>stress</strong> stateσ xx <strong>and</strong>σ yy . These plots show the <strong>full</strong> pile width, but only one side of the soilsurrounding the pile. The scale is normalized on this <strong>full</strong> pile width. The total height <strong>and</strong> width isseven times the pile width. For a similar region the horizontal <strong>and</strong> vertical <strong>strain</strong>s are plottedε xx <strong>and</strong>ε yy are shown in 3(c) <strong>and</strong> 3(d)
14th International Conference on Experimental Mechanics[kPa]0[kPa]01−200−4001−200−4002−6002−600y/W (−)34−800−1000−1200y/W (−)34−800−1000−12005−14005−14006−1600−18006−1600−18001 2 3 4 5 6x/W (−)−20001 2 3 4 5 6x/W (−)−2000(a)σ xx(b)σ yy110.810.220.62030.43−0.2y/Wy/W40.24−0.4505−0.66−0.26−0.81 2 3 4 5 6x/W−0.41 2 3 4 5 6x/W−1(c)ε xx(d)ε yyFig. 3. Horizontal <strong>and</strong> vertical <strong>stress</strong>esσ xx &σ yy <strong>and</strong> <strong>strain</strong>sε xx &ε yy after 40 mm of pile displacement, negativesign is compressive,contractive.Clearly, reasonable values for the <strong>stress</strong> are only found in the high <strong>stress</strong> zones near the pile wherethe retardation angle is sufficiently high. In the lower half of theσ xx -plot positive values are found.With exception of some outliers the results for the vertical <strong>stress</strong>σ yy are all compressive.The <strong>strain</strong>s show contraction below the pile base <strong>and</strong> dilation (loosening due to shear) in the sidelobes. The size of the disturbed <strong>stress</strong> region is in reasonable agreement with that of the <strong>strain</strong>.
EPJ Web of Conferences5 ConclusionsThe current paper re-introduces the photoelastic measurement method in experimental geomechanics.A <strong>full</strong>-<strong>field</strong> phase stepping polariscope suitable for geomechanics has been developed. Additionally,the setup facilitates a second camera for digital image correlation. Together the setup potentially offersnew insight in the <strong>strain</strong> <strong>and</strong> <strong>stress</strong> paths in (geomechanical) physical model tests.As example a pile installation problem is shown for which both the <strong>strain</strong> <strong>and</strong> the <strong>stress</strong> <strong>field</strong>s for40 mm of pile installation are presented.References1. M.M. Frocht, Photoelasticity Volume 1 (John Wiley & Sons, New York, 1946)2. P. Dantu, Proceedings of the Fourth International Conference on Soil Mechanics <strong>and</strong> Foundation<strong>Engineering</strong>, (1957), 144–1483. A. Drescher, Géotechnique, 264, (1976), 591–601.4. T., Wakabayashi, Proceedings of the seventh Japanese National Conference on Applied Mechanics,(1957), 153–1585. A. Ajovalasit, S. Barone, G. Petrucci, Journal of Strain Analysis, 332, (1998), 75–916. H.G.B. Allersma, Experimental Mechanics, 229, (1982), 336–3417. M.R. Dyer, Observation of the <strong>stress</strong> distribution in crushed glass with applications to soil reinforcement,(PhD thesis, University of Oxford, 1985)8. M. Da Silva, J. Rajchenback, Nature, 4066797, (2000), 708–7109. D.W. Howell, R.P. Behringer, C.T. Veje, Chaos, 93, (1999), 559 – 57210. D. J. White, W.A. Take, M.D. Bolton, Proc. of the 10th Int. Conf. on Comp. Meth. <strong>and</strong> Advancesin <strong>Geo</strong>m. Tucson, Arizona, (2001), 997–100211. J. Dijkstra, On the Modelling of Pile Installation, (PhD thesis, Delft University of Technology,2009)12. S. Yoneyama, H. Kikuta, Experimental Mechanics, 463, (2006), 89–29613. J.W., Dally, W.F. Riley, Experimental Stress Analysis Third Edition (McGraw-Hill, Singapore,1991)14. D.C. Ghiglia, M.D. Pritt, Two-Dimensional Phase Unwrapping, (John Wiley & Sons, Inc., NewYork, 1998)15. J.A. Quiroga, A. González-Cano, Measurement Science <strong>and</strong> Technology, 98, (1998), 1204–121016. T.R. Nissle, C.I. Babcock, C.I. Journal of the American Ceramic Society, 5611, (1973), 596–59817. L.C. Gui <strong>and</strong> W. Merzkirch. Experiments in Fluids, 216, (1996), 465–468