National Carbon Project - Kerala Forest Research Institute
National Carbon Project - Kerala Forest Research Institute
National Carbon Project - Kerala Forest Research Institute

You also want an ePaper? Increase the reach of your titles
YUMPU automatically turns print PDFs into web optimized ePapers that Google loves.
KFRI <strong>Research</strong> Report No 400<strong>National</strong> <strong>Carbon</strong> <strong>Project</strong>: SpatialAssessment of Vegetation and Soil<strong>Carbon</strong> Pool of Northern <strong>Kerala</strong>A.R.R.MenonThomas P Thomas<strong>Kerala</strong> <strong>Forest</strong> <strong>Research</strong> <strong>Institute</strong>Peechi – 680 653, Thrissur<strong>Kerala</strong>July2011
KFRI <strong>Research</strong> Report No. 400 ISSN 0970-8103<strong>National</strong> <strong>Carbon</strong> <strong>Project</strong>: Spatial Assessment of Vegetationand Soil <strong>Carbon</strong> Pool of Northern <strong>Kerala</strong>(Final Report of the project: KFRI 563/2009)A. R. R. MenonThomas P.Thomas<strong>Kerala</strong> <strong>Forest</strong> <strong>Research</strong> <strong>Institute</strong>Peechi – 680 653, Thrissur<strong>Kerala</strong>July 2011
Abstract of project proposalCode: KFRI 563/09Title:<strong>National</strong> <strong>Carbon</strong> <strong>Project</strong>: Spatial Assessment of Vegetationand Soil <strong>Carbon</strong> Pool of Northern <strong>Kerala</strong>Objectives:1. To generate baseline data for the assessment of theterrestrial vegetation carbon using satellite remote sensing,ground sampling and modeling techniques.2. To devise appropriate estimation methodology and dataintegration procedure for spatial assessment of soil carbonpools.3. To explore new and alternative RS based techniques anddata sets for their utility in large scale vegetation carbon poolassessment.4. To generate geospatial data of the terrestrial phytomassand carbon of India.Date of commencement: April 2009Date of completion: June 2011Funding agency:Investigators:<strong>Research</strong> Fellow:ISRODr.A.R.R.MenonDr.Thomas P.ThomasSri.Deepu Divakaran (June. 2009 - Sept.2010)
AcknowledgementsWe are thankful to Dr.K.V.Sankaran, Director, <strong>Kerala</strong> <strong>Forest</strong> <strong>Research</strong> <strong>Institute</strong> for theencouragement throughout the period of the study. The unstinted co-operation fromDr.V.K.Dadhwal, <strong>Project</strong> Director (NCP IGBP) and Dr.Sarnam Singh, Dy. <strong>Project</strong>Director (NCP IGBP), Indian <strong>Institute</strong> of Remote Sensing, Dehra Dun is gratefullyacknowledged. We appreciate the financial assistance and co-operation extended byISRO. We are also grateful to <strong>Kerala</strong> <strong>Forest</strong> Department for permitting us to establishstudy plots in the forests of <strong>Kerala</strong> and for the extensive support of the KFD field staff.We appreciate the help rendered by Sri. Deepu Divakaran, <strong>Research</strong> Fellow, for the fielddata collection. Thanks are due to Dr.K.V.Bhat, Dr.Thomas P Thomas and Dr.S.Sandeep,Scientists, KFRI, for their valuable comments and suggestions in improving themanuscript.
AbstractIn the long term, a sustainable forest management strategy aimed at maintaining orincreasing forest carbon stocks, while producing an annual sustained yield of timber,fiber or energy from the forest, will generate the largest sustained mitigation benefit.Therefore, it is very much essential to understand and quantify the terrestrial carbonbalance of India and its associated uncertainties. Pilot studies have been done in India toestimate forest /vegetation carbon and these estimates are spread over a decade and arebased on different approaches viz: historical records, ecological data and populationbased forest biomass, scales and classification schemes and objectives. In the 11 th FiveYear Plan it is planned to provide extra thrust to understanding the terrestrial <strong>Carbon</strong>Cycle through a “<strong>National</strong> <strong>Carbon</strong> <strong>Project</strong>”. The project has three major components andaims to understand Vegetation <strong>Carbon</strong> pools, Soil <strong>Carbon</strong> pools and Soil-Vegetation<strong>Carbon</strong> fluxes.The major objectives of the Vegetation <strong>Carbon</strong> Pool assessment project are:1. Assessment of terrestrial vegetation biomass in the country using groundsampling and satellite remote sensing data, and2. Generation of geospatial data of the terrestrial phytomass carbon of India alongwith estimates of uncertainty.Among these, fulfillment of the first objective in the Northern <strong>Kerala</strong> region is the majorthrust area of the current project.Under this subproject, determination of soil organic carbon in surface and sub-surfacesoils of forests of Northern <strong>Kerala</strong> is covered in the present study. A cluster basedsampling using remote sensing data for stratification was suggested at national level byISRO and the same methodology was adopted in the current work.Information on trees outside <strong>Forest</strong>s (TOF) was generated in three phases: land useclassification and mapping; identification of tree-cover classes; and measurement of treecharacteristics. Satellite images and aerial photos were suitable for the first two. Highresolutionsatellite images are likely to allow the identification of single trees (or crowns)and can be a data source for a large-area TOF inventory.
ContentsIntroduction 1Background / <strong>National</strong> <strong>Carbon</strong> <strong>Project</strong> 4Methodology 5Spatial stratification and sampling procedure 11Sampling approach 12Estimation of plot biomass and carbon 15Soil sampling and analysis 16Discussion 17TOF status 18TOF vegetation status of selected plots 18-106Status of forest vegetation 107-167References 168-169Plates 170-174
Introduction<strong>Carbon</strong> dioxide is among the major green house gases (GHG) contributing to global warmingand associated impacts. Under the Kyoto protocol of United Nations Framework Convention onClimate Change (UNFCCC), most of the countries have agreed to reduce the GHG emissions andalso report these emissions regularly. This reporting is necessary and is done as a <strong>National</strong>Communication to UNFCCC. In India, the assessment of carbon pools in vegetation, forests andother lands, soils and net balance due to various land cover/ use changes is a subject of much debateand uncertainty. This understanding balance of temporal changes in net carbon balance as well as itsspatial pattern requires creation of consistent and reliable national scale digital data sets. While databases for recent periods can be developed using Remote Sensing coupled with ancillary data,historical and future data sets are also required can be created only through data integration approachand modeling respectively.Regional level carbon cycles are valuable for assessing, what is known as element cycleprocesses in a particular ecosystem of a region and for addressing region specific environmentalpolicy questions. India constitutes an important part of terrestrial biosphere and agriculture is themajor economic activity in these regions. Reducing deforestation is the dominant mitigation optionfor tropical regions. The carbon mitigation potentials from reducing deforestation, forestmanagement, afforestation, and agro- forestry differ greatly in their activity, regions, systemboundaries and the time horizon over which these options are compared. In short term, the carbonmitigation benefits of reducing deforestation are greater than the benefits of afforestation. In the longterm, a sustainable forest management strategy aimed at maintaining or increasing forest carbonstocks, while producing an annual sustained yield of timber, fiber or energy from the forest, willgenerate the largest sustained mitigation benefit. Therefore, it is very much essential to understandand quantify the terrestrial carbon balance of India and its associated uncertainties. It is alsoimportant to estimate anthropogenic influence and the effect of future climate changes on carbonbalance with its temporal and spatial aspects.The global forest cover is 3952 million ha, which is about 30% of the world’s land area (FAO,2005). <strong>Forest</strong>s sequester atmospheric carbon and use solar energy to produce organic matter bymeans of photosynthesis. Deforestation is a critical environmental problem in all developingcountries leading to biodiversity loss. The above ground biomass of tropical moist forests is oftenmore than 175 tons of carbon per ha; when cleared and burnt; much of this carbon ends up in theatmosphere as carbon dioxide. As per the FAO (2001) records, the annual rate of deforestation in thedeveloping countries between 1980 and 1990 ranged from 13.7 million to 15.5 million ha. Theincreasing anthropogenic pressure on the forests has resulted in clearing of forests and that has led to
decreased photosynthetic activity, ultimately resulting in low biomass production. In addition to thedecreasing forest area globally, forests are severely affected by disturbances such as forest fires, pestsand climatic events including draught, wind, snow and floods. All these factors have also carbonbalance implications. Such disturbance affects roughly 100 million ha of forests annually (FAO,2006).The Intergovernmental Panel on Climate Change (IPCC) estimates that the level of carbondioxide in the atmosphere today is 31% higher than what it was about 250 years back, at the time ofthe start of industrial revolution. During next century carbon dioxide levels are expected to rise 90 to250% over pre-industrial revolution level. Burning of fossil fuels is the most important source ofgreen house gases. As the global economy has grown, there has been a dramatic increase in theconsumption of fossil fuels. Depending upon use, the lithosphere, ocean, soil, atmosphere andbiosphere, can act as sink or sources of carbon. Whether India is a net sink or source of carbon ispoorly understood. Systematic studies are required to assess the pools and fluxes of carbon to arrivethe country level carbon budget.Remote sensing with its capacity to provide repeated information of a large area facilitates inassessment of forest vegetation cover type and density precisely. NOAA AVHRR, SPOT Vegetationand ASTER satellite data are commonly used for biomass and productivity assessments. Thenormalized difference vegetation index (NDVI) is a good indicator of leaf area index (LAI), which inturn is positively correlated with biomass and productivity. Converting digital numbers from satellitedata to actual biomass or carbon values requires systematic studies on the rate of carbon exchangeover a variety of cover types under different agro-ecological / climatic conditions.FAO (2006) after receiving data for terrestrial carbon has concluded that:• There are large gaps in available data on biomass in terms of inclusion of above and belowground components, spatial and temporal consistency, in both spatial and temporaldimensions (FAO, 2001).• In situ inventory agencies and remote sensing agencies must work together to allow validationand upscalling of the in situ measurement based on remote sensing products (IGCOS,2004).• To increase the quantity of below ground biomass observations, new soil carbon estimationtechniques must be developed that combine in situ and modeling strategies.• Though still under development, satellite based methods are very important for quantifyingabove-ground biomass and its changes at high spatial resolution.In the light of above conclusions, FAO (2006) has recommended following:1. In situ measurement of biomass should be conducted every five years, and remotesensing measures should be conducted on annual basis.2
2. Improve the quality and quantity of in situ monitoring of above and below groundbiomass estimates in order to validate remote sensing.3. Expand forest biomass inventories to tropical forests, non-commercial forests, andwoodlands.4. Develop new soil measurement techniques and sampling strategies.5. For below-ground biomass, increase the density of in situ observations, i) byimproving or adding observations within existing network; ii) by significantlyexpanding the soil profile data base available through SOTER and similarprogrammes; and iii) through more efficient use of national inventories, incombination with land cover derived from satellite data. Development of biomasssurveys to obtain full coverage of forest ecosystems, in tropics, is necessary.6. Full advantage should be taken of existing and planned satellites SAR missionsincluding historical data (JERS-1, ERS-1/2 interferometry), current sensors (multitemporalENVISAT-ASAR, ALOS-PALSAR) and support future missions (ALOSfollow up, ESA-BIOMASS).7. For remote sensing estimation of biomass, use a single classification system, such asLand Cover Classification System.Pilot studies have been done in India to estimate forest /vegetation carbon and these estimatesare spread over a decade and are based on different approaches viz: historical records, ecological dataand population based forest biomass, scales and classification schemes and objectives. According toRavindranath et al. (1977), the standing biomass in India (both above and below ground) wasestimated to be 8,375 million tons for the year 1986, of which carbon storage was reported to be 4178million tons. The total carbon stored in forests of India including soil was estimated to be 9578million tons. The spatial analysis of phytomass carbon in Indian forests for the period 1988-94 wascarried out at district level by Dadhwal et al. (2002). This data was computed by combining remotesensing based forest area inventories on 1:250,000 scale field inventories of growing stock volume byFSI and crown density based biomass expansion factor. Based on earlier studies (Hingane, 1991;Richards and Flint, 1994; Dadhwal and Shah, 1997; Ravindranath et al., 1997; Chhabra et al. 2002;Chhabra, 2002) it is clear that different approaches have produced different estimates of biomass.Thus there is a need to harmonize the whole methodology considering sampling design in differentzones (sample and plot size), methodology for calculation of volume, biomass and carbon usingsimilar approach and models in the country within a specific time frame. In the 11 th Five Year Plan itis planned to provide extra thrust in understanding the terrestrial <strong>Carbon</strong> Cycle through a “<strong>National</strong>3
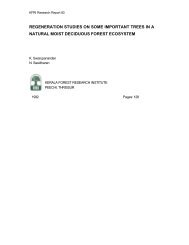
<strong>Carbon</strong> <strong>Project</strong>”. The project has three major components and aims to understand Vegetation <strong>Carbon</strong>pools, Soil <strong>Carbon</strong> pools and Soil-Vegetation <strong>Carbon</strong> fluxes.<strong>National</strong> <strong>Carbon</strong> <strong>Project</strong>:Under the <strong>National</strong> <strong>Carbon</strong> <strong>Project</strong>, the country was divided into 9 geographical zones anddifferent zones were allotted to collaborating institutions for detailed data collection in a commonframe work.Fig.1. Nine geographical zones for detailed studyThe major goals of this project are:1. Assessment of carbon pools, fluxes and net carbon balance for terrestrial biomass in India.2. Establishment of an observational network and create remote sensing based spatial databasefor modeling and periodic assessment of net carbon balance in India.3. Providing support to Second <strong>National</strong> Communication (SNC) activity of Ministry ofEnvironment and <strong>Forest</strong>s, GOI to UNFCCC with respect to carbon balance.The NCP implementation is based on three sets of interrelated subjects viz:i. Vegetation <strong>Carbon</strong> Pool Assessmentii. Soil <strong>Carbon</strong> Pool Assessment, and4
iii. Soil and Vegetation- Atmosphere <strong>Carbon</strong> Fluxes.The major objectives of the Vegetation <strong>Carbon</strong> Pool assessment project are:1. Assessment of terrestrial vegetation biomass in the country using ground sampling andsatellite remote sensing data, and2. Generation of geospatial data of the terrestrial phytomass carbon of India along with estimatesof uncertainty.Among this, fulfillment of the first objective in the Northern <strong>Kerala</strong> region is the major thrust area ofthe current project.The soil carbon pool assessment sub project covers three major objectives viz;i. Determination of soil organic carbon in surface and sub-surface soils and inorganic carbonin arid regions of the country using field sampling.ii. Device stratification and remote sensing data integration methodology for spatial mappingof soil carbon pools.iii. Generating soil carbon spatial data sets along with estimation of uncertainty.Under this subproject, determination of soil organic carbon in surface and sub-surface soils offorests of Northern <strong>Kerala</strong> is covered in the present study.The third sub-project, Soil and Vegetation – Atmosphere carbon fluxes assessmentcomponent, is not dealt with.MethodologyDefining an appropriate phytomass density observation mapping and modeling approach for<strong>National</strong>-scale vegetation carbon pool assessment is one of the major tasks in the <strong>National</strong> <strong>Carbon</strong><strong>Project</strong>. Very few studies have used satellite data along with ground data for biomass estimation andextrapolation and most have used only compiled forest inventory data. Several of these studies haveconsidered only main bole, hence approaches to account biomass in other components are needed.Since these estimates vary greatly, it is important to have uniform methodology to generate baselinedata on total biomass and carbon in terrestrial ecosystem in India. Satellite data enables stratificationand has several advantages. Therefore, a cluster based sampling using remote sensing data forstratification was suggested at national level by ISRO and the same methodology was adopted in thecurrent works.The TOF resources in general are independent of forest resources, and are an integral part ofthe non-forest landscape having ecological and economic functions of their own. Therefore, theyshould be taken into consideration in large-area natural resource planning.5
Trees outside forests (roads, canals, railways, urban area, agricultural crops etc.) have highamount of biomass. Tree resources outside continuous forest areas or trees outside forests (TOF) cancover considerable areas. They occur as small woodlots and block plantations, along linear features(e.g. roads, canals) or are found scattered on farmlands, homesteads, community lands and in urbanareas. Traditionally, TOF were not inventoried and as a result, quantitative information about TOF isscarce. However, interest in TOF has increased worldwide. Besides providing support to subsistenceeconomies, these trees form a substantial source of raw materials for forest industries. In its <strong>Forest</strong>Resource Assessment 2000, the Food and Agriculture Organization (FAO) of the United Nationsconcluded that information on TOF remains fragmented, diffuse, sometimes empirical and oftensectoral.The use of trees in farming systems date back to the beginning of domestic agriculture. Morerecently, interest in partnerships (e.g. outgrower scheme, joint ventures) between the private andpublic sectors, communities and individuals for the production of goods and services outside forestshas been increasing. In temperate agricultural landscapes, trees and shrubs mainly occur in the formof scattered trees, windbreaks, blocks and linear plantations. For centuries, farmers in India havemaintained a traditional land-use system known as "sacred groves", in which a separate area withtrees was set aside. Trees are also a vital component of the urban landscapes.The <strong>Forest</strong> Survey of India (FSI) has been conducting TOF assessments since the early 1990s.Due to its expertise in this field, FSI is in a position to take the lead in Asia offering training oninventory methods of TOF to professionals. It is in this context that FSI has prepared this "TrainingManual on Inventory of TOF".Fundamental starting points for a comprehensive approach to conducting inventories of TOF areclear definitions and a brief overview of the extent and state of the resource. TOF comprise treeformations ranging from single discrete trees, to systematically managed trees on private and publiclands. Inventory is the process of obtaining quantitative and qualitative information about a resource(Kleinn, 2000).A clear definition of TOF is required in order to guarantee consistency and comparability amongdata sets, and to facilitate communication. In this connection FAO (2001) categorization is asfollows:6
Tree:A woody perennial with a single main stem, or in the case of coppice withseveral stems, having a more or less definite crown. Includes: bamboos,palms and other plants meeting the above criterion.<strong>Forest</strong>: Land with tree crown cover (or equivalent stocking level) of more than 10percent and area of more than 0.5 hectares (ha). The trees should be ableto reach a minimum height of 5 m at maturity in situ. May consist ofeither closed forest formations where trees of various storeys andundergrowth cover a high proportion of the ground, or open forestformations with a continuous vegetation cover, in which tree crown coverexceeds 10 percent. Young natural stands and all plantations establishedfor forestry purposes which have yet to reach a crown density of 10percent or tree height of 5 m are included under forest, as are areasnormally forming part of the forest area which are temporarily unstockedas a result of human intervention or natural causes but which areexpected to revert to forest.Includes: forest nurseries and seed orchards that constitute an integralpart of the forest; forest roads, cleared tracts, firebreaks and other smallopen areas; forest in national parks, nature reserves and other protectedareas such as those of specific scientific, historical, cultural or spiritualinterest; windbreaks and shelterbelts of trees with an area of more than0.5 ha and width of more than 20 m; plantations primarily used forforestry purposes, including rubberwood plantations and cork oak stands.The term specifically excludes stands of trees established primarily foragricultural production, for example fruit tree plantations. It alsoexcludes trees planted in agroforestry systems.Otherwoodedland:Treesoutsideforests:Land with either a crown cover (or equivalent stocking level) of 5 to 10percent of trees, able to reach a height of 5 m at maturity in situ; or acrown cover (or equivalent stocking level) of more than 10 percent oftrees not able to reach a height of 5 m at maturity in situ (e.g. dwarf orstunted trees); or with shrub or bush cover of more than 10 percent.Trees on land not defined as forest and other wooded land. Includes: treeson land that fulfils the requirements of forest and other wooded landexcept that the area is less than 0.5 ha; trees able to reach a height of atleast 5 m at maturity in situ where the stocking level is below 5 percent;trees not able to reach a height of 5 m at maturity in situ where thestocking level is below 20 percent; scattered trees in permanent meadowsand pastures; permanent tree crops such as fruit-trees and coconuts; treesin parks and gardens, around buildings and in lines along streets, roads,railways, rivers, streams and canals; trees in shelterbelts of less than 20m width and 0.5 ha area. Source: FAO (2001)FAO’s definition of TOF depends on the definition of forest and other wooded land. Differentdefinitions will affect inventory results.7
TOF information was generated in three phases: land use classification and mapping;identification of tree-cover classes; and measurement of tree characteristics. Satellite images andaerial photos are suitable for the first two. High-resolution satellite images are likely to allow theidentification of single trees (or crowns) and can be a data source for a large-area TOF inventory.Land use and land cover are important factors for TOF inventory and therefore, the classificationrules should be formulated in such a way that these factors are suitably considered. Since sources ofinformation for land use and land cover are different, and in some cases segregation between land useand land cover is difficult, some other methods needs to be adopted for classification purposes. Thegeometric resolution of an image allows the determination of crown cover, tree density and spatialarrangement of trees (or crowns). Other important attributes (e.g. species, stem, DBH, crown width)are more reliably observed in the field. Non-biophysical variables such as ownership and type of treemanagement can also be observed in the field.The basic prerequisite for a large-area TOF inventory is a land-use map, readily available orproduced from satellite images. This base map is then used for the identification of areas where TOFare found and the type of TOF that are likely to be encountered during the inventory. On the basis ofthis map, the inventory can be planned.The choice of variables for which data are to be collected depends upon the objectives of theinventory. Land use, land cover and tenure may be important issues. The choice of appropriatesampling design is also crucial. It should be practical and ensure the desired results with the specifiedreliability, at a minimum cost and/or with the maximum reliability at a given cost, given the mosteffective use of the resources available.Efficient inventory designs integrate the use of aerial photos or high-resolution satellite imageswith field plots. The role of high-resolution satellite images is to identify TOF and its configurations,support mapping and spatial analysis and assist in fieldwork planning. Detailed field sampling isrequired to provide information on species composition, tree dimensions, management practices andownership. The spatial distribution (e.g. scattered individual trees, trees in lines, trees in blocks)necessitates an adjusted design of sample plots, combining fixed-area plots and line samples, ascarried out in ecological surveys and forest inventories.TOF were classified into eight categories for the purpose of data collection, processing andanalysis. These categories for classification were:8
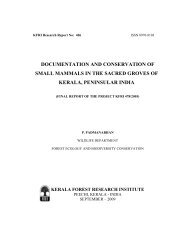
1. Farm forestry: trees along field bunds and in small patches of up to 0.1 ha.2. Village woodlot: naturally growing or planted trees on community land.3. Block plantation: compact plantations covering an area of more than 0.1 ha and not falling incategories (i) and (ii).4. Roadside plantation: trees planted along roads.5. Pond side plantation: trees planted around water bodies.6. Railway side plantation: trees planted along railway lines.7. Canal side plantation: trees planted along canals.8. Others: trees not falling in any of the above categories.Fig. 2. TOF as seen in satellite imageriesMost of the TOF came under old plantations and have giant trees as comparison to naturalvegetation. Since these are not in contiguous patches, such vegetation has been ignored, for biomassstudies. There are few studies on biomass and carbon estimation on Trees outside forests (TOF)mostly by <strong>Forest</strong> Survey of India.TOF can be classified as per the location and type and different sampling approaches can bemade accordingly.9
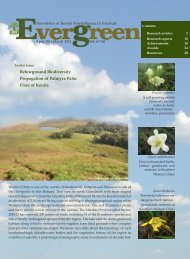
Fig.3. TOF classificationThe estimation of biomass and carbon using satellite data for TOF become pertinent forvegetation. Hence, for estimation of biomass and carbon assessment of TOF in the country, astandard method was formulated by ISRO and the same was adopted in the present study.Fig. 4. Sampling design for TOF10
The methodology for estimation of biomass and carbon was developed for different components suchas trees in the forest ecosystem, trees outside forests, crops and waste lands.Fig.5. Stages of phytomass and carbon estimationThe project envisages taking up the fresh observation, because earlier estimates in the countrywere either based on historical data or had followed different methodologies in terms of datacollection protocols, analysis, area, time frame etc. Hence a uniform methodology was proposed byISRO and protocols have been developed for biomass and carbon estimation in Trees outside <strong>Forest</strong>s.The protocols developed by ISRO were used for <strong>National</strong> Level estimation of <strong>Carbon</strong>. The currentwork was a part of <strong>National</strong> <strong>Carbon</strong> Assessment <strong>Project</strong>.Spatial stratification and sampling procedureSatellite data enables stratification of various types/ components of vegetation. The stratificationis usually based on forest vegetation density and type, envisaging to collect ground data uniformlythroughout the study region. Since forest ecosystems are very dynamic, biomass distribution patternis governed by factors like site quality, forest type, climate, physiography, moisture availability etc.Hence twenty major zones covering all the major biomes in the country were identified by <strong>National</strong>Remote Sensing Centre (NRSC), which equals to one quadrant of AWiFS coverage, covering about70% of the geographic area of the country. AWiFS data of three seasons in the year 2006-07 were11
used and the data correction was done for geometric and radiometric distortions. Geo-rectification on1:250,000scale was done for removal of geometric distortions. Among these 20 zones, one zonecovers <strong>Kerala</strong> and Tamil Nadu states; of which northern part of <strong>Kerala</strong> state is selected for the presentstudy.Fig.6. AWiFS quadrant mosaic of IndiaIt is envisaged to do sampling at 2500 sites in forest ecosystems throughout the country. Forsampling design and identification of the sites the strata considered are forest type based on DOS andISRO studies, forest density based on FSI, and NDVI based on AWiFS and MODIS. Sinceaccessibility to collect data in remote forest areas is important, communication aspects are also beencombined in selection of sites for field data collection.Sampling approachFour plots of 0.1ha size were identified in each site. Nested two stage sampling approach wasadopted to sample for trees (0.1ha), shrubs (25sq.m), herbs (1m x 5m), bamboo (0.1ha), litter (1m x5m) and dead trees (0.1ha). - Fig.7.12
Fig.7. Clustering 2-stage sampling and plot design for tree, shrub and herb samplingThe spatial resolution of AWiFS is 56 m and the plot size would be 31.61 x 31.61 m, so that onepixel would cover nearly four plots. In order to obtain better relationship of ground measurementswith satellite derived parameter, cluster sampling was done to lay four sample plots of 0.1 ha at eachsite within an area of 250 x 250 m.The sample plots were laid at different density levels viz. very dense (more than 70%), dense(40-70%), medium (20-40%) and open (less than 20%) density classes. Random sampling wascarried out, within the systematically identified locations. Among the 20 zonal sites (Fig.6), in eachzone, 70-100 sample sites of 250 x 250 m grids (Fig.7) were identified, considering types ofvegetation, density of vegetation and physiographic conditions of the area and other ground realities.Coordinates of the center of the site was obtained using FCC (LISS III) or maps. Global PositionSystem (GPS) in conjunction with topo maps were used to locate site on the ground. The area wasdivided into four quadrates (NE, SE, SW, and NW). Four permanent sample plots, about 75-90 maway from center, were laid in each quadrate (Fig.7). At each sample sites of 250 x 250 m, foursample plots of 31.6 x 31.6 m size, in each quadrant were identified for detailed enumeration andvolume estimation. Each tree was numbered for future monitoring by fixing a steel plate (scot tags)with number, at the base of the trees. Dbh of trees were noted at 1.37 m height using steel tapes.Height of trees, girth of bole and branches at different levels etc were noted for phytomassestimation. The phytomass estimation of shrubs was done from the sub plot of 5 x 5 m. The gbh wasmeasured about 30 cm above ground. The specieswise and bushwise number of tillers, in the entireplot of 0.1 ha, was noted. Sample tillers were collected for the estimation of biomass. For herbaceouslayer, harvesting of the plant material in 2-5 sites of 1 x 1 m plot within 0.1 ha plot was done. For theestimation of phytomass of bamboos, number of clumps, number of culms per clump and the averagecbh of the stems were noted. Plant material collected was dried at 80° C for 24 hours and weighed.13
For better understanding ground based and satellite derived biomass and carbon estimates, a twostage clustering sample design was followed (Fig.8).20 zonal sites ie.AWiFSquadrants75-100 samples sitesper quadrant (2500super plots of 250 X250 m4 sample plotsat each superplotFig.8. Two stage clustering sample designTo ensure that the data is complete for different components, standard format supplied by ISRO(see Appendix 1) was used for data recording. Periodical monitoring of structural and biomass data ofdifferent forest cover type is essential in view of the global issues like loss of biomass/ biodiversity,impact of climate on the distribution pattern, migration of species etc. Hence laying of permanentsample plots for future monitoring was also undertaken by fixing rust proof aluminium metal coinswith numbers 1-135 in one of the four sample plots in each site along with GPS coordinates of theplot.Fig. 9. Stages in carbon estimation of non-forest ecosystems14
Estimation of Plot Biomass and <strong>Carbon</strong>From the ground data collected, volume of each tree can be calculated using site specificvolume equations available in literature. Biomass of each tree can be worked out after multiplyingwith specific gravity and expansion factor. Biomass of each plot can be estimated by summing thephytomass of all trees. Based on this, per plot and per ha phytomass can be estimated. <strong>Carbon</strong>estimation can be done by using 47.5% (average value) of the total biomass. Per pixel biomass can beobtained for further analysis and establishing relationship with NDVI. GIS layers of biomass andcarbon can be summed up to obtain site biomass.The field data collected was handed over to ISRO for further processing. In the process ofbiomass estimation, estimation of volume of each tree was required. Since nondestructive approachwas adopted, the wood volume was estimated using regional species specific regression equationswhich required diameter at breast height (dbh) and tree height. The product of volume and speciesspecific gravity gives biomass, which could be estimated using the field data supplied to the projectcoordinator centre at ISRO.Based on the literature survey of TOF in different Agro-ecological zones in the country, it wasnoted that there is an increase in phytomass/ carbon in TOF in India from 436 million tons to 548million tons. To account for the biomass and carbon in these systems, format for enumerating trees,shrubs, herbs, bamboos, litter, humus, saplings and seedlings of TOF has been designed by ISRO.The same format was used in the current study. (see Appendix 1)Based on the field information gathered during the project, geospatial modeling and up-scalingof plot biomass to spatial forest carbon density using multi-resolution remote sensing data will bedone in the <strong>National</strong> <strong>Project</strong> Coordination Centre at ISRO. Hence regression modeling betweenoptical spectral data and plot-wise biomass density will not be done at local level. The different stepsin the carbon pool assessment are as follows:15
High Resolution Satellite DataIdentification of Sample Sites in StriptMultiseason Data, VegetationIndices, Collateral DataFSI MapsLaying of 50 x 20m plots or 5 m long and width of the featureat 15-30kmField ObservationLocal and Regional Volume EquationPlot Volume EstimateAverage Biomass within a givenwindowLocal and Regional BiomassEquation, Specific gravity, ExpansionModelingStrip <strong>Forest</strong> <strong>Carbon</strong> LayerFig.10. Steps in carbon estimation in Strip <strong>Forest</strong> EcosystemsSoil sampling and analysisSoil samples were collected from both natural forest and trees outside forest areas. The depth ofsampling was 0-30, 30-60 and 60-100cm in the former and 0-15, 15-30, 30-60 and 60-100cm in thelatter. Organic carbon in the soil was determined by wet digestion method of Walkley and Black(1934) as described by Jackson (1979). Bulk density was estimated using core sampler of amplediameter. <strong>Carbon</strong> mass was calculated using the formula, Cm=; where Cm= carbonmass, Tc i =total carbon of i th layer, B i =bulk density of i th layer and d i =depth of i th layer.16
DiscussionFor extrapolation of the point observations, spectral modeling can be used. Satellite derivedparameters like raw bands (red and infra red) and ratio indices form good basis for extrapolating thephytomass and therefore, these can be correlated with ground observations for specific forest types ineach ecological region. Various regression models like linear, power, logarithmic, exponential etc canbe attempted. Best correlation can be used to extrapolate the biomass in that forest type. <strong>Forest</strong> typewise biomass can be estimated in each ecological zone. Biomass of all ecological zones can be addedin GIS domain to get the total biomass of the area.There are well established protocols for bole volume and biomass estimation. A product ofvolume and specific gravity yields biomass. Species specific local volume equations are not availablein all ecological regions, hence regional equations can be used for biomass estimation. If suchequations are not available, equations of genus or families can also be tried. If genus specific orfamily specific equations are also not available, then, general equations at State/ Region level can beused for biomass estimation.Individual tree biomass is added to get the plot biomass. Biomass of shrubs, herbs, bamboos etcshould also be added to get the plot biomass. Since each site in the current study is having four plots,mean site/ plot biomass can be obtained for further spectral modeling/ extrapolation using satellitedata.<strong>Carbon</strong> in plant biomass was reported to vary from 33 to 52%. In the <strong>National</strong> <strong>Carbon</strong> <strong>Project</strong>,it is envisaged to use 48% of the phytomass for considering carbon estimation. For regional andcountry level biomass and carbon map, the same can be represented in appropriate grids of 5 x 5 kmand 10 x 10 km, based on the data base on grids of 5 and 10 km, prepared in GIS domain. Thiscountry level data can be made available to user communities (Ministry of <strong>Forest</strong>s & Environment,State <strong>Forest</strong> Department, Scientists, and <strong>Research</strong>ers etc.) at <strong>National</strong> and International level.17
Trees Outside <strong>Forest</strong>sTOF StatusTable 1. Details of TOF sites studiedTOF type District No. of Mean Tree Mean Basal Meansites Density Area (m2) VolumeLinear (Road) Malappuram, 5 232/km 1.665 /kmKozhikodeLinear (Rail) Kozhikode 1 120/km 0.959 /kmLinear (Canal) Kozhikode 3 320/km 0.257 /kmScattered Kasaragod 2 180/ha 0.607 /ha(Agriculture)Scattered Kannur 1 180/ha 1.950 /ha(Urban)Scattered (Rural) Kasaragod 1 360/ha 2.729 /haBlock Plantation Kannur 1 940/ha 1.966 /haOthers Malappuram 1 640/ha 0.536 /ha18
TOF Vegetation Status of Selected PlotsPlot No. 1FORMAT FOR TREES OUT-SIDE FOREST (TOF)Form 2ACATEGORY 1: SITE AND OBSERVERState: <strong>Kerala</strong> District: Malappuram GPS Point Name= KuttippuramLocation/Road/Canal/Village: NH-47 (Kuttippuram)Site Centre Coordinates : Lati. 10º 51' 42.23" Longi. 76º 2' 14.82"Sample Site/Plot No.: T- 01 Date: 12/10/2009 Time: 1.15 PMG.P.S. Reading (HHDD:MM:SS and WGS 84): Lati 10º 51' 42.23" Longi. 76º 2' 14.82"Observer: Deepu Divakaran Altitude: Site/Plot: 93 mMarking on image: (Google/1:25,000 or larger)(Tonal characteristics)Slope (°): 1º Photograph Number: 4248 - 4251Aspect : N/E/S/W/NE /SE/SW/NW Topography General observations: PlainCATEGORY 2: FOREST AND SOIL- GENERAL:TOF type: Road sideVisual evidence of disturbance lopping/ fire/ cutting/grazing etc: NilTop Canopy species: Syzygium cumini var. cumini, Mangifera indicaGround Cover(%): 40% Stoniness(%): 0% Rock Put-crop(%): 0%Soil Type: Lateritic Soil Texture : MediumSoil colour: Reddish brownLitter thickness: 2 cm Humus Colour: Pale brown Humus thickness: 0.5 cmDepth (m)Bulk Density(kg/m 3 )Organic carbon(%)<strong>Carbon</strong> mass(kg/m 2 )0.00-0.15 1260 2.64600.15-0.30 1400 2.60400.30-0.60 1330 3.39150.60-1.00 1350 1.24209.8835CATEGOREY 3: QUANTITATIVE MEASUREMENTSCrown Density (%) (sky hit numbers and steps): NE-SW: Steps: Hits: (Sky/Canopy)NW-SE: Steps: Hits: (Sky/Canopy)Stand Height (m) (Average from 3-4 trees of top and 1 st canopy): Top: 20 +21 +22 = 21mAt the base of ultimate branching 1 st : + + = m19
Very Important Guidelines(a) Plot Size for Linear Plantation: Roads (NH, SH, Lane, etc.), Canals (Major – one side, Minor –both sides, etc.), Bunds (e.g. shelter belts) in agriculture fields, Rail, etc. = 50 m × 20. m width(b) Plot Size for Scattered Trees in Agriculture, Settlements, etc. areas: For very dense andmedium density trees take 2 plots of 100×100m within 250×250 m on opposite corners and for open/scattered trees take one plot of 250×250 m)(c) Plot Size for Block Plantation: four plots of 0.1 ha (please do clustered sampling)Plot Size: Linear = 50 m ×18 m (width at outer margins touching agri. field); Scattered- dense treese.g. cities (Chandigarh, N. Delhi, Bangalore, Mt. Abu,) two of 100×100m in opposite corners within250×250 m and very sparse in agriculture areas: one of 250×250 m or block plantation take four of31.62×31.62 m.Width of tar on road / water channel in canal / railway track width = 10 m (tar/rail)Width with pavement of road/side of rail track = 17 mPlot Size: 50 × 18 m L= Leaves, NL= No leavesS.no.Species Cbh (≥ 10cm)Height(m) at 1 stforkingHeight (m)ultimateforkingPhenology(L/NL)CutYes/No1 Syzygium cumini var. cumini 487.2 3 22 L No2 Syzygium cumini var. cumini 372.6 4 21 L No3 Mangifera indica 315.4 5 20 L No4 Mangifera indica 216.3 4 21 L NoShrubs in 5×5m in a plot of 50×20 width m, in 0.1 ha in 100×100 m plot and 250×250 m (girth at 30 cmabove base): (Please bring representative stem of all shrub species either entire or approximately 20 cm longfrom base, middle and upper, observe 4-5 bushes of each species for better averaging and estimations)(a) North-East Corner (5×5m/0.1 ha plot)Species/ bush No. of bushes Number of tillers in 3 Girth/Diam. Height (m) Fresh Dryand % cover bushes of each species (cm)Weight (gm) Weight(gm)0.1ha 5 x 5m Bush No. 1 2 3 1 2 3 1 2 3 1 2 3 1 2 3PseudarthriaviscidaNo: 1 No: 1 Thick%: %: MediumThin 1 0.8 0.3 3.8 1.8Urena lobata No: 3 No: 1 Thick%: %: MediumThin 1 1.5 0.2 1.7 0.5Sida acuta No: 4 No: 1 Thick%: %: MediumThin 1 0.9 0.2 5.6 1.720
Species/bush(a) South-west Corner (5×5/0.1 ha plot)No. of bushes and% coverAlternanthera sessilisNumber of tillers in 3bushes of each speciesGirth/Diam.(cm)Height (m) Fresh Weight(gm)DryWeight(gm)0.1ha 5 x 5m Bush No. 1 2 3 1 2 3 1 2 3 1 2 3 1 2 3No: 2 No: 2 Thick%: %: Medium 4 2.2 1 16.5 2.6Thin 1 1.3 0.75 9.5 1.6Bamboo (50× 20 m width, 100×100m or 250×250 m plot and circumference at 30 cm above ground.)(a)North-East Corner (50× 20 m width or 0.1 ha plot or 100×100m, or 250×250 m) : No Bamboo1 Number of rosettes in the plot % Cover=2 Rosettes circumference (m) + + + + + + + Avg.=3 Number of culms in rosettes + + + + + + + Avg.=S.NoSpecies /RosettesGirthclassNo. of culmsin rosettes1 2 3Girth ofCulms (cm)1 2 3Height (m)Fresh(gm)WeightDry Weight(gm)1 2 31 2 31 Thick + + + + + + + + + +Medium + + + + + + + + + +Thin + + + + + + + + + +2 Thick + + + + + + + + + +Medium + + + + + + + + + +Thin + + + + + + + + + +(b) South-West Corner (50× 20 m width or 0.1 ha plot or 100×100m or 250×250 m) No Bamboo1 Number of rosettes in the plot % Cover=2 Rosettes circumference (m) + + + + + + + Avg.=3 Number of culms in rosettes + + + + + + + Avg.=S.NoSpecies /RosettesGirthclassNo. of culmsin rosettes1 2 3Girth ofCulms (cm)1 2 321Height (m)Fresh(gm)WeightDry Weight(gm)1 2 31 2 31 Thick + + + + + + + + + +Medium + + + + + + + + + +Thin + + + + + + + + + +2 Thick + + + + + + + + + +Medium + + + + + + + + + +Thin + + + + + + + + + +(a) Herb 1 (1×1 m) (record epiphytes/lithophytes/climbers etc. also) Took fresh weight in all plotsand if the cover is similar then selected only one sample from a plot for drying and weighing.In 1×1 m: Fresh weight: .0.106 gm Dry Weight: 0.048gm % Cover: 86
S.No. Species No. ofindividualsS.No. Species No. ofindividuals1 Pogostemon purpurascens 4 6 Commelina benghalensis 22 Synedrella nodiflora 3 7 Eclipta prostrata 13 Laportea interrupta 1 8 Cyperus rotundus 144 Peperomia pellucida 1 9 Cynodon dactylon 105 Ageratum conyzoides 1 10 Lindernia ciliata 1(b) Herb 2 (1×1 m) (record epiphytes/lithophytes/climbers etc. also)In 1×1 m: Fresh weight: 0.102 gm Dry Weight: 0.047gm % Cover: 85S.No. Species No. ofindividualsS.No. Species No. ofindividuals1 Synedrella nodiflora 3 6 Axonopus compressus 202 Mimosa pudica 2 7 Cardiospermum halicacabum 13 Ruellia tuberosa 1 8 Mukia maderaspatana 14 Commelina benghalensis 3 9 Dendrophthoe falcata 15 Cyperus rotundus 8 10(c) Herb 3 (1×1 m) (record epiphytes/lithophytes/climbers etc. also)In 1×1 m: Fresh weight: 0.098 gm Dry Weight: 0.045gm % Cover: 84S.No. Species No. ofindividualsS.No. Species No. ofindividuals1 Commelina benghalensis 2 6 Ageratum conyzoides 22 Cyperus rotundus 9 7 Ruellia tuberosa 43 Axonopus compressus 18 8 Mimosa pudica 34 Synedrella nodiflora 2 95 Lindernia ciliata 2 10Litter in four plots of 1×1 m laid randomly – leaves + twigs+ branches+ fruits+ etc.Plots Twigs+ Branches +Humus (gm)TotalLeaves(gm)Fresh Dry Fresh Dry Fresh Dry(a) NE 0.421 0.306 0.078 0.054 0.499 0.36(b) NW 0.398 0.299 0.063 0.045 0.461 0.344(c) SW 0.253 0.193 0.058 0.042 0.311 0.235(d) SE 0.232 0.178 0.054 0.038 0.286 0.216(e) Center22
Plot No.2Form 2AFORMAT FOR TREES OUT-SIDE FOREST (TOF)CATEGORY 1: SITE AND OBSERVERState: <strong>Kerala</strong> District: Malappuram GPS Point Name = HamsappadyLocation/Road/Canal/Village: River side-Bharathapuzha (Kuttippuram – Thirur)Site Centre Coordinates: Lati. 10º 51' 39.456" Longi. 76º 1' 3.648"Sample Site/Plot No.: T- 02 Date: 13/10/ 2009 Time: 10.00 AMG.P.S. Reading (HHDD: MM: SS and WGS 84): Lati 10º 51' 39.456" Longi. 76º 1' 3.648"Observer: Deepu Divakaran Altitude: Site/Plot: 18 mMarking on image: (Google/1:25,000 or larger)(Tonal characteristics)Slope (°): 2º Photograph Number: 4222 - 4225Aspect : N/E/S/W/NE /SE/SW/NW Topography General observations): River sideCATEGORY 2: FOREST AND SOIL- GENERAL:TOF type: River side Visual evidence of disturbance lopping/ fire/ cutting/grazing etc: NilTop Canopy species: Terminalia catappa, Samanea saman, Cocos nucifera, Racosperma auriculiformeGround Cover (%): 70% Stoniness (%): 0% Rock Put-crop (%): 0%Soil Type: Sandy Soil Texture : MediumSoil colour: Yellowish brownLitter thickness: 3 cm Humus Colour: Pale Gray Humus thickness: 0.5 cmDepth (m)Bulk Density(kg/m 3 )Organic carbon(%)<strong>Carbon</strong> mass(kg/m 2 )0.00-0.15 1200 2.66400.15-0.30 1460 2.62800.30-0.60 1400 3.10800.60-1.00 1420 2.044810.4448CATEGOREY 3: QUANTITATIVE MEASUREMENTSCrown Density (%) (sky hit numbers and steps): NE-SW: Steps: Hits: (Sky/Canopy)NW-SE: Steps: Hits: (Sky/Canopy)Stand Height (m) (Average from 3-4 trees of top and 1 st canopy): Top: 28 +15 +14 = 19mAt the base of ultimate branching 1 st : 13 + 9 + 8 = 10 m23
Very Important Guidelines(a) Plot Size for Linear Plantation: Roads (NH, SH, Lane, etc.), Canals (Major – one side, Minor –both sides, etc.), Bunds (e.g. shelter belts) in agriculture fields, Rail, etc. = 50 m × 20 m width(b) Plot Size for Scattered Trees in Agriculture, Settlements, etc. areas: For very dense andmedium density trees take 2 plots of 100×100m within 250×250 m on opposite corners and for open/scattered trees take one plot of 250×250 m)(c) Plot Size for Block Plantation: four plots of 0.1 ha (please do clustered sampling)Plot Size: Linear = 50 m ×35 m (width at outer margins touching agri. field); Scattered- dense treese.g. cities (Chandigarh, N. Delhi, Bangalore, Mt. Abu,) two of 100×100m in opposite corners within250×250 m and very sparse in agriculture areas: one of 250×250 m or block plantation take four of31.62×31.62 m.Width of tar on road / water channel in canal / railway track width = 850 m (tar/rail)Width with pavement of road/side of rail track = mPlot Size: 50 × 35 m L= Leaves, NL= No leavesS.no.Species Cbh (≥ 10cm)24Height(m) at 1 stforkingHeight (m)ultimateforkingPhenology(L/NL)CutYes/No1 Terminalia catappa 107.1 5.00 15.0 L No2 Terminalia catappa 036.3 2.00 10.0 L No3 Terminalia catappa 018.8 1.50 03.5 L No4 Mangifera indica 016.1 0.75 04.0 L No5 Cocos nucifera 085.6 - 11.0 L No6 Terminalia catappa 038.2 6.00 10.0 L No7 Cocos nucifera 084.2 - 12.0 L No8 Terminalia catappa 033.1 - 09.0 L No9 Cocos nucifera 089.7 - 13.0 L No10 Cocos nucifera 083.6 - 09.0 L No11 Cocos nucifera 084.5 - 08.0 L No12 Cocos nucifera 085.3 - 09.0 L No13 Cocos nucifera 082.2 - 08.0 L No14 Cocos nucifera 082.9 - 07.5 L No15 Cocos nucifera 075.5 - 06.0 L No16 Cocos nucifera 068.3 - 05.0 L No17 Briedelia retusa 045.2 2.00 06.0 L No18 Briedelia retusa 025.2 3.00 04.0 L No19 Bombax ceiba 035.1 - 06.0 L No20 Mangifera indica 039.4 2.50 08.0 L No21 Samanea saman 285.9 2.50 28.0 L No22 Racosperma auriculiforme 149.3 2.00 14.0 L No23 Erythrina variegata 074.5 2.75 09.0 L No24 Gliricidia sepium 035.2 1.50 08.0 L No25 Gliricidia sepium 038.3 1.50 07.5 L No
26 Gliricidia sepium 035.2 1.40 08.5 L No27 Gliricidia sepium 033.5 1.50 07.0 L No28 Gliricidia sepium 033.4 1.50 07.5 L No29 Gliricidia sepium 034.2 1.50 06.0 L No30 Gliricidia sepium 035.1 1.50 07.0 L No31 Gliricidia sepium 031.7 1.50 06.0 L No32 Gliricidia sepium 034.8 1.50 08.0 L No33 Gliricidia sepium 033.1 1.50 09.0 L No34 Gliricidia sepium 033.2 1.50 07.0 L No35 Melicope lunu-ankenda 049.5 4.50 08.0 L No25
Shrubs in 5×5m in a plot of 50× 20 width m, in 0.1 ha in 100×100 m plot and 250×250 m (girth at 30 cm above base): (Please bring representative stem of allshrub species either entire or approximately 20 cm long from base, middle and upper, observe 4-5 bushes of each species for better averaging and estimations)(a) North-East Corner (5×5m/0.1 ha plot).Species/bushNo. of bushesand % coverNo. of tillers in 3 bushesof each species Girth/Diam.(cm) Height (m) Fresh Wt.(gm) Dry Wt.(gm)0.1 ha 5 x 5m Bush No. 1 2 3 1 2 3 1 2 3 1 2 3 1 2 3Urena lobata ssp.lobataSida acutaSolanum torvumLawsonia inermisUrena lobata ssp.sinuata12 2 Thick 2 3.9 0.75 0.134 0.047Medium 1 3.5 0.65 0.072 0.0230.50% 0.40% Thin23 6 Thick 1 2.5 0.78 0.041 0.014Medium 1 2.3 0.69 0.035 0.0102.00% 0.50% Thin 1 1.9 0.65 0.031 0.00095 1 Thick 2 2.6 50.00 0.013 0.005Medium0.02% 0.01% Thin4 1 Thick 2 3.2 2.40 0.049 0.016Medium0.03% 0.02% Thin4 1 Thick 2 2.5 0.65 0.046 0.015Medium0.02% 0.01% Thin(b) South-west Corner (5×5/0.1 ha plot)Species/bushChromolaenaodorataPhyllanthusreticulatusBarleria courtallicaNo. of bushesand % cover0.1 ha 5 x 5mNo. of tillers in 3bushes of eachspecies Girth/Diam.(cm) Height (m) Fresh Wt.(gm) Dry Wt.(gm)BushNo. 1 2 3 1 2 3 1 2 3 1 2 3 1 2 333 6 Thick 1 0.9 2.30 0.067 0.021Medium 1 0.5 1.44 0.035 0.0104.00% 2.00% Thin 1 0.2 0.26 0.003 0.00094 2 Thick 1 1.8 1.65 0.189 0.055Medium 1 0.7 0.75 0.023 0.0040.02% 0.05% Thin3 1 Thick 1 0.9 0.61 0.013 0.005Medium0.01% 0.03% Thin26
Bamboo (50× 20 m width, 100×100m or 250×250 m plot and circumference at 30 cm above ground.)(a)North-East Corner (50× 20 m width or 0.1 ha plot or 100×100m, or 250×250 m )1 Number of rosettes in the plot 2% Cover = 0.0052 Rosettes circumference (m) 8 7 Avg. = 7.53 Number of culms in rosettes 26 22 Avg. = 24S.NoSpecies/Rosettes1 BambusabambosGirth classNo. of culmsin rosettesGirth ofCulms (cm)Height(m)Fresh Weight(gm)Dry Weight (gm)1 2 3 1 2 3 1 2 3 1 2 3 1 2 3Thick 11 28.1 22 0.287 0.165 0.038 0.153 0.087 0.020Medium 10 17.2 15 0.138 0.074 0.037 0.072 0.040 0.020Thin 5 7.2 7 0.099 0.034 0.015 0.052 0.019 0.008(b) South-West Corner (50× 20 m width or 0.1 ha plot or 100×100m or 250×250 m) No Bamboo1 Number of rosettes in the plot % Cover=2 Rosettes circumference (m) + + + + + + + Avg.=3 Number of culms in rosettes + + + + + + + Avg.=S.NoSpecies /RosettesGirthclass1 ThickMediumThinNo. ofculms inrosettesGirth of Culms(cm)Height (m)FreshWeight (gm)Dry Weight (gm)1 2 3 1 2 3 1 2 3 1 2 3 1 2 3(a) Herb 1 (1×1 m) (record epiphytes/lithophytes/climbers etc. also) Took fresh weight in all plotsand if the cover is similar then selected only one sample from a plot for drying and weighing.In 1×1 m: Fresh weight: 0.095 gm Dry Weight: 0.044 gm % Cover: 79S.No. SpeciesNo. of individuals1 Mitracarpus hirtus 42 Axonopus compressus 13 Alloteropsis cimicina 34 Synedrella nodiflora 55 Phyllanthus amarus 16 Achyranthes aspera var. aspera 27 Cyathula prostrata 18 Commelina benghalensis 19 Ruellia tuberosa 110 Laportea interrupta 127
(b) Herb 2 (1×1 m) (recorded epiphytes/lithophytes/climbers etc. also)In 1×1 m: Fresh weight: 0.068 gm Dry Weight: 0.031gm % Cover: 63S.No. SpeciesNo. of individuals1 Phyllanthus amarus 12 Synedrella nodiflora 23 Mitracarpus hirtus 34 Alloteropsis cimicina 45 Ageratum conyzoides 26 Mimosa pudica 2(c) Herb 3 (1×1 m) (recorded epiphytes/lithophytes/climbers etc. also)In 1×1 m: Fresh weight: 0.073 gm Dry Weight: 0.034 gm % Cover: 74S.No. SpeciesNo. of individuals1 Mimosa pudica 12 Laportea interrupta 23 Alloteropsis cimicina 34 Mitracarpus hirtus 55 Synedrella nodiflora 16 Ageratum conyzoides 17 Commelina benghalensis 2Litter in four plots of 1×1 m laid randomly – leaves + twigs+ branches+ fruits+ etc.Plots Twigs+ Branches + Leaves(gm) Humus (gm) TotalFresh Dry Fresh Dry Fresh Dry(a) NE 0.521 0.381 0.098 0.069 0.619 0.45(b) NW 0.458 0.354 0.088 0.063 0.546 0.417(c) SW 0.453 0.350 0.085 0.061 0.538 0.411(d) SE 0.432 0.334 0.083 0.059 0.515 0.393(e)Center28
Plot No.3VCP – IGBPFORMAT FOR TREES OUT-SIDE FOREST (TOF)Form 2ACATEGORY 1: SITE AND OBSERVERState: <strong>Kerala</strong> District: Malappuram GPS Point Name: Igbal NagarLocation/Road/Canal/Village: Approach roadSite Centre Coordinates : Lati. 10º 53' 54.49" Longi. 75º 59' 44.41"Sample Site/Plot No.: T-03 Date: 13/10/2009 Time: 2.00 PMG.P.S. Reading (HHDD:MM:SS and WGS 84): Lati. 10º 53' 54.49" Longi. 75º 59' 44.41"Observer: Deepu Divakaran Altitude: Site/Plot: 20 mMarking on image: (Google/1:25,000 or larger)(Tonal characteristics)Slope (°): 15 Photograph Number: 4227 to 4229Aspect : N/E/S/W/NE /SE/SW/NW Topography General Observations): HillyCATEGORY 2: FOREST AND SOIL- GENERAL:TOF type: Linear approach road Visual evidence of disturbance lopping/ fire/ cutting/grazing etc: NilTop Canopy species: Swietenia macrophyllaGround Cover (%): 77% Stoniness (%): 1 % Rock Put-crop(%) : 0 %Soil Type: Lateritic Soil Texture : Silty Soil colour: Reddish brownLitter thickness: 5 cm Humus Colour: Pale brown Humus thickness: 0.5 cmDepth (m)Bulk Density(kg/m 3 )Organic carbon(%)<strong>Carbon</strong> mass(kg/m 2 )0.00-0.15 1220 3.05610.15-0.30 1360 2.75400.30-0.60 1420 2.21520.60-1.00 1400 1.12009.1453CATEGOREY 3: QUANTITATIVE MEASUREMENTSCrown Density (%) (sky hit numbers and steps): NE-SW: Steps: Hits: (Sky/Canopy)NW-SE: Steps: Hits: (Sky/Canopy)Stand Height (m) (Average from 3-4 trees of top and 1 st canopy): Top: 23 +18 +17 = 19.33mAt the base of ultimate branching 1 st : 6 + 4 + 8 = 6 mVery Important Guidelines(a) Plot Size for Linear Plantation: Roads (NH, SH, Lane, etc.), Canals (Major – one side, Minor –both sides, etc.), Bunds (e.g. shelter belts) in agriculture fields, Rail, etc. = 50 m × 20 m width29
(b) Plot Size for Scattered Trees in Agriculture, Settlements, etc. areas: For very dense andmedium density trees take 2 plots of 100×100m within 250×250 m on opposite corners and for open/scattered trees take one plot of 250×250 m)(c) Plot Size for Block Plantation: four plots of 0.1 ha (please do clustered sampling)Plot Size: Linear = 50 m × 12 m (width at outer margins touching agri. field); Scattered- dense treese.g. cities (Chandigarh, N. Delhi, Bangalore, Mt. Abu,) two of 100×100m in opposite corners within250×250 m and very sparse in agriculture areas: one of 250×250 m or block plantation take four of31.62×31.62 m.Width of tar on road / water channel in canal / railway track width = 6 m (tar/rail)Width with pavement of road/side of rail track = 10 mPlot Size: 50 × 12 mS. Speciesno.Cbh (≥ 10cm)L= Leaves, NL= No leavesHeight Height (m)(m) at 1 st ultimateforking forkingPhenology(L/NL)Cut (C)Yes/No1 Swietenia macrophylla 217.20 10 23 L No2 Carallia brachiata 011.30 - 06 L No3 Caryota urens 038.40 - 09 L No4 Caryota urens 024.60 - 04 L No5 Swietenia macrophylla 116.50 10 18 L No6 Swietenia macrophylla 093.20 11 17 L No7 Swietenia macrophylla 149.10 05 20 L No8 Artocarpus hirsutus 020.20 - 02 L No9 Racosperma mangium 012.50 04 06 L No10 Swietenia macrophylla 099.20 04 16 L No11 Morinda pubescens 094.10 04 08 L No30
Shrubs in 5×5m in a plot of 50×20 width m, in 0.1 ha in 100×100 m plot and 250×250 m (girth at 30 cm above base): (Please bring representative stem of allshrub species either entire or approximately 20 cm long from base, middle and upper, observe 4-5 bushes of each species for better averaging and estimations)(a)North-East Corner (5×5m/0.1 ha plot).Species/bushUrena lobata ssp. lobataSida acutaLantana camara var.camaraHibiscus hispidissimusPseudarthria viscidaNo. of tillers in 3No. of bushesand % coverbushes of eachspecies Girth/Diam.(cm) Height (m) Fresh Wt.(gm) Dry Wt.(gm)0.1 ha 5 x 5m Bush No. 1 2 3 1 2 3 1 2 3 1 2 3 1 2 314 2 Thick 1 3.5 0.73 0.130 0.046Medium 1 3.0 0.63 0.069 0.0220.50% 0.40% Thin25 7 Thick 1 2.7 0.75 0.042 0.013Medium 1 2.3 0.67 0.035 0.0102.00% 0.50% Thin 1 1.7 0.61 0.029 0.00085 1 Thick 2 2.9 0.59 0.017 0.006Medium0.02% 0.01% Thin4 1 Thick 1 3.1 2.30 0.052 0.017Medium0.03% 0.02% Thin2 1 Thick 1 2.7 0.75 0.049 0.016Medium0.01% 0.01% Thin31
(c)South-west Corner (5×5/0.1 ha plot).Species/bushChromolaena odorataClerodendruminfortunatumChassalia curviflora var.ophioxyloidesCanthium travancoricumNo. of bushesand % cover0.1 ha 5 x 5mNo. of tillers in 3bushes of eachspecies Girth/Diam.(cm) Height (m) Fresh Wt.(gm) Dry Wt.(gm)BushNo. 1 2 3 1 2 3 1 2 3 1 2 3 1 2 335 6 Thick 1 0.9 2.30 0.067 0.021Medium 1 0.5 1.44 0.035 0.0104.00% 2.00% Thin 1 0.2 0.26 0.003 0.00094 2 Thick 1 1.8 1.65 0.189 0.055Medium 1 0.7 0.75 0.023 0.0040.02% 0.05% Thin2 1 Thick 1 0.9 0.61 0.013 0.005Medium0.01% 0.03% Thin5 1 Thick 1 3.1 2.30 0.052 0.017Medium0.03% 0.02% Thin32
Bamboo (50× 20 m width, 100×100m or 250×250 m plot and circumference at 30 cm above ground.)(a)North-East Corner (50× 20 m width or 0.1 ha plot or 100×100m, or 250×250 m ) : No Bamboo1 Number of rosettes in the plot % Cover=2 Rosettes circumference (m) + + + + + + + Avg.=3 Number of culms in rosettes + + + + + + + Avg.=S.NoSpecies /RosettesGirthclassNo. of culmsin rosettes1 2 3Girth ofCulms (cm)1 2 3Height (m)Fresh(gm)WeightDry Weight(gm)1 2 31 2 31 Thick + + + + + + + + + +Medium + + + + + + + + + +Thin + + + + + + + + + +2 Thick + + + + + + + + + +Medium + + + + + + + + + +Thin + + + + + + + + + +(b) South-West Corner (50× 20 m width or 0.1 ha plot or 100×100m or 250×250 m) : No Bamboo1 Number of rosettes in the plot % Cover=2 Rosettes circumference (m) + + + + + + + Avg.=3 Number of culms in rosettes + + + + + + + Avg.=S.NoSpecies /RosettesGirthclassNo. of culmsin rosettes1 2 3Girth ofCulms (cm)1 2 3Height (m)Fresh(gm)WeightDry Weight(gm)1 2 31 2 31 Thick + + + + + + + + + +Medium + + + + + + + + + +Thin + + + + + + + + + +2 Thick + + + + + + + + + +Medium + + + + + + + + + +Thin + + + + + + + + + +(a) Herb 1 (1×1 m) (recorded epiphytes/lithophytes/climbers etc. also) Took fresh weight in all plotsand if the cover is similar then selected only one sample from a plot for drying and weighing.In 1×1 m: Fresh weight: 0.097 gm Dry Weight: 0.045 gm % Cover: 74S.No. SpeciesNo. of individuals1 Cyclea peltata 22 Tragia involucrata 13 Mukia maderaspatana 24 Dioscorea alata 35 Mimosa pudica 86 Ageratum conyzoides 57 Alloteropsis cimicina 128 Synedrella nodiflora 333
(b) Herb 2 (1×1 m) (recorded epiphytes/lithophytes/climbers etc. also)In 1×1 m: Fresh weight: 0.054 gm Dry Weight: 0.024 gm % Cover: 59S.No. SpeciesNo. of individuals1 Alloteropsis cimicina 102 Ageratum conyzoides 43 Commelina benghalensis 164 Mimosa pudica 115 Achyranthes aspera var. aspera 4(c) Herb 3 (1×1 m) (recorded epiphytes/lithophytes/climbers etc. also)In 1×1 m: Fresh weight: 0.062 gm Dry Weight: 0.028gm % Cover: 64S.No. SpeciesNo. of individuals1 Ruellia tuberosa 22 Achyranthes aspera var. aspera 63 Ageratum conyzoides 54 Laportea interrupta 25 Peperomia pellucida 66 Cyperus rotundus 9Litter in four plots of 1×1 m laid randomly – leaves + twigs+ branches+ fruits+ etc.Plots Twigs+ Branches + Leaves(gm) Humus (gm) TotalFresh Dry Fresh Dry Fresh Dry(a) NE 0.245 0.177 0.052 0.037 0.297 0.214(b) NW 0.284 0.205 0.048 0.034 0.332 0.239(c) SW 0.228 0.164 0.043 0.030 0.271 0.194(d) SE 0.251 0.181 0.054 0.038 0.305 0.21934
Plot No. 4FORMAT FOR TREES OUT-SIDE FOREST (TOF)Form 2ACATEGORY 1: SITE AND OBSERVERState: <strong>Kerala</strong> District: Malappuram GPS Point Name= Beauty spot (Calicut University)Location/Road/Canal/Village: WastelandSite Centre Coordinates : Lati. 11º 8' 34.80" Longi. 75º 53' 12.70"Sample Site/Plot No.: T- 04 Date: 14/10/2009 Time: 11.20 AMG.P.S. Reading (HHDD:MM:SS and WGS 84): Lati 11º 8' 34.80" Longi. 75º 53' 12.70"Observer: Deepu Divakaran Altitude: Site/Plot: 58 mMarking on image: (Google/1:25,000 or larger)(Tonal characteristics)Slope (°): 2° Photograph Number: 4253 to 4255Aspect : N/E/S/W/NE/SE/SW /NW Topography General observations): HillyCATEGORY 2: FOREST AND SOIL- GENERAL:TOF type:Visual evidence of disturbance lopping/ fire/ cutting/grazing etc:Top Canopy species: Gliricidia sepium, Falconeria insignisGround Cover (%): 64% Stoniness (%): 20% Rock Put-crop(%): 15%Soil Type: Rocky Soil Texture : MassiveSoil colour: Yelloish RedLitter thickness: 0.2 cm Humus Colour: Nil Humus thickness: -Depth (m)Bulk Density(kg/m 3 )Organic carbon(%)<strong>Carbon</strong> mass(kg/m 2 )0.00-0.15 1320 1.26720.15-0.30 1440 0.51840.30-0.60 1400 0.84000.60-1.00 1330 0.53203.1576CATEGOREY 3: QUANTITATIVE MEASUREMENTSCrown Density (%) (sky hit numbers and steps): NE-SW: Steps: Hits: (Sky/Canopy)NW-SE: Steps: Hits: (Sky/Canopy)Stand Height (m) (Average from 3-4 trees of top and 1 st canopy): Top: 8.5 + 8.5 + 7 = 8 mAt the base of ultimate branching 1 st : 4.5 + 4.5 + 3 = 4 mVery Important Guidelines(a) Plot Size for Linear Plantation: Roads (NH, SH, Lane, etc.), Canals (Major – one side, Minor –both sides, etc.), Bunds (e.g. shelter belts) in agriculture fields, Rail, etc. = 50 m × 20m width35
(b) Plot Size for Scattered Trees in Agriculture, Settlements, etc. areas: For very dense andmedium density trees take 2 plots of 100×100m within 250×250 m on opposite corners and for open/scattered trees take one plot of 250×250 m)(c) Plot Size for Block Plantation: four plots of 0.1 ha (please do clustered sampling)Plot Size: Linear = 31.62 m × 31.62 m (width at outer margins touching agri. field); Scattered- densetrees e.g. cities (Chandigarh, N. Delhi, Bangalore, Mt. Abu,) two of 100×100m in opposite cornerswithin 250×250 m and very sparse in agriculture areas: one of 250×250 m or block plantation takefour of 31.62×31.62 m.Width of tar on road / water channel in canal / railway track width = m (tar/rail)Width with pavement of road/side of rail track = mPlot Size: 31.62 × 31.62 m L= Leaves, NL= No leavesS.no.Species Cbh (≥ 10cm)36Height(m) at 1 stforkingHeight (m)ultimateforkingPhenology(L/NL)CutYes/No1 Gliricidia sepium 23.2 3 5 L No2 Gliricidia sepium 21.3 - 4.5 L No3 Gliricidia sepium 20.4 - 3.5 L No4 Gliricidia sepium 24.5 - 4.5 L No5 Gliricidia sepium 25.2 - 5 L No6 Gliricidia sepium 23.6 - 5 L No7 Gliricidia sepium 21.7 - 3.5 L No8 Gliricidia sepium 24.4 - 4 L No9 Gliricidia sepium 28.3 2 5 L No10 Gliricidia sepium 18.1 - 5 L No11 Gliricidia sepium 17.2 - 3 L No12 Gliricidia sepium 15.1 - 4 L No13 Gliricidia sepium 18.2 - 4.5 L No14 Gliricidia sepium 17.1 - 3 L No15 Gliricidia sepium 23.2 - 4 L No16 Gliricidia sepium 18.4 - 4.5 L No17 Gliricidia sepium 26.6 3 5 L No18 Gliricidia sepium 15.7 - 3.5 L No19 Gliricidia sepium 23.9 - 4 L No20 Gliricidia sepium 25.8 - 5 L No21 Gliricidia sepium 25.6 - 3 L No22 Gliricidia sepium 20.4 - 3.5 L No23 Gliricidia sepium 17.3 - 4 L No24 Gliricidia sepium 18.2 2 4.5 L No25 Gliricidia sepium 16.1 2.5 5 L No26 Gliricidia sepium 22.4 2.5 4 L No27 Gliricidia sepium 23.5 3 5 L No28 Gliricidia sepium 24.6 2.75 6 L No29 Gliricidia sepium 18.7 3 5 L No30 Gliricidia sepium 20.8 1.5 4 L No31 Gliricidia sepium 15.6 2.25 4 L No
32 Gliricidia sepium 12.9 3 6.5 L No33 Gliricidia sepium 20.1 4 5 L No34 Gliricidia sepium 22.2 3 4 L No35 Gliricidia sepium 18.3 3.5 4 L No36 Gliricidia sepium 17.4 2 5 L No37 Gliricidia sepium 44.5 1.75 6.5 L No38 Gliricidia sepium 58.6 1.55 7 L No39 Macaranga peltata 15.8 2.25 7 L No40 Gliricidia sepium 13.9 2 6 L No41 Gliricidia sepium 12.1 1.75 3.5 L No42 Gliricidia sepium 23.6 3.5 8.5 L No43 Caryota urens 84.7 - 8.5 L No44 Macaranga peltata 29.8 3 7 L No45 Macaranga peltata 34.7 - 2.25 L No46 Falconeria insignis 34.4 2 5 L No47 Falconeria insignis 41.3 2.25 5.5 L No48 Falconeria insignis 45.6 1.85 5.5 L No49 Falconeria insignis 19.7 1.5 2 L No50 Falconeria insignis 37.8 1.75 5.5 L No51 Falconeria insignis 23.3 - 2.5 L No52 Falconeria insignis 47.4 1.5 6 L No53 Falconeria insignis 22.5 - 6.5 L No54 Falconeria insignis 31.6 2 6 L No55 Falconeria insignis 20.4 3 4.5 L No56 Falconeria insignis 13.3 - 4 L No57 Falconeria insignis 33.1 2.25 6.5 L No58 Falconeria insignis 43.2 2.258 7 L No59 Morinda pubescens 26.2 2 5 L No60 Alstonia scholaris 23.3 2.5 3 L Yes61 Macaranga peltata 37.4 1.45 3 L No62 Macaranga peltata 23.4 - 2.5 L Yes63 Macaranga peltata 33.2 3.25 4.5 L No64 Macaranga peltata 129.1 1.85 3.5 L No37
Shrubs in 5×5m in a plot of 50×20 width m, in 0.1 ha in 100×100 m plot and 250×250 m (girth at 30 cm above base): (Please bring representative stem of allshrub species either entire or approximately 20 cm long from base, middle and upper, observe 4-5 bushes of each species for better averaging and estimations)(A) North-East Corner (5×5m/0.1 ha plot).Species/bushCalycopteris floribundaClerodendruminfortunatumCanthium travancoricumChromolaena odorataNo. of bushesand % cover0.1 ha 5 x 5mNo. of tillers in 3bushes of eachspecies Girth/Diam.(cm) Height (m) Fresh Wt.(gm) Dry Wt.(gm)BushNo. 1 2 3 1 2 3 1 2 3 1 2 3 1 2 314 2 Thick 1 3.5 0.73 0.130 0.046Medium 1 3.0 0.63 0.069 0.0220.50% 0.40% Thin5 1 Thick 2 2.9 0.59 0.017 0.006Medium0.02% 0.01% Thin2 1 Thick 1 2.7 0.75 0.049 0.016Medium0.006% 0.01% Thin35 3 Thick 1 1.0 1.20 0.074 0.022Medium 1 0.7 0.73 0.048 0.0144% 1% Thin 1 0.5 0.36 0.007 0.002038
(B) South-west Corner (5×5/0.1 ha plot).Species/bushChromolaena odorataZiziphus oenopliaCanthium travancoricumSida cordifoliaRauvolfia tetraphyllaLantana camara var.camaraNo. of tillers in 3No. of bushesand % coverbushes of eachspecies Girth/Diam.(cm) Height (m) Fresh Wt.(gm) Dry Wt.(gm)0.1 ha 5 x 5m Bush No. 1 2 3 1 2 3 1 2 3 1 2 3 1 2 335 6 Thick 1 0.9 2.30 0.067 0.021Medium 1 0.5 1.44 0.035 0.0104.00% 2.00% Thin 1 0.2 0.26 0.003 0.00092 1 Thick 1 0.9 0.61 0.013 0.005Medium0.01% 0.03% Thin2 1 Thick 1 3.1 2.30 0.052 0.017Medium0.006% 0.01% Thin25 7 Thick 1 2.7 0.75 0.042 0.013Medium 1 2.3 0.67 0.035 0.0102.00% 0.50% Thin 1 1.7 0.61 0.029 0.00085 2 Thick 1 1.0 0.68 0.015 0.006Medium 1 0.5 0.55 0.004 0.0020.05% 0.1% Thin18 2 Thick 1 1.0 0.68 0.015 0.006Medium 1 0.5 0.55 0.004 0.0020.5% 0.1% Thin39
Bamboo (50× 20 m width, 100×100m or 250×250 m plot and circumference at 30 cm above ground.)(a)North-East Corner (50× 20 m width or 0.1 ha plot or 100×100m, or 250×250 m ) : Nil1 Number of rosettes in the plot % Cover=2 Rosettes circumference (m) + + + + + + + Avg.=3 Number of culms in rosettes + + + + + + + Avg.=S.NoSpecies /RosettesGirthclassNo. of culmsin rosettes1 2 3Girth ofCulms (cm)1 2 3Height (m)Fresh(gm)WeightDry Weight(gm)1 2 31 2 31 Thick + + + + + + + + + +Medium + + + + + + + + + +Thin + + + + + + + + + +2 Thick + + + + + + + + + +Medium + + + + + + + + + +Thin + + + + + + + + + +(b) South-West Corner (50× 20 m width or 0.1 ha plot or 100×100m or 250×250 m) : Nil1 Number of rosettes in the plot % Cover=2 Rosettes circumference (m) + + + + + + + Avg.=3 Number of culms in rosettes + + + + + + + Avg.=S.NoSpecies /RosettesGirthclassNo. of culmsin rosettes1 2 3Girth ofCulms (cm)1 2 3Height (m)Fresh(gm)WeightDry Weight(gm)1 2 31 2 31 Thick + + + + + + + + + +Medium + + + + + + + + + +Thin + + + + + + + + + +2 Thick + + + + + + + + + +Medium + + + + + + + + + +Thin + + + + + + + + + +(a) Herb 1 (1×1 m) (recorded epiphytes/lithophytes/climbers etc. also) Took fresh weight in allplots and if the cover is similar then selected only one sample from a plot for drying and weighing.In 1×1 m: Fresh weight: 0.067 gm Dry Weight: 0.030gm % Cover: 65S.No. SpeciesNo. of individuals1 Naregamia alata 52 Desmodium triflorum 153 Mollugo pentaphylla 204 Mimosa pudica 45 Tragia involucrata 26 Desmodium motorium 37 Elephantopus scaber 240
(b) Herb 2 (1×1 m) (recorded epiphytes/lithophytes/climbers etc. also)In 1×1 m: Fresh weight: 0.053 gm Dry Weight: 0.024 gm % Cover: 58S.No. SpeciesNo. of individuals1 Elephantopus scaber 82 Leucas aspera 83 Cynodon dactylon 84 Senna tora 45 Hemidesmus indicus var. indicus 36 Mimosa pudica 27 Ageratum conyzoides 3(c) Herb 3 (1×1 m) (recorded epiphytes/lithophytes/climbers etc. also)In 1×1 m: Fresh weight: 0.039 gm Dry Weight: 0.017gm % Cover: 51S.No. SpeciesNo. of individuals1 Elephantopus scaber 62 Senna tora 53 Mimosa pudica 84 Ageratum conyzoides 25 Leucas aspera 26 Naregamia alata 17 Mollugo pentaphylla 4Litter in four plots of 1×1 m laid randomly – leaves + twigs+ branches+ fruits+ etc.Plots Twigs+ Branches + Leaves(gm) Humus (gm) TotalFresh Dry Fresh Dry Fresh Dry(a) NE 0.075 0.055 0.009 0.007 0.084 0.062(b) NW 0.079 0.058 0.008 0.006 0.087 0.064(c) SW 0.069 0.050 0.007 0.005 0.076 0.055(d) SE 0.073 0.053 0.007 0.005 0.080 0.058(e) Center41
Plot No.5.Form 2AFORMAT FOR TREES OUT-SIDE FOREST (TOF)CATEGORY 1: SITE AND OBSERVERState: <strong>Kerala</strong> District: Kozhikode GPS Point Name: ChemancheriLocation/Road/Canal/Village: Railway track side (Chemancheri)Site Centre Coordinates : Lati. 11º 24' 20.48" Longi. 75º 43' 10.06"Sample Site/Plot No.: T- 05 Date: 14/10/2009 Time: 3.20 PMG.P.S. Reading (HHDD:MM:SS and WGS 84): Lati 11º 24' 20.48" Longi. 75º 43' 10.06"Observer: Deepu Divakaran Altitude: Site/Plot: 28 mMarking on image: (Google/1:25,000 or larger)(Tonal characteristics)Slope (°): 0.1° Photograph Number: 4264 to 4267Aspect : N /E/S/W/NE/SE/SW/NW Topography General Observations): PlaneCATEGORY 2: FOREST AND SOIL- GENERAL:TOF type: Linear Railway track side Visual evidence of disturbance lopping/ fire/ cutting/grazing etc: NilTop Canopy species: Samanea saman, Terminalia catappaGround Cover (%): 85% Stoniness (%): 10% Rock Put-crop (%): 0%Soil Type: Sandy Soil Texture : Moderate Soil colour: Reddish brownLitter thickness: 1cm Humus Colour: Gray Humus thickness: 0.2 cmDepth (m)Bulk Density(kg/m 3 )Organic carbon(%)<strong>Carbon</strong> mass(kg/m 2 )0.00-0.15 1300 2.47650.15-0.30 1370 0.94530.30-0.60 1420 2.38560.60-1.00 1350 2.16007.9674CATEGOREY 3: QUANTITATIVE MEASUREMENTSCrown Density (%) (sky hit numbers and steps): NE-SW: Steps: Hits: (Sky/Canopy)NW-SE: Steps: Hits: (Sky/Canopy)Stand Height (m) (Average from 3-4 trees of top and 1 st canopy): Top: 18+19+18 = 18.33 mAt the base of ultimate branching1 st : 8+7 + 8 = 7.66 mVery Important Guidelines(a) Plot Size for Linear Plantation: Roads (NH, SH, Lane, etc.), Canals (Major – one side, Minor –both sides, etc.), Bunds (e.g. shelter belts) in agriculture fields, Rail, etc. = 50 m × 20 m width(b) Plot Size for Scattered Trees in Agriculture, Settlements, etc. areas: For very dense andmedium density trees take 2 plots of 100×100m within 250×250 m on opposite corners and for open/scattered trees take one plot of 250×250 m)42
(c) Plot Size for Block Plantation: four plots of 0.1 ha (please do clustered sampling)Plot Size: Linear = 50 m × 20 m (width at outer margins touching agri. field); Scattered- dense treese.g. cities (Chandigarh, N. Delhi, Bangalore, Mt. Abu,) two of 100×100m in opposite corners within250×250 m and very sparse in agriculture areas: one of 250×250 m or block plantation take four of31.62×31.62 m.Width of tar on road / water channel in canal / railway track width = 1.8 m (tar/rail) Width withpavement of road/side of rail track = mPlot Size: 50 × 20 mL= Leaves, NL= No leavesS.no.Species Cbh (≥ 10cm)Height(m) at 1 stforkingHeight (m)ultimateforkingPhenology(L/NL)CutYes/No1 Samanea saman 105.5 4 18 L No2 Terminalia catappa 85.4 - 19 L No3 Samanea saman 120.2 4 18 L No4 Samanea saman 135.6 5.5 19 L No5 Artocarpus heterophyllus 47.8 5.5 13 L No6 Psidium guajava 36.7 2.25 8 L No7 Psidium guajava 37.4 1.4 7 L No8 Psidium guajava 28.1 1.45 8 L No9 Tamarindus indica 35.5 2 7 L No10 Tamarindus indica 33.3 1.5 8 L No11 Tamarindus indica 34.2 1.75 8 L No12 Tamarindus indica 30.1 2 8 L No13 Tamarindus indica 32.6 1.5 8 L No14 Tamarindus indica 28.7 2 7 L No15 Albizia odoratissima 75.9 3 14 L No16 Mangifera indica 30.1 2 4 L No17 Mangifera indica 25.3 2 4.5 L No18 Mangifera indica 27.2 1.5 4 L No19 Albizia odoratissima 55.1 3.5 15 L No20 Albizia odoratissima 75.1 3.5 17 L No21 Albizia odoratissima 60.2 4 16 L No22 Albizia odoratissima 63.4 7 15 L No23 Samanea saman 85.5 8 18 L No24 Albizia odoratissima 70.6 2.5 15 L No25 Delonix regia 71.8 2.5 14 L No26 Delonix regia 72.9 2.5 14 L No27 Psidium guajava 29.1 1.5 11 L No28 Albizia odoratissima 55.7 2 11 L No29 Albizia odoratissima 48.4 3 9 L No30 Albizia odoratissima 60.2 1.5 11 L No43
Shrubs in 5×5m in a plot of 50×20 width m, in 0.1 ha in 100×100 m plot and 250×250 m (girth at 30 cm above base): (Please bring representative stem of allshrub species either entire or approximately 20 cm long from base, middle and upper, observe 4-5 bushes of each species for better averaging and estimations)(a) North-East Corner (5×5m/0.1 ha plot).Species/bushChromolaena odorataHibiscus hispidissimusChassalia curviflora var.ophioxyloidesUrena lobata ssp. lobataZiziphus oenopliaNo. of bushesand % cover0.1 ha 5 x 5mNo. of tillers in 3bushes of eachspecies Girth/Diam.(cm) Height (m) Fresh Wt.(gm) Dry Wt.(gm)BushNo. 1 2 3 1 2 3 1 2 3 1 2 3 1 2 321 6 Thick 1 0.9 2.33 0.068 0.021Medium 1 0.6 1.45 0.037 0.0120.50% 1% Thin 1 0.3 0.29 0.004 0.00118 4 Thick 1 2.5 1.60 0.068 0.022Medium 1 2.3 1.35 0.038 0.0170.05% 0.1% Thin 1 1.3 0.80 0.011 0.00512 3 Thick 1 2.8 1.15 0.095 0.027Medium 1 2.1 0.95 0.083 0.0230.03% 0.08% Thin 1 1.9 0.85 0.051 0.01328 6 Thick 1 1.1 0.55 0.010 0.003Medium 1 1.0 0.55 0.009 0.0020.08% 0.1% Thin 1 0.7 0.51 0.004 0.00110 6 Thick 1 2.1 0.70 0.068 0.027Medium 1 1.9 0.60 0.032 0.0130.001% 0.003% Thin 1 1.3 0.35 0.010 0.00444
(c)South-west Corner (5×5/0.1 ha plot) Plot Size: ………………….No. of tillers in 3Species/bushNo. of bushesand % coverbushes of eachspeciesGirth/Diam.(cm) Height (m) Fresh Wt.(gm) Dry Wt.(gm)BushChassalia curviflora var.ophioxyloidesZiziphus oenopliaSida acuta0.1 ha 5 x 5mNo. 1 2 3 1 2 3 1 2 3 1 2 3 1 2 31.20.090.0259912 4 Thick 1 2.9Medium 1 2.20.03% 0.08% Thin 1 1.810 4 Thick 1 1.1Medium 1 0.90.001% 0.003% Thin 1 0.718 2 Thick 1 0.9Medium 1 0.40.02% 0.01% Thin1.000.701.000.700.360.800.510.0720.0200.0850.0410.0110.0480.0050.0210.0070.0240.0120.0030.0120.00145
Bamboo (50× 20 m width, 100×100m or 250×250 m plot and circumference at 30 cm above ground.)(A)North-East Corner (50× 20 m width or 0.1 ha plot or 100×100m, or 250×250 m ) : Nil1 Number of rosettes in the plot % Cover=2 Rosettes circumference (m) + + + + + + + Avg.=3 Number of culms in rosettes + + + + + + + Avg.=S.NoSpecies /RosettesGirthclassNo. of culmsin rosettes1 2 3Girth ofCulms (cm)1 2 3Height (m)Fresh(gm)WeightDry Weight(gm)1 2 31 2 31 Thick + + + + + + + + + +Medium + + + + + + + + + +Thin + + + + + + + + + +2 Thick + + + + + + + + + +Medium + + + + + + + + + +Thin + + + + + + + + + +(b) South-West Corner (50× 20 m width or 0.1 ha plot or 100×100m or 250×250 m) : Nil1 Number of rosettes in the plot % Cover=2 Rosettes circumference (m) + + + + + + + Avg.=3 Number of culms in rosettes + + + + + + + Avg.=S.NoSpecies /RosettesGirthclassNo. of culmsin rosettes1 2 3Girth ofCulms (cm)1 2 3Height (m)Fresh(gm)WeightDry Weight(gm)1 2 31 2 31 Thick + + + + + + + + + +Medium + + + + + + + + + +Thin + + + + + + + + + +2 Thick + + + + + + + + + +Medium + + + + + + + + + +Thin + + + + + + + + + +(a) Herb 1 (1×1 m) (recorded epiphytes/lithophytes/climbers etc. also) Took fresh weight in allplots and if the cover is similar then selected only one sample from a plot for drying and weighing.In 1×1 m: Fresh weight: 0.087 gm Dry Weight: 0.038 gm % Cover: 76 %S.No. SpeciesNo. of individuals1 Ruellia tuberosa 52 Phyllanthus amarus 23 Justicia japonica 64 Mukia maderaspatana 25 Vernonia cinerea 26 Tridax procumbens 37 Commelina benghalensis 128 Mitracarpus hirtus 846
(b) Herb 2 (1×1 m) (recorded epiphytes/lithophytes/climbers etc. also)In 1×1 m: Fresh weight: 0.073 gm Dry Weight: 0.032 gm % Cover: 70 %S.No. SpeciesNo. of individuals1 Elephantopus scaber 32 Leucas aspera 33 Tridax procumbens 84 Senna tora 45 Mitracarpus hirtus 136 Mimosa pudica 27 Ageratum conyzoides 3(c) Herb 3 (1×1 m) (recorded epiphytes/lithophytes/climbers etc. also)In 1×1 m: Fresh weight: 0.069 gm Dry Weight: 0.030 gm % Cover: 68 %S.No. SpeciesNo. of individuals1 Elephantopus scaber 62 Senna tora 33 Mimosa pudica 84 Ageratum conyzoides 25 Leucas aspera 26 Mitracarpus hirtus 117 Vernonia cinerea 3Litter in four plots of 1×1 m laid randomly – leaves + twigs+ branches+ fruits+ etc.Plots Twigs+ Branches + Leaves(gm) Humus (gm) TotalFresh Dry Fresh Dry Fresh Dry(a) NE 0.153 0.111 0.042 0.033 0.195 0.144(b) NW 0.147 0.108 0.037 0.029 0.184 0.137(c) SW 0.138 0.101 0.032 0.025 0.170 0.126(d) SE 0.129 0.093 0.030 0.023 0.159 0.116(e) Center47
Plot No.6Form 2 AVCP – IGBPFORMAT FOR TREES OUT-SIDE FOREST (TOF)CATEGORY 1: SITE AND OBSERVERState: <strong>Kerala</strong> District: Kozhikode GPS Point Name: Kottapally-VeliyarmuthuLocation/Road/Canal/Village: Canal bundSite Centre Coordinates : Lati. 11º 35' 50.10" Longi. 75º 39' 51.34"Sample Site/Plot No.: T- 06 Date: 15/10/2009 Time: 9.30 AMG.P.S. Reading (HHDD: MM:SS and WGS 84): Lati 11º 35' 50.10" Longi. 75º 39' 51.34"Observer: Deepu Divakaran Altitude: Site/Plot: 110 mMarking on image: (Google/1:25,000 or larger)(Tonal characteristics)Slope (°): 0.2° Photograph Number: 4273 to 4276Aspect : N/E/S/W/NE/SE/SW /NW Topography General observations): Paddy fieldCATEGORY 2: FOREST AND SOIL- GENERAL:TOF type: Linear Canal bund medium Visual evidence of disturbance lopping/ fire/ cutting/grazing etc: NilTop Canopy species: Racosperma auriculiforme, Paraserianthes falcatariaGround Cover (%): 55% Stoniness (%): 2% Rock Put-crop(%): 0%Soil Type: Lateritic Soil Texture : Moderate Soil colour: Reddish BrownLitter thickness: 0.5 cm Humus Colour: Pale brown Humus thickness: 0.1 cmDepth (m)Bulk Density(kg/m 3 )Organic carbon(%)<strong>Carbon</strong> mass(kg/m 2 )0.00-0.15 1360 3.22320.15-0.30 1380 2.48400.30-0.60 1400 1.84800.60-1.00 1380 0.66248.2176CATEGOREY 3: QUANTITATIVE MEASUREMENTSCrown Density (%) (sky hit numbers and steps): NE-SW: Steps: Hits: (Sky/Canopy)NW-SE: Steps: Hits: (Sky/Canopy)Stand Height (m) (Average from 3-4 trees of top and 1 st canopy): Top: 10+9+7 = 8.67 mAt the base of ultimate branching1 st : 6.5+6.5 + 6 = 6.33 mVery Important Guidelines(a) Plot Size for Linear Plantation: Roads (NH, SH, Lane, etc.), Canals (Major – one side, Minor –both sides, etc.), Bunds (e.g. shelter belts) in agriculture fields, Rail, etc. = 50 m × ……. m width48
(b) Plot Size for Scattered Trees in Agriculture, Settlements, etc. areas: For very dense andmedium density trees take 2 plots of 100×100m within 250×250 m on opposite corners and for open/scattered trees take one plot of 250×250 m)(c) Plot Size for Block Plantation: four plots of 0.1 ha (please do clustered sampling)Plot Size: Linear = 50 m × 34 m (width at outer margins touching agri. field); Scattered- dense treese.g. cities (Chandigarh, N. Delhi, Bangalore, Mt. Abu,) two of 100×100m in opposite corners within250×250 m and very sparse in agriculture areas: one of 250×250 m or block plantation take four of31.62×31.62 m.Width of tar on road / water channel in canal / railway track width = 14 m (tar/rail)Width with pavement of road/side of rail track = mPlot Size: 50 × 34 m L= Leaves, NL= No leavesS.no.Species Cbh (≥ 10cm)Height(m) at 1 stforkingHeight (m)ultimateforkingPhenology(L/NL)CutYes/No1 Racosperma auriculiforme 52.3 2 5 L No2 Racosperma auriculiforme 46.5 1.5 6.5 L No3 Racosperma auriculiforme 29.4 2 4 L No4 Racosperma auriculiforme 43.7 3 5.5 L No5 Macaranga peltata 59.9 5 7 L No6 Racosperma auriculiforme 70.6 2 10 L No7 Racosperma auriculiforme 70.3 2 9 L No8 Paraserianthes falcataria 36.1 2 6.5 L No9 Paraserianthes falcataria 22.5 1.75 3.5 L No10 Paraserianthes falcataria 37.3 1.95 4 L No11 Paraserianthes falcataria 13.4 - 2 L Yes12 Paraserianthes falcataria 43.7 1.45 6.5 L No13 Paraserianthes falcataria 39.2 2 6 L No14 Paraserianthes falcataria 38.9 1.95 6 L No15 Paraserianthes falcataria 21.1 2.5 2.75 L No16 Paraserianthes falcataria 31.5 2.25 5.5 L No49
Shrubs in 5×5m in a plot of 50×20 width m, in 0.1 ha in 100×100 m plot and 250×250 m (girth at 30 cm above base): (Please bring representative stem of allshrub species either entire or approximately 20 cm long from base, middle and upper, observe 4-5 bushes of each species for better averaging and estimations)(a) North-East Corner (5×5m/0.1 ha plot).No. of tillers in 3Species/bushNo. of bushes bushes of each Girth/Diam.(cmand % coverspecies) Height (m) Fresh Wt.(gm) Dry Wt.(gm)0.1 ha 5 x 5m Bush No. 1 2 3 1 2 3 1 2 3 1 2 3 1 2 38 4 Thick 1 0.9 2.33 0.068 0.021Chromolaena odorata1.4Medium 1 0.65 0.037 0.0120.01% 0.1% Thin 1 0.3 0.29 0.004 0.0011 1 Thick 1 2.5 1.60 0.068 0.022Passiflora foetida var.Mediumfoetida0.001% 0.0% Thin2 1 Thick 1 1.1 0.55 0.010 0.003Ixora finlaysonianaMedium0.001% 0.1% Thin5 1 Thick 1 2.1 0.70 0.068 0.027Ziziphus oenopliaMedium0.0010.0006% % Thin50
(c)South-west Corner (5×5/0.1 ha plot).Species/bushClerodendruminfortunatumZiziphus oenopliaIxora finlaysonianaChromolaena odorataSolanum torvumTinospora cordifoliaNo. of tillers in 3No. of bushesand % coverbushes of eachspecies Girth/Diam.(cm) Height (m) Fresh Wt.(gm) Dry Wt.(gm)0.1 ha 5 x 5m Bush No. 1 2 3 1 2 3 1 2 3 1 2 3 1 2 312 4 Thick 1 2.9 1.25 0.099 0.029Medium 1 2.2 1.00 0.085 0.0240.03% 0.08% Thin 1 1.8 0.80 0.048 0.0125 2 Thick 1 1.1 1.00 0.072 0.021Medium 1 0.9 0.70 0.041 0.0120.0006% 0.002% Thin2 1 Thick 1 0.9 0.70 0.020 0.007Medium0.001% 0.1% Thin8 3 Thick 1 0.9 2.30 0.067 0.021Medium 1 0.5 1.44 0.035 0.0100.01% 0.09% Thin 1 0.2 0.26 0.003 0.00094 2 Thick 1 1.1 0.55 0.010 0.003Medium 1 1.0 0.55 0.009 0.0020.02% 0.1% Thin2 1 Thick 1 0.9 0.28 0.004 0.001Medium0.001% 0.01% Thin51
Bamboo (50× 20 m width, 100×100m or 250×250 m plot and circumference at 30 cm above ground.)(a)North-East Corner (50× 20 m width or 0.1 ha plot or 100×100m, or 250×250 m ) : Nil1 Number of rosettes in the plot % Cover=2 Rosettes circumference (m) + + + + + + + Avg.=3 Number of culms in rosettes + + + + + + + Avg.=S.NoSpecies /RosettesGirthclassNo. of culmsin rosettes1 2 3Girth ofCulms (cm)1 2 3Height (m)Fresh(gm)WeightDry Weight(gm)1 2 31 2 31 Thick + + + + + + + + + +Medium + + + + + + + + + +Thin + + + + + + + + + +2 Thick + + + + + + + + + +Medium + + + + + + + + + +Thin + + + + + + + + + +(b) South-West Corner (50× 20 m width or 0.1 ha plot or 100×100m or 250×250 m) : Nil1 Number of rosettes in the plot % Cover=2 Rosettes circumference (m) + + + + + + + Avg.=3 Number of culms in rosettes + + + + + + + Avg.=S.NoSpecies /RosettesGirthclassNo. of culmsin rosettes1 2 3Girth ofCulms (cm)1 2 352Height (m)Fresh(gm)WeightDry Weight(gm)1 2 31 2 31 Thick + + + + + + + + + +Medium + + + + + + + + + +Thin + + + + + + + + + +2 Thick + + + + + + + + + +Medium + + + + + + + + + +Thin + + + + + + + + + +(a) Herb 1 (1×1 m) (recorded epiphytes/lithophytes/climbers etc. also) Took fresh weight in allplots and if the cover is similar then selected only one sample from a plot for drying and weighing.In 1×1 m: Fresh weight: 0.159 gm Dry Weight: 0.070 gm % Cover: 79 %S.No. SpeciesNo. of individuals1 Centella asiatica 152 Phyllanthus amarus 23 Justicia japonica 154 Elephantopus scaber 45 Emilia sonchifolia 16 Mimosa pudica 27 Desmodium triflorum 208 Mitracarpus hirtus 49 Alloteropsis cimicina 30
(b) Herb 2 (1×1 m) (recorded epiphytes/lithophytes/climbers etc. also)In 1×1 m: Fresh weight: 0.193 gm Dry Weight: 0.084 gm % Cover: 85 %S.No. SpeciesNo. of individuals1 Elephantopus scaber 82 Centella asiatica 63 Vernonia cinerea 34 Desmodium triflorum 505 Alloteropsis cimicina 606 Mitracarpus hirtus 27 Phyllanthus amarus 58 Cyperus rotundus ssp. rotundus 209 Amorphophallus commutatus 2(c) Herb 3 (1×1 m) (recorded epiphytes/lithophytes/climbers etc. also)In 1×1 m: Fresh weight: 0.139 gm Dry Weight: 0.060 gm % Cover: 73 %S.No. SpeciesNo. of individuals1 Elephantopus scaber 62 Desmodium triflorum 133 Mimosa pudica 84 Mitracarpus hirtus 85 Alloteropsis cimicina 226 Justicia japonica 117 Vernonia cinerea 3Litter in four plots of 1×1 m laid randomly – leaves + twigs+ branches+ fruits+ etc.Plots Twigs+ Branches + Leaves(gm) Humus (gm) TotalFresh Dry Fresh Dry Fresh Dry(a) NE 0.095 0.069 0.030 0.023 0.125 0.092(b) NW 0.098 0.072 0.028 0.022 0.126 0.094(c) SW 0.087 0.062 0.029 0.023 0.116 0.085(d) SE 0.091 0.066 0.031 0.024 0.122 0.090(e) Center53
Plot No.7 VCP – IGBP Form 2AFORMAT FOR TREES OUT-SIDE FOREST (TOF)CATEGORY 1: SITE AND OBSERVERState: <strong>Kerala</strong> District: Kozhikode GPS Point Name: Pathiyarakara (Bank road)Location/Road/Canal/Village: Linear - Minor canalSite Centre Coordinates : Lati. 11º 35' 8.88" Longi. 75º 37' 37.92"Sample Site/Plot No.: T- 07 Date: 15/10/2009 Time: 11.30 PMG.P.S. Reading (HHDD: MM:SS and WGS 84): Lati 11º 35' 8.88" Longi. 75º 37' 37.92"Observer: Deepu Divakaran Altitude: Site/Plot: 20 mMarking on image: (Google/1:25,000 or larger)(Tonal characteristics)Slope (°): 0.1° Photograph Number: 4281 to 4284Aspect : N/E/S/W/NE/ SE /SW/NW Topography General observations): Hilly areaCATEGORY 2: FOREST AND SOIL- GENERAL:TOF type: Linear - Minor canal Visual evidence of disturbance lopping/ fire/ cutting/grazing etc: NilTop Canopy species: Macaranga peltataGround Cover (%): 80% Stoniness (%): 0% Rock Put-crop(%): 0%Soil Type: Lataeritic Soil Texture : Medium Soil colour: Reddish YellowLitter thickness: 0.5cm Humus Colour: Pale brown Humus thickness: 0.1 cmDepth (M)Bulk Density(Kg/m 3 )Organic carbon(Kg)<strong>Carbon</strong> mass(Kg/m 2 )0.00-0.15 1300 1.95000.15-0.30 1370 1.80840.30-0.60 1400 3.61200.60-1.00 1430 4.576011.9464CATEGOREY 3: QUANTITATIVE MEASUREMENTSCrown Density (%) (sky hit numbers and steps): NE-SW: Steps: Hits: (Sky/Canopy)NW-SE: Steps: Hits: (Sky/Canopy)Stand Height (m) (Average from 3-4 trees of top and 1 st canopy): Top: 6+7+ = 6.5 mAt the base of ultimate branching 1 st : + + = mVery Important Guidelines(a) Plot Size for Linear Plantation: Roads (NH, SH, Lane, etc.), Canals (Major – one side, Minor –both sides, etc.), Bunds (e.g. shelter belts) in agriculture fields, Rail, etc. = 50 m × ……. m width(b) Plot Size for Scattered Trees in Agriculture, Settlements, etc. areas: For very dense andmedium density trees take 2 plots of 100×100m within 250×250 m on opposite corners and for open/scattered trees take one plot of 250×250 m)54
(c) Plot Size for Block Plantation: four plots of 0.1 ha (please do clustered sampling)Plot Size: Linear = 50 m × 8 m (width at outer margins touching agri. field); Scattered- dense treese.g. cities (Chandigarh, N. Delhi, Bangalore, Mt. Abu,) two of 100×100m in opposite corners within250×250 m and very sparse in agriculture areas: one of 250×250 m or block plantation take four of31.62×31.62 m.Width of tar on road / water channel in canal / railway track width = 2.5 m (tar/rail)Width with pavement of road/side of rail track = mPlot Size: 50 × 8 mL= Leaves, NL= No leavesS.no.Species Cbh (≥ 10cm)Height(m) at 1 stforkingHeight (m)ultimateforkingPhenology(L/NL)CutYes/No1 Macaranga peltata 45.2 3 6 L No2 Macaranga peltata 60.3 2.5 7 L No3 Cycas circinalis 55.1 - 0.5 L No55
Shrubs in 5×5m in a plot of 50×20 width m, in 0.1 ha in 100×100 m plot and 250×250 m (girth at 30 cm above base): (Please bring representative stem of allshrub species either entire or approximately 20 cm long from base, middle and upper, observe 4-5 bushes of each species for better averaging and estimations)Species/bushClerodendruminfortunatumOcimum americanumChromolaena odorataCyclea peltataSida cordifoliaUrena lobata ssp. lobataCissus latifoliaNo. of bushesand % coverNo. of tillers in 3 bushes ofeach species Girth/Diam.(cm) Height (m) Fresh Wt.(gm) Dry Wt.(gm)0.1 ha 5 x 5m Bush No. 1 2 3 1 2 3 1 2 3 1 2 3 1 2 38 4 Thick 1 1.2 1.35 0.143 0.045Medium 1 0.8 1.00 0.073 0.0230.02% 0.2% Thin 1 0.5 0.45 0.019 0.0065 3 Thick 1 0.9 1.15 0.125 0.029Medium 1 0.7 0.85 0.048 0.0110.01% 1% Thin 1 0.5 0.42 0.006 0.00126 3 Thick 1 1.0 1.20 0.072 0.021Medium 1 0.7 0.07 0.044 0.0130.08% 1.0% Thin 1 0.5 0.36 0.006 0.0013 1 Thick 1 0.8 0.61 0.005 0.001Medium0.001% 0.01% Thin8 2 Thick 1 0.8 0.64 0.014 0.005Medium 1 0.5 0.32 0.010 0.0030.01% 0.1% Thin10 2 Thick 1 1.1 0.55 0.010 0.003Medium 1 1.0 0.55 0.009 0.0020.01% 0.1% Thin 1 0.7 0.51 0.004 0.0012 1 Thick 1 2.6 1.35 0.115 0.046Medium0.001% 0.1% Thin56
(c)South-west Corner (5×5/0.1 ha plot).Species/bushClerodendruminfortunatumGlycosmispentaphyllaSida cordifoliaChromolaena odorataHibiscushispidissimusCissus latifoliaNo. of bushesand % coverNo. of tillers in 3bushes of each species Girth/Diam.(cm) Height (m) Fresh Wt.(gm) Dry Wt.(gm)5 x0.1 ha 5m Bush No. 1 2 3 1 2 3 1 2 3 1 2 3 1 2 38 1 Thick 1 0.7 0.51 0.005 0.001Medium0.02% 0.1% Thin91 4 Thick 1 1.0 1.25 0.139 0.048Medium 1 0.9 0.95 0.075 0.0264.5% 1% Thin 1 0.5 0.37 0.015 0.0058 2 Thick 1 0.8 0.68 0.018 0.006Medium 1 0.5 0.38 0.013 0.0040.01% 0.1% Thin26 3 Thick 1 1.1 1.29 0.080 0.024Medium 1 0.9 0.85 0.053 0.0160.08% 1.0% Thin 1 0.7 0.49 0.012 0.0044 1 Thick 2 3.2 2.40 0.049 0.016Medium0.03% 0.02% Thin2 1 Thick 2 2.5 0.65 0.046 0.015Medium0.001% 0.1% Thin57
Bamboo (50× 20 m width, 100×100m or 250×250 m plot and circumference at 30 cm above ground.)(A)North-East Corner (50× 20 m width or 0.1 ha plot or 100×100m, or 250×250 m ) : Nil1 Number of rosettes in the plot % Cover=2 Rosettes circumference (m) + + + + + + + Avg.=3 Number of culms in rosettes + + + + + + + Avg.=S.NoSpecies /RosettesGirthclassNo. of culmsin rosettes1 2 3Girth ofCulms (cm)1 2 358Height (m)Fresh(gm)WeightDry Weight(gm)1 2 31 2 31 Thick + + + + + + + + + +Medium + + + + + + + + + +Thin + + + + + + + + + +2 Thick + + + + + + + + + +Medium + + + + + + + + + +Thin + + + + + + + + + +(b) South-West Corner (50× 20 m width or 0.1 ha plot or 100×100m or 250×250 m) : Nil1 Number of rosettes in the plot % Cover=2 Rosettes circumference (m) + + + + + + + Avg.=3 Number of culms in rosettes + + + + + + + Avg.=S.NoSpecies /RosettesGirthclassNo. of culmsin rosettes1 2 3Girth ofCulms (cm)1 2 3Height (m)Fresh(gm)WeightDry Weight(gm)1 2 31 2 31 Thick + + + + + + + + + +Medium + + + + + + + + + +Thin + + + + + + + + + +2 Thick + + + + + + + + + +Medium + + + + + + + + + +Thin + + + + + + + + + +(a) Herb 1 (1×1 m) (recorded epiphytes/lithophytes/climbers etc. also) Took fresh weight in allplots and if the cover is similar then selected only one sample from a plot for drying and weighing.In 1×1 m: Fresh weight: 0.199 gm Dry Weight: 0.086 gm % Cover: 83 %S.No. SpeciesNo. of individuals1 Cardiospermum halicacabum 22 Eclipta prostrata var. prostrata 33 Justicia japonica 184 Scoparia dulcis 15 Mimosa pudica 126 Desmodium triflorum 767 Mitracarpus hirtus 68 Naregamia alata 19 Synedrella nodiflora 110 Amomum sp. 111 Elephantopus scaber 2012 Alloteropsis cimicina 15
(b) Herb 2 (1×1 m) (recorded epiphytes/lithophytes/climbers etc. also)In 1×1 m: Fresh weight: 0.123 gm Dry Weight: 0.052 gm % Cover: 72 %S.No. SpeciesNo. of individuals1 Elephantopus scaber 32 Commelina benghalensis 63 Ageratum conyzoides 34 Desmodium triflorum 125 Mitracarpus hirtus 26 Phyllanthus amarus 37 Caladium bicolor 18 Synedrella nodiflora 19 Mimosa pudica 410 Centella asiatica 6(c) Herb 3 (1×1 m) (recorded epiphytes/lithophytes/climbers etc. also)In 1×1 m: Fresh weight: 0.142 gm Dry Weight: 0.061 gm % Cover: 74 %S.No. SpeciesNo. of individuals1 Centella asiatica 82 Elephantopus scaber 63 Desmodium triflorum 134 Vernonia cinerea 35 Mimosa pudica 86 Mitracarpus hirtus 87 Justicia japonica 118 Alloteropsis cimicina 22Litter in four plots of 1×1 m laid randomly – leaves + twigs+ branches+ fruits+ etc.Plots Twigs+ Branches + Leaves(gm) Humus (gm) TotalFresh Dry Fresh Dry Fresh Dry(a) NE 0.089 0.065 0.025 0.020 0.114 0.085(b) NW 0.079 0.058 0.023 0.018 0.102 0.076(c) SW 0.081 0.060 0.019 0.015 0.100 0.075(d) SE 0.073 0.053 0.027 0.021 0.100 0.074(e) Center59
Plot No.8. VCP – IGBP Form 2AFORMAT FOR TREES OUT-SIDE FOREST (TOF)CATEGORY 1: SITE AND OBSERVERState: <strong>Kerala</strong> District: Kozhikode GPS Point Name: Canoli canalLocation/Road/Canal/Village: Canoli canalSite Centre Coordinates : Lati. 11º 15' 57.64" Longi. 75º 47' 40.42"Sample Site/Plot No.: T- 08 Date: 15/10/2009 Time: 4.15 PMG.P.S. Reading (HHDD:MM:SS and WGS 84): Lati 11º 15' 57.64" Longi. 75º 47' 40.42"Observer: Deepu Divakaran Altitude: Site/Plot: 15 mMarking on image: (Google/1:25,000 or larger)(Tonal characteristics)Slope (°): 0.1° Photograph Number: 4285 to 4288Aspect : N/E/S/W/NE/SE/ SW /NW Topography General observations): PlaneCATEGORY 2: FOREST AND SOIL- GENERAL:TOF type: Linear Major Canal Side Visual evidence of disturbance lopping/ fire/ cutting/grazing etc: NilTop Canopy species: Macaranga peltata, Samanea saman, Albizia odoratissimaGround Cover(%): 65% Stoniness(%): 0% Rock Put-crop(%): 0%Soil Type: Lateritic Soil Texture : Medium Soil colour: Reddish YellowLitter thickness: 1cm Humus Colour: Pale Brown Humus thickness: 0.1 cmDepth (m)Bulk Density(kg/m 3 )Organic carbon(%)<strong>Carbon</strong> mass(kg/m 2 )0.00-0.15 1230 2.25090.15-0.30 1300 1.65750.30-0.60 1340 3.05520.60-1.00 1320 3.379210.3428CATEGOREY 3: QUANTITATIVE MEASUREMENTSCrown Density (%) (sky hit numbers and steps): NE-SW: Steps: Hits: (Sky/Canopy)NW-SE: Steps: Hits: (Sky/Canopy)Stand Height (m) (Average from 3-4 trees of top and 1 st canopy): Top: 10+9+9 = 9.33 mAt the base of ultimate branching1 st : 4.5+3.5 + 4.5 = 4.16 mVery Important Guidelines(a) Plot Size for Linear Plantation: Roads (NH, SH, Lane, etc.), Canals (Major – one side, Minor –both sides, etc.), Bunds (e.g. shelter belts) in agriculture fields, Rail, etc. = 50 m × 20 m width60
(b) Plot Size for Scattered Trees in Agriculture, Settlements, etc. areas: For very dense andmedium density trees take 2 plots of 100×100m within 250×250 m on opposite corners and for open/scattered trees take one plot of 250×250 m)(c) Plot Size for Block Plantation: four plots of 0.1 ha (please do clustered sampling)Plot Size: Linear = 50 m × 6 m (width at outer margins touching agri. field); Scattered- dense treese.g. cities (Chandigarh, N. Delhi, Bangalore, Mt. Abu,) two of 100×100m in opposite corners within250×250 m and very sparse in agriculture areas: one of 250×250 m or block plantation take four of31.62×31.62 m.Width of tar on road / water channel in canal / railway track width = 25 m (tar/rail)Width with pavement of road/side of rail track = mPlot Size: 50 × 6 mL= Leaves, NL= No leavesS.no.Species Cbh (≥ 10cm)Height(m) at 1 stforkingHeight (m)ultimateforkingPhenology(L/NL)CutYes/No1 Macaranga peltata 35.2 - 5.5 L No2 Macaranga peltata 30.1 - 5 L No3 Macaranga peltata 33.3 - 5.5 L No4 Macaranga peltata 28.4 - 5 L No5 Ficus tsjahela 33.7 - 4.5 L No6 Ficus tsjahela 25.5 - 4.5 L No7 Macaranga peltata 38.4 2 4 L No8 Samanea saman 55.1 2 5.5 L No9 Samanea saman 130.2 1.5 10 L No10 Samanea saman 85.6 2.5 9 L No11 Albizia odoratissima 23.8 - 4.5 L No12 Albizia odoratissima 25.9 - 4.5 L No13 Albizia odoratissima 32.4 2.5 8.5 L No14 Macaranga peltata 35.5 3.5 8.5 L No15 Macaranga peltata 28.2 2.25 5 L No16 Macaranga peltata 23.8 2.5 3.5 L No17 Macaranga peltata 37.9 4.5 9 L No18 Macaranga peltata 27.0 - 4 L No19 Macaranga peltata 31.3 4.5 7 L No20 Macaranga peltata 33.6 3 4.5 L No21 Lannea coromandelica 36.7 1.5 3 L No22 Lannea coromandelica 30.4 - 2.5 L No23 Lannea coromandelica 28.2 - 2.5 L No24 Paraserianthes falcataria 75.1 2 9 L No25 Macaranga peltata 32.1 - 5 L No26 Macaranga peltata 33.4 - 5.4 L No27 Macaranga peltata 28.2 - 4.5 L No28 Macaranga peltata 24.3 - 3 L No29 Macaranga peltata 31.3 - 4 L No61
Shrubs in 5×5m in a plot of 50× 20 width m, in 0.1 ha in 100×100 m plot and 250×250 m (girth at 30 cm above base): (Please bring representative stem of allshrub species either entire or approximately 20 cm long from base, middle and upper, observe 4-5 bushes of each species for better averaging and estimations)(a) North-East Corner (5×5m/0.1 ha plot).Species/bushDerris scandensChromolaena odorataStachytarphetajamaicensisCentrosema mollePassiflora foetida var.foetidaNo. of tillers in 3No. of bushesand % coverbushes of eachspecies Girth/Diam.(cm) Height (m) Fresh Wt.(gm) Dry Wt.(gm)0.1 ha 5 x 5m Bush No. 1 2 3 1 2 3 1 2 3 1 2 3 1 2 34 1 Thick 1 0.9 1.17 0.134 0.047Medium0.001% 0.1% Thin26 4 Thick 1 0.9 2.30 0.067 0.021Medium 1 0.5 1.44 0.035 0.0102% 1% Thin 1 0.2 0.26 0.003 0.000918 2 Thick 1 1.8 1.65 0.189 0.055Medium 1 0.7 0.75 0.023 0.0040.5% 0.1% Thin4 1 Thick 1 0.6 0.32 0.006 0.003Medium0.05% 0.1% Thin6 1 Thick 1 0.4 0.23 0.004 0.001Medium0.05% 0.1% Thin62
(c) South-west Corner (5×5/0.1 ha plot).Species/bushTriumfetta rhomboideaAchyranthes asperavar. asperaZiziphus oenopliaUrena lobata ssp.lobataNo. of tillers in 3No. of bushesand % coverbushes of eachspecies Girth/Diam.(cm) Height (m) Fresh Wt.(gm) Dry Wt.(gm)0.1 ha 5 x 5m Bush No. 1 2 3 1 2 3 1 2 3 1 2 3 1 2 314 3 Thick 1 1.0 1.25 0.141 0.044Medium 1 0.9 1.12 0.079 0.0250.5% 2% Thin 1 0.5 0.45 0.021 0.00723 6 Thick 1 0.8 1.05 0.121 0.029Medium 1 0.6 0.75 0.043 0.0102.00% 2% Thin 1 0.4 0.32 0.005 0.00108 1 Thick 1 0.7 0.51 0.004 0.001Medium0.001% 0.01% Thin18 1 Thick 1 0.5 0.38 0.010 0.003Medium0.04% 0.01% Thin63
Bamboo (50× 20 m width, 100×100m or 250×250 m plot and circumference at 30 cm above ground.)(a)North-East Corner (50× 20 m width or 0.1 ha plot or 100×100m, or 250×250 m ) : Nil1 Number of rosettes in the plot % Cover=2 Rosettes circumference (m) + + + + + + + Avg.=3 Number of culms in rosettes + + + + + + + Avg.=S.NoSpecies /RosettesGirthclassNo. of culmsin rosettes1 2 3Girth ofCulms (cm)1 2 3Height (m)Fresh(gm)WeightDry Weight(gm)1 2 31 2 31 Thick + + + + + + + + + +Medium + + + + + + + + + +Thin + + + + + + + + + +2 Thick + + + + + + + + + +Medium + + + + + + + + + +Thin + + + + + + + + + +(b) South-West Corner (50× … m width or 0.1 ha plot or 100×100m or 250×250 m) : Nil1 Number of rosettes in the plot % Cover=2 Rosettes circumference (m) + + + + + + + Avg.=3 Number of culms in rosettes + + + + + + + Avg.=S.NoSpecies /RosettesGirthclassNo. of culmsin rosettes1 2 3Girth ofCulms (cm)1 2 3Height (m)Fresh(gm)WeightDry Weight(gm)1 2 31 2 31 Thick + + + + + + + + + +Medium + + + + + + + + + +Thin + + + + + + + + + +2 Thick + + + + + + + + + +Medium + + + + + + + + + +Thin + + + + + + + + + +((A) Herb 1 (1×1 m) (recorded epiphytes/lithophytes/climbers etc. also) Took fresh weight in allplots and if the cover is similar then selected only one sample from a plot for drying and weighing.In 1×1 m: Fresh weight: 0.154 gm Dry Weight: 0.066 gm % Cover: 71 %S.No. SpeciesNo. of individuals1 Mimosa pudica 82 Scoparia dulcis 43 Pennisetum polystachyon 184 Commelina benghalensis 145 Desmodium triflorum 126 Amomum sp. 47 Alternanthera bettzickiana 2464
(b) Herb 2 (1×1 m) (recorded epiphytes/lithophytes/climbers etc. also)In 1×1 m: Fresh weight: 0.102 gm Dry Weight: 0.044 gm % Cover: 63 %S.No. SpeciesNo. of individuals1 Synedrella nodiflora 32 Commelina benghalensis 163 Ageratum conyzoides 24 Desmodium triflorum 85 Mitracarpus hirtus 26 Phyllanthus amarus 37 Elephantopus scaber 38 Mimosa pudica 4(c) Herb 3 (1×1 m) (recorded epiphytes/lithophytes/climbers etc. also)In 1×1 m: Fresh weight: 0.091 gm Dry Weight: 0.039 gm % Cover: 58 %S.No. SpeciesNo. of individuals1 Axonopus compressus 182 Elephantopus scaber 23 Mimosa pudica 104 Vernonia cinerea 35 Alloteropsis cimicina 176 Mitracarpus hirtus 27 Justicia japonica 3Litter in four plots of 1×1 m laid randomly – leaves + twigs+ branches+ fruits+ etc.Plots Twigs+ Branches + Leaves(gm) Humus (gm) TotalFresh Dry Fresh Dry Fresh Dry(a) NE 0.082 0.061 0.022 0.017 0.104 0.078(b) NW 0.076 0.055 0.029 0.023 0.105 0.078(c) SW 0.069 0.051 0.021 0.017 0.09 0.068(d) SE 0.065 0.047 0.018 0.014 0.083 0.061(e) Center65
Plot No.9.VCP – IGBPFORMAT FOR TREES OUT-SIDE FOREST (TOF)Form 2ACATEGORY 1: SITE AND OBSERVERState: <strong>Kerala</strong> District: Malappuram GPS Point Name: CherukaraLocation/Road/Canal/Village: Cherukara (Pattambi – Perumthalmanna)Site Centre Coordinates : Lati. 10º 55' 29.50" Longi. 76º 13' 16.90"Sample Site/Plot No.: T- 09 Date: 14/10/2009 Time: 3.20 PMG.P.S. Reading (HHDD: MM:SS and WGS 84): Lati 10º 55' 29.50" Longi. 76º 13' 16.90"Observer: Deepu Divakaran Altitude: Site/Plot: 40 mMarking on image: (Google/1:25,000 or larger)(Tonal characteristics)Slope (°): 0.5° Photograph Number: 4301 to 4304Aspect : N/E/S/W/NE/SE/SW /NW Topography General observations): HillyCATEGORY 2: FOREST AND SOIL- GENERAL:TOF type: Linear Road (SH) side Visual evidence of disturbance lopping/ fire/ cutting/grazing etc: NilTop Canopy species: Swietenia macrophylla, Terminalia catappaGround Cover (%): 73% Stoniness (%): 0% Rock Put-crop(%): 0%Soil Type: Lateritic Soil Texture : Medium Soil colour: Yellowish RedLitter thickness: 0.5cm Humus Colour: Pale brown Humus thickness: 0.1 cmDepth (m)Bulk Density(kg/m 3 )Organic carbon(%)<strong>Carbon</strong> mass(kg/m 2 )0.00-0.15 1240 2.65980.15-0.30 1270 2.38130.30-0.60 1320 3.84120.60-1.00 1300 2.236011.1183CATEGOREY 3: QUANTITATIVE MEASUREMENTSCrown Density (%) ( sky hit numbers and steps): NE-SW: Steps: Hits: (Sky/Canopy)NW-SE: Steps: Hits: (Sky/Canopy)Stand Height (m) (Average from 3-4 trees of top and 1 st canopy): Top: 18+17+15 = 16.66 mAt the base of ultimate branching 1 st : + + = m66
Very Important Guidelines(a) Plot Size for Linear Plantation: Roads (NH, SH, Lane, etc.), Canals (Major – one side, Minor –both sides, etc.), Bunds (e.g. shelter belts) in agriculture fields, Rail, etc. = 50 m × ……. m width(b) Plot Size for Scattered Trees in Agriculture, Settlements, etc. areas: For very dense andmedium density trees take 2 plots of 100×100m within 250×250 m on opposite corners and for open/scattered trees take one plot of 250×250 m)(c) Plot Size for Block Plantation: four plots of 0.1 ha (please do clustered sampling)Plot Size: Linear = 50 m × 24 m (width at outer margins touching agri. field); Scattered- dense treese.g. cities (Chandigarh, N. Delhi, Bangalore, Mt. Abu,) two of 100×100m in opposite corners within250×250 m and very sparse in agriculture areas: one of 250×250 m or block plantation take four of31.62×31.62 m.Width of tar on road / water channel in canal / railway track width = 8 m (tar/rail)Width with pavement of road/side of rail track = 12 mPlot Size: 50 × 24 m L= Leaves, NL= No leavesS.no.Species Cbh (≥ 10cm)Height(m) at 1 stforkingHeight (m)ultimateforkingPhenology(L/NL)CutYes/No1 Swietenia macrophylla 190.2 5 18 L No2 Swietenia macrophylla 144.4 6 17 L No3 Terminalia catappa 144.1 - 15 L No67
Shrubs in 5×5m in a plot of 50×20 width m, in 0.1 ha in 100×100 m plot and 250×250 m (girth at 30 cm above base): (Please bring representative stem of allshrub species either entire or approximately 20 cm long from base, middle and upper, observe 4-5 bushes of each species for better averaging and estimations)(a) North-East Corner (5×5m/0.1 ha plot).No. of tillers in 3No. of bushes bushes of eachSpecies/bushand % coverspecies Girth/Diam.(cm) Height (m) Fresh Wt.(gm) Dry Wt.(gm)0.1 ha 5 x 5m Bush No. 1 2 3 1 2 3 1 2 3 1 2 3 1 2 32 1 Thick 1 1.2 1.35 0.143 0.045CalycopterisMediumfloribunda0.001% 1.0% Thin39 3 Thick 1 1.0 1.20 0.072 0.021Chromolaena odorataMedium 1 0.7 0.07 0.044 0.0133% 1.0% Thin 1 0.5 0.36 0.006 0.001Urena lobata ssp.lobataSida cordifolia8 1 Thick 1 0.8 0.61 0.005 0.001Medium0.001% 0.50% Thin28 2 Thick 1 0.8 0.64 0.014 0.005Medium 1 0.5 0.32 0.010 0.0030.50% 0.4% Thin68
(c)South-west Corner (5×5/0.1 ha plot).Species/bushTiliacora acuminataLantana camara var.camaraOcimum gratissimumSida acutaChromolaena odorataCanthium travancoricumNo. of tillers in 3No. of bushesand % coverbushes of eachspecies Girth/Diam.(cm) Height (m) Fresh Wt.(gm) Dry Wt.(gm)0.1 ha 5 x 5m Bush No. 1 2 3 1 2 3 1 2 3 1 2 3 1 2 38 1 Thick 1 0.7 0.51 0.005 0.001Medium1.000% 0.50% Thin23 3 Thick 1 1.0 0.81 0.015 0.004Medium 1 0.6 0.74 0.008 0.0022% 1.5% Thin 1 0.3 0.49 0.005 0.00121 4 Thick 1 1.0 1.25 0.139 0.048Medium 1 0.9 0.95 0.075 0.0263.0% 2% Thin 1 0.5 0.37 0.015 0.00528 2 Thick 1 0.8 0.68 0.018 0.006Medium 1 0.5 0.38 0.013 0.0042.00% 0.10% Thin39 6 Thick 1 1.1 1.29 0.080 0.024Medium 1 0.9 0.85 0.053 0.0163% 2.0% Thin 1 0.7 0.49 0.012 0.0048 1 Thick 1 0.9 2.33 0.068 0.021Medium0.50% 0.1% Thin69
Bamboo (50× 20 m width, 100×100m or 250×250 m plot and circumference at 30 cm above ground.)(a)North-East Corner (50× 20 m width or 0.1 ha plot or 100×100m, or 250×250 m ) : Nil1 Number of rosettes in the plot % Cover=2 Rosettes circumference (m) + + + + + + + Avg.=3 Number of culms in rosettes + + + + + + + Avg.=S.NoSpecies /RosettesGirthclassNo. of culmsin rosettes1 2 3Girth ofCulms (cm)1 2 3Height (m)Fresh(gm)WeightDry Weight(gm)1 2 31 2 31 Thick + + + + + + + + + +Medium + + + + + + + + + +Thin + + + + + + + + + +2 Thick + + + + + + + + + +Medium + + + + + + + + + +Thin + + + + + + + + + +(b) South-West Corner (50× 20 m width or 0.1 ha plot or 100×100m or 250×250 m) : Nil1 Number of rosettes in the plot % Cover=2 Rosettes circumference (m) + + + + + + + Avg.=3 Number of culms in rosettes + + + + + + + Avg.=S.NoSpecies /RosettesGirthclassNo. of culmsin rosettes1 2 3Girth ofCulms (cm)1 2 370Height (m)Fresh(gm)WeightDry Weight(gm)1 2 31 2 31 Thick + + + + + + + + + +Medium + + + + + + + + + +Thin + + + + + + + + + +2 Thick + + + + + + + + + +Medium + + + + + + + + + +Thin + + + + + + + + + +(a) Herb 1 (1×1 m) (recorded epiphytes/lithophytes/climbers etc. also) Took fresh weight in allplots and if the cover is similar then selected only one sample from a plot for drying and weighing.In 1×1 m: Fresh weight: 0.178 gm Dry Weight: 0.076 gm % Cover: 75 %S.No. SpeciesNo. of individuals1 Boerhavia diffusa 82 Mitracarpus hirtus 43 Centella asiatica 64 Ageratum conyzoides 35 Eclipta prostrata var. prostrata 126 Synedrella nodiflora 47 Phyllanthus amarus 38 Vernonia cinerea 29 Cynodon dactylon 810 Biophytum sensitivum var. sensitivum 211 Alternanthera bettzickiana 4
(b) Herb 2 (1×1 m) (recorded epiphytes/lithophytes/climbers etc. also)In 1×1 m: Fresh weight: 0.125 gm Dry Weight: 0.054 gm % Cover: 69 %S.No. SpeciesNo. of individuals1 Lindernia ciliata 82 Mitracarpus hirtus 33 Cyperus rotundus ssp. rotundus 124 Stachytarpheta jamaicensis 25 Phyllanthus amarus 26 Mimosa pudica 37 Mollugo pentaphylla 38 Emilia sonchifolia 2(c) Herb 3 (1×1 m) (recorded epiphytes/lithophytes/climbers etc. also)In 1×1 m: Fresh weight: 0.109 gm Dry Weight: 0.047 gm % Cover: 62 %S.No. SpeciesNo. of individuals1 Axonopus compressus 82 Elephantopus scaber 23 Mimosa pudica 104 Vernonia cinerea 35 Lindernia ciliata 126 Mitracarpus hirtus 47 Justicia japonica 38 Synedrella nodiflora 2Litter in four plots of 1×1 m laid randomly – leaves + twigs+ branches+ fruits+ etc.Plots Twigs+ Branches + Leaves(gm) Humus (gm) TotalFresh Dry Fresh Dry Fresh Dry(a) NE 0.073 0.054 0.019 0.015 0.092 0.069(b) NW 0.079 0.057 0.022 0.017 0.101 0.074(c) SW 0.071 0.052 0.024 0.019 0.095 0.071(d) SE 0.065 0.048 0.016 0.012 0.081 0.060(e) Center71
Plot No.10VCP – IGBPFORMAT FOR TREES OUT-SIDE FOREST (TOF)Form 2ACATEGORY 1: SITE AND OBSERVERState: <strong>Kerala</strong> District: Malappuram GPS Point Name: PerumthalmannaLocation/Road/Canal/Village: Perumthalmanna (Town)Site Centre Coordinates : Lati. 10º 58' 43.21" Longi. 76º 13' 32.23"Sample Site/Plot No.: T- 10 Date: 16/10/2009 Time: 12.15 PMG.P.S. Reading (HHDD: MM:SS and WGS 84): Lati 10º 58' 43.21" Longi. 76º 13' 32.23"Observer: Deepu Divakaran Altitude: Site/Plot: 50 mMarking on image: (Google/1:25,000 or larger)(Tonal characteristics)Slope (°): 0.5° Photograph Number: 4308 to 4311Aspect : N /E/S/W/NE/SE/SW/NW Topography General Observations): PlaneCATEGORY 2: FOREST AND SOIL- GENERAL:TOF type: Linear Road side (Town) Visual evidence of disturbance lopping/ fire/ cutting/grazing etc: NilTop Canopy species: Samanea saman, Terminalia catappa,Ground Cover (%): 15% Stoniness(%): 0% Rock Put-crop(%): 0%Soil Type: Lateritic Soil Texture : Medium Soil colour: Dark brownLitter thickness: 0.1cm Humus Colour: Nil Humus thickness: NilDepth (m)Bulk Density(kg/m 3 )Organic carbon(%)<strong>Carbon</strong> mass(kg/m 2 )0.00-0.15 1260 3.51540.15-0.30 1320 2.07900.30-0.60 1380 1.65600.60-1.00 1400 1.28808.5384CATEGOREY 3: QUANTITATIVE MEASUREMENTSCrown Density (%) (sky hit numbers and steps): NE-SW: Steps: Hits: (Sky/Canopy)NW-SE: Steps: Hits: (Sky/Canopy)Stand Height (m) (Average from 3-4 trees of top and 1 st canopy): Top: 20+18+14 = 17.33 mAt the base of ultimate branching 1 st : + + = m72
Very Important Guidelines(a) Plot Size for Linear Plantation: Roads (NH, SH, Lane, etc.), Canals (Major – one side, Minor –both sides, etc.), Bunds (e.g. shelter belts) in agriculture fields, Rail, etc. = 50 m × 20 m width(b) Plot Size for Scattered Trees in Agriculture, Settlements, etc. areas: For very dense andmedium density trees take 2 plots of 100×100m within 250×250 m on opposite corners and for open/scattered trees take one plot of 250×250 m)(c) Plot Size for Block Plantation: four plots of 0.1 ha (please do clustered sampling)Plot Size: Linear = 50 m × 21 m (width at outer margins touching agri. field); Scattered- dense treese.g. cities (Chandigarh, N. Delhi, Bangalore, Mt. Abu,) two of 100×100m in opposite corners within250×250 m and very sparse in agriculture areas: one of 250×250 m or block plantation take four of31.62×31.62 m.Width of tar on road / water channel in canal / railway track width = 10 m (tar/rail)Width with pavement of road/side of rail track = 4 mPlot Size: 50 × 21 mL= Leaves, NL= No leavesS.no.Species Cbh (≥ 10cm)Height(m) at 1 stforkingHeight (m)ultimateforkingPhenology(L/NL)CutYes/No1 Samanea saman 264.3 1.5 20 L No2 Samanea saman 185.9 1.75 18 L No3 Terminalia catappa 85.2 2 14 L No4 Gliricidia sepium 55.1 3 12 L No5 Pongamia pinnata 57.4 3.25 8.5 L No73
Shrubs in 5×5m in a plot of 50× 20 width m, in 0.1 ha in 100×100 m plot and 250×250 m (girth at 30 cm above base): (Please bring representative stem of allshrub species either entire or approximately 20 cm long from base, middle and upper, observe 4-5 bushes of each species for better averaging and estimations)(A) North-East Corner (5×5m/0.1 ha plot). NilSpecies/bushNo. of tillers in 3No. of bushesand % coverbushes of eachspecies Girth/Diam.(cm) Height (m) Fresh Wt.(gm) Dry Wt.(gm)0.1 ha 5 x 5m Bush No. 1 2 3 1 2 3 1 2 3 1 2 3 1 2 3ThickMediumThin(C) South-west Corner (5×5/0.1 ha plot). NilSpecies/bushNo. of tillers in 3No. of bushesand % coverbushes of eachspecies Girth/Diam.(cm) Height (m) Fresh Wt.(gm) Dry Wt.(gm)0.1 ha 5 x 5m Bush No. 1 2 3 1 2 3 1 2 3 1 2 3 1 2 3ThickMediumThin74
Bamboo (50× 20 m width, 100×100m or 250×250 m plot and circumference at 30 cm above ground.)(A)North-East Corner (50× 20 m width or 0.1 ha plot or 100×100m, or 250×250 m ) : Nil1 Number of rosettes in the plot % Cover=2 Rosettes circumference (m) + + + + + + + Avg.=3 Number of culms in rosettes + + + + + + + Avg.=S.NoSpecies /RosettesGirthclassNo. of culmsin rosettes1 2 3Girth ofCulms (cm)1 2 3Height (m)Fresh(gm)WeightDry Weight(gm)1 2 31 2 31 Thick + + + + + + + + + +Medium + + + + + + + + + +Thin + + + + + + + + + +2 Thick + + + + + + + + + +Medium + + + + + + + + + +Thin + + + + + + + + + +(b) South-West Corner (50× 20 m width or 0.1 ha plot or 100×100m or 250×250 m) : Nil1 Number of rosettes in the plot % Cover=2 Rosettes circumference (m) + + + + + + + Avg.=3 Number of culms in rosettes + + + + + + + Avg.=S.NoSpecies /RosettesGirthclassNo. of culmsin rosettes1 2 3Girth ofCulms (cm)1 2 3Height (m)Fresh(gm)WeightDry Weight(gm)1 2 31 2 31 Thick + + + + + + + + + +Medium + + + + + + + + + +Thin + + + + + + + + + +2 Thick + + + + + + + + + +Medium + + + + + + + + + +Thin + + + + + + + + + +((a) Herb 1 (1×1 m) (recorded epiphytes/lithophytes/climbers etc. also) Took fresh weight in allplots and if the cover is similar then selected only one sample from a plot for drying and weighing.In 1×1 m: Fresh weight: 0.021 gm Dry Weight: 0.009 gm % Cover: 12 %S.No. SpeciesNo. of individuals1 Ageratum conyzoides 22 Commelina benghalensis 23 Cyperus rotundus ssp. rotundus 24 Mollugo pentaphylla 25 Vernonia cinerea 175
(b) Herb 2 (1×1 m) (recorded epiphytes/lithophytes/climbers etc. also)In 1×1 m: Fresh weight: 0.015 gm Dry Weight: 0.006 gm % Cover: 8 %S.No. SpeciesNo. of individuals1 Commelina benghalensis 32 Mollugo pentaphylla 13 Cyperus rotundus ssp. rotundus 2(c) Herb 3 (1×1 m) (recorded epiphytes/lithophytes/climbers etc. also)In 1×1 m: Fresh weight: 0.011 gm Dry Weight: 0.004 gm % Cover: 5 %S.No. SpeciesNo. of individuals1 Vernonia cinerea 12 Lindernia ciliata 3Litter in four plots of 1×1 m laid randomly – leaves + twigs+ branches+ fruits+ etc.Plots Twigs+ Branches + Leaves(gm) Humus (gm) TotalFresh Dry Fresh Dry Fresh Dry(a) NE 0.014 0.010 - - 0.014 0.010(b) NW 0.016 0.012 - - 0.016 0.012(c) SW 0.021 0.016 - - 0.021 0.016(d) SE 0.018 0.013 - - 0.018 0.013(e) Center76
Plot No.11VCP – IGBPForm 2AFORMAT FOR TREES OUT-SIDE FOREST (TOF)CATEGORY 1: SITE AND OBSERVERState: <strong>Kerala</strong> District: Kannur GPS Point Name: ChalakunnuLocation/Road/Canal/Village: ChalakunnuSite Centre Coordinates : Lati. 11º 51' 41.85" Longi. 75º 24' 46.38"Sample Site/Plot No.: T- 11 Date: 17/11/2009 Time: 11.45 AMG.P.S. Reading (HHDD: MM:SS and WGS 84): Lati 11º 51' 41.85" Longi. 75º 24' 46.38"Observer: Deepu Divakaran Altitude: Site/Plot: 40 mMarking on image: (Google/1:25,000 or larger)(Tonal characteristics)Slope (°): 5°Photograph Number:Aspect : N/E/S/W/NE /SE/SW/NW Topography General Observations): HillyCATEGORY 2: FOREST AND SOIL- GENERAL:TOF type: Acacia plantation Visual evidence of disturbance lopping/ fire/ cutting/grazing etc: NilTop Canopy species: Racosperma auriculiformeGround Cover (%): 85% Stoniness (%): 0% Rock Put-crop (%): 0%Soil Type: Lateritic Soil Texture : Medium Soil colour: Reddish BrownLitter thickness: 2 cm Humus Colour: Pale Brown Humus thickness: 0.1cmDepth (m)Bulk Density(kg/m 3 )Organic carbon(%)<strong>Carbon</strong> mass(kg/m 2 )0.00-0.15 1250 3.03750.15-0.30 1330 2.07480.30-0.60 1400 2.64600.60-1.00 1360 0.76168.5199CATEGOREY 3: QUANTITATIVE MEASUREMENTSCrown Density (%) (sky hit numbers and steps): NE-SW: Steps: Hits: (Sky/Canopy)NW-SE: Steps: Hits: (Sky/Canopy)Stand Height (m) (Average from 3-4 trees of top and 1 st canopy): Top: 17 + 16 + 18 = 17 mAt the base of ultimate branching 1 st : + + = m77
Very Important Guidelines(a) Plot Size for Linear Plantation: Roads (NH, SH, Lane, etc.), Canals (Major – one side, Minor –both sides, etc.), Bunds (e.g. shelter belts) in agriculture fields, Rail, etc. = 50 m × 20 m width(b) Plot Size for Scattered Trees in Agriculture, Settlements, etc. areas: For very dense andmedium density trees take 2 plots of 100×100m within 250×250 m on opposite corners and for open/scattered trees take one plot of 250×250 m)(c) Plot Size for Block Plantation: four plots of 0.1 ha (please do clustered sampling)Plot Size: Linear = 31.62 x 31.62 m × m (width at outer margins touching agri. field); Scattereddensetrees e.g. cities (Chandigarh, N. Delhi, Bangalore, Mt. Abu,) two of 100×100m in oppositecorners within 250×250 m and very sparse in agriculture areas: one of 250×250 m or block plantationtake four of 31.62×31.62 m.Width of tar on road / water channel in canal / railway track width = m (tar/rail)Width with pavement of road/side of rail track = mPlot Size: 31.62 × 31.62 mL= Leaves, NL= No leavesS.no.Species Cbh (≥ 10cm)78Height(m) at 1 stforkingHeight (m)ultimateforkingPhenology(L/NL)CutYes/No1 Racosperma auriculiforme 76.9 8 15 L No2 Racosperma auriculiforme 49.2 4.5 9 L No3 Racosperma auriculiforme 36.8 1.75 7 L No4 Racosperma auriculiforme 67.4 8 18 L No5 Racosperma auriculiforme 41.9 2.3 8 L No6 Racosperma auriculiforme 49.6 4 9 L No7 Racosperma auriculiforme 60.3 1.75 16 L No8 Racosperma auriculiforme 35.2 3.75 8 L No9 Racosperma auriculiforme 33.6 3.5 6.5 L No10 Racosperma auriculiforme 59.1 4.2 9 L No11 Racosperma auriculiforme 101.8 1.65 16 L No12 Racosperma auriculiforme 32.4 2.2 7 L No13 Racosperma auriculiforme 74.3 2 11 L No14 Racosperma auriculiforme 33.8 3 6.5 L No15 Racosperma auriculiforme 48.2 2.2 10 L No16 Racosperma auriculiforme 44.6 6 12 L No17 Racosperma auriculiforme 45.5 7 14 L No18 Racosperma auriculiforme 44.6 7.5 16 L No19 Racosperma auriculiforme 53.1 2.7 16 L No20 Racosperma auriculiforme 71.2 2.1 15 L No21 Racosperma auriculiforme 43.8 5 12 L No22 Racosperma auriculiforme 68.6 5.5 16 L No23 Racosperma auriculiforme 59.2 12 17 L No24 Racosperma auriculiforme 39.1 9 13 L No
25 Racosperma auriculiforme 40.8 7 14 L No26 Racosperma auriculiforme 47.1 6.5 12 L No27 Racosperma auriculiforme 46.1 7 14 L No28 Racosperma auriculiforme 36.2 2.1 7 L No29 Racosperma auriculiforme 40.9 3 13 L No30 Racosperma auriculiforme 42.9 9 14 L No31 Racosperma auriculiforme 52.6 5 15 L No32 Racosperma auriculiforme 27.2 3.7 7 L No33 Racosperma auriculiforme 72.6 10 16 L No34 Racosperma auriculiforme 44.2 4.5 7 L No35 Racosperma auriculiforme 64.4 6.5 13 L No36 Racosperma auriculiforme 61.8 8 16 L No37 Racosperma auriculiforme 29.6 3.5 7 L No38 Racosperma auriculiforme 57.8 14 17 L No39 Racosperma auriculiforme 43.5 6.5 12 L No40 Racosperma auriculiforme 38.6 6.5 14 L No41 Racosperma auriculiforme 42.2 10 16 L No42 Racosperma auriculiforme 31.7 5 12 L No43 Racosperma auriculiforme 38.9 2 11 L No44 Racosperma auriculiforme 38.2 2.3 11 L No45 Racosperma auriculiforme 101.2 4.5 16 L No46 Racosperma auriculiforme 52.6 11 15 L No47 Racosperma auriculiforme 44.2 3.5 12 L No48 Racosperma auriculiforme 37.1 8 13 L No49 Racosperma auriculiforme 39.1 3.5 10 L No50 Racosperma auriculiforme 72.3 1.5 14 L No51 Racosperma auriculiforme 42.9 7 15 L No52 Racosperma auriculiforme 38.9 2.3 9 L No53 Racosperma auriculiforme 63.6 2.1 16 L No54 Racosperma auriculiforme 36.8 3.2 9 L No55 Racosperma auriculiforme 89.5 11 16 L No56 Racosperma auriculiforme 42.7 8 14 L No57 Racosperma auriculiforme 33.2 5 12 L No58 Racosperma auriculiforme 54.6 3.2 13 L No59 Racosperma auriculiforme 55.6 3 14 L No60 Racosperma auriculiforme 49.6 7 14 L No61 Racosperma auriculiforme 48.6 8 15 L No62 Racosperma auriculiforme 46.6 3.3 13 L No63 Racosperma auriculiforme 27.8 3 7 L No64 Racosperma auriculiforme 44.8 2.2 13 L No65 Racosperma auriculiforme 36.1 2.1 11 L No66 Racosperma auriculiforme 34.6 4.5 11 L No67 Racosperma auriculiforme 70.2 2 12 L No68 Racosperma auriculiforme 84.4 4.2 16 L No69 Racosperma auriculiforme 36.2 3.7 11 L No70 Racosperma auriculiforme 45.8 7 13 L No71 Racosperma auriculiforme 32.2 6 10 L No72 Racosperma auriculiforme 37.9 3.5 6 L No79
73 Racosperma auriculiforme 33.8 3.7 7.5 L No74 Racosperma auriculiforme 43.8 1.5 6.5 L No75 Racosperma auriculiforme 48.2 5 12 L No76 Racosperma auriculiforme 36.3 6 17 L No77 Racosperma auriculiforme 18.4 2.2 16 L No78 Racosperma auriculiforme 24.2 2 5 L No79 Racosperma auriculiforme 50.6 5.5 12 L No80 Racosperma auriculiforme 77.6 12 17 L No81 Racosperma auriculiforme 87.2 2.5 17 L No82 Racosperma auriculiforme 41.5 7 9 L No83 Racosperma auriculiforme 45.1 4 11 L No84 Racosperma auriculiforme 34.9 6.5 10 L No85 Racosperma auriculiforme 62.1 12 16 L No86 Racosperma auriculiforme 50.1 4 9 L No87 Racosperma auriculiforme 40.2 4.2 11 L No88 Racosperma auriculiforme 54.8 2 13 L No89 Racosperma auriculiforme 51.6 3.6 12 L No90 Racosperma auriculiforme 56.7 2.6 14 L No91 Racosperma auriculiforme 50.9 2.5 12 L No92 Racosperma auriculiforme 33.5 6 11 L No93 Racosperma auriculiforme 29.9 6 7.5 L No94 Racosperma auriculiforme 28 3.5 6 L No80
Shrubs in 5×5m in a plot of 50× 20 width m, in 0.1 ha in 100×100 m plot and 250×250 m (girth at 30 cmabove base): (Please bring representative stem of all shrub species either entire or approximately 20 cm longfrom base, middle and upper, observe 4-5 bushes of each species for better averaging and estimations)(a) North-East Corner (5×5m/0.1 ha plot).Species/bushChromolaena odorataSida acutaUrena lobata ssp. lobataSida cordifoliaZiziphus oenopliaNo. of bushesand % cover No. of tillers in 3 bushes of each species Girth/Diam.(cm) Height (m)0.1 ha 5 x 5m Bush No. 1 2 3 1 2 3 1 235 5 Thick 2 2.8 1.40Medium 1 2.2 1.103% 2% Thin 1 1.4 028 4 Thick 1 0.9 0.70Medium 1 0.8 0.651.00% 0.50% Thin 1 0.6 014 3 Thick 1 1.8 1.10Medium 1 1.6 1.010.500% 0.50% Thin 1 1.3 06 1 Thick 1 0.9 0.65Medium0.20% 0.10% Thin8 2 Thick 1 3.2 3.00Medium 1 2.8 2.201.00% 1.00% Thin(b) South-west Corner (5×5/0.1 ha plot).Species/bushChromolaena odorataZiziphus oenopliaLantana camara var. camaraNo. of bushes and % cover No. of tillers in 3 bushes of each species Girth/Diam.(cm) Height0.1 ha 5 x 5m Bush No. 1 2 3 1 2 3 1 235 5 Thick 1 2.6 0.98Medium 1 0.9 0.883% 2% Thin 1 0.88 2 Thick 1 2.8 2.20Medium 1 2.6 0.651.00% 1.00% Thin18 2 Thick 1 0.9 0.45Medium0.5% 0.1% Thin81
Bamboo (50× 20 m width, 100×100m or 250×250 m plot and circumference at 30 cm above ground.)(a)North-East Corner (50× 20 m width or 0.1 ha plot or 100×100m, or 250×250 m) : Nil1 Number of rosettes in the plot % Cover=2 Rosettes circumference (m) + + + + + + + Avg.=3 Number of culms in rosettes + + + + + + + Avg.=S.NoSpecies /RosettesGirthclassNo. of culmsin rosettes1 2 3Girth ofCulms (cm)1 2 3Height (m)Fresh(gm)WeightDry Weight(gm)1 2 31 2 31 Thick + + + + + + + + + +Medium + + + + + + + + + +Thin + + + + + + + + + +2 Thick + + + + + + + + + +Medium + + + + + + + + + +Thin + + + + + + + + + +(b) South-West Corner (50× 20 m width or 0.1 ha plot or 100×100m or 250×250 m) : Nil1 Number of rosettes in the plot % Cover=2 Rosettes circumference (m) + + + + + + + Avg.=3 Number of culms in rosettes + + + + + + + Avg.=S.NoSpecies /RosettesGirthclassNo. of culmsin rosettes1 2 3Girth ofCulms (cm)1 2 3Height (m)Fresh(gm)WeightDry Weight(gm)1 2 31 2 31 Thick + + + + + + + + + +Medium + + + + + + + + + +Thin + + + + + + + + + +2 Thick + + + + + + + + + +Medium + + + + + + + + + +Thin + + + + + + + + + +(a) Herb 1 (1×1 m) (recorded epiphytes/lithophytes/climbers etc. also) Took fresh weight in allplots and if the cover is similar then selected only one sample from a plot for drying and weighing.In 1×1 m: Fresh weight: 0.112 gm Dry Weight: 0.049 gm % Cover: 72 %S.No. SpeciesNo. of individuals1 Ageratum conyzoides 192 Mitracarpus hirtus 303 Synedrella nodiflora 34 Alloteropsis cimicina 1505 Justicia japonica 582
(b) Herb 2 (1×1 m) (recorded epiphytes/lithophytes/climbers etc. also)In 1×1 m: Fresh weight: 0.091 gm Dry Weight: 0.040 gm % Cover: 68 %S.No. SpeciesNo. of individuals1 Mimosa pudica 42 Synedrella nodiflora 93 Mitracarpus hirtus 104 Alloteropsis cimicina 1025 Achyranthes aspera var. aspera 1(c) Herb 3 (1×1 m) (recorded epiphytes/lithophytes/climbers etc. also)In 1×1 m: Fresh weight: 0.074 gm Dry Weight: 0.033 gm % Cover: 60 %S.No. SpeciesNo. of individuals1 Alloteropsis cimicina 982 Synedrella nodiflora 33 Ageratum conyzoides 24 Mimosa pudica 8Litter in four plots of 1×1 m laid randomly – leaves + twigs+ branches+ fruits+ etc.Plots Twigs+ Branches + Leaves(gm) Humus (gm) TotalFresh Dry Fresh Dry Fresh Dry(a) NE 0.143 0.103 0.033 0.025 0.176 0.128(b) NW 0.152 0.111 0.038 0.030 0.19 0.141(c) SW 0.133 0.098 0.029 0.023 0.162 0.121(d) SE 0.128 0.093 0.031 0.024 0.159 0.117(e) Center83
Plot No.12VCP – IGBPFORMAT FOR TREES OUT-SIDE FOREST (TOF)Form 2ACATEGORY 1: SITE AND OBSERVERState: <strong>Kerala</strong> District: Kannur GPS Point Name: Kannur Civil stationLocation/Road/Canal/Village: Kannur (City)Site Centre Coordinates : 12 Date: 17/11/2009 Time: 1.15 PMG.P.S. Reading (HHDD:MM:SS and WGS 84): Lati 11º 52' 31.85" Longi. 75º 21' 53.82"Observer: Deepu Divakaran Altitude: Site/Plot: 12 mMarking on image: (Google/1:25,000 or larger)(Tonal characteristics)Slope (°): 0.1°Photograph Number:Aspect : N/E/S/W/NE /SE/SW/NW Topography General Observations): PlaneCATEGORY 2: FOREST AND SOIL- GENERAL:TOF type: Settlement (City) Visual evidence of disturbance lopping/ fire/ cutting/grazing etc: NilTop Canopy species: Macaranga peltata, Spathodea campanulataGround Cover (%): 25% Stoniness(%): 0% Rock Put-crop(%): 0%Soil Type: Lateritic Soil Texture : Medium Soil colour: Reddish brownLitter thickness: 1 cm Humus Colour: Pale brown Humus thickness: 0.3Depth (m)Bulk Density(kg/m 3 )Organic carbon(%)<strong>Carbon</strong> mass(kg/m 2 )0.00-0.15 1200 2.41200.15-0.30 1270 1.71450.30-0.60 1350 2.10600.60-1.00 1320 0.52806.7605CATEGOREY 3: QUANTITATIVE MEASUREMENTSCrown Density (%) (sky hit numbers and steps): NE-SW: Steps: Hits: (Sky/Canopy)NW-SE: Steps: Hits: (Sky/Canopy)Stand Height (m) (Average from 3-4 trees of top and 1 st canopy): Top: 13 + 13 + 13 = 13 mAt the base of ultimate branching 1 st : + + = m84
Very Important Guidelines(a) Plot Size for Linear Plantation: Roads (NH, SH, Lane, etc.), Canals (Major – one side, Minor –both sides, etc.), Bunds (e.g. shelter belts) in agriculture fields, Rail, etc. = 50 m × 20m width(b) Plot Size for Scattered Trees in Agriculture, Settlements, etc. areas: For very dense andmedium density trees take 2 plots of 100×100m within 250×250 m on opposite corners and for open/scattered trees take one plot of 250×250 m)(c) Plot Size for Block Plantation: four plots of 0.1 ha (please do clustered sampling)Plot Size: Linear = 31.62 m × 31.62 m (width at outer margins touching agri. field); Scattered- densetrees e.g. cities (Chandigarh, N. Delhi, Bangalore, Mt. Abu,) two of 100×100m in opposite cornerswithin 250×250 m and very sparse in agriculture areas: one of 250×250 m or block plantation takefour of 31.62×31.62 m.Width of tar on road / water channel in canal / railway track width = m (tamPlot Size: 31.62 × 31.62 mL= Leaves, NL= No leavesS.no.Species Cbh (≥ 10cm)Height(m) at 1 stforkingHeight (m)ultimateforkingPhenology(L/NL)CutYes/No1 Macaranga peltata 180.2 8 13 L No2 Macaranga peltata 190.3 7.5 13 L No3 Macaranga peltata 105.3 4.5 12 L No4 Terminalia catappa 25 - 7.5 L No5 Spathodea campanulata 185.5 5.5 11 L No6 Paraserianthes falcataria 135.8 2.5 7 L Yes7 Spathodea campanulata 205.4 2.5 12 L No8 Samanea saman 245.5 3.5 14 L No9 Spathodea campanulata 95.7 7.5 13 L No85
Shrubs in 5×5m in a plot of 50× 20 width m, in 0.1 ha in 100×100 m plot and 250×250 m (girth at 30 cmabove base): (Please bring representative stem of all shrub species either entire or approximately 20 cm longfrom base, middle and upper, observe 4-5 bushes of each species for better averaging and estimations)(a) North-East Corner (5×5m/0.1 ha plot).Species/bushNo. of bushesand % coverNo. of tillers in 3 bushesof each species Girth/Diam.(cm) Height (m)FreshWt.(gm) Dry Wt.(gm)0.1 ha 5 x 5m Bush No. 1 2 3 1 2 3 1 2 3 1 2 3 1 2 3ThickMediumThin(b) South-west Corner (5×5/0.1 ha plot).Species/bushSida acutaLantanacamara var.camaraNo. of bushes and %coverNo. of tillers in 3 bushesof each species Girth/Diam.(cm) Height (m) Fresh Wt.(gm) Dry Wt.(gm)0.1 ha 5 x 5m Bush No. 1 2 3 1 2 3 1 2 3 1 2 3 1 23 1 Thick 1 0.9 0.35 0.027 0.008Medium0.005% 0.01% Thin4 1 Thick 1 1.8 0.85 0.052 0.015Medium0.008% 0.02% Thin86
Bamboo (50× 0 m width, 100×100m or 250×250 m plot and circumference at 30 cm above ground.)(A)North-East Corner (50× 20 m width or 0.1 ha plot or 100×100m, or 250×250 m ) : Nil1 Number of rosettes in the plot % Cover=2 Rosettes circumference (m) + + + + + + + Avg.=3 Number of culms in rosettes + + + + + + + Avg.=S.NoSpecies /RosettesGirthclassNo. of culmsin rosettes1 2 3Girth ofCulms (cm)1 2 3Height (m)Fresh(gm)WeightDry Weight(gm)1 2 31 2 31 Thick + + + + + + + + + +Medium + + + + + + + + + +Thin + + + + + + + + + +2 Thick + + + + + + + + + +Medium + + + + + + + + + +Thin + + + + + + + + + +(b) South-West Corner (50× 20 m width or 0.1 ha plot or 100×100m or 250×250 m) : Nil1 Number of rosettes in the plot % Cover=2 Rosettes circumference (m) + + + + + + + Avg.=3 Number of culms in rosettes + + + + + + + Avg.=S.NoSpecies /RosettesGirthclassNo. of culmsin rosettes1 2 3Girth ofCulms (cm)1 2 3Height (m)Fresh(gm)WeightDry Weight(gm)1 2 31 2 31 Thick + + + + + + + + + +Medium + + + + + + + + + +Thin + + + + + + + + + +2 Thick + + + + + + + + + +Medium + + + + + + + + + +Thin + + + + + + + + + +((a) Herb 1 (1×1 m) (recorded epiphytes/lithophytes/climbers etc. also) Took fresh weight in allplots and if the cover is similar then selected only one sample from a plot for drying and weighing.In 1×1 m: Fresh weight: 0.024 gm Dry Weight: 0.011 gm % Cover: 20 %S.No. SpeciesNo. of individuals1 Cyathula prostrata 42 Cyperus rotundus ssp. rotundus 8(b) Herb 2 (1×1 m) (recorded epiphytes/lithophytes/climbers etc. also)In 1×1 m: Fresh weight: 0.023 gm Dry Weight: 0.010 gm % Cover: 19 %S.No. SpeciesNo. of individuals1 Mimosa pudica 22 Synedrella nodiflora 13 Alloteropsis cimicina 787
(c) Herb 3 (1×1 m) (recorded epiphytes/lithophytes/climbers etc. also)In 1×1 m: Fresh weight: 0.022 gm Dry Weight: 0.009 gm % Cover: 19 %S.No. SpeciesNo. of individuals1 Synedrella nodiflora 22 Alloteropsis cimicina 53 Ageratum conyzoides 2Litter in four plots of 1×1 m laid randomly – leaves + twigs+ branches+ fruits+ etc.Plots Twigs+ Branches + Leaves(gm) Humus (gm) TotalFresh Dry Fresh Dry Fresh Dry(a) NE 0.062 0.045 0.018 0.014 0.080 0.059(b) NW 0.056 0.041 0.016 0.012 0.072 0.053(c) SW 0.068 0.049 0.021 0.016 0.089 0.065(d) SE 0.047 0.034 0.014 0.011 0.061 0.045(e) Center88
Plot No.13VCP – IGBPForm 2AFORMAT FOR TREES OUT-SIDE FOREST (TOF)CATEGORY 1: SITE AND OBSERVERState: <strong>Kerala</strong> District: Kasargod GPS Point Name: Madivayal (Cheruvathur)Location/Road/Canal/Village: Paddy fieldSite Centre Coordinates : Lati. 12º 12' 22.97" Longi. 75º 9' 19.89"Sample Site/Plot No.: T- 13 Date: 18/11/2009 Time: 11.30 AMG.P.S. Reading (HHDD: MM:SS and WGS 84): Lati 12º 12' 22.97" Longi. 75º 9' 19.89"Observer: Deepu Divakaran Altitude: Site/Plot: 40 mMarking on image: (Google/1:25,000 or larger)(Tonal characteristics)Slope (°): 0.2°Photograph Number:Aspect : N/E/S/W/NE/SE /SW/NW Topography General observations): Paddy fieldCATEGORY 2: FOREST AND SOIL- GENERAL:TOF type: Paddy field Visual evidence of disturbance lopping/ fire/ cutting/grazing etc: NilTop Canopy species: Cocos nucifera, Racosperma mangiumGround Cover (%): 93% Stoniness (%): 0% Rock Put-crop (%): 0%Soil Type: Claye Soil Texture : Fine Soil colour: Dark brownLitter thickness: 0.2cm Humus Colour: Nil Humus thickness: NilDepth (M)Bulk Density(Kg/m 3 )Organic carbon(Kg)<strong>Carbon</strong> mass(Kg/m 2 )0.00-0.15 1300 2.57400.15-0.30 1340 2.33160.30-0.60 1400 2.26800.60-1.00 1400 1.51208.6856CATEGOREY 3: QUANTITATIVE MEASUREMENTSCrown Density (%) ( sky hit numbers and steps): NE-SW: Steps: Hits: (Sky/Canopy)NW-SE: Steps: Hits: (Sky/Canopy)Stand Height (m) (Average from 3-4 trees of top and 1 st canopy): Top: 6 + 6.5 + 6 = 6.17 mAt the base of ultimate branching 1 st : + + = m89
Very Important Guidelines(a) Plot Size for Linear Plantation: Roads (NH, SH, Lane, etc.), Canals (Major – one side, Minor –both sides, etc.), Bunds (e.g. shelter belts) in agriculture fields, Rail, etc. = 50 m × 20 m width(b) Plot Size for Scattered Trees in Agriculture, Settlements, etc. areas: For very dense andmedium density trees take 2 plots of 100×100m within 250×250 m on opposite corners and for open/scattered trees take one plot of 250×250 m)(c) Plot Size for Block Plantation: four plots of 0.1 ha (please do clustered sampling)Plot Size: Linear = 31.62 m × 31.62 m (width at outer margins touching agri. field); Scattered- densetrees e.g. cities (Chandigarh, N. Delhi, Bangalore, Mt. Abu,) two of 100×100m in opposite cornerswithin 250×250 m and very sparse in agriculture areas: one of 250×250 m or block plantation takefour of 31.62×31.62 m.Width of tar on road / water channel in canal / railway track width = m (tar/rail)Width with pavement of road/side of rail track = mPlot Size: 31.62 × 31.62 mL= Leaves, NL= No leavesS.no.Species Cbh (≥ 10cm)Height(m) at 1 stforkingHeight (m)ultimateforkingPhenology(L/NL)CutYes/No1 Cocos nucifera 84.2 - 6 L No2 Cocos nucifera 85.7 - 6.5 L No3 Cocos nucifera 74.7 - 6 L No4 Racosperma mangium 24.3 1.5 4 L No90
Shrubs in 5×5m in a plot of 50× 20 width m, in 0.1 ha in 100×100 m plot and 250×250 m (girth at 30 cm above base): (Please bring representative stem of allshrub species either entire or approximately 20 cm long from base, middle and upper, observe 4-5 bushes of each species for better averaging and estimations)(A) North-East Corner (5×5m/0.1 ha plot).Species/bushHygrophilaschulliNo. of tillers in 3No. of bushesand % coverbushes of eachspecies Girth/Diam.(cm) Height (m) Fresh Wt.(gm) Dry Wt.(gm)0.1 ha 5 x 5m Bush No. 1 2 3 1 2 3 1 2 3 1 2 3 1 2 322 3 Thick 3 2.7 1.10 0.089 0.026Medium 2 2.2 0.92 0.081 0.0243.00% 2.00% Thin 1 1.8 0.83 0.076 0.022(B) South-west Corner (5×5/0.1 ha plot).Species/bushHygrophila schulliBarleria courtallicaPhyllanthusreticulatusIxora coccineaNo. of tillers in 3No. of bushesand % coverbushes of eachspecies Girth/Diam.(cm) Height (m) Fresh Wt.(gm) Dry Wt.(gm)0.1 ha 5 x 5m Bush No. 1 2 3 1 2 3 1 2 3 1 2 3 1 2 322 4 Thick 3 2.6 0.95 0.083 0.024Medium 2 1.8 0.85 0.071 0.0213.00% 3.0% Thin 2 1.4 0.80 0.063 0.0196 3 Thick 2 3.1 1.20 0.102 0.030Medium 2 2.9 1.00 0.082 0.0241.00% 2% Thin 1 2.2 0.92 0.069 0.02026 3 Thick 1 0.9 0.34 0.072 0.020Medium 1 0.7 0.22 0.041 0.0123.00% 1.0% Thin 1 0.5 0.10 0.019 0.0053 1 Thick 1 0.8 0.61 0.005 0.001Medium0.001% 0.01% Thin91
Bamboo (50× … m width, 100×100m or 250×250 m plot and circumference at 30 cm above ground.)(a)North-East Corner (50× … m width or 0.1 ha plot or 100×100m, or 250×250 m) : Nil1 Number of rosettes in the plot % Cover=2 Rosettes circumference (m) + + + + + + + Avg.=3 Number of culms in rosettes + + + + + + + Avg.=S.NoSpecies /RosettesGirthclassNo. of culmsin rosettes1 2 3Girth ofCulms (cm)1 2 3Height (m)Fresh(gm)WeightDry Weight(gm)1 2 31 2 31 Thick + + + + + + + + + +Medium + + + + + + + + + +Thin + + + + + + + + + +2 Thick + + + + + + + + + +Medium + + + + + + + + + +Thin + + + + + + + + + +(b) South-West Corner (50× … m width or 0.1 ha plot or 100×100m or 250×250 m) : Nil1 Number of rosettes in the plot % Cover=2 Rosettes circumference (m) + + + + + + + Avg.=3 Number of culms in rosettes + + + + + + + Avg.=S.NoSpecies /RosettesGirthclassNo. of culmsin rosettes1 2 3Girth ofCulms (cm)1 2 3Height (m)Fresh(gm)WeightDry Weight(gm)1 2 31 2 31 Thick + + + + + + + + + +Medium + + + + + + + + + +Thin + + + + + + + + + +2 Thick + + + + + + + + + +Medium + + + + + + + + + +Thin + + + + + + + + + +(a) Herb 1 (1×1 m) (recorded epiphytes/lithophytes/climbers etc. also) Took fresh weight in allplots and if the cover is similar then selected only one sample from a plot for drying and weighing.In 1×1 m: Fresh weight: 0.123 gm Dry Weight: 0.053 gm % Cover: 85 %S.No. SpeciesNo. of individuals1 Bidens pilosa var. minor 22 Biophytum sensitivum var. sensitivum 33 Cyperus rotundus ssp. rotundus 124 Brassica juncea 35 Phyllanthus amarus 26 Mimosa pudica 37 Mollugo pentaphylla 88 Axonopus compressus 2292
(b) Herb 2 (1×1 m) (recorded epiphytes/lithophytes/climbers etc. also)In 1×1 m: Fresh weight: 0.098 gm Dry Weight: 0.045 gm % Cover: 79 %S.No. SpeciesNo. of individuals1 Axonopus compressus 322 Elephantopus scaber 23 Mimosa pudica 64 Heliotropium indicum 35 Lindernia ciliata 126 Mitracarpus hirtus 47 Justicia japonica 38 Synedrella nodiflora 29 Oldenlandia corymbosa 5(c) Herb 3 (1×1 m) (recorded epiphytes/lithophytes/climbers etc. also)In 1×1 m: Fresh weight: 0.128 gm Dry Weight: 0.056 gm % Cover: 95 %S.No. SpeciesNo. of individuals1 Heliotropium indicum 12 Sida beddomei 23 Centella asiatica 124 Mimosa pudica 35 Commelina benghalensis 16 Phyllanthus amarus 17 Alternanthera bettzickiana 48 Mollugo pentaphylla 19 Desmodium triflorum 210 Axonopus compressus 2811 Oldenlandia corymbosa 412 Cyperus rotundus ssp. rotundus 2113 Ageratum conyzoides 4Litter in four plots of 1×1 m laid randomly – leaves + twigs+ branches+ fruits+ etc.Plots Twigs+ Branches + Leaves(gm) Humus (gm) TotalFresh Dry Fresh Dry Fresh Dry(a) NE 0.041 0.030 0.011 0.009 0.052 0.038(b) NW 0.048 0.035 0.016 0.013 0.064 0.048(c) SW 0.028 0.020 0.012 0.009 0.040 0.030(d) SE 0.039 0.028 0.014 0.011 0.053 0.039(e) Center93
Plot No14VCP – IGBPFORMAT FOR TREES OUT-SIDE FOREST (TOF)Form 2ACATEGORY 1: SITE AND OBSERVERState: <strong>Kerala</strong> District: Kasrgod GPS Point Name: KannankaiLocation/Road/Canal/Village: Peelikode - MadakaraSite Centre Coordinates : Lati. 12º 12' 13.07" Longi. 75º 8' 50.82"Sample Site/Plot No.: T- 14 Date: 18/11/2009 Time: 12.30 PMG.P.S. Reading (HHDD: MM:SS and WGS 84): Lati 12º 12' 13.07" Longi. 75º 8' 50.82"Observer: Deepu Divakaran Altitude: Site/Plot: 18 mMarking on image: (Google/1:25,000 or larger)(Tonal characteristics)Slope (°): 0.1°Photograph Number:Aspect : N/E/S/W/NE /SE/SW/NW Topography General Observations): Paddy fieldCATEGORY 2: FOREST AND SOIL- GENERAL:TOF type: Linear (Bund) Visual evidence of disturbance lopping/ fire/ cutting/grazing etc: GrazingTop Canopy species: Cocos nuciferaGround Cover (%): 85% Stoniness (%): 0% Rock Put-crop (%): 0%Soil Type: Claye Soil Texture : Fine Soil colour: Dark brownLitter thickness: Nil Humus Colour: Nil Humus thickness: NilDepth (m)Bulk Density(kg/m 3 )Organic carbon(%)<strong>Carbon</strong> mass(kg/m 2 )0.00-0.15 1280 1.92000.15-0.30 1350 1.11380.30-0.60 1420 1.36320.60-1.00 1400 1.45605.8530CATEGOREY 3: QUANTITATIVE MEASUREMENTSCrown Density (%) (sky hit numbers and steps): NE-SW: Steps: Hits: (Sky/Canopy)NW-SE: Steps: Hits: (Sky/Canopy)Stand Height (m) (Average from 3-4 trees of top and 1 st canopy): Top: 11 + 11 + 11 = 11 mAt the base of ultimate branching 1 st : + + = m94
Very Important Guidelines(a) Plot Size for Linear Plantation: Roads (NH, SH, Lane, etc.), Canals (Major – one side, Minor –both sides, etc.), Bunds (e.g. shelter belts) in agriculture fields, Rail, etc. = 50 m × 20 m width(b) Plot Size for Scattered Trees in Agriculture, Settlements, etc. areas: For very dense andmedium density trees take 2 plots of 100×100m within 250×250 m on opposite corners and for open/scattered trees take one plot of 250×250 m)(c) Plot Size for Block Plantation: four plots of 0.1 ha (please do clustered sampling)Plot Size: Linear = 50 m × 10 m (width at outer margins touching agri. field); Scattered- dense treese.g. cities (Chandigarh, N. Delhi, Bangalore, Mt. Abu,) two of 100×100m in opposite corners within250×250 m and very sparse in agriculture areas: one of 250×250 m or block plantation take four of31.62×31.62 m.Width of tar on road / water channel in canal / railway track width = m (tar/rail)Width with pavement of road/side of rail track = mPlot Size: 50 × 10 mL= Leaves, NL= No leavesS.no.Species Cbh (≥ 10cm)Height(m) at 1 stforkingHeight (m)ultimateforkingPhenology(L/NL)CutYes/No1 Cocos nucifera 95.4 - 10 L No2 Cocos nucifera 92.3 - 11 L No3 Cocos nucifera 96.2 - 13 L No4 Cocos nucifera 90.1 - 9.5 L No5 Cocos nucifera 89.5 - 9 L No6 Cocos nucifera 85.0 - 7.5 L No7 Cocos nucifera 88.3 - 11 L No8 Cocos nucifera 89.1 - 12.5 L No9 Cocos nucifera 88.7 - 10.5 L No10 Cocos nucifera 86.3 - 11 L No11 Cocos nucifera 91.6 - 9.5 L No12 Cocos nucifera 93.7 - 10 L No13 Cocos nucifera 96.3 - 9.5 L No14 Cocos nucifera 88.3 - 11 L No15 Cocos nucifera 89.0 - 9.5 L No16 Cocos nucifera 91.3 - 10.5 L No95
Shrubs in 5×5m in a plot of 50×20 width m, in 0.1 ha in 100×100 m plot and 250×250 m (girth at 30 cm above base): (Please bring representative stem of allshrub species either entire or approximately 20 cm long from base, middle and upper, observe 4-5 bushes of each species for better averaging and estimations)(a) North-East Corner (5×5m/0.1 ha plot).Species/bushHygrophilaschulliAcrostichumSp.No. of tillers in 3No. of bushesand % coverbushes of eachspecies Girth/Diam.(cm) Height (m) Fresh Wt.(gm) Dry Wt.(gm)0.1 ha 5 x 5m Bush No. 1 2 3 1 2 3 1 2 3 1 2 3 1 2 316 3 Thick 1 3.5 0.65 0.092 0.026Medium 1 2.5 0.62 0.083 0.0232.00% 2.00% Thin 1 2.0 0.60 0.065 0.01835 2 Thick 1 2.8 1.50 0.074 0.020Medium 1 1.2 1.00 0.042 0.0123.00% 1.0% Thin(b)South-west Corner (5×5/0.1 ha plot).Species/bushDerrisscandensHygrophilaschulliNo. of tillers in 3No. of bushesand % coverbushes of eachspecies Girth/Diam.(cm) Height (m) Fresh Wt.(gm) Dry Wt.(gm)0.1 ha 5 x 5m Bush No. 1 2 3 1 2 3 1 2 3 1 2 3 1 2 31 1 Thick 1 2.2 1.80 0.092 0.026Medium0.0001% 0.006% Thin16 3 Thick 2 2.1 0.85 0.081 0.023Medium 1 1.8 0.74 0.075 0.0222.00% 2.00% Thin 1 1.4 0.62 0.033 0.00996
Bamboo (50× 20 m width, 100×100m or 250×250 m plot and circumference at 30 cm above ground.)(A)North-East Corner (50× 20 m width or 0.1 ha plot or 100×100m, or 250×250 m ) : Nil1 Number of rosettes in the plot % Cover=2 Rosettes circumference (m) + + + + + + + Avg.=3 Number of culms in rosettes + + + + + + + Avg.=S.NoSpecies /RosettesGirthclassNo. of culmsin rosettes1 2 3Girth ofCulms (cm)1 2 3Height (m)Fresh(gm)WeightDry Weight(gm)1 2 31 2 31 Thick + + + + + + + + + +Medium + + + + + + + + + +Thin + + + + + + + + + +2 Thick + + + + + + + + + +Medium + + + + + + + + + +Thin + + + + + + + + + +(b) South-West Corner (50× 20 m width or 0.1 ha plot or 100×100m or 250×250 m) : Nil1 Number of rosettes in the plot % Cover=2 Rosettes circumference (m) + + + + + + + Avg.=3 Number of culms in rosettes + + + + + + + Avg.=S.NoSpecies /RosettesGirthclassNo. of culmsin rosettes1 2 3Girth ofCulms (cm)1 2 397Height (m)Fresh(gm)WeightDry Weight(gm)1 2 31 2 31 Thick + + + + + + + + + +Medium + + + + + + + + + +Thin + + + + + + + + + +2 Thick + + + + + + + + + +Medium + + + + + + + + + +Thin + + + + + + + + + +(a) Herb 1 (1×1 m) (recorded epiphytes/lithophytes/climbers etc. also) Took fresh weight in allplots and if the cover is similar then selected only one sample from a plot for drying and weighing.In 1×1 m: Fresh weight: 0.128 gm Dry Weight: 0.056 gm % Cover: 80 %S.No. SpeciesNo. of individuals1 Desmodium triflorum 352 Sida beddomei 83 Scoparia dulcis 24 Lindernia ciliata 205 Mollugo pentaphylla 156 Bidens pilosa var. minor 17 Centella asiatica 18 Mitracarpus hirtus 49 Commelina benghalensis 1
(b) Herb 2 (1×1 m) (recorded epiphytes/lithophytes/climbers etc. also)In 1×1 m: Fresh weight: 0.116 gm Dry Weight: 0.051 gm % Cover: 78 %S.No. SpeciesNo. of individuals1 Cyperus rotundus ssp. rotundus 282 Sida beddomei 23 Centella asiatica 124 Mimosa pudica 35 Commelina benghalensis 16 Brassica juncea 17 Alternanthera bettzickiana 38 Mollugo pentaphylla 169 Desmodium triflorum 210 Oldenlandia corymbosa 311 Ageratum conyzoides 3(c) Herb 3 (1×1 m) (recorded epiphytes/lithophytes/climbers etc. also)In 1×1 m: Fresh weight: 0.148 gm Dry Weight: 0.065 gm % Cover: 83 %S.No. SpeciesNo. of individuals1 Centella asiatica 1002 Desmodium triflorum 303 Selaginella Sp. 14 cynodon dactylon 15 Commelina benghalensis 26 Nymphaea nouchali 17 Salvinia Sp. 68 Cyperus rotundus ssp. rotundus 249 Axonopus compressus 2010 Alternanthera bettzickiana 15Litter in four plots of 1×1 m laid randomly – leaves + twigs+ branches+ fruits+ etc.: NilPlots Twigs+ Branches + Leaves(gm) Humus (gm) TotalFresh Dry Fresh Dry Fresh Dry(a) NE(b) NW(c) SW(d) SE(e) Center98
Plot No15VCP – IGBPFORMAT FOR TREES OUT-SIDE FOREST (TOF)Form 2ACATEGORY 1: SITE AND OBSERVERState: <strong>Kerala</strong> District: Kasargod GPS Point Name: ValliyotLocation/Road/Canal/Village: Valliyot (Periya – Bakal)Site Centre Coordinates : Lati. 12º 23' 28.92" Longi. 75º 2' 49.18"Sample Site/Plot No.: T- 15 Date: 18/11/2009 Time: 2.10 PMG.P.S. Reading (HHDD:MM:SS and WGS 84): Lati 12º 23' 28.92" Longi. 75º 2' 49.18"Observer: Deepu Divakaran Altitude: Site/Plot: 22 mMarking on image: (Google/1:25,000 or larger)(Tonal characteristics)Slope (°): 3°Photograph Number:Aspect : N/E/S/W/NE/SE/SW /NW Topography General observations): HillyCATEGORY 2: FOREST AND SOIL- GENERAL:TOF type: Settelement (Village) Visual evidence of disturbance lopping/ fire/ cutting/grazing etc: GrazingTop Canopy species: Mangifera indica, Cocos nuciferaGround Cover (%): 75% Stoniness (%): 3 % Rock Put-crop(%): 0 %Soil Type: Lateritic Soil Texture : Medium Soil colour: Pale BrownLitter thickness: 1 cm Humus Colour: Pale Brown Humus thickness: 0.1 cmDepth (m)Bulk Density(kg/m 3 )Organic carbon(%)<strong>Carbon</strong> mass(kg/m 2 )0.00-0.15 1240 2.13900.15-0.30 1340 1.60800.30-0.60 1380 2.15280.60-1.00 1420 0.79526.6950CATEGOREY 3: QUANTITATIVE MEASUREMENTSCrown Density (%) (sky hit numbers and steps): NE-SW: Steps: Hits: (Sky/Canopy)NW-SE: Steps: Hits: (Sky/Canopy)Stand Height (m) (Average from 3-4 trees of top and 1 st canopy): Top: 14 + 15 + 16 = 15 mAt the base of ultimate branching 1 st : + + = m99
Very Important Guidelines(a) Plot Size for Linear Plantation: Roads (NH, SH, Lane, etc.), Canals (Major – one side, Minor –both sides, etc.), Bunds (e.g. shelter belts) in agriculture fields, Rail, etc. = 50 m × 20 m width(b) Plot Size for Scattered Trees in Agriculture, Settlements, etc. areas: For very dense andmedium density trees take 2 plots of 100×100m within 250×250 m on opposite corners and for open/scattered trees take one plot of 250×250 m)(c) Plot Size for Block Plantation: four plots of 0.1 ha (please do clustered sampling)Plot Size: Linear = 31.62 m × 31.62 m (width at outer margins touching agri. field); Scattered- densetrees e.g. cities (Chandigarh, N. Delhi, Bangalore, Mt. Abu,) two of 100×100m in opposite cornerswithin 250×250 m and very sparse in agriculture areas: one of 250×250 m or block plantation takefour of 31.62×31.62 m.Width of tar on road / water channel in canal / railway track width = m (tar/rail)Width with pavement of road/side of rail track = mPlot Size: 31.62 × 31.62 mL= Leaves, NL= No leavesS.no.Species Cbh (≥ 10cm)100Height(m) at 1 stforkingHeight (m)ultimateforkingPhenology(L/NL)CutYes/No1 Mangifera indica 165.1 2 10 L No2 Mangifera indica 205 3.5 11 L No3 Artocarpus heterophyllus 85.3 6 9 L No4 Cocos nucifera 72.5 - 8 L No5 Cocos nucifera 84.1 - 11 L No6 Cocos nucifera 86.2 - 13 L No7 Cocos nucifera 86.4 - 16 L No8 Cocos nucifera 89.2 - 15 L No9 Cocos nucifera 88.1 - 14 L No10 Cocos nucifera 89.3 - 14 L No11 Cocos nucifera 94.1 - 15 L No12 Cocos nucifera 78.2 - 9 L No13 Cocos nucifera 74.1 - 9 L No14 Cocos nucifera 88.2 - 12 L No15 Cocos nucifera 92.1 - 14 L No16 Cocos nucifera 86.1 - 13 L No17 Cocos nucifera 89.2 - 14 L No18 Cocos nucifera 92.3 - 14 L No19 Cocos nucifera 78.1 - 10 L No20 Cocos nucifera 93.4 - 14 L No21 Cocos nucifera 92.1 - 13 L No22 Cocos nucifera 86.2 - 12 L No23 Cocos nucifera 85.6 - 13 L No
24 Cocos nucifera 92.5 - 14 L No25 Cocos nucifera 95.2 - 15 L No26 Cocos nucifera 86.3 - 12 L No27 Cocos nucifera 84.2 - 12 L No28 Cocos nucifera 92.1 - 14 L No29 Cocos nucifera 79.7 - 9 L No30 Cocos nucifera 86.1 - 12 L No31 Cocos nucifera 85.3 - 13 L No32 Cocos nucifera 92.1 - 14 L No33 Cocos nucifera 82.5 - 12 L No34 Mangifera indica 140.2 3.5 11 L No35 Mangifera indica 125.3 4.5 8 L No36 Anacardium occidentale 65.2 3.75 8 L No101
Shrubs in 5×5m in a plot of 50× 20 width m, in 0.1 ha in 100×100 m plot and 250×250 m (girth at 30 cm above base): (Please bring representative stem of allshrub species either entire or approximately 20 cm long from base, middle and upper, observe 4-5 bushes of each species for better averaging and estimations)(a) North-East Corner (5×5m/0.1 ha plot).Species/bushSida acutaChromolaenaodorataClerodendruminfortunatumOcimumamericanumUrena lobata ssp.lobataWattakakavolubilisSida cordifoliaNo. of tillers in 3No. of bushesand % coverbushes of eachspecies Girth/Diam.(cm) Height (m) Fresh Wt.(gm) Dry Wt.(gm)0.1 ha 5 x 5m Bush No. 1 2 3 1 2 3 1 2 3 1 2 3 1 2 38 3 Thick 1 3.1 0.80 0.035 0.012Medium 1 1.8 0.70 0.018 0.0060.05% 0.5% Thin 1 0.7 0.60 0.009 0.00328 4 Thick 2 2.1 1.00 0.077 0.024Medium 1 1.8 0.80 0.065 0.0211.00% 1.00% Thin 1 0.8 0.30 0.007 0.00218 4 Thick 1 2.0 0.41 0.043 0.014Medium 1 1.8 0.38 0.032 0.0101.50% 1.0% Thin 1 1.4 0.31 0.018 0.00615 3 Thick 1 3.2 1.80 0.128 0.036Medium 1 2.3 1.10 0.088 0.0261.30% 1% Thin 1 1.8 0.80 0.036 0.01120 3 Thick 1 1.0 0.42 0.014 0.004Medium 1 0.9 0.40 0.011 0.0031.50% 0.5% Thin 1 0.8 0.38 0.007 0.0024 1 Thick 1 0.9 0.38 0.009 0.003Medium0.01% 0.01% Thin6 1 Thick 1 0.9 0.45 0.014 0.004Medium0.02% 0.01% Thin102
(b) South-west Corner (5×5/0.1 ha plot).No. of tillers in 3No. of bushes bushes of eachSpecies/bushand % coverspecies Girth/Diam.(cm) Height (m) Fresh Wt.(gm) Dry Wt.(gm)0.1 ha 5 x 5m Bush No. 1 2 3 1 2 3 1 2 3 1 2 3 1 2 38 4 Thick 1 3.1 1.00 0.113 0.035ClerodendrumMedium 1 1.8 0.75 0.071 0.022paniculatum0.02% 0.2% Thin 1 0.9 0.30 0.015 0.0058 2 Thick 1 0.8 0.63 0.014 0.005Sida acutaMedium 1 0.5 0.31 0.010 0.0030.05% 0.2% ThinChromolaenaodorataKalanchoeschweinfurthiiWattakaka volubilisStachytarphetajamaicensisUrena lobata ssp.lobataOcimumamericanumCanthiumcoromandelicum28 3 Thick 1 1.8 0.85 0.081 0.024Medium 1 0.8 0.50 0.053 0.0161.00% 0.90% Thin 1 0.5 0.35 0.006 0.0023 1 Thick 1 3.2 0.36 0.032 0.009Medium0.01% 0.01% Thin4 1 Thick 1 0.9 0.36 0.009 0.003Medium0.01% 0.01% Thin18 2 Thick 1 0.9 0.20 0.009 0.003Medium 1 0.8 0.15 0.007 0.0020.5% 0.1% Thin20 2 Thick 1 2.1 0.50 0.009 0.003Medium 1 0.9 0.30 0.007 0.0021.50% 0.2% Thin15 2 Thick 1 2.0 0.55 0.009 0.003Medium 1 0.8 0.33 0.006 0.0021.30% 0.5% Thin5 1 Thick 1 2.1 0.72 0.019 0.006Medium0.03% 0.02% Thin103
Bamboo (50× 20 m width, 100×100m or 250×250 m plot and circumference at 30 cmabove ground.)(a)North-East Corner (50×20m width or 0.1 ha plot or 100×100m, or 250×250 m): Nil1 Number of rosettes in the plot % Cover=2 Rosettes circumference (m) + + + + + + + Avg.=3 Number of culms in rosettes + + + + + + + Avg.=S.NoSpecies /RosettesGirthclassNo. of culmsin rosettes1 2 3Girth ofCulms (cm)1 2 3Height (m)Fresh(gm)WeightDry Weight(gm)1 2 31 2 31 Thick + + + + + + + + + +Medium + + + + + + + + + +Thin + + + + + + + + + +2 Thick + + + + + + + + + +Medium + + + + + + + + + +Thin + + + + + + + + + +(b) South-West Corner (50×20 m width or 0.1 ha plot or 100×100m or 250×250 m): Nil1 Number of rosettes in the plot % Cover=2 Rosettes circumference (m) + + + + + + + Avg.=3 Number of culms in rosettes + + + + + + + Avg.=S.NoSpecies /RosettesGirthclassNo. of culmsin rosettes1 2 3Girth ofCulms (cm)1 2 3Height (m)Fresh(gm)WeightDry Weight(gm)1 2 31 2 31 Thick + + + + + + + + + +Medium + + + + + + + + + +Thin + + + + + + + + + +2 Thick + + + + + + + + + +Medium + + + + + + + + + +Thin + + + + + + + + + +104
(a) Herb 1 (1×1 m) (recorded epiphytes/lithophytes/climbers etc. also) Took freshweight in all plots and if the cover is similar then selected only one sample from a plot fordrying and weighing.In 1×1 m: Fresh weight: 0.138 gm Dry Weight: 0.059 gm % Cover: 81 %S.No. SpeciesNo. of individuals1 Naregamia alata 42 Mimosa pudica 83 Mitracarpus hirtus 184 Desmodium triflorum 125 Justicia japonica 46 Axonopus compressus 87 Biophytum sensitivum var. sensitivum 58 Hemidesmus indicus var. indicus 19 Selaginella Sp. 610 Adiantum Sp. 111 Synedrella nodiflora 212 Peperomia pellucida 3(b) Herb 2 (1×1 m) (recorded epiphytes/lithophytes/climbers etc. also)In 1×1 m: Fresh weight: 0.130 gm Dry Weight: 0.057 gm % Cover: 80 %S.No. SpeciesNo. of individuals1 Mimosa pudica 42 Biophytum sensitivum var. sensitivum 33 Axonopus compressus 624 Desmodium triflorum 105 Mitracarpus hirtus 126 Cyathula prostrata 27 Justicia japonica 38 Brassica juncea 39 Cyperus rotundus ssp. rotundus 410 Commelina benghalensis 211 Ageratum conyzoides 312 Synedrella nodiflora 4105
(c) Herb 3 (1×1 m) (recorded epiphytes/lithophytes/climbers etc. also)In 1×1 m: Fresh weight: 0.125 gm Dry Weight: 0.055 gm % Cover: 79 %S.No. SpeciesNo. of individuals1 Axonopus compressus 482 Desmodium triflorum 223 Selaginella Sp. 44 Cyathula prostrata 35 Commelina benghalensis 86 Ageratum conyzoides 27 Mimosa pudica 48 Cyperus rotundus ssp. rotundus 189 Synedrella nodiflora 210 Hemidesmus indicus var. indicus 3Litter in four plots of 1×1 m laid randomly – leaves + twigs+ branches+ fruits+ etc.Plots Twigs+ Branches + Leaves(gm) Humus (gm) TotalFresh Dry Fresh Dry Fresh Dry(a) NE 0.139 0.101 0.041 0.032 0.180 0.133(b) NW 0.148 0.108 0.032 0.025 0.180 0.133(c) SW 0.126 0.092 0.028 0.022 0.154 0.114(d) SE 0.130 0.095 0.025 0.019 0.155 0.114(e) Center106
Status of <strong>Forest</strong> VegetationPlot No. 1. Udayakara (Wayanad)PROFORMA FOR FIELD DATA COLLECTION FOREST ECOSYSTEMSCATEGORY 1: SITE AND OBSERVERState: <strong>Kerala</strong> District: Wayanad Plot GPS Point Name: UdayakaraLocation/<strong>Forest</strong> division/Range/Compartment or any landmark: Wayanad South Division,Chedleth range, Pathiri RFSite Centre GPS co-ordinates: Lat. 11º 50' 6.141" Long. 76º 8' 33.823"Sample Site-/Plot No.: 02/01 /NE/NW/SW/SE Date: 23/02/ 2010 Time: 10.00amG.P.S. Reading (HHDD: MM:SS and WGS 84): Lat 10º 50' 7.914" Long: 76º 8' 37.211"Observer: Deepu DivakaranAltitude: Site/Plot: 730 mMarking on image: (Google/1:25,000 or larger) (Tonal characteristics on FCC)Slope (°): 8° Photograph Number: 110-0374 to 110-0383Aspect : SETopography General Observations: Almost flat with slight slopCATEGORY 2: FOREST AND SOIL- GENERAL:<strong>Forest</strong> Type: Moist deciduousNumber of storey and description: 03Top canopy species (Leaves/No leaves): Tectona grandis, Anogeissus latifolia1 st storey species (Leaves): Butea monosperma, Canthium travancoricum, Cipadessa bacciferaSecond storey species (Leaves/No leaves): Glycosmis pentaphylla, Chromolaena odorataRegeneration – only tree species (in general - very good, good and poor): GoodDisturbance evidence (Lopping/cutting/cattle sighting/hoof marks/dung/fire/ etc.): NilWildlife evidence (Sighting/pug marks/droppings/horns/sound/burrows): Sighting-ElephantGrass Cover (%): 80% Ground Cover (overall % including grasses): 90%Stoniness (pebbles/boulders %): 0% Rock Out-crop (%): 0%Soil Type: <strong>Forest</strong> Soil Colour: Pale Brown Soil Texture: MediumLitter thickness: 9 cm Humus Colour: Brown Humus thickness: 1 cm107
Depth (m)Bulk Density(kg/m 3 )Organic carbon(%)<strong>Carbon</strong> mass(kg/m 2 )0.00-0.30 0.0214 7.36600.30-0.60 0.0104 3.99000.60-1.00 0.0086 4.472015.73775CATEGORY 3: QUANTITATIVE MEASUREMENTSCrown Density (%) (make a small hole in leaf/paper and count sky or crown cover hits and steps,count which is ever is less in count across both diagonals): NE-SW: Steps: 40 Hits: 31 (Canopy/Sky)NW-SE: Steps: 40 Hits: 30 (Canopy/Sky)Stand height (m) (average from 4 trees of top and 4 of 1 st canopy): Top: 35 + 36 + 35 + 39 = 36.25at base of ultimate branch forking 1 st : 15 + 12 + 09 + 08 = 11Size of Quadrat for Trees (31.62×31.62 m i.e. 0.1 ha)/ Scrub (10×10 m –pl. take more plots)Tree Species Gbh (≥ 10 Height (m) Height (m) Leaf (L)/id.cm) all 1 st forking at ultimate No-leafplantsforking (NL)1 Tectona grandis 94.80 12.00 15.00 L2 Terminalia bellirica 145.50 28.00 35.00 L3 Terminalia elliptica 185.50 15.00 30.00 L4 Tectona grandis 195.00 30.00 35.00 L5 Terminalia bellirica 56.50 _ 8.00 L6 Tectona grandis 116.00 7.00 22.00 L7 Lagerstroemia microcarpa 18.00 _ 7.00 NL8 Briedelia retusa 195.90 13.00 26.00 L9 Terminalia elliptica 27.00 6.00 7.00 L10 Butea monosperma 27.00 _ 15.00 L11 Holarrhena pubescens 16.70 1.75 5.50 L12 Lagerstroemia microcarpa 19.50 4.00 7.00 L13 Tectona grandis 209.00 28.00 33.00 L14 Terminalia elliptica 137.20 30.00 35.00 L15 Kydia calycina 45.00 9.00 14.00 L16 Holarrhena pubescens 25.00 4.00 5.00 L17 Mallotus philippensis var. philippensis 41.50 3.00 7.00 L18 Grewia tiliifolia 39.80 10.00 12.00 L19 Canthium travancoricum 16.50 _ 4.00 L20 Aporosa cardiosperma 22.80 _ 3.00 L21 Stereospermum colais var. colais 11.50 _ 3.00 L22 Schleichera oleosa 12.40 2.25 4.00 L23 Lagerstroemia microcarpa 12.50 _ 3.50 L24 Canthium travancoricum 20.20 _ 7.00 NL25 Canthium travancoricum 13.00 2.00 4.00 L26 Canthium travancoricum 14.01 _ 2.50 L108
27 Canthium travancoricum 12.00 1.40 2.00 L28 Lagerstroemia microcarpa 32.00 6.00 7.50 L29 Cipadessa baccifera 27.10 3.00 7.00 L30 Holarrhena pubescens 43.00 _ 8.00 NL31 Cipadessa baccifera 11.20 2.50 4.00 L32 Holarrhena pubescens 29.00 3.00 5.00 NL33 Holarrhena pubescens 27.00 1.75 6.00 L34 Pterocarpus marsupium 313.00 14.00 29.00 L35 Hydnocarpus alpina 108.50 2.00 14.00 L36 Cipadessa baccifera 14.20 2.25 4.00 L37 Diospyros nilagirica 12.00 _ 3.50 L38 Cipadessa baccifera 15.00 1.50 3.50 L39 Pajanelia longifolia 12.10 _ 5.00 L40 Stereospermum colais var. colais 14.00 1.50 4.50 L41 Briedelia retusa 21.50 3.25 8.00 L42 Cipadessa baccifera 39.40 2.00 5.50 L43 Cassia fistula 11.00 2.30 5.00 L44 Canthium travancoricum 27.00 _ 9.00 L45 Cipadessa baccifera 12.50 2.00 3.25 NL46 Mallotus philippensis var. philippensis 15.50 3.50 6.00 L47 Canthium travancoricum 17.50 2.25 7.00 NL48 Canthium travancoricum 18.40 6.50 8.00 L49 Canthium travancoricum 12.80 2.00 4.00 L50 Terminalia bellirica 81.00 14.00 26.00 L51 Anogeissus latifolia 101.80 26.00 30.00 L52 Lagerstroemia microcarpa 308.00 29.00 39.00 L53 Tectona grandis 96.80 12.00 14.00 L54 Tectona grandis 309.80 2.25 36.00 L55 Canthium travancoricum 10.00 _ 4.50 L56 Canthium travancoricum 12.00 _ 5.00 L57 Tectona grandis 241.00 23.00 36.00 L58 Stereospermum colais var. colais 15.00 1.50 5.50 NL59 Canthium travancoricum 14.00 _ 3.50 L60 Canthium travancoricum 26.00 8.00 10.00 L109
(1) Shrubs (North-East) Size: 5 × 5 m (girth at 30 cm above base) (Please bring representative stem ofall shrub species either entire stem or pieces of 15 cm long from base, middle and top of the tiller)Girth class e.g.: Thick ≥15 cm, Medium 7-
(a) Tree Saplings (North-East) 5× 5 m plot (>10 cm tall and/or girth 3 to 10 cm tall and/or girth 3 to
(c) Herb 3 (NW) (1× 1 m) (record epiphytes/lithophytes/climbers etc. also)In 1×1 m: Fresh weight: 0.102 gm Dry Weight: 0.050 gm % Cover: 89%Sl.No. SpeciesNo. ofindividuals1 Elephantopus scaber 42 Synedrella nodiflora 23 Alloteropsis cimicina 24 Ageratum conyzoides 35 Senna tora 2(d) Herb 4 (SE) (1× 1 m) (record epiphytes/lithophytes/climbers etc. also)In 1×1 m: Fresh weight: 0.089 gm Dry Weight: 0.043 gm % Cover: 86%Sl.No. SpeciesNo. ofindividuals1 Ageratum conyzoides 22 Synedrella nodiflora 23 Justicia japonica 34 Alloteropsis cimicina 35 Senna tora 2(e) Herb 5 (Center) (1× 1 m) (record epiphytes/lithophytes/climbers etc. also)In 1×1 m: Fresh weight: 0.091 gm Dry Weight: 0.044 gm % Cover: 87%Sl.No. SpeciesNo. ofindividuals1 Cyathula prostrata 22 Elephantopus scaber 23 Justicia japonica 34 Alloteropsis cimicina 35 Cyperus rotundus 8Litter and humus: 5 plots of 1×1 m (Litter is fresh and hard leaves/ twigs/branches/fruits & humus is softbeneath litter) Please take fresh weight of all, and for dry weight bring one sample from each plot ifhomogeneous or 2 if heterogeneous strata.PlotsTwigs + Branches(gm) Leaves (gm) Humus (gm) TotalFresh Dry Fresh Dry Fresh Dry Fresh DryNE 0.209 0.205 0.126 0.118 0.008 0.004 0.343 0.327NW 0.128 0.121 0.097 0.09 0.024 0.018 0.249 0.229SW 0.193 0.187 0.107 0.099 0.057 0.045 0.357 0.331SE 0.098 0.093 0.201 0.196 0.043 0.031 0.342 0.320Center 0.021 0.019 0.221 0.213 0.127 0.116 0.369 0.348112
Plot 2: Madal 1. (Wayanad)PROFORMA FOR FIELD DATA COLLECTION FOREST ECOSYSTEMSCATEGORY 1: SITE AND OBSERVERState: <strong>Kerala</strong> District: Wayanad Plot GPS Point Name = Madal (1)Location/<strong>Forest</strong> division/Range/Compartment or any landmark: Wayanad South Division, Chedleth range,Pathiri RFSite Centre GPS co-ordinates: Lat. 11º 50' 6.141" Long. 76º 8' 33.823"Sample Site-/Plot No.: 02/02 /NE/NW/SW/SE Date: 17/03/ 2010 Time: 8.00 amG.P.S. Reading (HHDD: MM:SS and WGS 84): Lat. 11º 50' 6.864" Long. 76º 8' 1.392"Observer: Deepu DivakaranAltitude: Site/Plot: 750mMarking on image: (Google/1:25,000 or larger)(Tonal characteristics on FCC)Slope (°): 30Photograph Number:Aspect : NW Topography General Observations): Hilly with, moderate slopCATEGORY 2: FOREST AND SOIL- GENERAL:<strong>Forest</strong> Type: Moist deciduousNumber of storeys and description: 03Top canopy species: Pterocarpus marsupium, Lagerstroemia microcarpa, Terminalia ellipticaFirst storey species: Wrightia tinctoria, Canthium travancoricum, Bambusa bambosSecond storey species: Cipadessa baccifera, Glycosmis pentaphylla, Chromolaena odorataRegeneration – only tree species (in general - very good, good and poor): GoodDisturbance evidence (Lopping/cutting/cattle sighting/hoof marks/dung/fire/ etc.): Cattle sightingWildlife evidence (Sighting/pug marks/droppings/horns/sound/burrows): Dung & sound of ElephantGrass Cover (%): 60% Ground Cover (overall % including grasses): 80%Stoniness (pebbles/boulders %):0%, Rock Out-crop (%):0%, Soil Type: <strong>Forest</strong> SoilSoil Colour: BrownSoil Texture: FineLitter thickness: 5 cm Humus Colour: Brown Humus thickness: 1.5 cmDepth (m)Bulk Density(kg/m 3 )Organic carbon(%)<strong>Carbon</strong> mass(kg/m 2 )0.00-0.30 0.0193 6.71640.30-0.60 0.0100 3.5100.60-1.00 0.0080 4.032014.25840113
CATEGORY 3: QUANTITATIVE MEASUREMENTSCrown Density (%) (make a small hole in leaf/paper and count sky or crown cover hits and steps, count whichis ever is less in count across both diagonals): NE-SW: Steps: 40 Hits: 29 (Canopy)NW-SE: Steps: 40 Hits: 38 (Canopy)Stand height (m) (average from 4 trees of top and 4 of 1 st canopy): Top: 30 + 29 + 31 + 28 = 29.5at base of ultimate branch forking 1 st : 11 + 10 + 09 + 10 = 10Size of Quadrat for Trees (31.62×31.62 m i.e. 0.1 ha)/ Scrub (10×10 m –pl. take more plots)(a) Pl. use steel measuring tape; (b) for gbh at 1.37m from ground make sticks of 1.37 m to fix the height; inplains from any direction but on slopes from upper side; (c) fix the metallic tag at the base of the treepreferably concealed and hide with stones) –gbh up to mm level.Treeid.Species Gbh (≥10 cm) allplants114Height (m)1 st forkingHeight (m) atultimateforking1 Lagerstroemia microcarpa 20.10 6.00 6.50 NL2 Lagerstroemia microcarpa 20.70 6.50 7.50 NL3 Helicteres isora 18.40 3.00 5.00 L4 Wrightia tinctoria 21.50 3.00 4.50 L5 Wrightia tinctoria 26.00 2.50 5.50 L6 Wrightia tinctoria 14.00 1.75 3.00 L7 Cipadessa baccifera 10.00 1.90 3.50 L8 Canthium coromandelicum 17.60 2.00 3.25 L9 Helicteres isora 14.60 3.00 5.50 L10 Tectona grandis 34.80 7.50 10.00 L11 Melicope lunu-ankenda 21.50 _ 5.00 L12 Spathodea campanulata 42.70 _ 15.00 L13 Lagerstroemia microcarpa 16.30 _ 5.00 NL14 Helicteres isora 10.00 2.00 3.00 L15 Canthium coromandelicum 27.00 _ 5.00 L16 Grewia tiliifolia 149.60 14.00 23.00 L17 Canthium coromandelicum 87.50 1.80 8.00 L18 Canthium coromandelicum 42.50 4.50 11.00 L19 Olea dioica 35.20 _ 7.00 L20 Lagerstroemia microcarpa 30.80 _ 12.00 NL21 Diospyros nilagirica 45.00 _ 9.00 L22 Canthium coromandelicum 10.10 1.50 3.50 L23 Wrightia tinctoria 18.60 _ 3.00 NL24 Radermachera sp. 110.90 10.00 18.00 L25 Canthium coromandelicum 14.00 4.00 6.00 L26 Helicteres isora 21.20 _ 2.00 L27 Aporosa cardiosperma 13.20 _ 5.00 L28 Flacourtia montana 15.00 _ 6.00 L29 Lagerstroemia microcarpa 50.70 16.00 3.50 L30 Wrightia tinctoria 11.00 _ 2.50 L31 Lagerstroemia microcarpa 51.00 _ 16.00 NL32 Lagerstroemia microcarpa 27.70 _ 8.00 NL33 Cipadessa baccifera 12.90 _ 4.00 LLeaf (L)/No-leaf(NL)
34 Canthium coromandelicum 17.10 _ 3.00 L35 Canthium coromandelicum 18.70 _ 3.00 L36 Wrightia tinctoria 30.70 1.80 3.50 L37 Wrightia tinctoria 12.30 1.45 2.00 L38 Helicteres isora 22.50 _ 3.50 L39 Pterocarpus marsupium 170.00 6.50 30.00 L40 Wrightia tinctoria 24.50 5.00 7.00 L41 Lagerstroemia microcarpa 18.30 2.00 6.50 NL42 Canthium coromandelicum 13.50 _ 2.00 L43 Trichilia connaroides 169.50 11.00 17.00 L44 Lagerstroemia microcarpa 14.00 _ 3.40 NL45 Diospyros nilagirica 13.80 _ 5.00 L46 Trichilia connaroides 223.00 6.50 15.00 L47 Wrightia tinctoria 18.50 1.65 4.00 L48 Canthium coromandelicum 19.10 _ 5.00 L49 Tectona grandis 24.10 _ 4.50 L50 Wrightia tinctoria 19.70 3.50 4.50 L51 Alstonia scholaris 167.50 13.00 21.00 L52 Helicteres isora 30.50 1.90 6.00 L53 Wrightia tinctoria 27.50 _ 2.00 L54 Wrightia tinctoria 20.50 _ 1.80 L55 Cipadessa baccifera 15.60 1.90 6.00 L56 Trichilia connaroides 113.50 4.00 12.00 L57 Canthium coromandelicum 13.20 2.25 5.00 L58 Canthium coromandelicum 11.60 2.20 5.50 L59 Melicope lunu-ankenda 17.40 _ 5.00 L60 Canthium coromandelicum 19.90 4.00 6.50 L61 Wrightia tinctoria 39.00 _ 7.50 L62 Terminalia paniculata 201.20 17.00 25.00 L63 Terminalia elliptica 124.90 5.00 11.00 L64 Wrightia tinctoria 17.50 _ 2.50 L65 Wrightia tinctoria 41.50 6.00 8.00 L66 Wrightia tinctoria 50.70 5.00 10.00 L67 Wrightia tinctoria 73.40 4.50 10.00 L68 Wrightia tinctoria 25.20 2.25 5.50 L69 Wrightia tinctoria 18.70 _ 4.00 L70 Diospyros nilagirica 12.00 _ 3.00 L71 Wrightia tinctoria 16.60 3.00 6.00 L72 Wrightia tinctoria 10.30 4.00 5.00 L73 Wrightia tinctoria 17.80 3.00 5.00 L74 Cassia fistula 11.50 _ 4.00 L75 Holarrhena pubescens 16.90 2.00 4.00 L76 Canthium coromandelicum 12.20 _ 5.00 L77 Canthium coromandelicum 11.50 1.50 2.50 L78 Helicteres isora 12.50 _ 3.50 L79 Wrightia tinctoria 10.20 _ 5.00 L80 Wrightia tinctoria 87.00 1.50 12.00 L81 Wrightia tinctoria 10.10 _ 3.50 L82 Helicteres isora 13.50 _ 3.50 L83 Helicteres isora 11.60 2.50 4.00 L84 Helicteres isora 20.60 4.00 5.50 L115
85 Helicteres isora 14.60 4.50 6.50 L86 Wrightia tinctoria 132.50 5.50 11.00 L87 Wrightia tinctoria 19.60 4.25 6.00 L88 Canthium coromandelicum 12.60 2.00 4.00 L89 Canthium coromandelicum 11.70 2.75 3.50 L90 Radermachera xylocarpa 80.20 1.90 7.00 L91 Wrightia tinctoria 13.40 3.00 4.50 L92 Wrightia tinctoria 17.20 _ 3.50 L93 Wrightia tinctoria 29.40 4.50 7.50 L94 Wrightia tinctoria 16.70 _ 7.00 L95 Wrightia tinctoria 12.00 _ 3.50 L96 Lagerstroemia microcarpa 13.40 _ 4.00 NL97 Holarrhena pubescens 17.00 2.00 3.00 L98 Spathodea campanulata 46.20 _ 10.00 L99 Kydia calycina 24.90 3.50 6.00 L100 Canthium coromandelicum 12.00 _ 4.50 L101 Helicteres isora 18.50 2.00 6.00 L102 Grewia tiliifolia 165.00 8.00 15.00 L103 Stereospermum colais var. colais 23.10 1.80 6.00 L104 Stereospermum colais var. colais 19.60 2.50 5.50 L105 Callicarpa tomentosa 12.00 _ 2.00 L106 Holarrhena pubescens 21.30 5.00 6.50 L107 Ficus exasperata 45.00 5.50 10.00 L108 Canthium coromandelicum 15.50 1.50 5.00 L109 Lagerstroemia microcarpa 18.20 4.25 6.00 NL110 Naringi crenulata 29.00 _ 6.20 L111 Naringi crenulata 28.50 2.30 5.20 L112 Cassia fistula 30.10 1.90 6.00 L113 Stereospermum colais var. colais 219.30 10.00 27.00 L114 Canthium coromandelicum 19.70 1.75 3.00 L115 Wrightia tinctoria 47.80 _ 10.00 L116 Wrightia tinctoria 14.60 _ 3.00 L117 Wrightia tinctoria 13.30 _ 3.00 L118 Wrightia tinctoria 15.50 1.90 5.00 L119 Lagerstroemia microcarpa 38.50 5.80 7.50 NL120 Diospyros nilagirica 15.60 2.00 4.00 NL121 Canthium coromandelicum 15.50 1.80 6.00 L(1) Shrubs (North-East) Size: 5 × 5 m (girth at 30 cm above base) (Please bring representative stem of allshrub species either entire stem or pieces of 15 cm long from base, middle and top of the tiller) Girth classe.g.: Thick ≥15 cm, Medium 7-
Bamboo (plot size 0.1 ha) (circumference to be taken about 30 cm above ground)1 Number of rosettes in the plot = % Cover=2 Rosettes circumference (m) + + + + + + + Avg.=3 Number of culms in rosettes + + + + + + + Avg.=Girth Class: e.g. thick (>20), medium (>10-≤20) and thin (≤10) cm. Please collect three samples of 30 cmlong for each girth class of culms from base, middle and upper part of the same culms.(a) Herb 1 (1× 1 m) (record epiphytes/lithophytes/climbers etc. also). Take fresh observations and weight ofall, and for dry weight bring one sample if homogeneous or 2 if heterogeneous.In 1×1 m: Fresh weight: ……… gm Dry Weight: …………gm % Cover: ……………(b) Herb 2 (1× 1 m) (record epiphytes/lithophytes/climbers etc. also)In 1×1 m: Fresh weight: ……… gm Dry Weight: …………gm % Cover: ……………(c) Herb 3 (1× 1 m) (record epiphytes/lithophytes/climbers etc. also)In 1×1 m: Fresh weight: ……… gm Dry Weight: …………gm % Cover: ……………(d) Herb 4 (1× 1 m) (record epiphytes/lithophytes/climbers etc. also)In 1×1 m: Fresh weight: ……… gm Dry Weight: …………gm % Cover: ……………(e) Herb 5 (1× 1 m) (record epiphytes/lithophytes/climbers etc. also)In 1×1 m: Fresh weight: ……… gm Dry Weight: …………gm % Cover: ……………Number of dead/dry, stumps of trees /cut but live (0.1 ha plot)Litter and humus: 5 plots of 1×1 m (Litter is fresh and hard leaves/ twigs/branches/fruits & humus is softbeneath litter) Please take fresh weight of all, and for dry weight bring one sample from each plot ifhomogeneous or 2 if heterogeneous strata.117
Plot 3: Madal (2). WayanadPROFORMA FOR FIELD DATA COLLECTION FOREST ECOSYSTEMSCATEGORY 1: SITE AND OBSERVERState: <strong>Kerala</strong> District: Wayanad Plot GPS Point Name = Madal (2)Location/<strong>Forest</strong> division/Range/Compartment or any landmark:Site Centre GPS co-ordinates: Lat. 11º 49'8.712" Long. 76º 09' 35.253"Sample Site-/Plot No.: /NE/NW/SW/SE Date: 18/03/ 2010 Time: 10 amG.P.S. Reading (HHDD: MM:SS and WGS 84): Lat. 11º51'5.421"Long. 76º 09' 32.223"Observer: Deepu DivakaranAltitude: Site/Plot: 740 m / mMarking on image: (Google/1:25,000 or larger)(Tonal characteristics on FCC)Slope (°): 35Photograph Number:Aspect : N/E/S/W/NE/SE/SW/NW Topography General observations): HillyCATEGORY 2: FOREST AND SOIL- GENERAL:<strong>Forest</strong> Type: Moist DeciduousNumber of storeys and description: 3Top canopy species (Leaves/No leaves): Tectona, Dalbergia, Terminalia paniculata, WeldeniacordifoliaFirst storey species (Leaves/No leaves): Canthium, Syzigium, Wrightia, BambooSecond storey species (Leaves/No leaves): Glycosmis, CepadessaRegeneration – only tree species (in general - very good, good and poor): GoodDisturbance evidence (Lopping/cutting/cattle sighting/hoof marks/dung/fire/ etc.): Cattle sightingWildlife evidence (Sighting/pug marks/droppings/horns/sound/burrows): SoundGrass Cover (%): 60 Ground Cover (overall % including grasses): 80Stoniness (pebbles/boulders %): 0.01 Rock Out-crop (%): 0Soil Type: <strong>Forest</strong> soil Soil Colour: Brown Soil Texture: FineLitter thickness: 5cm Humus Colour: Brown Humus thickness: 1cm118
Depth (m)Bulk Density(kg/m 3 )Organic carbon(%)<strong>Carbon</strong> mass(kg/m 2 )0.00-0.30 0.0205 7.45400.30-0.60 0.0132 5.14800.60-1.00 0.0045 2.376014.97803CATEGORY 3: QUANTITATIVE MEASUREMENTSCrown Density (%) (make a small hole in leaf/paper and count sky or crown cover hits and steps,count which is ever is less in count across both diagonals): NE-SW: Steps:Hits:(Canopy/Sky)NW-SE: Steps:Hits:(Canopy/Sky)Stand height (m) (average from 4 trees of top and 4 of 1 st canopy): Top: + + + =at base of ultimate branch forking 1 st : + + + =Size of Quadrat for Trees (31.62×31.62 m i.e. 0.1 ha)/ Scrub (10×10 m –pl. take more plots)(a) Pl. use steel measuring tape; (b) for gbh at 1.37m from ground make sticks of 1.37 m to fix theheight; in plains from any direction but on slopes from upper side; (c) fix the metallic tag at the baseof the tree preferably concealed and hide with stones) –gbh up to mm level.Treeid.Species Gbh (≥10 cm)allplants119Height(m)1 stforkingHeight (m)at ultimateforking1 Wrightia tinctoria 23.50 3.50 5.00 L2 Wrightia tinctoria 34.20 _ 7.50 L3 Haldina cordifolia 131.20 11.00 45.00 L4 Canthium coromandelicum 21.90 2.25 3.50 L5 Lagerstroemia microcarpa 41.20 8.00 11.00 L6 Canthium coromandelicum 15.50 _ 3.50 L7 Canthium coromandelicum 13.10 _ 2.75 L8 Canthium coromandelicum 17.50 _ 4.50 L9 Wrightia tinctoria 14.50 _ 5.00 L10 Canthium coromandelicum 16.10 _ 3.00 L11 Canthium coromandelicum 10.10 _ 2.50 L12 Syzygium cumini var. cumini 18.90 4.50 5.50 L13 Canthium coromandelicum 14.00 2.00 5.50 L14 Canthium coromandelicum 10.00 2.00 3.00 L15 Anogeissus latifolia 12.00 _ 4.60 L16 Tectona grandis 82.50 10.00 13.00 L17 Butea monosperma 48.00 2.00 3.50 L18 Canthium coromandelicum 15.60 1.75 3.00 LLeaf(L)/ Noleaf(NL)
19 Lagerstroemia microcarpa 25.90 _ 7.50 L20 Phyllanthus emblica 63.90 3.00 9.00 L21 Tectona grandis 118.00 5.00 13.00 L22 Dalbergia sissoides 131.50 17.00 26.50 L23 Lagerstroemia microcarpa 63.20 12.00 15.00 L24 Canthium coromandelicum 15.40 _ 7.00 L25 Canthium coromandelicum 10.80 3.50 4.25 L26 Canthium coromandelicum 20.00 _ 2.50 L27 Canthium coromandelicum 10.70 _ 2.00 L28 Canthium coromandelicum 19.00 1.30 5.00 L29 Lagerstroemia microcarpa 29.50 7.00 8.50 L30 Spathodea campanulata 109.20 15.00 17.00 L31 Lagerstroemia microcarpa 33.40 9.00 9.50 L32 Canthium coromandelicum 15.00 _ 6.00 L33 Canthium coromandelicum 12.00 _ 6.00 L34 Canthium coromandelicum 17.50 _ 5.00 L35 Haldina cordifolia 36.80 6.00 7.50 NL36 Canthium coromandelicum 34.20 2.00 7.80 L37 Canthium coromandelicum 13.20 _ 6.00 L38 Canthium coromandelicum 14.20 _ 3.50 L39 Cipadessa baccifera 14.00 _ 3.50 L40 Spathodea campanulata 26.50 _ 3.00 L41 Spathodea campanulata 93.20 12.50 13.50 L42 Glycosmis pentaphylla 13.00 _ 3.00 L43 Dalbergia sissoides 50.00 2.20 9.50 L44 Lagerstroemia microcarpa 15.50 2.50 4.50 L45 Canthium coromandelicum 15.20 1.50 5.60 L46 Spathodea campanulata 34.70 2.25 3.25 L47 Canthium coromandelicum 14.50 _ 5.00 L48 Canthium coromandelicum 15.50 _ 4.00 L49 Cipadessa baccifera 12.70 1.75 3.00 L50 Canthium coromandelicum 19.70 _ 6.00 L51 Canthium coromandelicum 16.00 _ 3.50 L52 Helicteres isora 23.10 3.50 6.00 L53 Canthium coromandelicum 16.50 _ 2.10 L54 Canthium coromandelicum 21.20 4.25 5.50 L55 Canthium coromandelicum 16.00 _ 1.40 L56 Canthium coromandelicum 17.00 1.50 5.00 L57 Canthium coromandelicum 16.20 _ 4.00 L58 Lagerstroemia microcarpa 19.70 5.00 6.50 NL59 Canthium coromandelicum 19.00 1.40 4.10 L60 Canthium coromandelicum 18.90 1.90 6.00 L61 Wrightia tinctoria 15.50 _ 4.50 L62 Canthium coromandelicum 18.20 1.60 5.50 L63 Canthium coromandelicum 19.00 _ 6.50 L64 Tectona grandis 312.10 12.00 19.00 L65 Canthium coromandelicum 18.50 _ 3.50 L120
66 Canthium coromandelicum 28.00 3.00 11.00 L67 Canthium coromandelicum 11.00 2.50 4.00 L68 Canthium coromandelicum 11.20 4.00 5.00 L69 Cassia fistula 16.50 3.50 5.00 NL70 Canthium coromandelicum 15.00 2.00 4.00 L71 Canthium coromandelicum 12.70 1.90 3.50 L72 Canthium coromandelicum 22.00 1.90 6.00 L73 Canthium coromandelicum 17.90 1.95 6.00 L74 Canthium coromandelicum 17.50 1.90 4.00 L75 Canthium coromandelicum 13.00 _ 4.50 L76 Dalbergia sissoides 396.50 20.00 45.00 L77 Tectona grandis 128.60 11.00 14.00 L78 Tectona grandis 173.50 12.50 19.00 L79 Canthium coromandelicum 16.90 2.75 4.50 L80 Canthium coromandelicum 21.30 3.75 5.50 L81 Canthium coromandelicum 20.40 1.45 7.50 L82 Canthium coromandelicum 24.50 3.00 5.80 L83 Canthium coromandelicum 14.70 _ 3.50 L84 Cipadessa baccifera 38.90 1.95 5.00 L85 Lagerstroemia microcarpa 364.50 14.00 28.00 L86 Canthium coromandelicum 11.70 2.00 3.50 L87 Canthium coromandelicum 11.30 1.80 3.00 L88 Canthium coromandelicum 17.60 _ 6.00 L(1) Shrubs (North-East) Size: 5 × 5 m (girth at 30 cm above base) (Please bringrepresentative stem of all shrub species either entire stem or pieces of 15 cm longfrom base, middle and top of the tiller) Girth class e.g.: Thick ≥15 cm, Medium 7-
(2) Shrubs (South-West) Size = 5× 5 m (girth at 30 cm above base)Specie No. of Number of tillers Girth/Diam. Height (m) Fresh Dry Weights/ bush bushes and in 3 bushes of each (cm)Weight (gm)% cover species(gm)0.1h 5×5 Bush No. 1 2 1 2 1 2 1 2 1 2a m 3333 3Thick + + + + + + + + + +Mediu + + + + + + + + + +mThin + + + + + + + + + +Thick + + + + + + + + + +Mediu + + + + + + + + + +mThin + + + + + + + + + +(a) Tree Saplings (North-East) 5× 5 m plot (>10 cm tall and/or girth 3 to 10 cm tall and/or girth 3 to
Bamboo (plot size 0.1 ha) (circumference to be taken about 30 cm above ground)1 Number of rosettes in the plot = % Cover=2 Rosettes circumference (m) + + + + + + + Avg.=3 Number of culms in rosettes + + + + + + + Avg.=Girth Class: e.g. thick (>20), medium (>10-≤20) and thin (≤10) cm. Please collect three samples of30 cm long for each girth class of culms from base, middle and upper part of the same culms.S.NoGirthclassNo.culmsofinHeight(m)Fresh Weight(gm)Dry WeightSpecies /Rosettesrosettes1 2 3Girth ofCulms(cm)1 2 31 2 31 2 3(gm)1 2 31 Thick + + + + + + + + + +Medium + + + + + + + + + +Thin + + + + + + + + + +2 Thick + + + + + + + + + +Medium + + + + + + + + + +Thin + + + + + + + + + +(a) Herb 1 (1× 1 m) (record epiphytes/lithophytes/climbers etc. also). Take fresh observations andweight of all, and for dry weight bring one sample if homogeneous or 2 if heterogeneous.In 1×1 m: Fresh weight: ……… gm Dry Weight: …………gm % Cover: …S.No. Species No. ofindividualsS.No. Species No. ofindividuals1 72 83 94 105 116 12(b) Herb 2 (1× 1 m) (record epiphytes/lithophytes/climbers etc. also)In 1×1 m: Fresh weight: ……… gm Dry Weight: …………gm % Cover: ………S.No. Species No. ofindividualsS.No. Species No. ofindividuals1 72 83 94 105 116 12123
(c) Herb 3 (1× 1 m) (record epiphytes/lithophytes/climbers etc. also)In 1×1 m: Fresh weight: ……… gm Dry Weight: …………gm % Cover: ………S.No. Species No. ofindividualsS.No. Species No. ofindividuals1 72 83 94 105 116 12(d) Herb 4 (1× 1 m) (record epiphytes/lithophytes/climbers etc. also)In 1×1 m: Fresh weight: ……… gm Dry Weight: …………gm % Cover: ……………S.No. Species No. ofindividualsS.No. Species No. ofindividuals1 72 83 94 105 116 12(e) Herb 5 (1× 1 m) (record epiphytes/lithophytes/climbers etc. also)In 1×1 m: Fresh weight: ……… gm Dry Weight: …………gm % Cover: ……………S.No. Species No. ofindividualsS.No. Species No. ofindividuals1 72 83 94 105 116 12Number of dead/dry, stumps of trees /cut but live (0.1 ha plot)S.No.Species Dead StumpsNos. Girth (Cm) Height (m) Nos. Girth (cm) Height (m)1 + + + + + + + + + + + +2 + + + + + + + + + + + +3 + + + + + + + + + + + +124
Litter and humus: 5 plots of 1×1 m (Litter is fresh and hard leaves/ twigs/branches/fruits & humusis soft beneath litter) Please take fresh weight of all, and for dry weight bring one sample from eachplot if homogeneous or 2 if heterogeneous strata.Plots Twigs+ Branches (gm) Leaves (gm) Humus (gm) TotalFresh Dry Fresh Dry Fresh Dry(a) NE(b) NW(c) SW(d) SE(e) Center125
Plot 4: Madal 3. (Wayanad)PROFORMA FOR FIELD DATA COLLECTION FOREST ECOSYSTEMSCATEGORY 1: SITE AND OBSERVERState: <strong>Kerala</strong> District: Wayanad Plot GPS Point Name = Madal (3)Location/<strong>Forest</strong> division/Range/Compartment or any landmark:Site Centre GPS co-ordinates: Lati. 11º 48' 6.234" Longi.76º 06' 30.184"Sample Site-/Plot No.: /NE/NW/SW /SE Date: 19/03/ 2010 Time: 08.00 amG.P.S. Reading (HHDD: MM:SS and WGS 84): Lati 11º 49' 4.810"Longi 76º 08' 2.841"Observer:Altitude: Site/Plot: 745 mMarking on image: (Google/1:25,000 or larger)(Tonal characteristics on FCC)Slope (°): 20°Photograph Number:Aspect : N/E/S/W/NE/SE/SW /NW Topography General observations):CATEGORY 2: FOREST AND SOIL- GENERAL:<strong>Forest</strong> Type: Moist deciduousNumber of storeys and description: 03Top canopy species (Leaves): Dalbergia latifolia, Terminalia crenulata, Lagerstroemia microcarpaFirst storey species (Leaves/No leaves): Swietenia macrophylla, Bambusa bambos, Wrightia tinctoriaSecond storey species (Leaves/No leaves): Cipadessa baccifera, Glycosmis pentaphyllaRegeneration – only tree species (in general - very good, good and poor): …Poor……………………Disturbance evidence (Lopping/Cutting/Cattle sighting/hoof marks/dung/fire/ etc.): ……..………Wildlife evidence (Sighting/pug marks/droppings/horns/sound/burrows): ...…………………….Grass Cover (%): 20Ground Cover (overall % including grasses):75Stoniness (pebbles/boulders %): 0 Rock Out-crop (%): 0Soil Type: <strong>Forest</strong> soil Soil Colour: Brown Soil Texture: FineLitter thickness: 5 cm Humus Colour: Brown Humus thickness: 1cmDepth (m)Bulk Density(kg/m 3 )Organic carbon(%)<strong>Carbon</strong> mass(kg/m 2 )0.00-0.30 0.0220 7.92000.30-0.60 0.0155 5.67300.60-1.00 0.0064 3.328016.92100126
CATEGORY 3: QUANTITATIVE MEASUREMENTSCrown Density (%) (make a small hole in leaf/paper and count sky or crown cover hits and steps,count which is ever is less in count across both diagonals): NE-SW: Steps: Hits: (Canopy/Sky)NW-SE: Steps: Hits: (Canopy/Sky)Stand height (m) (average from 4 trees of top and 4 of 1 st canopy): Top: + + + =At base of ultimate branch forking 1 st : + + + =Size of Quadrat for Trees (31.62×31.62 m i.e. 0.1 ha)/ Scrub (10×10 m –pl. take more plots)(a) Pl. use steel measuring tape; (b) for gbh at 1.37m from ground make sticks of 1.37 m to fix the height; inplains from any direction but on slopes from upper side; (c) fix the metallic tag at the base of the treepreferably concealed and hide with stones) –gbh up to mm level.Treeid.Species Gbh (≥10 cm)all plants127Height (m)1 st forkingHeight (m)at ultimateforking1 Terminalia paniculata 26.60 4.50 6.50 L2 Cipadessa baccifera 11.70 1.90 2.50 L3 Cipadessa baccifera 11.20 1.40 2.50 L4 Cipadessa baccifera 10.20 1.80 3.00 L5 Radermachera xylocarpa 60.10 6.00 16.00 L6 Oroxylum indicum 72.70 7.50 15.00 L7 Swietenia macrophylla 37.00 _ 12.00 L8 Diospyros montana 11.50 2.25 16.00 L9 Radermachera xylocarpa 14.50 4.70 6.30 L10 Canthium coromandelicum 27.20 1.90 5.00 L11 Terminalia crenulata 15.60 5.00 5.50 L12 Dalbergia latifolia 115.00 14.50 19.00 L13 Swietenia macrophylla 19.70 _ 9.00 L14 Cipadessa baccifera 16.80 _ 3.80 L15 Holarrhena pubescens 11.10 2.00 4.00 L16 Canthium coromandelicum 11.20 1.55 2.50 L17 Terminalia crenulata 46.30 1.95 2.00 L18 Diospyros montana 16.30 5.50 6.50 L19 Wrightia tinctoria 19.30 4.25 5.50 L20 Naringi crenulata 20.50 4.80 6.00 L21 Cipadessa baccifera 13.00 1.50 2.80 L22 Terminalia paniculata 14.50 4.00 5.50 NL23 Terminalia paniculata 14.70 5.00 4.50 NL24 Oroxylum indicum 22.60 _ 7.00 NL25 Terminalia paniculata 25.10 3.50 5.50 L26 Melicope lunu-ankenda 111.00 11.50 20.00 L27 Cipadessa baccifera 15.90 5.50 7.00 L28 Cipadessa baccifera 15.20 _ 3.50 L29 Terminalia paniculata 81.90 4.50 7.00 L30 Terminalia crenulata 173.20 2.00 20.50 L31 Cipadessa baccifera 11.90 _ 5.00 LLeaf (L)/No-leaf(NL)
32 Cipadessa baccifera 14.60 3.00 5.00 L33 Canthium coromandelicum 10.50 _ 3.70 L34 Cipadessa baccifera 10.70 _ 3.50 L35 Cipadessa baccifera 11.20 2.25 4.00 L36 Melicope lunu-ankenda 68.00 3.60 14.50 L37 Cipadessa baccifera 10.90 _ 3.00 L38 Cipadessa baccifera 13.50 _ 1.80 L39 Canthium coromandelicum 13.50 1.60 5.00 L40 Cipadessa baccifera 11.80 _ 2.50 L41 Cipadessa baccifera 11.20 _ 4.50 L42 Cipadessa baccifera 10.30 1.70 2.75 L43 Lagerstroemia microcarpa 68.60 11.50 18.50 L44 Naringi crenulata 19.80 1.60 5.00 L45 Radermachera xylocarpa 79.80 10.00 12.00 L46 Cipadessa baccifera 12.20 1.80 3.00 L47 Cipadessa baccifera 12.80 2.00 2.50 L48 Callicarpa tomentosa 13.90 3.00 6.00 L49 Schleichera oleosa 103.40 3.50 18.00 L50 Melicope lunu-ankenda 68.60 12.50 16.50 L51 Bauhinia sps. 61.80 1.40 6.00 L52 Melicope lunu-ankenda 99.80 11.00 18.00 L53 Dalbergia latifolia 133.50 8.00 24.00 L54 Cipadessa baccifera 12.20 _ 3.50 L55 Cipadessa baccifera 14.20 _ 4.00 L56 Haldina cordifolia 75.50 _ 16.00 L57 Lagerstroemia microcarpa 155.60 8.70 15.80 L58 Cipadessa baccifera 13.50 1.90 3.00 L59 Helicteres isora 17.50 1.90 3.00 L(1) Shrubs (North-East) Size: 5 × 5 m (girth at 30 cm above base) (Please bring representative stem of all shrubspecies either entire stem or pieces of 15 cm long from base, middle and top of the tiller) Girth class e.g.: Thick ≥15cm, Medium 7-
(2) Shrubs (South-West) Size = 5× 5 m (girth at 30 cm above base)Species/bushNo. of bushes Number of tillers in 3 Girth/Diam. Height (m) Fresh Dry Weightand % cover bushes of each species (cm)Weight (gm) (gm)0.1ha 5×5m Bush No. 1 2 3 1 2 3 1 2 3 1 2 3 1 2 3Thick + + + + + + + + + +Medium + + + + + + + + + +Thin + + + + + + + + + +Thick + + + + + + + + + +Medium + + + + + + + + + +Thin + + + + + + + + + +(a) Tree Saplings (North-East) 5× 5 m plot (>10 cm tall and/or girth 3 to 10 cm tall and/or girth 3 to 20), medium (>10-≤20) and thin (≤10) cm. Please collect three samples of 30 cmlong for each girth class of culms from base, middle and upper part of the same culms.S. Species / Girth No. of culms Girth of Height (m) Fresh Weight Dry WeightNo Rosettes class in rosettes Culms (cm)(gm)(gm)1 2 3 1 2 3 1 2 31 2 31 Thick + + + + + + + + + +Medium + + + + + + + + + +Thin + + + + + + + + + +129
(a) Herb 1 (1× 1 m) (record epiphytes/lithophytes/climbers etc. also). Take fresh observations andweight of all, and for dry weight bring one sample if homogeneous or 2 if heterogeneous.In 1×1 m: Fresh weight: ……… gm Dry Weight: …………gm % Cover: ………S.No. Species No. ofindividualsS.No. Species No. ofindividuals1 72 83 9(b) Herb 2 (1× 1 m) (record epiphytes/lithophytes/climbers etc. also)In 1×1 m: Fresh weight: ……… gm Dry Weight: …………gm % Cover: …………S.No. Species No. ofindividualsS.No. Species No. ofindividuals1 72 83 94 105 116 12(c) Herb 3 (1× 1 m) (record epiphytes/lithophytes/climbers etc. also)In 1×1 m: Fresh weight: ……… gm Dry Weight: …………gm % Cover: …………S.No. Species No. ofindividualsS.No. Species No. ofindividuals1 72 83 94 105 116 12(d) Herb 4 (1× 1 m) (record epiphytes/lithophytes/climbers etc. also)In 1×1 m: Fresh weight: ……… gm Dry Weight: …………gm % Cover: …………S.No. Species No. ofindividualsS.No. Species No. ofindividuals1 72 83 94 105 116 12(e) Herb 5 (1× 1 m) (record epiphytes/lithophytes/climbers etc. also)In 1×1 m: Fresh weight: ……… gm Dry Weight: …………gm % Cover: …………S.No. Species No. ofindividualsS.No. Species No. ofindividuals1 52 63 74 8130
Number of dead/dry, stumps of trees /cut but live (0.1 ha plot)S. Species Dead StumpsNo.Nos. Girth (Cm) Height (m) Nos. Girth (cm) Height (m)1 + + + + + + + + + + + +2 + + + + + + + + + + + +3 + + + + + + + + + + + +Litter and humus: 5 plots of 1×1 m (Litter is fresh and hard leaves/ twigs/branches/fruits & humus is softbeneath litter) Please take fresh weight of all, and for dry weight bring one sample from each plot ifhomogeneous or 2 if heterogeneous strata.Plots Twigs+ Branches (gm) Leaves (gm) Humus (gm) TotalFresh Dry Fresh Dry Fresh Dry(a) NE(b) NW(c) SW(d) SE(e) Center131
Plot 5: Vattikkal -1 (Malappuram)PROFORMA FOR FIELD DATA COLLECTION FOREST ECOSYSTEMSCATEGORY 1: SITE AND OBSERVERState: <strong>Kerala</strong> District: Malappuram Plot GPS Point Name = Vattikkal -1<strong>Forest</strong> division: Nilambur South Range: KarulaiSite Centre GPS co-ordinates: Lati. 11º 17' 27.4" Longi. 76º 21' 47.1"Sample Site-/Plot No.: 04/01 NE Date: 01/06/ 2010 Time: 10.00 amG.P.S. Reading (HHDD: MM:SS and WGS 84): Lati 11º 17' 28.2"Longi 76º 21' 51.2"Observer: Deepu DivakaranAltitude: Site/Plot: 70 m/ 70 mMarking on image: (Google/1:25,000 or larger)(Tonal characteristics on FCC)Slope (°): 0.01°Photograph Number:Aspect : SE Topography General Observations): Almost flatCATEGORY 2: FOREST AND SOIL- GENERAL:<strong>Forest</strong> Type: Moist DeciduousNumber of storeys and description: 03Top canopy species (Leaves): Terminalia paniculata, Lagerstroemia microcarpa, Briedelia retusaFirst storey species (Leaves): Hydnocarpus pentandra, Schleichera oleosa, Helicteres isoraSecond storey species (Leaves): Allophylus serratus, Ziziphus oenoplia, Glycosmis pentaphyllaRegeneration – only tree species (in general - very good, good and poor): PoorDisturbance evidence (Lopping/cutting/cattle sighting/hoof marks/dung/fire/ etc.): NilWildlife evidence (Sighting/pug marks/droppings/horns/sound/burrows): SoundGrass Cover (%): 75 Ground Cover (overall % including grasses): 95Stoniness (pebbles/boulders %): 0 Rock Out-crop (%): 0Soil Type: Loamy Soil Colour: Dark brown Soil Texture: MediumLitter thickness: 6 cm Humus Colour: Pale brown Humus thickness: 1.5 cmDepth (m)Bulk Density(kg/m 3 )Organic carbon(%)<strong>Carbon</strong> mass(kg/m 2 )0.00-0.30 0.0236 7.94810.30-0.60 0.0156 5.75640.60-1.00 0.0063 3.175216.87973132
CATEGORY 3: QUANTITATIVE MEASUREMENTSCrown Density (%) (make a small hole in leaf/paper and count sky or crown cover hits and steps,count which is ever is less in count across both diagonals): NE-SW: Steps: 40 Hits: 34 (Canopy/Sky)NW-SE: Steps: 40 Hits: 35 (Canopy/Sky)Stand height (m) (average from 4 trees of top and 4 of 1 st canopy): Top: 31+30+27+26 = 28.5at base of ultimate branch forking 1 st : 8 + 7.5 +9+8.5= 8.25Size of Quadrat for Trees (31.62×31.62 m i.e. 0.1 ha)/ Scrub (10×10 m –pl. take more plots)(a) Pl. use steel measuring tape; (b) for gbh at 1.37m from ground make sticks of 1.37 m to fix the height; inplains from any direction but on slopes from upper side; (c) fix the metallic tag at the base of the treepreferably concealed and hide with stones) –gbh up to mm level.Tree Species Gbh (≥ 10 Height (m) Height (m) Leaf (L)/id.cm) all 1 st forking at ultimate No-leaf (NL)plantsforking1 Hydnocarpus pentandra 55.80 3.00 9.00 L2 Hydnocarpus pentandra 13.80 _ 2.50 L3 Persea macrantha 46.50 _ 8.50 L4 Terminalia paniculata 136.10 12.50 19.00 L5 Terminalia paniculata 166.00 12.50 23.00 L6 Terminalia paniculata 174.20 13.00 24.00 L7 Terminalia paniculata 27.50 _ 3.00 L8 Hydnocarpus pentandra 110.20 4.20 11.00 L9 Hydnocarpus pentandra 52.10 3.80 4.50 L10 Hydnocarpus pentandra 13.10 _ 1.70 L11 Hydnocarpus pentandra 14.20 _ 3.10 L12 Hydnocarpus pentandra 14.00 2 3.50 L13 Hydnocarpus pentandra 12.00 _ 3.30 L14 Haldina cordifolia 108.40 _ 17.00 L15 Hydnocarpus pentandra 203.50 7.5 15.50 L16 Stereospermum colais var. colais 85.10 9.5 19.00 L17 Terminalia paniculata 258.10 17.0 26.00 L18 Spondias pinnata 168.20 18.0 25.50 L19 Persea macrantha 202.10 19.0 27.00 L20 Hydnocarpus pentandra 229.40 3.5 13.50 L21 Hydnocarpus pentandra 92.10 1.5 4.50 L22 Hydnocarpus pentandra 28.50 4.5 6.50 L23 Dillenia pentagyna 242.30 5.5 21.00 L24 Briedelia retusa 278.50 7.5 20.00 L25 Lagerstroemia microcarpa 276.20 18.0 30.00 L26 Persea macrantha 200.10 22.0 31.00 L27 Hydnocarpus pentandra 22.00 _ 6.50 L28 Hydnocarpus pentandra 27.50 _ 8.00 L29 Hydnocarpus pentandra 18.10 _ 5.50 L30 Hydnocarpus pentandra 29.90 4.5 7.50 L31 Schleichera oleosa 11.80 _ 4.00 L133
(1) Shrubs (North-East) Size: 5 × 5 m (girth at 30 cm above base) (Please bring representative stem of all shrub species either entire stem or pieces of 15 cm longfrom base, middle and top of the tiller) Girth class e.g.: Thick ≥15 cm, Medium 7-
(2) Shrubs (South-West) Size = 5× 5 m (girth at 30 cm above base)Species/bushGlycosmis pentaphyllaChassalia curviflora var.ophioxyloidesZiziphus oenopliaSida acutaAllophylus serratusNo. of bushesand % coverNo. of tillers in 3bushes of eachspeciesGirth/Diam.(cm) Height (m) Fresh Wt.(gm) Dry Wt.(gm)0.1 ha 5 x 5m Bush No. 1 2 3 1 2 3 1 2 3 1 2 3 1 2 322 7 Thick 1 2.2Medium 1 1.80.07% 0.1% Thin 1 1.212 4 Thick 1 2.9Medium 1 2.20.03% 0.08% Thin 1 1.80.001%10 4 Thick 1 1.1Medium 1 0.90.003% Thin 1 0.718 2 Thick 1 0.9Medium 1 0.40.02% 0.01% Thin20 6 Thick 1 2.5Medium 1 2.40.05% 0.1% Thin 1 1.90.751.251.000.701.150.621.000.700.361.250.330.800.510.850.0700.0990.0720.0200.1100.0300.0850.0410.0110.0720.0090.0480.0050.0600.0280.0290.0210.0070.0450.0120.0240.0120.0030.0230.0030.0120.0010.024135
(a) Tree Saplings (North-East) 5× 5 m plot (>10 cm tall and/or girth 3 to 10 cm tall and/or girth 3 to
(c) Herb 3 (1× 1 m) (recorded epiphytes/lithophytes/climbers etc. also)In 1×1 m: Fresh weight: 0.459 gm Dry Weight: 0.160gm % Cover: 86Sl.No. Species No. of individuals1 Synedrella nodiflora 22 Elephantopus scaber 23 Alloteropsis cimicina 124 Piper longum 35 Commelina benghalensis 4(d) Herb 4 (1× 1 m) (recorded epiphytes/lithophytes/climbers etc. also)In 1×1 m: Fresh weight: 0.453 gm Dry Weight: 0.154gm % Cover: 85Sl.No. Species No. of individuals1 Elephantopus scaber 22 Cyathula prostrata 63 Cyperus rotundus 144 Justicia japonica 95 Amomum sps 7(e) Herb 5 (1× 1 m) (recorded epiphytes/lithophytes/climbers etc. also)In 1×1 m: Fresh weight: 0.451 gm Dry Weight: 0.153gm % Cover: 85Sl.No. Species No. of individuals1 Cyathula prostrata 72 Alloteropsis cimicina 113 Elephantopus scaber 44 Commelina benghalensis 45 Ageratum conyzoides 3Litter and humus: 5 plots of 1×1 m (Litter is fresh and hard leaves/ twigs/branches/fruits & humus is softbeneath litter) Please take fresh weight of all, and for dry weight bring one sample from each plot ifhomogeneous or 2 if heterogeneous strata.PlotsTwigs + Branches(gm) Leaves (gm) Humus (gm) TotalFresh Dry Fresh Dry Fresh Dry Fresh DryNE 0.126 0.110 0.610 0.488 0.180 0.125 0.916 0.723NW 0.118 0.103 0.598 0.477 0.172 0.121 0.888 0.701SW 0.110 0.096 0.587 0.469 0.174 0.123 0.871 0.688SE 0.128 0.111 0.591 0.474 0.168 0.117 0.887 0.702Center 0.114 0.099 0.582 0.470 0.164 0.113 0.860 0.682137
Plot 6: Vattikkal-2 (Malappuram)<strong>National</strong> Vegetation <strong>Carbon</strong> Pool Assessment (NCP IGBP)PROFORMA FOR FIELD DATA COLLECTION FOREST ECOSYSTEMSCATEGORY 1: SITE AND OBSERVERState: <strong>Kerala</strong> District: Malappuram Plot GPS Point Name = Vattikkal -2<strong>Forest</strong> division: Nilambur South Range: KarulaiSite Centre GPS co-ordinates: Lati. 11º 17' 27.4" Longi. 76º 21' 47.1"Sample Site-/Plot No.: 04/02 NW Date: 03/06/ 2010 Time: 9.30 amG.P.S. Reading (HHDD: MM:SS and WGS 84): Lati 11º 17' 31.1" Longi 76º 21' 46.3"Observer: Deepu Divakaran Altitude: Site/Plot: 70 m/ 70 mMarking on image: (Google/1:25,000 or larger)(Tonal characteristics on FCC)Slope (°): 0.01°Photograph Number:Aspect : SW Topography General Observations): Almost flatCATEGORY 2: FOREST AND SOIL- GENERAL:<strong>Forest</strong> Type: Moist DeciduousNumber of storeys and description: 03Top canopy species (Leaves): Terminalia elliptica, Terminalia paniculataFirst storey species (Leaves): Dillenia pentagyna, Stereospermum colais var. colais, Careya arboreaSecond storey species (Leaves): Ziziphus oenoplia, Holarrhena pubescensRegeneration – only tree species (in general - very good, good and poor): PoorDisturbance evidence (Lopping/cutting/cattle sighting/hoof marks/dung/fire/ etc.): NilWildlife evidence (Sighting/pug marks/droppings/horns/sound/burrows): Dung (Elephant & Gaur)Grass Cover (%): 99 Ground Cover (overall % including grasses): 99.5Stoniness (pebbles/boulders %): 0 Rock Out-crop (%): 0Soil Type: Loamy Soil Colour: Dark brown Soil Texture: MediumLitter thickness: 3-5 cm Humus Colour: Pale brown Humus thickness: 1 cmDepth (m)Bulk Density(kg/m 3 )Organic carbon(%)<strong>Carbon</strong> mass(kg/m 2 )0.00-0.30 0.0217 7.11200.30-0.60 0.0140 5.88000.60-1.00 0.0064 1.63841463043138
CATEGORY 3: QUANTITATIVE MEASUREMENTSCrown Density (%) (make a small hole in leaf/paper and count sky or crown cover hits and steps,count which is ever is less in count across both diagonals): NE-SW: Steps: 40 Hits: 12 (Canopy/Sky)NW-SE: Steps: 40 Hits: 30 (Canopy/Sky)Stand height (m) (average from 4 trees of top and 4 of 1 st canopy): Top: 30+ 33+28 +25 = 29at base of ultimate branch forking 1 st : 18+ 20+13.5+12 = 15.88Size of Quadrat for Trees (31.62×31.62 m i.e. 0.1 ha)/ Scrub (10×10 m –pl. take more plots)(a) Pl. use steel measuring tape; (b) for gbh at 1.37m from ground make sticks of 1.37 m to fix the height; inplains from any direction but on slopes from upper side; (c) fix the metallic tag at the base of the treepreferably concealed and hide with stones) –gbh up to mm level.Treeid.SpeciesGbh (≥ 10 cm)all plantsHeight (m)1 st forkingHeight (m)at ultimateforking1 Terminalia paniculata 100.20 3.5 11.00 L2 Terminalia elliptica 315.10 6.5 30.00 L3 Dillenia pentagyna 94.30 12.0 18.00 L4 Dillenia pentagyna 106.10 12.5 20.00 L5 Terminalia elliptica 190.40 9.0 20.00 L6 Cassia fistula 48.90 10.0 11.00 L7 Stereospermum colais var. colais 11.00 1.5 3.25 L8 Strychnos nux-vomica 21.60 6.0 7.00 L9 Strychnos nux-vomica 28.10 5.5 7.00 L10 Strychnos nux-vomica 13.20 _ 5.50 L11 Strychnos nux-vomica 14.30 _ 5.00 L12 Ziziphus oenoplia 14.10 _ 5.00 L13 Ziziphus oenoplia 38.20 5.0 7.20 L14 Ziziphus oenoplia 44.10 6.0 7.50 L15 Ziziphus oenoplia 31.10 5.5 7.00 L16 Ziziphus oenoplia 51.20 2.3 6.00 L17 Ziziphus oenoplia 53.40 _ 6.50 L18 Terminalia paniculata 16.30 1.7 3.00 L19 Terminalia paniculata 10.00 _ 2.50 L20 Dillenia pentagyna 110.60 10.0 13.50 L21 Terminalia paniculata 14.00 1.8 3.00 L22 Careya arborea 121.70 8.5 12.00 L23 Buchanania lanzan 116.30 15.0 19.50 L24 Terminalia elliptica 152.40 13.5 25.50 L25 Hydnocarpus pentandra 11.00 2.0 2.50 L26 Terminalia elliptica 170.90 20.0 28.00 L27 Pterocarpus marsupium 327.80 11.0 33.00 LLeaf (L)/No-leaf (NL)139
(1) Shrubs (North-East) Size: 5 × 5 m (girth at 30 cm above base) (Please bring representative stem of all shrub species either entire stem or pieces of 15 cm long frombase, middle and top of the tiller) Girth class e.g.: Thick ≥15 cm, Medium 7-
(a) Tree Saplings (North-East) 5× 5 m plot (>10 cm tall and/or girth 3 to 10 cm tall and/or girth 3 to
(b) Herb 2 (1× 1 m) (recorded epiphytes/lithophytes/climbers etc. also)In 1×1 m: Fresh weight: 0.218 gm Dry Weight: 0.069gm % Cover: 85Sl.No. Species No. of individuals1 Curculigo orchioides 282 Cyperus rotundus 173 Alloteropsis cimicina 534 Cyathula prostrata 65 Axonopus compressus 6(c) Herb 3 (1× 1 m) (recorded epiphytes/lithophytes/climbers etc. also)In 1×1 m: Fresh weight: 0.184 gm Dry Weight: 0.059gm % Cover: 79Sl.No. Species No. of individuals1 Amomum sps 82 Elephantopus scaber 33 Cyathula prostrata 164 Alloteropsis cimicina 215 Cyperus rotundus 13(d) Herb 4 (1× 1 m) (recorded epiphytes/lithophytes/climbers etc. also)In 1×1 m: Fresh weight: 0.159gm Dry Weight: 0.049gm % Cover: 73Sl.No. Species No. of individuals1 Cyperus rotundus 162 Curculigo orchioides 83 Elephantopus scaber 34 Brachiaria remota 385 Cyathula prostrata 14(e) Herb 5 (1× 1 m) (recorded epiphytes/lithophytes/climbers etc. also)In 1×1 m: Fresh weight: 0.146 gm Dry Weight: 0.044gm % Cover: 71Sl.No. SpeciesNo. ofindividuals1 Cyathula prostrata 182 Synedrella nodiflora 43 Alloteropsis cimicina 194 Ageratum conyzoides 65 Brachiaria remota 28142
Litter and humus: 5 plots of 1×1 m (Litter is fresh and hard leaves/ twigs/branches/fruits &humus is soft beneath litter) Please take fresh weight of all, and for dry weight bring one samplefrom each plot if homogeneous or 2 if heterogeneous strata.PlotsTwigs + Branches(gm) Leaves (gm) Humus (gm) TotalFresh Dry Fresh Dry Fresh Dry Fresh DryNE 0.202 0.166 0.156 0.130 0.111 0.089 0.469 0.385NW 0.198 0.165 0.142 0.118 0.102 0.083 0.442 0.366SW 0.176 0.145 0.139 0.115 0.095 0.078 0.410 0.338SE 0.184 0.153 0.146 0.121 0.106 0.086 0.436 0.361Center 0.165 0.136 0.130 0.109 0.089 0.073 0.384 0.317143
Plot 7: Vattikkal -3<strong>National</strong> Vegetation <strong>Carbon</strong> Pool Assessment (NCP IGBP)PROFORMA FOR FIELD DATA COLLECTION FOREST ECOSYSTEMSCATEGORY 1: SITE AND OBSERVERState: <strong>Kerala</strong> District: Malappuram Plot GPS Point Name = Vattikkal- 3<strong>Forest</strong> division: Nilambur South Range: KarulaiSite Centre GPS co-ordinates: Lati. 11º 17' 27.4" Longi. 76º 21' 47.1"Sample Site-/Plot No.: 04/03 NW Date: 04/06/ 2010 Time: 9.00 amG.P.S. Reading (HHDD: MM:SS and WGS 84): Lati º'"Longi º'"Observer: Deepu Divakaran Altitude: Site/Plot: 90 mMarking on image: (Google/1:25,000 or larger)(Tonal characteristics on FCC)Slope (°): 0.01°Photograph Number:Aspect : NW Topography General Observations): Almost flatCATEGORY 2: FOREST AND SOIL- GENERAL:<strong>Forest</strong> Type: Moist DeciduousNumber of storeys and description: 03Top canopy species (Leaves): Terminalia elliptica, Terminalia paniculataFirst storey species (Leaves): Careya arborea, Strychnos nux-vomicaSecond storey species (Leaves/No leaves): Ziziphus oenoplia, Chromolaena odorataRegeneration – only tree species (in general - very good, good and poor): PoorDisturbance evidence (Lopping/cutting/cattle sighting/hoof marks/dung/fire/ etc.):LoppingWildlife evidence (Sighting/pugmarks/droppings/horns/sound/burrows): Dung(Elephant)Grass Cover (%): 99 Ground Cover (overall % including grasses): 99.5Stoniness (pebbles/boulders %): 0 Rock Out-crop (%): 0Soil Type: Loamy Soil Colour: Dark Brown Soil Texture: MediumLitter thickness: 2-4 cm Humus Colour: Pale Brown Humus thickness: 0.5cm144
Depth (m)Bulk Density(kg/m 3 )Organic carbon(%)<strong>Carbon</strong> mass(kg/m 2 )0.00-0.30 0.0225 7.24010.30-0.60 0.0122 4.39200.60-1.00 0.0043 2.167213.79933CATEGORY 3: QUANTITATIVE MEASUREMENTSCrown Density (%) (make a small hole in leaf/paper and count sky or crown cover hitsand steps, count which is ever is less in count across both diagonals):NE-SW: Steps: 40 Hits: 32 (Canopy/Sky) NW-SE: Steps: 40 Hits: 13 (Canopy/Sky)Stand height (m) (average from 4 trees of top and 4 of 1 st canopy):Top: 33+33.5+28.5+27 = 30.5 At base of ultimate branch forking 1 st : 9 +9.5 +6.+7.5 =8.13Size of Quadrat for Trees (31.62×31.62 m i.e. 0.1 ha)/ Scrub (10×10 m –pl. take moreplots)(a) Pl. use steel measuring tape; (b) for gbh at 1.37m from ground make sticks of1.37 m to fix the height; in plains from any direction but on slopes from upperside; (c) fix the metallic tag at the base of the tree preferably concealed and hidewith stones) –gbh up to mm level.Tree SpeciesGbh (≥ 10 cm) Height (m) Height (m) at Leaf (L)/id.all plants 1 st forking ultimate forking No-leaf (NL)1 Terminalia elliptica 70.00 _ 17.50 L2 Terminalia elliptica 141.00 14.5 25.00 L3 Terminalia paniculata 21.00 2.1 3.50 L4 Miliusa tomentosa 10.20 _ 2.00 L5 Miliusa tomentosa 10.10 1.5 2.00 L6 Tamilnadia uliginosa 10.50 _ 2.50 L7 Pajanelia longifolia 19.50 _ 3.50 L8 Terminalia elliptica 137.40 _ 25.00 L9 Terminalia elliptica 174.60 19.0 33.00 L10 Careya arborea 14.10 _ 3.50 L11 Terminalia elliptica 190.80 15.5 33.50 L12 Terminalia elliptica 84.20 17.0 21.00 L13 Careya arborea 12.60 _ 2.00 L14 Terminalia paniculata 11.80 1.5 2.50 L15 Strychnos nux-vomica 20.10 _ 7.50 L16 Strychnos nux-vomica 20.80 _ 6.00 L17 Strychnos nux-vomica 22.10 _ 6.50 L18 Strychnos nux-vomica 73.70 6.2 15.50 L19 Pajanelia longifolia 40.20 _ 10.00 L20 Terminalia elliptica 149.20 18.0 27.00 L145
21 Terminalia elliptica 185.00 20.0 28.50 L22 Buchanania lanzan 106.20 _ 6.20 L23 Buchanania lanzan 68.10 _ 7.30 L24 Buchanania lanzan 28.20 _ 3.00 L25 Careya arborea 96.80 2.1 9.50 L26 Careya arborea 97.90 4.5 9.00 L27 Terminalia paniculata 149.20 10.0 18.00 L28 Terminalia paniculata 174.10 9.0 16.00 L29 Careya arborea 124.60 1.7 6.50 L30 Terminalia elliptica 175.30 14.5 23.00 L31 Terminalia elliptica 145.30 12.0 22.00 L(1) Shrubs (North-East) Size: 5 × 5 m (girth at 30 cm above base) (Please bring representative stem ofall shrub species either entire stem or pieces of 15 cm long from base, middle and top of the tiller) Girthclass e.g.: Thick ≥15 cm, Medium 7-
(b) Tree Saplings (South-West) Size: 5× 5 m plot (>10 cm tall and/or girth 3 to 20), medium (>10-≤20) and thin (≤10) cm. Please collect three samplesof 30 cm long for each girth class of culms from base, middle and upper part of the same culms.S. Species / Girth No. of culms Girth of Height (m) Fresh Weight Dry WeightNo Rosettes class in rosettes Culms (cm)(gm)(gm)1 2 3 1 2 3 1 2 31 2 31 Thick + + + + + + + + + +Medium + + + + + + + + + +Thin + + + + + + + + + +(a) Herb 1 (1× 1 m) (record epiphytes/lithophytes/climbers etc. also). Take freshobservations and weight of all, and for dry weight bring one sample if homogeneous or 2 ifheterogeneous. Keep record.In 1×1 m: Fresh weight: ……… gm Dry Weight: …………gm % Cover:……………S.No. Species No. ofindividuals1 32 4S.No. Species No. ofindividuals147
(b) Herb 2 (1× 1 m) (record epiphytes/lithophytes/climbers etc. also)In 1×1 m: Fresh weight: … gm Dry Weight: ……gm % Cover: ……S.No. Species No. ofindividualsS.No. Species No. ofindividuals1 42 53 6(c) Herb 3 (1× 1 m) (record epiphytes/lithophytes/climbers etc. also)In 1×1 m: Fresh weight: …… gm Dry Weight: ……gm % Cover: ……S.No. Species No. ofindividualsS.No. Species No. ofindividuals1 42 53 6(d) Herb 4 (1× 1 m) (record epiphytes/lithophytes/climbers etc. also)In 1×1 m: Fresh weight: …… gm Dry Weight: ……gm % Cover: ……S.No. Species No. ofindividualsS.No. Species No. ofindividuals1 42 53 6(e) Herb 5 (1× 1 m) (record epiphytes/lithophytes/climbers etc. also)In 1×1 m: Fresh weight: …… gm Dry Weight: ………gm % Cover: ………S.No. Species No. ofindividualsS.No. Species No. ofindividuals1 42 53 6Number of dead/dry, stumps of trees /cut but live (0.1 ha plot)S. Species Dead StumpsNo.Nos. Girth (Cm) Height (m) Nos. Girth (cm) Height (m)1 + + + + + + + + + + + +2 + + + + + + + + + + + +3 + + + + + + + + + + + +148
Litter and humus: 5 plots of 1×1 m (Litter is fresh and hard leaves/ twigs/branches/fruits &humus is soft beneath litter) Please take fresh weight of all, and for dry weight bring one samplefrom each plot if homogeneous or 2 if heterogeneous strata.Plots Twigs+ Branches (gm) Leaves (gm) Humus (gm) TotalFresh Dry Fresh Dry Fresh Dry(a) NE(b) NW(c) SW(d) SE(e) Center149
Plot 8: Vattikkal -4 (Malappuram)<strong>National</strong> Vegetation <strong>Carbon</strong> Pool Assessment (NCP IGBP)PROFORMA FOR FIELD DATA COLLECTION FOREST ECOSYSTEMSCATEGORY 1: SITE AND OBSERVERState: <strong>Kerala</strong> District: Malappuram Plot GPS Point Name = Vattikkal - 4<strong>Forest</strong> division: Nilambur South Range: KarulaiSite Centre GPS co-ordinates: Lati. 11º 17' 27.4" Longi. 76º 21' 47.1"Sample Site-/Plot No.: 04/04 NE Date: 05/06/ 2010 Time: 8.30 amG.P.S. Reading (HHDD: MM:SS and WGS 84): Lati 11º 17' 22.9"Longi 76º 21' 46"Observer: Deepu DivakaranAltitude: Site/Plot: 80 mMarking on image: (Google/1:25,000 or larger)(Tonal characteristics on FCC)Slope (°): 0.02°Photograph Number:Aspect : NE Topography General Observations): Almost flatCATEGORY 2: FOREST AND SOIL- GENERAL:<strong>Forest</strong> Type: Moist DeciduousNumber of storeys and description: 03Top canopy species (Leaves): Lagerstroemia microcarpa, Persea macrantha, Tectona grandisFirst storey species (Leaves): Hydnocarpus pentandra, Schleichera oleosaSecond storey species (Leaves): Glycosmis pentaphylla, Allophylus serratusRegeneration – only tree species (in general - very good, good and poor): PoorDisturbance evidence (Lopping/cutting/cattle sighting/hoof marks/dung/fire/ etc.): CattleWildlife evidence (Sighting/pug marks/droppings/horns/sound/burrows): Dung(Elephant)Grass Cover (%): 40 Ground Cover (overall % including grasses): 99Stoniness (pebbles/boulders %): 0 Rock Out-crop (%): 0Soil Type: Loamy Soil Colour: Dark Brown Soil Texture: Medium:Litter thickness: 7-10 cm Humus Colour: Pale Brown Humus thickness: 1.5150
Depth (m)Bulk Density(kg/m 3 )Organic carbon(%)<strong>Carbon</strong> mass(kg/m 2 )0.00-0.30 0.0260 8.34600.30-0.60 0.0134 4.66320.60-1.00 0.0035 1.680014.68920CATEGORY 3: QUANTITATIVE MEASUREMENTSCrown Density (%) (make a small hole in leaf/paper and count sky or crown cover hitsand steps, count which is ever is less in count across both diagonals): NE-SW: Steps: 40Hits: 33 (Canopy/Sky) NW-SE: Steps: 40 Hits: 35 (Canopy/Sky)Stand height (m) (average from 4 trees of top and 4 of 1 st canopy): Top: 32+34+30+34 =32.5 At base of ultimate branch forking 1 st : 13+17+12+17 = 14.75Size of Quadrat for Trees (31.62×31.62 m i.e. 0.1 ha)/ Scrub (10×10 m) Pl. use steelmeasuring tape; (b) for gbh at 1.37m from ground make sticks of 1.37 m to fix the height; inplains from any direction but on slopes from upper side; (c) fix the metallic tag at the base of thetree preferably concealed and hide with stones) – gbh up to mm level.Treeid.SpeciesGbh (≥ 10 cm)all plantsHeight (m)1 st forkingHeight (m)at ultimateforking1 Schleichera oleosa 85.20 12.0 23.00 L2 Schleichera oleosa 57.50 14.0 20.00 L3 Persea macrantha 159.60 17.0 28.00 L4 Tectona grandis 204.80 11.0 29.00 L5 Hydnocarpus pentandra 40.80 5.0 10.50 L6 Hydnocarpus pentandra 35.60 _ 13.00 L7 Hydnocarpus pentandra 70.40 10.0 17.00 L8 Hydnocarpus pentandra 32.10 7.0 9.00 L9 Hydnocarpus pentandra 15.40 4.0 4.50 L10 Terminalia paniculata 140.70 16.0 28.00 L11 Lagerstroemia microcarpa 253.20 17.0 32.00 L12 stereospermum colais var. colais 162.80 4.0 34.00 L13 Hydnocarpus pentandra 98.40 6.5 17.00 L14 Hydnocarpus pentandra 49.20 5.5 12.00 L15 Hydnocarpus pentandra 42.60 3.0 7.00 L16 Hydnocarpus pentandra 213.80 11.0 24.00 L17 Tectona grandis 130.10 9.0 23.00 L18 Schleichera oleosa 83.40 8.5 15.50 L19 Tectona grandis 224.80 7.0 30.00 L20 Schleichera oleosa 146.10 6.0 24.00 L21 Tectona grandis 216.80 24.0 34.00 LLeaf (L)/No-leaf(NL)151
22 Tectona grandis 76.10 _ 9.00 L23 Tectona grandis 121.40 13.5 20.00 L24 Schleichera oleosa 127.60 9.5 17.00 L25 Schleichera oleosa 38.40 _ 13.00 L26 Tectona grandis 120.40 _ 20.00 L27 Schleichera oleosa 62.40 10.0 18.00 L28 Schleichera oleosa 12.80 _ 1.80 L29 Tectona grandis 158.40 13.0 19.50 L(1) Shrubs (North-East) Size: 5 × 5 m (girth at 30 cm above base) (Please bring representative stem ofall shrub species either entire stem or pieces of 15 cm long from base, middle and top of the tiller) Girthclass e.g.: Thick ≥15 cm, Medium 7-
(b) Tree Saplings (South-West) Size: 5× 5 m plot (>10 cm tall and/or girth 3 to 20), medium (>10-≤20) and thin (≤10) cm. Three samples of 30 cm longfor each girth class of culms from base, middle and upper part of the same culms.S. Species / Girth No. of culms Girth of Height (m) Fresh Weight Dry WeightNo Rosettes class in rosettes Culms (cm)(gm)(gm)1 2 3 1 2 3 1 2 31 2 31 Thick + + + + + + + + + +Medium + + + + + + + + + +Thin + + + + + + + + + +2 Thick + + + + + + + + + +Medium + + + + + + + + + +Thin + + + + + + + + + +153
(a) Herb 1 (1×1 m) (recorded epiphytes/lithophytes/climbers etc. also). Take freshobservations and weight of all, and for dry weight bring one sample if homogeneous or 2 ifheterogeneous.In 1×1 m: Fresh weight: …… gm Dry Weight: ……gm % Cover: ……S.No. Species No. ofindividualsS.No. Species No. ofindividuals1 42 53 6(b) Herb 2 (1× 1 m) (record epiphytes/lithophytes/climbers etc. also)In 1×1 m: Fresh weight: …… gm Dry Weight: ……gm % Cover: ……S.No. Species No. ofindividualsS.No. Species No. ofindividuals1 42 53 6(c) Herb 3 (1× 1 m) (record epiphytes/lithophytes/climbers etc. also)In 1×1 m: Fresh weight: …… gm Dry Weight: ……gm % Cover: ………S.No. Species No. ofindividualsS.No. Species No. ofindividuals1 42 53 6(d) Herb 4 (1× 1 m) (record epiphytes/lithophytes/climbers etc. also)In 1×1 m: Fresh weight: …… gm Dry Weight: ………gm % Cover: ………S.No. Species No. ofindividualsS.No. Species No. ofindividuals1 42 53 6(e) Herb 5 (1× 1 m) (record epiphytes/lithophytes/climbers etc. also)In 1×1 m: Fresh weight: …… gm Dry Weight: ………gm % Cover: ………S.No. Species No. ofindividualsS.No. Species No. ofindividuals1 42 53 6154
Number of dead/dry, stumps of trees /cut but live (0.1 ha plot)S. Species Dead StumpsNo.Nos. Girth (Cm) Height (m) Nos. Girth (cm) Height (m)1 + + + + + + + + + + + +2 + + + + + + + + + + + +3 + + + + + + + + + + + +Litter and humus: 5 plots of 1×1 m (Litter is fresh and hard leaves/ twigs/branches/fruits &humus is soft beneath litter) Please take fresh weight of all, and for dry weight bring one samplefrom each plot if homogeneous or 2 if heterogeneous strata.Plots Twigs+ Branches (gm) Leaves (gm) Humus (gm) TotalFresh Dry Fresh Dry Fresh Dry(a) NE(b) NW(c) SW(d) SE(e) Center155
Plot 9: Punjavayal-1 (Wayanad)<strong>National</strong> Vegetation <strong>Carbon</strong> Pool Assessment (NCP IGBP)PROFORMA FOR FIELD DATA COLLECTION FOREST ECOSYSTEMSCATEGORY 1: SITE AND OBSERVERState: <strong>Kerala</strong> District: Wayanad Plot GPS Point Name = Punchavayal -1Location/<strong>Forest</strong> division/Range/Compartment or any landmark: Near Punchavayal thodutributary of kabana (<strong>Forest</strong> area MD)Site Centre GPS co-ordinates: Lati. 10º 51.'42.23" Longi. 76º2'14.820"Sample Site-/Plot No.: S1 /NE/NW/SW/SE Date: 3/11/ 2009 Time: 9.30amG.P.S. Reading (HHDD: MM:SS and WGS 84): Lati º….'…"Longi …º…..'….."Observer: Deepu DivakaranAltitude: Site/Plot: … m/ …. mMarking on image: (Google/1:25,000 or larger)(Tonal characteristics on FCC)Slope (°):Photograph Number:Aspect : N/E/S/W/NE/SE/SW/NW Topography General observations):CATEGORY 2: FOREST AND SOIL- GENERAL:<strong>Forest</strong> Type: MDNumber of storeys and description: 3Top canopy species (Leaves/No leaves): Stereospermum colais, Lagestromea macrocarpaFirst storey species (Leaves/No leaves): Cassia, Helicteres, ZyziphusSecond storey species (Leaves/No leaves): Chromolena, LantanaRegeneration – only tree species (in general - very good, good and poor):Disturbance evidence (Lopping/cutting/cattle sighting/hoof marks/dung/fire/ etc.):Wildlife evidence (Sighting/pug marks/droppings/horns/sound/burrows):Grass Cover (%): 99 Ground Cover (overall % including grasses): 99.9Stoniness (pebbles/boulders %): Rock Out-crop (%):Soil Type: Soil Colour: Soil Texture:Litter thickness: Humus Colour: Humus thickness:156
Depth (m)Bulk Density(kg/m 3 )Organic carbon(Kg%<strong>Carbon</strong> mass(kg/m 2 )0.00-0.30 0.0137 4.84980.30-0.60 0.0116 4.38480.60-1.00 0.0032 1.72810.9626CATEGORY 3: QUANTITATIVE MEASUREMENTSCrown Density (%) (make a small hole in leaf/paper and count sky or crown cover hitsand steps, count which is ever is less in count across both diagonals): NE-SW: Steps:Hits: 20 (Canopy/Sky) 53 NW-SE: Steps: Hits: (/Sky)27Stand height (m) (average from 4 trees of top and 4 of 1 st canopy): Top: 19 + + += At base of ultimate branch forkin 1 st : + + + =Size of Quadrat for Trees (31.62×31.62 m i.e. 0.1 ha)/ Scrub (10×10m) (a) Pl. use steelmeasuring tape; (b) for gbh at 1.37m from ground make sticks of 1.37 m to fix the height; inplains from any direction but on slopes from upper side; (c) fix the metallic tag at the base of thetree preferably concealed and hide with stones) –gbh up to mm level.Treeid.Species Gbh (≥ 10cm) allplantsHeight(m)1 stforking1 Cassia fistula 24.2 3.42 Cassia fistula 17.8 1.8 3.43 Lagerstroemia microcarpa 159.5 2.5 124 Helictrus isora 17.2 1.45 3.55 Cassia fistula 12.2 2.2 4.26 Helictrus isora 22.3 1.75 2.57 Steriospermum colais 318 8.5 248 Helictrus isora 12.8 1.59 Lagerstroemia microcarpa 154 1410 Lagerstroemia microcarpa 41.2 1.5 411 Cassia fistula 36.9 1.45 5.812 Helictrus isora 19.7 1.5 413 Cassia fistula 11.2 1.5 414 Helictrus isora 22.1 2.1 3.515 Cassia fistula 21.1 2 516 Cassia fistula 21 2 517 Ziziphus mauritiana 15 2 5.518 Cassia fistula 13 2 519 Cassia fistula 14 2 520 Cassia fistula 11 1.95 4.5Height (m) atultimateforkingLeaf(L)/No-leaf(NL)157
21 Cassia fistula 12 13.1 5.222 Cassia fistula 12.2 13.7 523 Cassia fistula 16.6 3 524 Cassia fistula 21 2 4.225 Cassia fistula 16 3 526 Lagerstroemia microcarpa 131.2 5.5 1427 Lagerstroemia microcarpa 243.6 2.75 19(1) Shrubs (North-East) Size: 5 × 5 m (girth at 30 cm above base) (Please bring representative stem ofall shrub species either entire stem or pieces of 15 cm long from base, middle and top of the tiller) Girthclass e.g.: Thick ≥15 cm, Medium 7-
(2) Shrubs (South-West) Size = 5× 5 m (girth at 30 cm above base)Species/bushLantanacamaraSolanumtorvumSidacordataCatunaregamspinosaNo. of bushes Number of tillers in 3 Girth/Diam. Height (m) Fresh Dry Weightand % cover bushes of each species (cm)Weight (gm) (gm)0.1ha 5×5m Bush No. 1 2 3 1 2 3 1 2 3 1 2 3 1 2 3Thick + + + + + + + + + +Medium + + + + + + + + + +Thin + + + + + + + + + +Thick + + + + + + + + + +Medium 1+ + 2.3+ + .65+ + + + + +Thin + + + + + + + + + +Thick + + + + 45+ 30 + + + + +Medium 2.1+ + + + + + + + + +Thin + + + + + + + + + +Thick + + + + + + + + + +Medium 1+ + + + + + + + + +Thin 1+ 1 + 1 + + + + + + + +Thick + + + + + + + + + +Medium + + + + + + + + + +Thin 1+ + + + + + 4+ + + +(a) Tree Saplings (North-East) 5× 5 m plot (>10 cm tall and/or girth 3 to 10 cm tall and/or girth 3 to
Bamboo (plot size 0.1 ha) (circumference to be taken about 30 cm above ground)1 Number of rosettes in the plot = % Cover=2 Rosettes circumference (m) + + + + + + + Avg.=3 Number of culms in rosettes + + + + + + + Avg.=Girth Class: e.g. thick (>20), medium (>10-≤20) and thin (≤10) cm. Please collect three samplesof 30 cm long for each girth class of culms from base, middle and upper part of the same culms.S.NoSpecies /RosettesGirthclassHeight (m) Fresh Weight(gm)No. of culmsin rosettes1 2 3Girth ofCulms (cm)1 2 31 2 3Dry Weight(gm)1 231 Thick + + + + + + + + + +Medium + + + + + + + + + +Thin + + + + + + + + + +2 Thick + + + + + + + + + +Medium + + + + + + + + + +Thin + + + + + + + + + +3 Thick + + + + + + + + + +Medium + + + + + + + + + +Thin + + + + + + + + + +(a) Herb 1 (1× 1 m) (recorded epiphytes/lithophytes/climbers etc. also).In 1×1 m: Fresh weight: …… gm Dry Weight: ……gm % Cover: ……S.No. Species No. ofindividualsS.No. Species No. ofindividuals1 Cyathula prostrate 6 Justicia 32 Mimosa pudica 62 7 Scoparia duls 33 Cyperus 8 84 Cinderalla 8 95 Fern sp. 9 10(b) Herb 2 (1× 1 m) (recorded epiphytes/lithophytes/climbers etc. also)In 1×1 m: Fresh weight: …… gm Dry Weight: ……gm % Cover: ……S.No. Species No. ofindividualsS.No. Species No. ofindividuals1 Mimosa 3 7 Justicia2 Cyperus 10 83 Ammomum 12 94 Senna tora 5 105 Cyathula 20 116 Cinderella 6 12160
(c) Herb 3 (1× 1 m) (record epiphytes/lithophytes/climbers etc. also)In 1×1 m: Fresh weight: …… gm Dry Weight: ……gm % Cover: ………S.No. Species No. ofindividualsS.No. Species No. ofindividuals1 52 63 74 8(d) Herb 4 (1× 1 m) (record epiphytes/lithophytes/climbers etc. also)In 1×1 m: Fresh weight: …… gm Dry Weight: ……gm % Cover: ………S.No. Species No. ofindividualsS.No. Species No. ofindividuals1 52 63 74 8(e) Herb 5 (1× 1 m) (record epiphytes/lithophytes/climbers etc. also)In 1×1 m: Fresh weight: …… gm Dry Weight: ……gm % Cover: ………S.No. Species No. ofindividualsS.No. Species No. ofindividuals1 52 63 74 8Number of dead/dry, stumps of trees /cut but live (0.1 ha plot)S. Species Dead StumpsNo.Nos. Girth (Cm) Height (m) Nos. Girth (cm) Height (m)1 + + + + + + + + + + + +2 + + + + + + + + + + + +3 + + + + + + + + + + + +Litter and humus: 5 plots of 1×1 m (Litter is fresh and hard leaves/ twigs/branches/fruits &humus is soft beneath litter) Please take fresh weight of all, and for dry weight bring one samplefrom each plot if homogeneous or 2 if heterogeneous strata.Plots Twigs+ Branches (gm) Leaves (gm) Humus (gm) TotalFresh Dry Fresh Dry Fresh Dry(a) NE(b) NW(c) SW(d) SE(e) Center161
Plot 10: Punjavayal - 2 (Wayanad)<strong>National</strong> Vegetation <strong>Carbon</strong> Pool Assessment (NCP IGBP)PROFORMA FOR FIELD DATA COLLECTION FOREST ECOSYSTEMSCATEGORY 1: SITE AND OBSERVERState: <strong>Kerala</strong> District: Wayanad Plot GPS Point Name =Punjavayal -2Location/<strong>Forest</strong> division/Range/Compartment or any landmark: Wayanad WLSSite Centre GPS co-ordinates: Lati. 10º 52'35.40" Longi. 76º6'12.19"Sample Site-/Plot No.: S1P2 /NE/NW/SW/SE Date: 27/07/ 2010 Time: 10 amG.P.S. Reading (HHDD: MM:SS and WGS 84): Lati 10º 52'37.42" Longi 76º6'10.04"Observer: Deepu DivakaranAltitude: Site/Plot: 750 m/ 760 mMarking on image: (Google/1:25,000 or larger)(Tonal characteristics on FCC)Slope (°):Photograph Number:Aspect : N/E/S/W/NE/SE/SW/NW Topography General observations): HillCATEGORY 2: FOREST AND SOIL- GENERAL:<strong>Forest</strong> Type: MDNumber of storeys and description: 3Top canopy species (Leaves/No leaves): Lagerstroemia micarocarpa, Termiinalaiabellirica, Schleschera oleosaFirst storey species (Leaves/No leaves): Cassia fistula, Melina arborea, CanthiumSecond storey species (Leaves/No leaves): Helicteres, Lantana, ChromalenaRegeneration – only tree species (in general - very good, good and poor): PoorDisturbance evidence (Lopping/cutting/cattle sighting/hoof marks/dung/fire/ etc.): NilWildlife evidence (Sighting/ /droppings/horns/sound/burrows): Pug marks. DropingGrass Cover (%):80 Ground Cover (overall % including grasses): 85Stoniness (pebbles/boulders %): Rock Out-crop (%):Soil Type: Soil Colour: Dark Brown Soil Texture: FineLitter thickness:. 5 Humus Colour: Pale Brown Humus thickness:
Depth (m)Bulk Density(kg/m 3 )Organic carbon(%)<strong>Carbon</strong> mass(Kkg/m 2 )0.00-0.30 0.021 7.3080.30-0.60 0.0125 4.650.60-1.00 0.0052 2.662414.6204CATEGORY 3: QUANTITATIVE MEASUREMENTSCrown Density (%) (make a small hole in leaf/paper and count sky or crown cover hitsand steps, count which is ever is less in count across both diagonals): NE-SW: Steps:Hits: (Canopy/Sky) NW-SE: Steps: Hits: (Canopy/Sky)Stand height (m) (average from 4 trees of top and 4 of 1 st canopy): Top: + + + =At base of ultimate branch forkin 1 st : + + + =Size of Quadrat for Trees (31.62×31.62 m i.e. 0.1 ha)/ Scrub (10×10 m) (a) Pl. use steelmeasuring tape; (b) for gbh at 1.37m from ground make sticks of 1.37 m to fix the height; inplains from any direction but on slopes from upper side; (c) fix the metallic tag at the base of thetree preferably concealed and hide with stones) –gbh up to mm level.Tree Species Gbh (≥ 10 Height (m) Height (m)id.cm) all 1 st forking at ultimateplantsforking1 Lagerstroemia microcarpa 75.8 352 Schleschera oleosa 191.1 8 383 Lagerstroemia microcarpa 145.2 7 314 Cassia fistula 31.2 2 3.85 Cassia fistula 26.7 9.56 Cassia fistula 27 5.57 Bauhinia sps 101.3 1.6 4.58 Bauhinia sps 89.2 3.4 69 Bauhinia sps 68.5 5 9.510 Bauhinia sps 24.8 2.3 4.511 Bauhinia sps 27.1 2 412 Canthium travancoricum 10.1 1.5 2.513 Melina arborea 35.3 5.5 1414 Melina arborea 41.1 2.9 5.315 Cassia fistula 26.5 316 Terminalia bellirica 228.4 2 3517 Lagerstroemia microcarpa 33.8 2.2 5.518 Schlechera oleosa 46.3 5 8.519 Schlechera oleosa 49.8 5.2 920 Stereospermum colais 131.6 13.5 2921 Canthium travancoricum 24.5 2.5 3.422 Canthium travancoricum 13.1 2.2 3.2LeafNo-leaf(NL)(L)/163
23 Canthium travancoricum 12.1 2.2 324 Lannea coromandelica 188 10 2825 Lagerstroemia microcarpa 223.5 8 3626 Melina arborea 53.8 4.5 6.527 Terminalia bellirica 280.3 2.4 3228 Cassia fistula 24.2 829 canthium 32.1 1.75 5.530 canthium 19.4 1.5 4.531 canthium 15.2 4 432 canthium 13 2 433 canthium 20 2 4.534 canthium 22.1 3 435 canthium 24.6 1.45 7(1) Shrubs (North-East) Size: 5 × 5 m (girth at 30 cm above base) (Please bring representative stem ofall shrub species either entire stem or pieces of 15 cm long from base, middle and top of the tiller) Girthclass e.g.: Thick ≥15 cm, Medium 7-
(2) Shrubs (South-West) Size = 5× 5 m (girth at 30 cm above base)Species/bushcanthiumNo. of bushes Number of tillers in 3 Girth/Diam. Height (m) Fresh Dry Weightand % cover bushes of each species (cm)Weight (gm) (gm)0.1ha 5×5m Bush No. 1 2 3 1 2 3 1 2 3 1 2 3 1 2 3214 34 Thick 6+ + 3.2+ + 1.85+ + + +.136Medium + 4 + + + 2.3 + 2.3 + + +Thin + +3.060+ 1.9 + + .38 + + . +007(a) Tree Saplings (North-East) 5× 5 m plot (>10 cm tall and/or girth 3 to 10 cm tall and/or girth 3 to
Bamboo (plot size 0.1 ha) (circumference to be taken about 30 cm above ground)1 Number of rosettes in the plot = % Cover=2 Rosettes circumference (m) + + + + + + + Avg.=3 Number of culms in rosettes + + + + + + + Avg.=Girth Class: e.g. thick (>20), medium (>10-≤20) and thin (≤10) cm. Please collect three samplesof 30 cm long for each girth class of culms from base, middle and upper part of the same culms.S. Species / Girth No. of culms Girth of Height (m) Fresh Weight Dry WeightNo Rosettes class in rosettes Culms (cm)(gm)(gm)1 2 3 1 2 3 1 2 31 2 31 Thick + + + + + + + + + +Medium + + + + + + + + + +Thin + + + + + + + + + +2 Thick + + + + + + + + + +Medium + + + + + + + + + +Thin + + + + + + + + + +3 Thick + + + + + + + + + +Medium + + + + + + + + + +Thin + + + + + + + + + +(a) Herb 1 (1× 1 m) (record epiphytes/lithophytes/climbers etc. also). Take freshobservations and weight of all, and for dry weight bring one sample if homogeneous or 2 ifheterogeneous. Keep record.In 1×1 m: Fresh weight: 0.6gm Dry Weight: …………gm % Cover: 72S.No. Species No. ofindividualsS.No. Species No. ofindividuals1 Curcuma sps 6 52 Curculago orchioides 4 63 Cyathula prostrata 28 74 Justicia sps 6 8(b) Herb 2 (1× 1 m) (record epiphytes/lithophytes/climbers etc. also)In 1×1 m: Fresh weight: .623 gm Dry Weight: 73gm % Cover: ……………S.No. Species No. ofindividualsS.No. Species No. ofindividuals1 Curcilago orchioidies 80 72 grass 120 83 cyathula 21 94 Acharanthes aspera 3 105 ammomum 7 116 Leportea intrepta 2 12166
(c) Herb 3 (1× 1 m) (record epiphytes/lithophytes/climbers etc. also)In 1×1 m: Fresh weight: .589 gm Dry Weight: …………gm % Cover: 72S.No. Species No. ofindividualsS.No. Species No. ofindividuals1 ageratum 72 Curculago orchioides 5 83 grass 98 94 Ammomum sps 5 105 Cyathula prostrata 16 116 justicia 3 12(d) Herb 4 (1× 1 m) (record epiphytes/lithophytes/climbers etc. also)In 1×1 m: Fresh weight: ……… gm Dry Weight: …………gm % Cover:……………S.No. Species No. ofindividuals1 Cyperus rotundus 26 72 curcilago 8 83 grass 117 94 ammomum 9 105 Asparagus 2 116 12S.No. Species No. ofindividuals(e) Herb 5 (1× 1 m) (record epiphytes/lithophytes/climbers etc. also)In 1×1 m: Fresh weight: .498 gm Dry Weight: …………gm % Cover: 60S.No. Species No. ofindividualsS.No. Species No. ofindividuals1 ammomum 11 42 curculago 4 53 leportea 2 6Number of dead/dry, stumps of trees /cut but live (0.1 ha plot)S. Species Dead StumpsNo.Nos. Girth (Cm) Height (m) Nos. Girth (cm) Height (m)1 Lagerstroemia 45+ + + 12+ + + + + + + + +2 Melia arborea 45+ + + 4.25+ + + + + + + + +Litter and humus: 5 plots of 1×1 m (Litter is fresh and hard leaves/ twigs/branches/fruits &humus is soft beneath litter) Please take fresh weight of all, and for dry weight bring one samplefrom each plot if homogeneous or 2 if heterogeneous strata.Plots Twigs+ Branches (gm) Leaves (gm) Humus (gm) TotalFresh Dry Fresh Dry Fresh Dry(a) NE .448 .295 .216(b) NW .421 .274 .202(c) SW .453 .289 .211(d) SE .392 .251 .194(e) Center .392 .260 .189167
ReferencesChhabra, A., Palria, S. and Dadhwal, V. K. 2002. Growing stock based forest biomassestimate for India. Biomass and Bioenergy 22(3): 187-194.Dadhwal, V.K., Pandya, N. and Vora, A.B. 2002. <strong>Carbon</strong> cycle for Indian forestecosystem: a preliminary estimate. In: Subbaraya, B.H.; Rao, D.P.; Desai,P.S.; Manikam; Rajaratnam, P. editors. Global change studies: Scientificresults from ISRO-IGBP, ISRO Bangalore, p.411-30.Dadhwal, V.K. and Shah, A. 1997. Recent changes in forest phytomass carbon pool inIndia estimated using growing stock and remote sensing based forestinventories. Jour. Tropical For. 13: 182-188.FAO,2001. Terrestrial <strong>Carbon</strong> Observation: The Rio de Janerio recommendation forterrestrial and atmospheric measurements. Environmental and NaturalResources Series, No. 3 Rome.2001.FAO, 2005.State of the world’s forests 2005.153 pp. FAO, 2006. Global forest resourceassessment 2005. Progress towards sustainable forest management. FAO<strong>Forest</strong>ry Paper 147. 320 pp FAO Rome. 2006.Hingane, L.S. 1991. Some aspects of carbon dioxide exchange between atmosphere andIndian plant biota. Climate Change 18: 425-435.IGCOS. 2004. Integrated Global <strong>Carbon</strong> Observation Theme: A strategy to realize aCoordinated System of Integrated Global <strong>Carbon</strong> Cycle Observations.Ravindranath, N.H., Somasekhara, B.S. and Gadgil, M. 1997. <strong>Carbon</strong> flows in Indianforests. Climate Change 35: 297-320.168
Richards, J.F. and Flint, E.P. 1994. Historic land use and carbon estimates for south andsoutheast Asia.1880-1980. ORNL/CDIAC-61, NDP- 046. Oak Ridge<strong>National</strong> Laboratory, Tennessee, USA, p.326.169
PlatesFig1.Study site at Wayanad – Sampling locationsFig.2. Study plots170
Fig.3 Tree enumerationFig.4. Ground vegetation studies171
Fig. 5.Shrubs and herbsFig.6. Litter accumulation172
Fig.7. Bamboo areaFig.8. Tree numbering173
Fig.9. Elephants in the plotFig.10. Elephant treanches174