Cal-Sag DWP - Metropolitan Water Reclamation District of Greater ...
Cal-Sag DWP - Metropolitan Water Reclamation District of Greater ...
Cal-Sag DWP - Metropolitan Water Reclamation District of Greater ...

You also want an ePaper? Increase the reach of your titles
YUMPU automatically turns print PDFs into web optimized ePapers that Google loves.
Final ReportDetailed <strong>Water</strong>shed Plan for the<strong>Cal</strong>umet-<strong>Sag</strong> Channel<strong>Water</strong>shed: Volume 1Prepared for<strong>Metropolitan</strong> <strong>Water</strong> <strong>Reclamation</strong><strong>District</strong> <strong>of</strong> <strong>Greater</strong> ChicagoAugust 2009
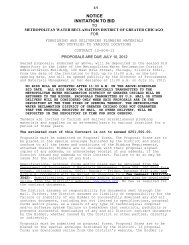
CALUMET-SAG CHANNEL DETAILED WATERSHED PLANHighways, U.S. Highways, state routes, county roads with four or more lanes, and smallerroads providing critical access that are impacted by overbank flooding <strong>of</strong> regional waterways atdepths exceeding 0.5 feet were also considered regional problems.<strong>Water</strong>shed OverviewThe <strong>Cal</strong>umet-<strong>Sag</strong> Channel <strong>Water</strong>shed is located in southwestern Cook County and drainsan area <strong>of</strong> 151 square miles that includes 27 communities. Figure ES.1 is an overview <strong>of</strong> the<strong>Cal</strong>umet-<strong>Sag</strong> Channel <strong>Water</strong>shed. The watershed area north <strong>of</strong> the <strong>Cal</strong>umet-<strong>Sag</strong> Channel isheavily developed and characterized by low relief. It is drained principally by the East andWest branches <strong>of</strong> Stony Creek, which both discharge into the <strong>Cal</strong>umet-<strong>Sag</strong> Channel. Severalsmaller streams discharge westward into the I&M Canal or southward into the <strong>Cal</strong>umet-<strong>Sag</strong>Channel. The watershed area south <strong>of</strong> the <strong>Cal</strong>umet-<strong>Sag</strong> Channel is less intensely developedand characterized by greater topographic relief. Spring Creek, Long Run Creek, and MarleyCreek all drain southwest into Will County and are tributary to Hickory Creek, whichdrains to the Lower Des Plaines River. These streams are included, along with tributariesthat flow north to the <strong>Cal</strong>umet-<strong>Sag</strong> Channel and several tributaries that flow west to theI&M Canal, within the scope <strong>of</strong> the <strong>Cal</strong>umet-<strong>Sag</strong> Channel <strong>DWP</strong>.Existing Conditions EvaluationLocations with historic flooding and stream bank erosion problems on regional waterways existthroughout the watershed. Information on existing problem areas was solicited from WPCmembers as well as federal and state agencies and other stakeholders during the data collectionand evaluation phase <strong>of</strong> the <strong>DWP</strong> development, which also included the collection <strong>of</strong>data regarding the watershed and evaluation <strong>of</strong> the data’s acceptability for use. Responsesfrom stakeholders were used to help identify locations <strong>of</strong> concern, and where field assessmentor surveys were needed to support hydrologic and hydraulic modeling.Hydrologic models were developed to represent run<strong>of</strong>f generated by rainfall throughout the<strong>Cal</strong>umet-<strong>Sag</strong> Channel <strong>Water</strong>shed. The run<strong>of</strong>f was then routed through hydraulic models,which were created for the major open channel waterways within the watershed. Designrainfall events were simulated for the 2-, 5-, 10-, 25-, 50-, 100-, and 500-year recurrence intervalevents based upon Bulletin 71 rainfall data (ISWS, 1992). The simulated water surfacepr<strong>of</strong>iles were overlaid upon a ground elevation model <strong>of</strong> the study area to identify structuresat risk <strong>of</strong> flooding.Property damages due to flooding were estimated using a methodology consistent with theU.S. Army Corps <strong>of</strong> Engineers (USACE) Flood Damage Assessment program. Estimatedflood damage resulting from a storm was considered in combination with the probability <strong>of</strong>the event occurring to estimate an expected annual damage. Erosion damages were assessedfor structures or infrastructure at risk <strong>of</strong> loss due to actively eroding stream banks. Damagesreported within this document refer to economic damages estimated over a 50-year period<strong>of</strong> analysis that result from regional overbank flooding or erosion <strong>of</strong> a regional waterway.Additional damages throughout the watershed exist, including damages due to floodingfrom local waterways and storm sewer systems, and also damages not easily quantified infinancial terms such as water quality, wetland, riparian, and habitat impact, loss <strong>of</strong> emergencyaccess, and loss <strong>of</strong> business or operations due to limited transportation access.IV
HinsdaleWestern SpringsLa GrangeCountrysideBrookfieldMc CookLyonsSummitI&M 5StickneyForest View904155Indian Head Park20HodgkinsBedford ParkBurr RidgeI&M 3SANITARY SANITARY DRAINAGE DRAINAGE AND AND SHIP SHIP CANAL CANALWillow SpringsJustice 71st St. DitchJustice DitchI&M CanalI&M 4I&M Trib D4520Crooked Creek79th St. SewerHickory HillsLucas Diversion DitchLucas DitchBridgeviewMelvina DitchBurbankOak Lawn CreekOak LawnChicagoSanitary Ship CanalI&M 2<strong>Cal</strong>-<strong>Sag</strong> 1<strong>Cal</strong>-<strong>Sag</strong> Trib A<strong>Cal</strong>-<strong>Sag</strong> 2<strong>Cal</strong>-<strong>Sag</strong> 3<strong>Cal</strong>-<strong>Sag</strong> 4Palos HillsWorthKen Kay DitchWest Stony Creek<strong>Cal</strong>-<strong>Sag</strong> 7East Stony CreekMerrionette Park Ditch City <strong>of</strong> Chicago94Castle BowlI&M 1 I&M Trib ALemontI&M Trib B&CLong Run CreekPalos ParkTampier SloughLONG RUN CREEKChicago RidgeHometownEvergreen ParkCALUMET SAG CHANNELCALUMET SAG CHANNELMerrionette ParkMILL MILL CREEK CREEKMill Creek<strong>Cal</strong>-<strong>Sag</strong> 5<strong>Cal</strong>-<strong>Sag</strong> Trib BPalos HeightsNavajo CreekAlsip<strong>Cal</strong>-<strong>Sag</strong> 6 Mosquito CreekCrestwoodEAST STONY CREEK<strong>Cal</strong>-<strong>Sag</strong> 8<strong>Cal</strong>-<strong>Sag</strong> 9Crestwood Drainage DitchRobbins<strong>Cal</strong>-<strong>Sag</strong> 10Blue Island<strong>Cal</strong>umet Park57Riverdale<strong>Cal</strong>-<strong>Sag</strong> Trib CBurnhamTinley CreekMidlothianPosenDixmoorDolton<strong>Cal</strong>umet CityBoca Rio DitchLEGENDRiver/StreamSpring Creek6Orland ParkTINLEY CREEKArroyo DitchOak ForestMarkhamHarveyChicago HeightsPhoenixSouth Holland<strong>Cal</strong>umet-<strong>Sag</strong> Channel<strong>Water</strong>shed BoundarySubwatershed BoundaryMarley CreekOrland Hills294Municipal BoundaryInterstateUS HighwayMajor RoadMARLEY MARLEY CREEK CREEKWill County Trib 2Tinley Park80MattesonCountry Club HillsHazel CrestFlossmoorEast Hazel CrestThorntonHomewoodGlenwoodLansing0 1 2MilesFigure ES.1<strong>Cal</strong>umet-<strong>Sag</strong> Channel <strong>Water</strong>shed OverviewFile Path: Q:\Project_Data\GIS\WorkingMaps\Report\Fig1_Overview.mxd, Date: March 17, 2009 11:41:31 AM, User: KBUCKVOL
CALUMET-SAG CHANNEL DETAILED WATERSHED PLANVI
EXECUTIVE SUMMARYFigure ES.2 summarizes the distribution <strong>of</strong> existing conditions damages within the <strong>Cal</strong>umet-<strong>Sag</strong> Channel <strong>Water</strong>shed over a planning period <strong>of</strong> analysis <strong>of</strong> 50 years. Stony Creek and itstributary waterways comprise roughly 61 percent <strong>of</strong> the existing conditions damage withinthe watershed. The Stony Creek system has the largest tributary area within the watershed,and the relatively dense development within the area subject to flooding combined with thevery flat topography <strong>of</strong> the area resulted in significant damages.The estimated damages summarized in Figure ES.2 include calculated regional damages relatedto overbank flooding, erosion problems on regional waterways that threaten structures,and transportation damages. Localized problems, such as storm-sewer capacityrelated problems, are not included in this estimate. Reported problems classified as local arepresented in Table 2.2.1 in Section 2.2.1. Also provided in Table 2.2.1 is the reasoning behindclassifying the problems as local or regional.FIGURE ES.2Summary <strong>of</strong> Existing Conditions Damages within the <strong>Cal</strong>umet-<strong>Sag</strong> Channel <strong>Water</strong>shed over 50-Year Period <strong>of</strong> AnalysisEvaluation <strong>of</strong> AlternativesStormwater improvements, or alternatives, were developed to address regional stormwaterproblems along intercommunity waterways. WPC members participated in the alternativedevelopment process by providing input on possible solutions and candidate sites for newstormwater infrastructure. It should be noted that the alternatives presented in the <strong>DWP</strong> aredeveloped at a conceptual level <strong>of</strong> feasibility.VII
EXECUTIVE SUMMARYTABLE ES.1Recommended Alternatives Summary for the <strong>Cal</strong>umet-<strong>Sag</strong> Channel <strong>Water</strong>sheda- Benefits include 6 acres <strong>of</strong> wetland restorationb- Project does not include existing regional financial benefits, but is recommended as a preventative measure because further bank failure risks a severe channel flow restriction within Stony Creek.IX
CALUMET-SAG CHANNEL DETAILED WATERSHED PLANX
EXECUTIVE SUMMARYFIGURE ES.3<strong>Cal</strong>umet-<strong>Sag</strong> Channel <strong>Water</strong>shed Alternative SummaryNote: Stony Creek includes entire Stony Creek system as some alternative projects reduce damages on tributaries.The <strong>Cal</strong>umet-<strong>Sag</strong> Channel <strong>DWP</strong> integrated stormwater data from a large number <strong>of</strong> sourcesin order to identify and prioritize solutions to existing stormwater problems. An extensivedata collection effort undertaken for the <strong>DWP</strong> development included surveying <strong>of</strong> streams,bridges, and culverts throughout the entire watershed. Field reconnaissance was performedthroughout the watershed to understand conditions unique to the watershed. This compilation<strong>of</strong> current, accurate data was used by the <strong>District</strong> to document and identify existingstormwater problems throughout the study area.A large number <strong>of</strong> alternatives were developed and evaluated for their effectiveness in reducingregional damages within the <strong>Cal</strong>umet-<strong>Sag</strong> Channel <strong>Water</strong>shed. The alternativeslisted in Table ES.1 were identified as the most effective improvements for reducing expecteddamages due to flooding within the watershed. In some tributaries, greater opportunitiesto reduce regional flooding were identified than in others. Factors such as the lack <strong>of</strong>availability <strong>of</strong> land and location <strong>of</strong> structures relative to stream channels limited the practicality<strong>of</strong> alternative projects to eliminate all flooding damages for all design storms evaluated.The data provided in the <strong>Cal</strong>umet-<strong>Sag</strong> Channel <strong>DWP</strong> will be used by the <strong>District</strong>, alongwith consistently developed data in <strong>DWP</strong>s for the other five major Cook County <strong>Water</strong>sheds,to prioritize the implementation <strong>of</strong> stormwater improvement projects.XI
ContentsVolume 1Executive Summary.......................................................................................................................... iiiBackground ............................................................................................................................iiiDetailed <strong>Water</strong>shed Plan Scope...........................................................................................iii<strong>Water</strong>shed Overview ............................................................................................................ivExisting Conditions Evaluation...........................................................................................ivEvaluation <strong>of</strong> Alternatives................................................................................................. viiiRecommendations.................................................................................................................ix1. Introduction.........................................................................................................................1-11.1 Scope and Approach ..............................................................................................1-11.2 Data Collection and Evaluation............................................................................1-21.3 Hydrologic and Hydraulic Modeling..................................................................1-21.3.1 Model Selection..........................................................................................1-31.3.2 Model Setup and Unit Numbering .........................................................1-41.3.3 Storm Duration ..........................................................................................1-71.3.4 Areal Reduction Factor.............................................................................1-81.3.5 Hydrologic Routing ..................................................................................1-81.3.6 Hydraulic Model Setup ............................................................................1-81.3.7 Model Run Settings.................................................................................1-101.3.8 Model <strong>Cal</strong>ibration and Verification ......................................................1-101.3.9 Flood Inundation Mapping....................................................................1-111.3.10 Discrepancies Between Inundation Mapping and Regulatory FloodMaps..........................................................................................................1-111.3.11 Model Review ..........................................................................................1-111.4 Development and Evaluation <strong>of</strong> Alternatives..................................................1-111.4.1 Problem Area Identification...................................................................1-111.4.2 Economic Analysis ..................................................................................1-121.4.3 Alternative Development and Evaluation...........................................1-142. <strong>Water</strong>shed Characteristics.................................................................................................2-12.1 General <strong>Water</strong>shed Description ...........................................................................2-12.2 Stormwater Problem Data.....................................................................................2-42.3 <strong>Water</strong>shed Analysis Data ......................................................................................2-42.3.1 Monitoring Data ........................................................................................2-42.3.2 Subwatershed Delineation .....................................................................2-192.3.3 Drainage Network...................................................................................2-192.3.4 Topography and Benchmarks ...............................................................2-202.3.5 Soil Classifications...................................................................................2-202.3.6 Land Use...................................................................................................2-212.3.7 Anticipated Development and Future Conditions.............................2-222.3.8 Wetland and Riparian Areas .................................................................2-242.3.9 Management <strong>of</strong> Future Conditions through the Regulations <strong>of</strong> SiteStormwater Management.......................................................................2-24XIII
CALUMET-SAG CHANNEL DETAILED WATERSHED PLAN3. Tributary Characteristics and Analysis ......................................................................... 3-13.1 71st Street Ditch...................................................................................................... 3-13.1.1 Sources <strong>of</strong> Data.......................................................................................... 3-13.1.2 <strong>Water</strong>shed Analysis.................................................................................. 3-33.1.3 Development and Evaluation <strong>of</strong> Alternatives ...................................... 3-53.2 79th Street Sewer.................................................................................................... 3-93.2.1 Sources <strong>of</strong> Data.......................................................................................... 3-93.2.2 <strong>Water</strong>shed Analysis................................................................................ 3-113.2.3 Development and Evaluation <strong>of</strong> Alternatives .................................... 3-113.3 Arroyo Ditch ......................................................................................................... 3-133.3.1 Sources <strong>of</strong> Data........................................................................................ 3-133.3.2 <strong>Water</strong>shed Analysis................................................................................ 3-143.3.3 Development and Evaluation <strong>of</strong> Alternatives .................................... 3-153.4 Boca Rio Ditch....................................................................................................... 3-173.4.1 Sources <strong>of</strong> Data........................................................................................ 3-173.4.2 <strong>Water</strong>shed Analysis................................................................................ 3-193.4.3 Development and Evaluation <strong>of</strong> Alternatives .................................... 3-203.5 <strong>Cal</strong>umet-<strong>Sag</strong> Tributary A.................................................................................... 3-213.5.1 Sources <strong>of</strong> Data........................................................................................ 3-213.5.2 <strong>Water</strong>shed Analysis................................................................................ 3-233.5.3 Development and Evaluation <strong>of</strong> Alternatives .................................... 3-243.6 <strong>Cal</strong>umet-<strong>Sag</strong> Tributary B .................................................................................... 3-253.6.1 Sources <strong>of</strong> Data........................................................................................ 3-253.6.2 <strong>Water</strong>shed Analysis................................................................................ 3-263.6.3 Development and Evaluation <strong>of</strong> Alternatives .................................... 3-293.7 <strong>Cal</strong>umet-<strong>Sag</strong> Tributary C .................................................................................... 3-333.7.1 Sources <strong>of</strong> Data........................................................................................ 3-333.7.2 <strong>Water</strong>shed Analysis................................................................................ 3-343.7.3 Development and Evaluation <strong>of</strong> Alternatives .................................... 3-363.8 Castle Bowl............................................................................................................ 3-413.8.1 Sources <strong>of</strong> Data........................................................................................ 3-413.8.2 <strong>Water</strong>shed Analysis................................................................................ 3-433.8.3 Development and Evaluation <strong>of</strong> Alternatives .................................... 3-433.9 Crestwood Drainage Ditch ................................................................................. 3-453.9.1 Sources <strong>of</strong> Data........................................................................................ 3-453.9.2 <strong>Water</strong>shed Analysis................................................................................ 3-463.9.3 Development and Evaluation <strong>of</strong> Alternatives .................................... 3-483.10 Crooked Creek...................................................................................................... 3-493.10.1 Sources <strong>of</strong> Data........................................................................................ 3-493.10.2 <strong>Water</strong>shed Analysis................................................................................ 3-503.10.3 Development and Evaluation <strong>of</strong> Alternatives .................................... 3-523.11 Illinois and Michigan Canal................................................................................ 3-533.11.1 Sources <strong>of</strong> Data........................................................................................ 3-533.11.2 <strong>Water</strong>shed Analysis................................................................................ 3-553.11.3 Development and Evaluation <strong>of</strong> Alternatives .................................... 3-563.12 Illinois and Michigan Canal Tributary A.......................................................... 3-593.12.1 Sources <strong>of</strong> Data........................................................................................ 3-59XIV
CONTENTS3.12.2 <strong>Water</strong>shed Analysis ................................................................................3-603.12.3 Development and Evaluation <strong>of</strong> Alternatives.....................................3-613.13 Illinois and Michigan Canal Tributary B and C ...............................................3-633.13.1 Sources <strong>of</strong> Data ........................................................................................3-633.13.2 <strong>Water</strong>shed Analysis ................................................................................3-643.13.3 Development and Evaluation <strong>of</strong> Alternatives.....................................3-653.14 Illinois and Michigan Canal Tributary D ..........................................................3-693.14.1 Sources <strong>of</strong> Data ........................................................................................3-693.14.2 <strong>Water</strong>shed Analysis ................................................................................3-713.14.3 Development and Evaluation <strong>of</strong> Alternatives.....................................3-723.15 Justice Ditch...........................................................................................................3-733.15.1 Sources <strong>of</strong> Data ........................................................................................3-733.15.2 <strong>Water</strong>shed Analysis ................................................................................3-753.15.3 Development and Evaluation <strong>of</strong> Alternatives.....................................3-763.16 Ken Kay Ditch .......................................................................................................3-793.16.1 Sources <strong>of</strong> Data ........................................................................................3-793.16.2 <strong>Water</strong>shed Analysis ................................................................................3-813.16.3 Development and Evaluation <strong>of</strong> Alternatives.....................................3-813.17 Long Run Creek ....................................................................................................3-833.17.1 Sources <strong>of</strong> Data ........................................................................................3-833.17.2 <strong>Water</strong>shed Analysis ................................................................................3-853.17.3 Development and Evaluation <strong>of</strong> Alternatives.....................................3-873.18 Lucas Ditch ............................................................................................................3-933.18.1 Sources <strong>of</strong> Data ........................................................................................3-933.18.2 <strong>Water</strong>shed Analysis ................................................................................3-963.18.3 Development and Evaluation <strong>of</strong> Alternatives.....................................3-983.19 Lucas Diversion Ditch........................................................................................3-1033.19.1 Sources <strong>of</strong> Data ......................................................................................3-1033.19.2 <strong>Water</strong>shed Analysis ..............................................................................3-1053.19.3 Development and Evaluation <strong>of</strong> Alternatives...................................3-1083.20 Marley Creek.......................................................................................................3-1133.20.1 Sources <strong>of</strong> Data ......................................................................................3-1133.20.2 <strong>Water</strong>shed Analysis ..............................................................................3-1143.20.3 Development and Evaluation <strong>of</strong> Alternatives...................................3-1163.21 Melvina Ditch......................................................................................................3-1213.21.1 Sources <strong>of</strong> Data ......................................................................................3-1213.21.2 <strong>Water</strong>shed Analysis ..............................................................................3-1233.21.3 Development and Evaluation <strong>of</strong> Alternatives...................................3-1273.22 Merrionette Park Ditch ......................................................................................3-1333.22.1 Sources <strong>of</strong> Data ......................................................................................3-1333.22.2 <strong>Water</strong>shed Analysis ..............................................................................3-1353.22.3 Development and Evaluation <strong>of</strong> Alternatives...................................3-1363.23 Mill Creek ............................................................................................................3-1393.23.1 Sources <strong>of</strong> Data ......................................................................................3-1393.23.2 <strong>Water</strong>shed Analysis ..............................................................................3-1413.23.3 Development and Evaluation <strong>of</strong> Alternatives...................................3-1443.24 Mosquito Creek...................................................................................................3-149XV
CALUMET-SAG CHANNEL DETAILED WATERSHED PLAN3.24.1 Sources <strong>of</strong> Data...................................................................................... 3-1493.24.2 <strong>Water</strong>shed Analysis.............................................................................. 3-1503.24.3 Development and Evaluation <strong>of</strong> Alternatives .................................. 3-1503.25 Navajo Creek ...................................................................................................... 3-1513.25.1 Sources <strong>of</strong> Data...................................................................................... 3-1513.25.2 <strong>Water</strong>shed Analysis.............................................................................. 3-1523.25.3 Development and Evaluation <strong>of</strong> Alternatives .................................. 3-1563.26 Oak Lawn Creek................................................................................................. 3-1633.26.1 Sources <strong>of</strong> Data...................................................................................... 3-1633.26.2 <strong>Water</strong>shed Analysis.............................................................................. 3-1653.26.3 Development and Evaluation <strong>of</strong> Alternatives .................................. 3-1663.27 Spring Creek ....................................................................................................... 3-1733.27.1 Sources <strong>of</strong> Data...................................................................................... 3-1733.27.2 <strong>Water</strong>shed Analysis.............................................................................. 3-1753.27.3 Development and Evaluation <strong>of</strong> Alternatives .................................. 3-1763.28 Stony Creek......................................................................................................... 3-1813.28.1 Sources <strong>of</strong> Data...................................................................................... 3-1813.28.2 <strong>Water</strong>shed Analysis.............................................................................. 3-1853.28.3 Development and Evaluation <strong>of</strong> Alternatives .................................. 3-1883.29 Tinley Creek........................................................................................................ 3-1973.29.1 Sources <strong>of</strong> Data...................................................................................... 3-1973.29.2 <strong>Water</strong>shed Analysis.............................................................................. 3-1983.29.3 Development and Evaluation <strong>of</strong> Alternatives .................................. 3-2054. <strong>Water</strong>shed Action Plan...................................................................................................... 4-14.1 <strong>Water</strong>shed Maintenance Activities...................................................................... 4-14.2 Recommended Capital Improvements ............................................................... 4-34.3 Implementation Plan ............................................................................................. 4-35. Summary and Conclusions .............................................................................................. 5-16. References ........................................................................................................................... 6-1TablesES.1 Recommended Alternatives Summary for the <strong>Cal</strong>umet-<strong>Sag</strong> Channel <strong>Water</strong>shed.IX1.3.1 <strong>Cal</strong>umet-<strong>Sag</strong> Channel <strong>DWP</strong> WPC Coordination Activities..................................... 1-31.3.2 Description <strong>of</strong> Curve Number Input Data ................................................................. 1-51.3.3 Run<strong>of</strong>f Curve Numbers for Urban Areas ................................................................... 1-61.3.4 Rainfall Depths ............................................................................................................... 1-81.4.1 Flood Control Technologies........................................................................................ 1-161.4.2 Erosion Control Technologies .................................................................................... 1-172.1.1 Municipalities in the <strong>Cal</strong>umet-<strong>Sag</strong> Channel <strong>Water</strong>shed ............................................ 2-12.1.2 <strong>Cal</strong>umet-<strong>Sag</strong> Channel <strong>Water</strong>shed Open Channel Stream Lengths......................... 2-22.1.3 Municipality and Subwatersheds within the Municipality Boundary................... 2-22.2.1 Summary <strong>of</strong> Responses to Form B Questionnaire..................................................... 2-52.3.1 USGS Gage Data in the <strong>Cal</strong>umet-<strong>Sag</strong> Channel <strong>Water</strong>shed.................................... 2-182.3.2 Hydrologic Soil Groups .............................................................................................. 2-212.3.3 Hydrologic Soil Group Distribution.......................................................................... 2-212.3.4 Land Use Distribution within the <strong>Cal</strong>umet-<strong>Sag</strong> Channel <strong>Water</strong>shed .................. 2-222.3.5 Projected Population Increase by Subwatershed..................................................... 2-23XVI
CONTENTS3.1.1 Communities Draining to 71st Street Ditch ................................................................3-13.1.2 Land Use Distribution for 71st Street Ditch................................................................3-13.1.3 Community Response Data for the 71st Street Ditch ................................................3-33.1.4 Modeled Problem Definition for 71st Street Ditch.....................................................3-53.1.5 Estimated Damages for 71st Street Ditch ....................................................................3-53.1.6 Flood Control Alternatives for 71st Street Ditch ........................................................3-63.1.7 71st Street Ditch Existing and Alternative Condition Flow andWSEL Comparison .........................................................................................................3-73.1.8 71st Street Ditch Project Alternative Matrix to Support <strong>District</strong> CapitalImprovement Program (CIP) Prioritization................................................................3-83.2.1 Communities Draining to 79th Street Sewer ..............................................................3-93.2.2 Land Use Distribution for 79th Street Sewer..............................................................3-93.2.3 Community Response Data for the 79th Street Sewer ............................................3-103.3.1 Communities Draining to Arroyo Ditch ...................................................................3-133.3.2 Land Use Distribution for Arroyo Ditch ...................................................................3-133.3.3 Arroyo Ditch Subbasin Summary ..............................................................................3-143.4.1 Communities Draining to Boca Rio Ditch.................................................................3-173.4.2 Land Use Distribution for Boca Rio Ditch.................................................................3-173.4.3 Community Response Data for Boca Rio Ditch .......................................................3-183.4.4 Boca Rio Ditch Subbasin Summary............................................................................3-193.5.1 Communities Draining to <strong>Cal</strong>umet-<strong>Sag</strong> Tributary A..............................................3-213.5.2 Land Use Distribution for <strong>Cal</strong>umet-<strong>Sag</strong> Tributary A..............................................3-213.5.3 Community Response Data for <strong>Cal</strong>umet-<strong>Sag</strong> Tributary A.....................................3-223.6.1 Communities Draining to <strong>Cal</strong>umet-<strong>Sag</strong> Tributary B...............................................3-253.6.2 Land Use Distribution for <strong>Cal</strong>umet-<strong>Sag</strong> Tributary B ..............................................3-253.6.3 Community Response Data for <strong>Cal</strong>umet-<strong>Sag</strong> Tributary B .....................................3-273.6.4 Comparison <strong>of</strong> Observed and Model Result <strong>Water</strong> Surface Elevations forAugust 20, 2007 Storm Event ......................................................................................3-283.6.5 Modeled Problem Definition for <strong>Cal</strong>umet-<strong>Sag</strong> Tributary B ...................................3-293.6.6 Estimated Damages for <strong>Cal</strong>umet-<strong>Sag</strong> Tributary B...................................................3-303.6.7 Flood Control Alternatives for <strong>Cal</strong>umet-<strong>Sag</strong> Tributary B.......................................3-303.6.8 <strong>Cal</strong>umet-<strong>Sag</strong> Tributary B Existing and Alternative Condition Flow andWSEL Comparison .......................................................................................................3-313.6.9 <strong>Cal</strong>umet-<strong>Sag</strong> Tributary B Project Alternative Matrix to Support <strong>District</strong> CIPPrioritization..................................................................................................................3-323.7.1 Communities Draining to <strong>Cal</strong>umet-<strong>Sag</strong> Tributary C ..............................................3-333.7.2 Land Use Distribution for <strong>Cal</strong>umet-<strong>Sag</strong> Tributary C ..............................................3-333.7.3 Community Response Data for <strong>Cal</strong>umet-<strong>Sag</strong> Tributary C.....................................3-343.7.4 Modeled Problem Definition for <strong>Cal</strong>umet-<strong>Sag</strong> Tributary C...................................3-363.7.5 Estimated Damages for <strong>Cal</strong>umet-<strong>Sag</strong> Tributary C ..................................................3-363.7.6 Flood Control Alternatives for <strong>Cal</strong>umet-<strong>Sag</strong> Tributary C ......................................3-373.7.7 <strong>Cal</strong>umet-<strong>Sag</strong> Tributary C Project Alternative Matrix to Support <strong>District</strong> CIPPrioritization..................................................................................................................3-393.8.1 Communities Draining to Castle Bowl......................................................................3-413.8.2 Land Use Distribution for Castle Bowl......................................................................3-413.8.3 Community Response Data for Castle Bowl ............................................................3-423.9.1 Communities Draining to Crestwood Drainage Ditch ...........................................3-45XVII
CALUMET-SAG CHANNEL DETAILED WATERSHED PLAN3.9.2 Land Use Distribution for Crestwood Drainage Ditch........................................... 3-453.10.1 Communities Draining to Crooked Creek ............................................................... 3-493.10.2 Land Use Distribution for Crooked Creek ............................................................... 3-493.10.3 Community Response Data for Crooked Creek ...................................................... 3-513.11.1 Communities Draining to I&M Canal....................................................................... 3-533.11.2 Land Use Distribution for I&M Canal....................................................................... 3-533.11.3 Point Source Dischargers in I&M Canal area........................................................... 3-543.11.4 Community Response Data for I&M Canal ............................................................. 3-553.11.5 Modeled Problem Definition for the I&M Canal..................................................... 3-563.11.6 Estimated Damages for I & M Canal......................................................................... 3-573.11.7 Flood Control Alternatives for I&M Canal............................................................... 3-573.11.8 I&M Canal Existing and Alternative Condition Flow and WSEL Comparison.. 3-583.11.9 I&M Canal Project Alternative Matrix to Support <strong>District</strong> CIP Prioritization .... 3-583.12.1 Communities Draining to I&M Tributary A ............................................................ 3-593.12.2 Land Use Distribution for I&M Tributary A............................................................ 3-593.13.1 Communities Draining to I&M Tributary B & C..................................................... 3-633.13.2 Land Use Distribution for I&M Tributary B & C..................................................... 3-633.13.3 Modeled Problem Definition for I&M Tributary B & C ......................................... 3-663.13.4 Estimated Damages for I&M Tributary B & C......................................................... 3-663.13.5 Flood Control Alternatives for I&M Tributary B & C............................................. 3-673.14.1 Communities Draining to I&M Tributary D ............................................................ 3-693.14.2 Land Use Distribution for I&M Tributary D............................................................ 3-693.14.3 Community Response Data for I&M Tributary D................................................... 3-703.15.1 Communities Draining to Justice Ditch .................................................................... 3-733.15.2 Land Use Distribution for Justice Ditch.................................................................... 3-733.15.3 Community Response Data for Justice Ditch........................................................... 3-753.15.4 Modeled Problem Definition for Justice Ditch......................................................... 3-773.16.1 Communities Draining to Ken Kay Ditch ................................................................ 3-793.16.2 Land Use Distribution for Ken Kay Ditch ................................................................ 3-793.16.3 Community Response Data for Ken Kay Ditch ....................................................... 3-803.17.1 Communities Draining to Long Run Creek ............................................................. 3-833.17.2 Land Use Distribution for Long Run Creek ............................................................. 3-833.17.3 Community Response Data for Long Run Creek.................................................... 3-853.17.4 Modeled Peak Flow versus Gage Record Flow ....................................................... 3-873.17.5 Modeled Problem Definition for Long Run Creek.................................................. 3-883.17.6 Estimated Damages for Long Run Creek ................................................................. 3-883.17.7 Flood Control Alternatives for Long Run Creek ..................................................... 3-893.17.8 Long Run Creek Road Overtopping Summary ....................................................... 3-903.17.9 Long Run Creek Project Alternative Matrix to Support <strong>District</strong> CIPPrioritization ................................................................................................................ 3-913.18.1 Communities Draining to Lucas Ditch ..................................................................... 3-933.18.2 Land Use Distribution for Lucas Ditch ..................................................................... 3-933.18.3 Community Response Data for Lucas Ditch............................................................ 3-963.18.4 Modeled Problem Definition for Lucas Ditch.......................................................... 3-983.18.5 Estimated Damages for Lucas Ditch ......................................................................... 3-983.18.6 Flood Control Alternatives for Lucas Ditch ............................................................. 3-99XVIII
CONTENTS3.18.7 Lucas Ditch Existing and Alternative Condition Flow and WSELComparison .................................................................................................................3-1013.18.8 Lucas Ditch Project Alternative Matrix to Support <strong>District</strong> CIP Prioritization .3-1023.19.1 Communities Draining to Lucas Diversion Ditch .................................................3-1033.19.2 Land Use Distribution for Lucas Diversion Ditch .................................................3-1033.19.3 Community Response Data for Lucas Diversion Ditch ........................................3-1053.19.4 Modeled Problem Definition for Lucas Diversion Ditch ......................................3-1083.19.5 Estimated Damages for Lucas Diversion Ditch......................................................3-1083.19.6 Flood Control Alternatives for Lucas Diversion Ditch .........................................3-1093.19.7 Lucas Diversion Ditch Existing and Alternative Condition Flow andWSEL Comparison .....................................................................................................3-1103.19.8 Lucas Diversion Ditch Project Alternative Matrix to Support <strong>District</strong> CIPPrioritization................................................................................................................3-1113.20.1 Communities Draining to Marley Creek.................................................................3-1133.20.2 Land Use Distribution for Marley Creek ................................................................3-1133.20.3 Community Response Data for Marley Creek .......................................................3-1153.20.4 Modeled Problem Definition for Marley Creek .....................................................3-1173.20.5 Estimated Damages for Marley Creek.....................................................................3-1173.20.6 Flood Control Alternatives for Marley Creek ........................................................3-1183.20.7 Marley Creek Existing and Alternative Condition Flow and WSELComparison .................................................................................................................3-1183.20.8 Marley Creek Project Alternative Matrix to Support <strong>District</strong> CIPPrioritization................................................................................................................3-1203.21.1 Communities Draining to Melvina Ditch................................................................3-1213.21.2 Land Use Distribution for Melvina Ditch ...............................................................3-1213.21.3 Community Response Data for Melvina Ditch ......................................................3-1233.21.4 Peak Depths.................................................................................................................3-1253.21.5 Modeled Problem Definition for Melvina Ditch ....................................................3-1283.21.6 Estimated Damages for Melvina Ditch....................................................................3-1283.21.7 Erosion Control Alternatives for Melvina Ditch....................................................3-1293.21.8 Melvina Ditch Project Alternative Matrix to Support <strong>District</strong> CIPPrioritization................................................................................................................3-1313.22.1 Communities Draining to Merrionette Park Ditch ................................................3-1333.22.2 Land Use Distribution for Merrionette Park Ditch................................................3-1333.22.3 Community Response Data for Merrionette Park Ditch.......................................3-1343.22.4 Modeled Problem Definition for Merrionette Park Ditch.....................................3-1363.22.5 Estimated Damages for Merrionette Park Ditch ....................................................3-1363.22.6 Flood Control Alternatives for Merrionette Park Ditch........................................3-1373.23.1 Communities Draining to Mill Creek ......................................................................3-1393.23.2 Land Use Distribution for Mill Creek......................................................................3-1393.23.3 Community Response Data for Mill Creek.............................................................3-1413.23.4 Comparison <strong>of</strong> Observed and Model Result <strong>Water</strong> Surface Elevations forAugust 20, 2007 Storm ...............................................................................................3-1443.23.5 Modeled Problem Definition for Mill Creek...........................................................3-1443.23.6 Estimated Damages for Mill Creek ..........................................................................3-1453.23.7 Flood Control Alternatives for Mill Creek..............................................................3-1453.23.8 Mill Creek Existing and Alternative Condition Flow and WSEL Comparison.3-147XIX
CALUMET-SAG CHANNEL DETAILED WATERSHED PLAN3.23.9 Mill Creek Project Alternative Matrix to Support <strong>District</strong> CIP Prioritization ... 3-1483.24.1 Communities Draining to Mosquito Creek............................................................ 3-1493.24.2 Land Use Distribution for Mosquito Creek............................................................ 3-1493.25.1 Communities Draining to Navajo Creek ................................................................ 3-1513.25.2 Land Use Distribution for Navajo Creek................................................................ 3-1513.25.3 Community Response Data for Navajo Creek....................................................... 3-1533.25.4 Comparison <strong>of</strong> Observed and Model Result <strong>Water</strong> Surface Elevations forAugust 20, 2007 Storm Event.................................................................................... 3-1563.25.5 Modeled Problem Definition for Navajo Creek..................................................... 3-1563.25.6 Estimated Damages for Navajo Creek .................................................................... 3-1573.25.7 Flood Control Alternatives for Navajo Creek........................................................ 3-1593.25.8 Navajo Creek Existing and Alternative Condition Flow and WSELComparison................................................................................................................. 3-1603.25.9 Navajo Creek Road Overtopping Summary .......................................................... 3-1603.25.10 Navajo Creek Project Alternative Matrix to Support <strong>District</strong> CIPPrioritization ............................................................................................................... 3-1623.26.1 Communities Draining to Oak Lawn Creek .......................................................... 3-1633.26.2 Land Use Distribution for Oak Lawn Creek .......................................................... 3-1633.26.3 Community Response Data for Oak Lawn Creek ................................................. 3-1643.26.4 Modeled Problem Definition for Oak Lawn Creek............................................... 3-1673.26.5 Estimated Damages for Oak Lawn Creek .............................................................. 3-1673.26.6 Flood Control and Erosion Control Alternatives for Oak Lawn Creek ............. 3-1683.26.7 Oak Lawn Creek Existing and Alternative Condition Flow and WSELComparison................................................................................................................. 3-1693.26.8 Oak Lawn Creek Road Overtopping Summary .................................................... 3-1703.26.9 Oak Lawn Creek Project Alternative Matrix to Support <strong>District</strong> CIPPrioritization ............................................................................................................... 3-1713.27.1 Communities Draining to Spring Creek ................................................................. 3-1733.27.2 Land Use Distribution for Spring Creek................................................................. 3-1733.27.3 Community Response Data for Spring Creek........................................................ 3-1743.27.4 Modeled Problem Definition for Spring Creek...................................................... 3-1763.27.5 Estimated Damages for Spring Creek ..................................................................... 3-1773.27.6 Flood Control Alternatives for Spring Creek......................................................... 3-1773.27.7 Spring Creek Road Overtopping Summary........................................................... 3-1783.27.8 Spring Creek Project Alternative Matrix to Support <strong>District</strong> CIPPrioritization ............................................................................................................... 3-1793.28.1 Communities Draining to Stony Creek................................................................... 3-1813.28.2 Land Use Distribution for Stony Creek .................................................................. 3-1813.28.3 Community Response Data for Stony Creek ......................................................... 3-1833.28.4 Stony Creek System Subbasin Summary................................................................ 3-1853.28.5 Comparison <strong>of</strong> Observed and Predicted Stage for Stony Creek, 9/13/2008Storm Event................................................................................................................. 3-1873.28.6 Comparison <strong>of</strong> <strong>DWP</strong> and USACE Model Results for 100-Year Design Storm.. 3-1883.28.7 Modeled Problem Definition for Stony Creek ....................................................... 3-1883.28.8 Estimated Damages for Stony Creek....................................................................... 3-1903.28.9 Flood Control and Erosion Control Alternatives for Stony Creek...................... 3-1913.28.10 Stony Creek Road Overtopping Summary............................................................. 3-193XX
CALUMET-SAG CHANNEL DETAILED WATERSHED PLAN3.6.2 <strong>Cal</strong>-<strong>Sag</strong> Tributary B Alternative CSTB-33.7.1 <strong>Cal</strong>-<strong>Sag</strong> Tributary C Tributary Overview3.8.1 Castle Bowl Tributary Overview3.9.1 Crestwood Drainage Ditch Tributary Overview3.10.1 Crooked Creek Tributary Overview3.11.1 Illinois and Michigan Canal Overview3.11.2 Illinois and Michigan Canal Alternative IMCA-13.12.1 I&M Tributary A Tributary Overview3.13.1 I&M Tributary B & C Tributary Overview3.14.1 I&M Tributary D Tributary Overview3.15.1 Justice Ditch Tributary Overview3.16.1 Ken Kay Ditch Tributary Overview3.17.1a Long Run Creek Tributary Overview (1 <strong>of</strong> 2)3.17.1b Long Run Creek Tributary Overview (2 <strong>of</strong> 2)3.17.2 Long Run Creek Alternative LRCR-53.18.1 Lucas Ditch Tributary Overview3.18.2 Lucas Ditch Alternative LUDT-53.18.3 Lucas Ditch Alternative LUDT-73.19.1 Lucas Diversion Ditch Tributary Overview3.19.2 Lucas Diversion Ditch Alternative LDDT-33.20.1 Marley Creek Tributary Overview3.20.2 Marley Creek Alternative MACR-13.21.1 Melvina Ditch Tributary Overview3.21.2 Modeled vs. Monitored Melvina Ditch Reservoir Depth during August 23, 2007Storm3.21.3 Modeled vs. Monitored Melvina Ditch Reservoir Depth during September 13,2008 Storm3.21.4 Melvina Ditch Alternative MEDT-13.22.1 Merrionette Park Ditch Tributary Overview3.23.1 Mill Creek Tributary Overview3.23.2 Mill Creek West Branch Alternative MICR-23.23.3 Mill Creek Alternative MICR-43.24.1 Mosquito Creek Tributary Overview3.25.1 Navajo Creek Tributary Overview3.25.2 Navajo Creek Alternative NVCR-33.25.3 Navajo Creek Alternative NVCR-53.26.1 Oak Lawn Creek Tributary Overview3.26.2 Oak Lawn Creek Alternative OLCR-13.26.3 Oak Lawn Creek Alternative OLCR-33.27.1 Spring Creek Tributary Overview3.27.2 Spring Creek Alternative SPCR-13.28.1a Stony Creek Tributary Overview (1 <strong>of</strong> 3)3.28.1b Stony Creek Tributary Overview (2 <strong>of</strong> 3)3.28.1c Stony Creek Tributary Overview (3 <strong>of</strong> 3)3.28.2 Stony Creek Alternative STCR-23.28.3 Stony Creek Alternative STCR-33.28.4 Stony Creek Alternative STCR-4XXII
CONTENTS3.28.5 Stony Creek Alternative STCR-73.28.6 Stony Creek Alternative STCR-83.28.7 Stony Creek Alternative STCR-103.29.1.a Tinley Creek Tributary Overview (1 <strong>of</strong> 2)3.29.1.b Tinley Creek Tributary Overview (2 <strong>of</strong> 2)3.29.2 Tinley Creek <strong>Cal</strong>ibration for September 13, 2008 Storm3.29.3 Tinley Creek <strong>Cal</strong>ibration for June 10, 2006 Storm3.29.4 Tinley Creek Alternative TICR-33.29.5 Tinley Creek Alternative TICR-53.29.6 Tinley Creek Alternative TICR-73.29.7 Tinley Creek Alternative TICR-85.1 <strong>Cal</strong>umet-<strong>Sag</strong> Channel <strong>Water</strong>shed Alternative SummaryAppendicesA <strong>DWP</strong> Inundation Area and FEMA Floodplain Comparison (on CD)B Chapter 6 <strong>of</strong> the CCSMP (on CD)C Curve Number <strong>Cal</strong>culation (on CD)D Field Survey Overview Map (on CD)E Downstream Boundary Conditions (on CD)F Depth Damage Curves (on CD)G Hydrologic Model Parameters (on CD)H Hydraulic Pr<strong>of</strong>iles for Existing Conditions (in Volume 2)I Project Cost Estimates (on CD)XXIII
Acronyms and AbbreviationsABM Articulated Block MatAMC Antecedent Moisture ConditionsB/C Benefit to Cost RatioCCHD Cook County Highway DepartmentCCSMP Cook County Stormwater Management PlanCCTA Cook County Tax AssessorCFS cubic feet per secondCIP Capital Improvement ProgramCMAP Chicago <strong>Metropolitan</strong> Agency for PlanningCNCurve NumberCSSC Chicago Sanitary and Shipping CanalCWA Clean <strong>Water</strong> ActCWS Chicago <strong>Water</strong>way SystemDEM Digital Elevation ModelDFIRM Digital Flood Insurance Rate Map<strong>District</strong> <strong>Metropolitan</strong> <strong>Water</strong> <strong>Reclamation</strong> <strong>District</strong> <strong>of</strong> <strong>Greater</strong> ChicagoDTM Digital Terrain Model<strong>DWP</strong> Detailed <strong>Water</strong>shed PlanFEMA Federal Emergency Management AgencyFFE First Floor ElevationFGCS Federal Geodetic Control SubcommitteeFIRM Flood Insurance Rate MapFISFlood Insurance StudyFMA Flood Mitigation AssistanceGIS Geographic Information SystemGPS Geographic Positioning SystemH&H Hydrologic and HydraulicHARN High Accuracy Reference NetworkHEC-DSS Hydrologic Engineering Center Data Storage SystemHEC-HMS Hydrologic Engineering Center Hydrologic Modeling SystemHEC-RAS Hydrologic Engineering Center River Analysis SystemI&M Illinois and MichiganIDNR Illinois Department <strong>of</strong> Natural ResourcesIDOT Illinois Department <strong>of</strong> TransportationIEPA Illinois Environmental Protection AgencyIMTT International-Matex Tank TerminalsISWS Illinois State <strong>Water</strong> SurveyLiDAR Light Detection and RangingLOMR Letter <strong>of</strong> Map RevisionL-PTIII Log-Pearson Type IIIM&O Maintenance and OperationsNAVD 88 North American Vertical Datum, 1988XXV
1. IntroductionThe <strong>Cal</strong>umet-<strong>Sag</strong> Channel <strong>Water</strong>shed in southwestern Cook County drains an area <strong>of</strong> 151square miles that includes 27 communities. Figure ES.1 shows an overview <strong>of</strong> the <strong>Cal</strong>umet-<strong>Sag</strong>Channel <strong>Water</strong>shed. The watershed area north <strong>of</strong> the <strong>Cal</strong>umet-<strong>Sag</strong> Channel generally is heavilydeveloped and characterized by low relief and is drained principally by the East and Westbranches <strong>of</strong> Stony Creek and their tributaries. Both East and West Stony Creek discharge intothe <strong>Cal</strong>umet-<strong>Sag</strong> Channel. The area north <strong>of</strong> the <strong>Cal</strong>umet-<strong>Sag</strong> Channel also has several smallerstreams that discharge westward into the Illinois and Michigan (I&M) Canal, or southwardintothe <strong>Cal</strong>umet-<strong>Sag</strong> Channel. The watershed area south <strong>of</strong> the <strong>Cal</strong>umet-<strong>Sag</strong> Channel is lessdeveloped and characterized by greater topographic relief. Spring, Long Run, and Marleycreeks all drain southwest into Will County and are tributary to Hickory Creek which eventuallydischarges into the Des Plaines River. These streams are included, along with tributariesthat flow north to the <strong>Cal</strong>umet-<strong>Sag</strong> Channel and several tributaries that flow west to theI&M Canal, within the scope <strong>of</strong> the <strong>Cal</strong>umet-<strong>Sag</strong> Channel Detailed <strong>Water</strong>shed Plan (<strong>DWP</strong>).Locations with historic flooding and stream bank erosion problems due to regional waterwaysexist throughout the watershed.The <strong>Cal</strong>umet-<strong>Sag</strong> Channel <strong>DWP</strong> was developed by the <strong>Metropolitan</strong> <strong>Water</strong> <strong>Reclamation</strong> <strong>District</strong><strong>of</strong> <strong>Greater</strong> Chicago (<strong>District</strong>) with the participation <strong>of</strong> the <strong>Cal</strong>umet-<strong>Sag</strong> Channel <strong>Water</strong>shedPlanning Council (WPC) which provided local input to the <strong>District</strong> throughout thedevelopment process. The <strong>DWP</strong> was developed to accomplish the following goals:• Document stormwater problem areas.• Evaluate existing watershed conditions using hydrologic and hydraulic (H&H) models.• Produce flow, stage, frequency, and duration information along regional waterways.• Estimate damages associated with regional stormwater problems.• Evaluate solutions to regional stormwater problems.Regional problems are defined as problems associated with waterways whose watershedsencompass multiple jurisdictions and drain an area greater than 0.5 square miles. Problemsarising from capacity issues on local systems, such as storm sewer systems and minor openchannel ditches, even if they drain more than one municipality, were considered local andbeyond the scope <strong>of</strong> a regional stormwater management program. Erosion problems addressedin this plan were limited to active erosion along regional waterways that pose animminent risk to structures or critical infrastructure. Interstate Highways, U.S. Highways,state routes, county roads with four or more lanes, and smaller roads providing critical accessthat are impacted by overbank flooding <strong>of</strong> regional waterways at depths exceeding 0.5 feet werealso considered regional problems.1.1 Scope and ApproachThe <strong>Cal</strong>umet-<strong>Sag</strong> Channel <strong>DWP</strong> scope included data collection and evaluation, H&H modeling,development and evaluation <strong>of</strong> alternatives, and recommendation <strong>of</strong> alternatives. Thedata collection and evaluation task included collection and evaluation <strong>of</strong> existing H&H1-1
CALUMET-SAG CHANNEL DETAILED WATERSHED PLANmodels, geospatial data, previous studies, reported problem areas, and other data relevantto the watershed plan. H&H models were developed to produce inundation mapping forexisting conditions for the 100-year storm event and to evaluate stormwater improvementproject alternatives. Stormwater improvement project alternatives were developed andevaluated to determine their effectiveness in addressing regional stormwater problems. Estimates<strong>of</strong> damage reduction, or benefits, associated with proposed projects were consideredalong with conceptual cost estimates and noneconomic criteria to develop a list <strong>of</strong> recommendedimprovement projects for the <strong>Cal</strong>umet-<strong>Sag</strong> Channel <strong>Water</strong>shed.1.2 Data Collection and EvaluationThe data collection and evaluation phase (Phase A) <strong>of</strong> the <strong>DWP</strong> focused on obtaining dataregarding the watershed and evaluation <strong>of</strong> the material’s acceptability for use. The <strong>District</strong>contacted all WPC members as well as federal and state agencies and other stakeholders requestingrelevant data. Coordination with WPC members to support the <strong>DWP</strong> took placethroughout development <strong>of</strong> the <strong>DWP</strong>. Existing and newly developed data was evaluatedaccording to use criteria defined in Chapter 6 <strong>of</strong> the Cook County Stormwater ManagementPlan (CCSMP), included in Appendix B. Where data was unavailable or insufficient to completethe <strong>DWP</strong>, additional data was collected. This report includes information on all datacollected and evaluated as a part <strong>of</strong> the <strong>Cal</strong>umet-<strong>Sag</strong> Channel <strong>DWP</strong> development. Table1.3.1 lists key dates <strong>of</strong> coordination activities including meetings with WPC membersprior to and throughout <strong>DWP</strong> development.1.3 Hydrologic and Hydraulic ModelingThis section <strong>of</strong> the report provides a description <strong>of</strong> H&H modeling completed to support the<strong>DWP</strong> development. H&H models were developed for all tributaries within the watershedcontaining open waterways. Most models were developed independent <strong>of</strong> any past H&Hmodeling efforts. In one case (East and West Stony Creek), data from previously developedmodels was used to support development <strong>of</strong> the <strong>Cal</strong>umet-<strong>Sag</strong> Channel <strong>DWP</strong>. Hydraulicmodel extent was defined based upon the extent <strong>of</strong> detailed study for effective Flood InsuranceRate Maps (FIRMs). Revised Digital Flood Insurance Rate Map (DFIRM) data producedby the Federal Emergency Management Agency’s (FEMA’s) Map Modernization Programwas unavailable at the time <strong>of</strong> model definition. Models extended further, where appropriate,to aid evaluation <strong>of</strong> damages associated with regional stormwater problems. Appendix A includesa comparison <strong>of</strong> FEMA’s revised DFIRM panels with inundation areas developed for<strong>DWP</strong> modeling purposes. Tables comparing <strong>DWP</strong> inundation area to FEMA floodplain mappingby community and subwatershed are also included in Appendix A.H&H models were developed to be consistent with the protocols defined in Chapter 6 <strong>of</strong> theCCSMP. In numerous instances, models included additional open channel or other drainagefacilities not strictly required by Chapter 6, to aid the evaluation <strong>of</strong> community reportedproblem areas. Available monitoring data, including USGS stream gage data, <strong>District</strong> facilitydata and high water marks observed following storm events were used to performmodel verification and calibration consistent with Chapter 6 guidelines. All H&H modelingdata and documentation <strong>of</strong> the data development are included in the appendixes referencedin the report sections below.1-2
1. INTRODUCTIONTABLE 1.3.1<strong>Cal</strong>umet-<strong>Sag</strong> Channel <strong>DWP</strong> WPC Coordination ActivitiesDescription <strong>of</strong> Activity06-712-5C <strong>Cal</strong>umet-<strong>Sag</strong> Channel Detailed <strong>Water</strong>shed Plan - Phase A - Contractstart date07-713-5C <strong>Cal</strong>umet-<strong>Sag</strong> Channel Detailed <strong>Water</strong>shed Plan - Phase B - Contractstart dateDateOctober 19, 2006May 17, 2007Information GatheringData Request (Forms A and B) sent out as part <strong>of</strong> Phase A November 24, 2006<strong>Water</strong>shed field visit and meetings with various municipalities January 23, 2007Open meetings with <strong>Water</strong>shed representatives during Phase A to discussForms A and B<strong>District</strong> phone calls to communities after the September 13th and 14th, 2008storm eventFebruary 14, 2007September 15, 2008<strong>Cal</strong>umet-<strong>Sag</strong> Channel <strong>Water</strong>shed Planning Council Meetings (16) March 29, 2006June 26, 2006 September 12, 2006 November 29, 2006January 30, 2007 April 30, 2007 July 30, 2007September 25, 2007 November 29, 2007 January 30, 2008April 29, 2008 July 29, 2008 September 30, 2008November 24, 2008 January 28, 2009 April 29, 2009Modeling Results and Alternatives Review Meetings<strong>Cal</strong>umet-<strong>Sag</strong> Channel / Little <strong>Cal</strong>umet River coordination April 2, 2008Initial Model Review Workshop June 4 and 5, 2008Preliminary Alternatives Review Workshop August 14 and 15, 2008Final Alternatives Presentation Workshop September 24, 2008MWRDGC Board <strong>of</strong> Commissioners’ Study SessionsJanuary 10, 2006 April 27, 2006 October 2, 20081.3.1 Model SelectionH&H models were developed within the U.S. Army Corps <strong>of</strong> Engineers (USACE) HydrologicEngineering Center-Hydrologic Modeling System (HEC-HMS) Version 3.1.0 modelingapplication and Hydrologic Engineering Center-River Analysis System (HEC-RAS) Version4.0. These applications were identified as acceptable in Tables 6.10 and 6.11 <strong>of</strong> the CCSMP.The Soil Conservation Service (SCS) curve number (CN) loss module was used with the SCSUnit hydrograph methodology within HEC-HMS to model basin hydrology. The dynamicunsteady flow routing methodology was used within HEC-RAS. Both applications have anextensive toolkit to interface with geographic information systems (GIS) s<strong>of</strong>tware to produceinput data and display model results.1-3
CALUMET-SAG CHANNEL DETAILED WATERSHED PLAN1.3.2 Model Setup and Unit Numbering1.3.2.1 Hydrologic Model SetupHydrologic model data was primarily developed within the GeoHMS extension to Arc GISVersion 9.2. The extension provides an interface to geoprocessing functions used to characterizesubbasin parameters within the hydrologic model. GeoHMS was used to calculate theCN for each basin; to define the longest flow path, basin slope, and longest flow path slope;and to establish a network connecting hydrologic elements (e.g., subbasins, reservoirs,reaches, and inflow locations) to the outlet <strong>of</strong> the system. HEC-HMS was used to create andsometimes route stormwater run<strong>of</strong>f hydrographs to the upstream extent <strong>of</strong> hydraulic modelsdeveloped within HEC-RAS. Hydrologic model data was transferred between HEC-HMS and HEC-RAS through HEC-DSS files.Subbasin Delineation. Each major tributary model (Tinley Creek, Melvina Ditch, etc.) wassubdivided into subbasins roughly 100 acres in size to form the basis <strong>of</strong> the hydrologic modeland modeled assuming a unified response to rainfall based on land use characteristics and soiltype. Elevation data provided by Cook County, described in Section 2.3.4, was the principaldata source used for subbasin delineation. Drainage divides were established based uponconsideration <strong>of</strong> the direction <strong>of</strong> steepest descent from local elevation maxima, and refined insome instances to reflect modifications to topographic drainage patterns caused by stormwatermanagement infrastructure (storm sewer systems, culverts, etc.). Subbasin boundarieswere modified to encompass areas with similar development patterns. Finally, boundarieswere defined to most accurately represent the area tributary to specific modeled elements,such as constrictions caused by crossings, and reservoirs. GIS data was developed for all subbasinsdelineated and used for hydrologic model data development.Run<strong>of</strong>f Volume <strong>Cal</strong>culation. The SCS CN loss model uses the empirical CN parameter to calculaterun<strong>of</strong>f volumes based on landscape characteristics such as soil type, land cover, imperviousness,and land use development. Areas characterized by saturated or poorlyinfiltrating soils, or impervious development, have higher CN values, converting a greaterportion <strong>of</strong> rainfall volume into run<strong>of</strong>f. The SCS methodology uses Equation 1.1 to computestormwater run<strong>of</strong>f volume for each time step:Q =2( P − Ia)( P − I ) + SWhere:Q = run<strong>of</strong>f volume (in.)P = precipitation (in.)S = storage coefficient (in.)I a = initial abstractions (in.)aRainfall abstractions due to ponding and evapotranspiration can be simulated using an initialabstractions (I a ) parameter. In the <strong>Cal</strong>umet-<strong>Sag</strong> Channel <strong>DWP</strong>, the commonly used defaultvalue <strong>of</strong> I a , estimated as 0.2 × S, where S is the storage coefficient for soil in thesubbasin. S is related to CN through Equation 1.2:(1.1)1000S = −10 (1.2)CN1-4
1. INTRODUCTIONwhere:CN = curve number (dimensionless)S = storage coefficient (in,)Table 1.3.2 describes the input data used to develop the CN values throughout the watershed.TABLE 1.3.2Description <strong>of</strong> Curve Number Input DataVariable Used toDetermine CNApproach for Definition <strong>of</strong> Variable for<strong>Cal</strong>umet-<strong>Sag</strong> Channel <strong>Water</strong>shed Hydrologic ModelingGround cover Chicago <strong>Metropolitan</strong> Agency for Planning (CMAP) 2001 land use inventory (v.1.2 2006)is used to define land use. A lookup table was developed to link CMAP categories tocategories for which CN values have been estimated.Soil typeAntecedent moistureconditionThe Natural Resources Conservation Service (NRCS) publishes county soil surveys thatinclude a hydrologic classification <strong>of</strong> A, B, C, or D. If a soil group’s infiltration capacity isaffected by a high water table, it is classified as, for instance, “A/D,” meaning the drainedsoil has “A” infiltration characteristics, undrained “D.” It was assumed that half <strong>of</strong> thesesoil groups (by area) are drained.Antecedent Moisture Conditions (AMC) reflect the initial soil storage capacity available forrainfall. For areas within Northeastern Illinois, it is typical to assume an AMC <strong>of</strong> II.Specific combinations <strong>of</strong> land use and soil type were linked to CN values using a lookup tablebased on values recommended in Table 1.3.3 excerpted from TR-55: Urban Hydrology forSmall <strong>Water</strong>sheds (U.S. Department <strong>of</strong> Agriculture [USDA], 1986). The CN matrix includesassumptions about the imperviousness <strong>of</strong> land use classes, and therefore, percent imperviousdoes not need to be explicitly considered as the SCS run<strong>of</strong>f volume calculation. Since theCMAP land-use data does not correspond to the categories in Table 1.3.3, a mapping betweenTR-55 land use categories and CMAP land use categories was necessary. This processis detailed in Appendix C, which includes a technical memorandum detailing the processused to develop CN values for the <strong>Cal</strong>umet-<strong>Sag</strong> Channel <strong>Water</strong>shed.The GeoHMS tool was used to develop an area-weighted average CN for each subbasin.Run<strong>of</strong>f Hydrograph Production. The run<strong>of</strong>f volume produced for a subbasin is converted intoa basin-specific hydrograph by using a standard unit hydrograph and an estimate <strong>of</strong> basinlag time. The lag time is defined as the time elapsed between the centroid, by mass, <strong>of</strong> theprecipitation event and the peak <strong>of</strong> the run<strong>of</strong>f hydrograph at the outlet <strong>of</strong> the subbasin. Thelag time was estimated according to Equation 1.3, provided in the HEC-HMS Technical ReferenceManual (USACE, 2006):where:T = 0. 6 (1.3)lagT cT lag = Lag timeT c = Time <strong>of</strong> Concentration1-5
CALUMET-SAG CHANNEL DETAILED WATERSHED PLANTABLE 1.3.3Run<strong>of</strong>f Curve Numbers for Urban AreasCover Type and Hydrologic ConditionAvg. % ImperviousArea A B C DFully developed urban areas (vegetation established)Open Space (lawns, parks, golf courses, cemeteries, etc.)Poor condition (grass cover < 50%) 68 79 86 89Fair condition (grass cover 50 to 75%) 49 69 79 84Good condition (grass cover > 75%) 39 61 74 80Impervious AreasPaved parking lots, ro<strong>of</strong>s, driveways, etc. (excluding right-<strong>of</strong>-way) 98 98 98 98Streets and roadsPaved; curbs and storm sewers (excluding right-<strong>of</strong>-way) 98 98 98 98Paved; open ditches (including right-<strong>of</strong>-way) 83 89 92 93Gravel (including right-<strong>of</strong>-way) 76 85 89 91Dirt (including right-<strong>of</strong>-way) 72 82 87 89Western Desert Urban AreasNatural desert landscaping (pervious areas only) 63 77 85 88Artificial desert landscaping (impervious weed barrier, desert shrubwith 1- to 2-inch sand or gravel mulch and basin barriers96 96 96 96Urban <strong>District</strong>sCommercial and business 85 89 92 94 95Industrial 72 81 88 91 93Residential <strong>District</strong>s by Average Lot Size1/8 acre or less 65 77 85 90 921/4 acre 38 61 75 83 871/3 acre 30 57 72 81 861/2 acre 25 54 70 80 851 acre 20 51 68 79 842 acres 12 46 65 77 82Developing Urban AreasNewly Graded Areas (pervious areas only, no vegetation) 77 86 91 94Note: Average run<strong>of</strong>f condition, and Ia = 0.2S.Note: Table Source is TR-55: Urban Hydrology for Small <strong>Water</strong>sheds (U.S. Department <strong>of</strong> Agriculture, 1986)The time <strong>of</strong> concentration is the time it takes for a drop <strong>of</strong> water to travel from the hydraulicallyfurthest point in a watershed to the outlet. The time <strong>of</strong> concentration is estimated as the1-6
1. INTRODUCTIONsum <strong>of</strong> the travel time for three different segments <strong>of</strong> flow, split-up by flow type in eachsubbasin.Thus Equation 1.4:Where:T sheetT shallowT channelT = T + T + T (1.4)csheetshallowchannel= sheet flow; flow occurring across the land area headwater areas prior to flowaccumulation= shallow flow; occurs where sheet flow begins to accumulate into more concentratedpatterns, but prior to transitioning into open channel flow= flow within natural or manmade drainage facilities within each subwatershedprior to the point <strong>of</strong> dischargeGeoHMS-derived T c estimates were not considered accurate; however, GeoHMS also produceda definition <strong>of</strong> the longest flow path, its length, and slope. The basin parameter estimateswere exported to a spreadsheet to support calculation <strong>of</strong> T c .An alternative method <strong>of</strong> lag time calculations is the CN-based method, characterized inEquation 1.5 (SCS, 1978):Where:( S 1).8 +T lagL.7= (1.5).5( 1900Y)L = hydraulic length <strong>of</strong> the subbasinY = subbasin slopeS = storage coefficient (in.)These two approaches to calculation <strong>of</strong> lag time were performed for each subbasin and reviewed.The quasi-physical estimate <strong>of</strong> lag time described in Equation 1.4 was generallyused for most subbasins. For some subbasins with very low relief, the CN-based methodwas used as it was considered most representative <strong>of</strong> the run<strong>of</strong>f response <strong>of</strong> the watershed.Rainfall Data. Observed and design event rainfall data was used to support modeling evaluationsfor the <strong>DWP</strong>. Monitored rainfall data is described in Section 2.3.1. Design event rainfalldata was obtained from Bulletin 71, Rainfall Frequency Atlas <strong>of</strong> the Midwest (Huff, 1992). Designevent rainfall depths obtained from Bulletin 71 were used to support design eventmodeling performed for existing and proposed conditions assessment.1.3.3 Storm DurationA critical-duration analysis was performed to determine the storm duration that generally resultsin higher water surface estimates for a range <strong>of</strong> tributary sizes within the <strong>Cal</strong>umet-<strong>Sag</strong>Channel <strong>Water</strong>shed. The 12-hour duration storm was identified as the critical duration forstreams within the <strong>Cal</strong>umet-<strong>Sag</strong> Channel <strong>Water</strong>shed. A second quartile storm is recommendedfor storms <strong>of</strong> this duration (Huff, 1992). Table 1.3.4 summarizes rainfall depths for the12-hour duration storm.1-7
CALUMET-SAG CHANNEL DETAILED WATERSHED PLAN1.3.4 Areal Reduction FactorThe rainfall depths presented in Table 1.3.4 summarizeexpected point rainfall accumulation for modeledrecurrence intervals. The probability <strong>of</strong> uniformrainfall across a subwatershed decreases with increasingwatershed size. Table 21 in Bulletin 71 relatesareal mean rainfall depth to rainfall depth at apoint (Huff, 1992). Subwatersheds in the <strong>Cal</strong>umet-<strong>Sag</strong> Channel watershed that were large enough towarrant use <strong>of</strong> an areal reduction factor are Tinley,Long Run, and Stony Creeks. Modeled rainfalldepths were multiplied by approximately 0.98 to accountfor the expected decrease in probability <strong>of</strong> uniformrainfall. In addition, the rainfall distributionwas modified to the Quartile II distribution for basins10 to 50 square miles in area, as recommendedin Bulletin 71 (Huff, 1992).TABLE 1.3.4Rainfall DepthsRecurrenceInterval12-hr DurationRainfall Depth2-year 2.645-year 3.3110-year 3.8925- year 4.7950- year 5.62100-year 6.59500-year8.96 aa 500-year rainfall depth was determinedbased on a logarithmic relationship betweenrainfall depth and recurrence interval.1.3.5 Hydrologic RoutingStormwater run<strong>of</strong>f hydrographs were sometimes routed within HEC-HMS in upstream areaswhere the resolution <strong>of</strong> subbasins defined was greater than the hydraulic model extent.In areas where a channel cross section could be identified from topographic data, Muskingum-Cungerouting was performed using the approximate channel geometry from a representativecross section <strong>of</strong> the modeled hydrologic reach. In most <strong>of</strong> the watershed, it wasimpossible to identify channel cross sections in upstream areas. In those cases, a kinematicwave routing approximation was performed.1.3.6 Hydraulic Model SetupHydraulic model data typically was developed through field surveys with some additionaldefinition <strong>of</strong> channel overbank areas and roadway crests defined using Cook County topographicdata. Cross section locations were developed in HEC GeoRAS, and surveyed channelgeometry were inserted into topographically generated cross-sectional data. Cross sectionswere generally surveyed at intervals <strong>of</strong> 500 to 1,000 feet. Interpolated cross sections wereadded at many locations to the models to increase stability and reduce errors. Bridges, culverts,and other major hydraulic structures were surveyed within the hydraulic model extent.The locations <strong>of</strong> all surveyed and modeled cross sections, bridges, culverts, and otherstructures are shown in a figure within Appendix D.The Stony Creek hydraulic model was developed using data from a model developed by theUSACE in 2001. USACE calibrated the model, which is considered representative <strong>of</strong> existingconditions along Stony Creek. As part <strong>of</strong> the <strong>DWP</strong>, several cross sections were surveyed at locationswhere the USACE model had cross sections to compare and confirm that the modeldata reflected current conditions. This comparison concluded that the survey data in theUSACE model <strong>of</strong> Stony Creek was generally consistent, and that the USACE model was validfor defining inundation areas and evaluation <strong>of</strong> alternative improvement projects.1-8
1. INTRODUCTION1.3.6.1 Bridges, Culverts, and Hydraulic StructuresBridges, culverts, and hydraulic structures were surveyed consistent with FEMA mappingprotocol as identified in Guidelines and Specifications for Flood Hazard Mapping Partners,“Guidance for Aerial Mapping and Surveying” (FEMA 2003). A State <strong>of</strong> Illinois licensedpr<strong>of</strong>essional land surveyor certified each location as FEMA compliant. Documentation <strong>of</strong>certifications is provided in Appendix D. Bridges, culverts, and hydraulic structures weresurveyed consistent with the NAVD 1988 datum using 5-centimeter or better GPS procedures(as specified in NGS-58 for local network accuracy) or third-order (or better) differentialleveling, or trigonometric leveling for short distances. In a few cases, information fromconstruction plans was used for recently constructed bridges in lieu <strong>of</strong> surveying. Ineffectiveflow areas were placed at cross sections upstream and downstream <strong>of</strong> crossings, generallyassuming a contraction ratio <strong>of</strong> 1:1 and an expansion ratio <strong>of</strong> 2:1. Contraction and expansioncoefficients generally were increased to 0.3 and 0.5, respectively, at cross sections adjacent tocrossings.1.3.6.2 Cross-Sectional DataCross-sectional data was surveyed consistent with FEMA mapping protocol as identified inGuidelines and Specifications for Flood Hazard Mapping Partners, “Guidance for Aerial Mappingand Surveying” (FEMA 2003).All survey work, including survey <strong>of</strong> cross sections, was certified as compliant to FEMAmapping protocol by a State <strong>of</strong> Illinois licensed pr<strong>of</strong>essional land surveyor. Documentation<strong>of</strong> certifications is provided in Appendix D. Cross sections were surveyed consistent withthe North American Vertical Datum, 1988 (NAVD 1988) using 5-centimeter or better GPSprocedures (as specified in NGS-58 for local network accuracy) or third-order (or better) differentialleveling, or trigonometric leveling for short distances. Cross sections were interpolatedat many locations within the hydraulic models, to aid model stability and reduceerrors.1.3.6.3 Boundary ConditionsEstimated water surface elevations along the major receiving systems were compared tonormal depth <strong>of</strong> tributaries at the confluence. In most instances, normal depth estimates exceededthe elevation <strong>of</strong> the receiving system (i.e., <strong>Cal</strong>umet-<strong>Sag</strong> Channel or Chicago SanitaryShip Canal). This indicates that the downstream water surface elevation for the waterways isnot controlled by the receiving system, as <strong>of</strong>ten occurs at stream confluences, but by the ability<strong>of</strong> the tributary to convey the flows produced in the upstream tributary area. The fact thatboth the Chicago Sanitary Ship Canal (CSSC) and the <strong>Cal</strong>umet-<strong>Sag</strong> Channel are manmade,controlled waterways likely contributes to their relatively lower stage compared to theirtributaries. Levels <strong>of</strong> the CSSC and the <strong>Cal</strong>umet-<strong>Sag</strong> Channel are controlled by the <strong>District</strong> asrequired to support navigation and control flooding through operation <strong>of</strong> the Lockport Lockand Dam.In cases where the estimated water surface elevation <strong>of</strong> a channel was required, this data wastaken from the Chicago <strong>Water</strong>way System (CWS) UNET model, which was obtained fromthe USACE and converted to HEC-RAS to support <strong>DWP</strong> development. The I&M Canal wasassumed to be represented by water surface elevations along the CSSC as the two water bodiesare parallel and directly connected. The specific boundary conditions used for each model1-9
CALUMET-SAG CHANNEL DETAILED WATERSHED PLANare summarized in the tributary sections. Appendix E contains a detailed summary <strong>of</strong> the<strong>Cal</strong>umet-<strong>Sag</strong> Channel hydraulic conditions and methods used to estimate water surface elevationalong the CSSC and <strong>Cal</strong>umet-<strong>Sag</strong> Channel.1.3.7 Model Run SettingsAll hydraulic model simulations were carried out using the fully dynamic, unsteady flowsimulation settings within HEC-RAS. The Saint-Venant equations, or the continuity andmomentum balance equations for open channel flow, were solved using implicit finite differencescheme. HEC-RAS has the ability to model storage areas and hydraulic connectionsbetween storage areas and between stream reaches. The computational time step for modelruns varied between 10 and 60 seconds, as necessary for model stability.1.3.8 Model <strong>Cal</strong>ibration and VerificationModel calibration and verifications were performed for tributaries where monitoring datawas available to ensure that the hydrologic and hydraulic models accurately predict stormwaterrun<strong>of</strong>f response for a range <strong>of</strong> storm magnitudes. Available monitoring data used forcalibration is described in Section 2.3.1. Initial model runs were performed for Tinley Creek,Stony Creek, Mill Creek, <strong>Cal</strong>umet-<strong>Sag</strong> Tributary B, and Navajo Creek subwatersheds usinghydrologic and hydraulic parameters estimated from available GIS data (land-use, soils, topography)and field reconnaissance. Stages (or peak water surface elevation) and run<strong>of</strong>fvolumes were compared to modeled values for a variety <strong>of</strong> storms. Then, hydrologic andhydraulic parameters with uncertainty were modified within a reasonable range to betterrepresent monitored parameters. Stage was used as the primary calibration variable, sincestage directly impacts stormwater damages due to flooding. Stage is also the measuredvalue, both for high-water marks and the USGS gage, which uses a field-measured stageflowrelationship to calculate flow. Run<strong>of</strong>f volume was also considered, where monitoringdata was available.Initial calibration model results generally over-predicted stage, volume and peak flow ratesfor Stony Creek and Tinley Creek. Modification to lag time and curve number estimates, inthe hydrologic model, and the roughness coefficient in the hydraulic model, were consideredto address observed differences. Modification <strong>of</strong> the lag time was observed to have aminor impact on model results. While discrepancies in stage could be addressed by loweringthe roughness coefficient on Tinley Creek, this would increase the over-prediction <strong>of</strong>peak flow, and would not address the over-prediction <strong>of</strong> run<strong>of</strong>f volume. Furthermore, stagewas also over-predicted on Stony Creek for its initial calibration runs, and the Stony Creekroughness coefficients were already at the lower end <strong>of</strong> the acceptable range <strong>of</strong> values. Althoughno flow data was available, initial roughness coefficients were considered relativelylow. For these reasons, the reduction <strong>of</strong> curve number values was considered the bestmethod <strong>of</strong> achieving better correspondence between observed and modeled parameters. A10 percent curve number reduction from the originally calculated values resulted in the bestfit with monitored values for the storms considered.Detailed calibration results are presented in subwatershed subsections, including hydrographsand comparisons <strong>of</strong> stage and, where available, run<strong>of</strong>f volume. Subwatersheds withavailable calibration data represent a subset <strong>of</strong> the <strong>Cal</strong>umet-<strong>Sag</strong> Channel <strong>Water</strong>shed. <strong>Cal</strong>ibrationdata was available for both the northern part <strong>of</strong> the watershed, with its flatter topog-1-10
1. INTRODUCTIONraphy and higher-density development, and the southern part <strong>of</strong> the watershed with morevaried topography and less dense suburban development. The 10 percent reduction <strong>of</strong> curvenumber was applied to un-gaged subwatersheds since it was found to be necessary for similargaged areas <strong>of</strong> the watershed.1.3.9 Flood Inundation MappingFlood inundation maps were produced to display the inundation areas associated with the100-year event. The flood inundation maps were produced by overlaying the results <strong>of</strong> thehydraulic modeling on the ground elevation model <strong>of</strong> the watershed, which was derivedfrom Cook County LiDAR data.1.3.10 Discrepancies Between Inundation Mapping and Regulatory Flood MapsDiscrepancies may exist between inundation mapping produced under this <strong>DWP</strong> and regulatoryflood maps. Discrepancies may be the result <strong>of</strong> updated rainfall data, more detailedtopographic information, updated land use data, and differences in modeling methodology.A discussion <strong>of</strong> discrepancies is included in Appendix A.1.3.11 Model ReviewThe hydrologic and hydraulic models developed under this <strong>DWP</strong> were independently reviewedby Christopher B. Burke Engineering, Ltd (CBBEL). CBBEL’s review <strong>of</strong> the hydrologicmodels included a general verification <strong>of</strong> drainage areas, sub-basin divides, andhydrologic model parameters such as Curve Number and Time <strong>of</strong> Concentration. CBBEL’sreview <strong>of</strong> the hydraulic models included a general verification <strong>of</strong> roughness values, bankstations, ineffective flow areas, hydraulic structures, boundary conditions and connectivitywith the hydrologic model output files. A significant recommendation from the independentreview was to calibrate the models to a large storm event which occurred in the <strong>Cal</strong>umet-<strong>Sag</strong>Channel watershed over the period September 13th to 14th, 2008. This and otherrecommendations from the independent review have been addressed in the hydrologic andhydraulic models developed to support the <strong>Cal</strong>umet-<strong>Sag</strong> Channel <strong>DWP</strong>.1.4 Development and Evaluation <strong>of</strong> Alternatives1.4.1 Problem Area IdentificationProblem area data for the <strong>Cal</strong>umet-<strong>Sag</strong> Channel <strong>Water</strong>shed was generated from twosources. The first was community response data that identified flooding, erosion, waterquality, and maintenance problems recognized by the communities to be problems. In addition,problem areas were identified by overlaying the results <strong>of</strong> H&H modeling on theground elevation model <strong>of</strong> the watershed to identify structures at risk <strong>of</strong> flooding along regionalwaterways. Modeled flood problems generally corroborated the communities’ reportedproblems; however, in many instances, the model results also showed additionalareas at risk <strong>of</strong> flooding for larger magnitude events. A secondary source <strong>of</strong> problem areaidentification was the existing FEMA FIRM panel maps. Areas shown within FEMA floodplainwere carefully considered in H&H modeling and communication with communities inorder to identify problem areas.1-11
CALUMET-SAG CHANNEL DETAILED WATERSHED PLAN1.4.2 Economic Analysis1.4.2.1 Flood DamagesProperty damages due to flooding were assessed based upon the intersection <strong>of</strong> inundationareas for modeled recurrence intervals (2-, 5-, 10-, 25-, 50-, and 100-year) with the CookCounty parcel data, considering ground elevation data, to calculate estimated flood depths.Damages were estimated using a methodology consistent with one developed by theUSACE that estimates structure and contents damage as a fraction <strong>of</strong> structure value andbased upon the estimated depth <strong>of</strong> flooding (USACE 2003). The general procedure estimatingproperty damage due to flooding is outlined in Appendix F <strong>of</strong> the CCSMP. This method<strong>of</strong> damage calculation requires estimating a number <strong>of</strong> parameters for properties at risk <strong>of</strong>flooding which are detailed below.The foundation for property damage values due to flooding is derived from the 2006 CookCounty Tax Assessor (CCTA) data multiplied by a standard factor derived from a statisticalanalysis comparing recent sales data to the CCTA property values. The CCTA data includestax assessed value <strong>of</strong> land, improvements, total tax assessed value, structure class (residentialsingle family, multi-family, industrial etc.), number <strong>of</strong> stories, basement information,land area (square footage), and other data fields not relevant to this study.1.4.2.2 Identification <strong>of</strong> Parcels at Risk <strong>of</strong> FloodingParcel boundaries were converted to points within the GIS application, and then the pointswere moved to the low side <strong>of</strong> structures at risk <strong>of</strong> flooding. Intersection <strong>of</strong> floodplainboundaries with parcel data was then performed for each modeled recurrence intervalstorm and used to identify parcels within the subwatershed that may, based upon theirzero-damage elevations, be subject to property damage due to flooding for a particular recurrenceinterval.1.4.2.3 Parcel Zero Damage ElevationStructures do not incur damage due to flooding until the water surface exceeds the zerodamageelevation, at which water is assumed to begin flowing into the structure and causedamages. For most structures, the zero-damage elevation is the ground surface. Floodwatersexceeding the ground surface may enter the structure through doorways, window wells,and other openings within the structure. The zero-damage elevation was assumed to be theground elevation for all parcels within the <strong>Cal</strong>umet-<strong>Sag</strong> Channel <strong>Water</strong>shed. The groundelevation estimate was obtained at the point representing the parcel, generally on the lower,stream-side <strong>of</strong> the actual structure.1.4.2.4 Parcel First Floor ElevationUSACE depth-damage curves relate flooding depths to the first floor elevation <strong>of</strong> the structure,a value not provided within the CCTA data. First floor elevations (FFE) generally werenot surveyed for the <strong>Cal</strong>umet-<strong>Sag</strong> Channel <strong>DWP</strong>, as that would require several thousandmeasurements. A sample <strong>of</strong> several hundred field measurements <strong>of</strong> the FFE <strong>of</strong>fset fromground elevation were collected in the <strong>Cal</strong>umet-<strong>Sag</strong> Channel <strong>Water</strong>shed to document expectedvalues and variability <strong>of</strong> this component <strong>of</strong> the damage analysis. Based upon review<strong>of</strong> the collected first floor elevations, it was not possible to identify a pattern to predict the1-12
1. INTRODUCTIONfirst floor elevation based upon factors such as subwatershed, estimated age <strong>of</strong> structure, orstructure type. Furthermore, it was noted that the average first floor elevation <strong>of</strong>fset wasroughly 18 inches, or slightly lower for structures that did not have basements. Based uponthe data collected, first floor elevation <strong>of</strong>fsets from ground elevation were estimatedthroughout the watershed as 18 inches for structures with basements, and 12 inches forstructures without. This is consistent with the elevation <strong>of</strong>fsets used by the USACE in itsstudy <strong>of</strong> Stony Creek (USACE, 1996).1.4.2.5 Structure Estimated ValueThe estimated value <strong>of</strong> flooded structures is an input to damage calculations. The CCTAdata included data that identified values for the land value as well as the improvementvalue (i.e., building, garage, etc.). The values in the CCTA data are assessed valuations <strong>of</strong>the estimated property value, which require a factor to bring the value, depending on thestructure’s use, to the CCTA estimation <strong>of</strong> property value. For example, residential structuresreceive an assessed valuation <strong>of</strong> 16 percent, thus the value identified by CCTA is theCCTA estimated value divided by a standardized 0.16. The adjusted CCTA data (reportedvalues divided by the assessed valuation factor) was then compared with recent sales datathroughout the county to statistically derive a multiplier that brings the 2006 CCTA estimatedvalue <strong>of</strong> the properties to 2008 market value <strong>of</strong> properties. This multiplier was calculatedto be 1.66. Since this plan analyzes damage to the structure, the land component <strong>of</strong> theproperty value was removed from the analysis by applying the assessed valuation multiplierand the <strong>District</strong> calculated market value multiplier to the improvement value identifiedin the CCTA data to produce a value <strong>of</strong> the structure. This method was used on allproperty types to generate information to be used in the damage calculations.1.4.2.6 Depth-Damage CurvesSix residential depth-damage curves were obtained from the USACE technical guidancememorandum EGM 04-01 (USACE, 2003) to relate estimated structure and contents damageto structure replacement value as a function<strong>of</strong> flooding depth. These damagecurves are one story, two-story, and splitlevelresident structures, either with orwithout basements. For nonresidentialstructures, a depth-damage curve representingthe average <strong>of</strong> structure and contentsdepth damage curves for a variety <strong>of</strong>structure types, generated by the Galveston<strong>District</strong> <strong>of</strong> the USACE was selected foruse. Appendix F contains the depthdamagecurves used to calculate propertydamage due to flooding. CCTA data wasanalyzed to identify the number <strong>of</strong> storieson residential structures and the presenceor absence <strong>of</strong> a basement.FIGURE 1.4.1Hypothetical Damage-Frequency Relationship1-13
CALUMET-SAG CHANNEL DETAILED WATERSHED PLAN1.4.2.7 Property Damage <strong>Cal</strong>culationThe estimated structure value, flooding depth, and depth-damage curve information wereused to estimate the property damage from flooding for a specific structure due to a storm <strong>of</strong>given recurrence interval. Higher magnitude events, such as the 100-year event, cause higherdamages for flooded properties but also have a lower likelihood <strong>of</strong> occurring in a given year.Figure 1.4.1 shows the hypothetical relationship between expected damage and modeled recurrenceinterval. Estimated annual damages were calculated according to Appendix F <strong>of</strong>Chapter 6 <strong>of</strong> the CCSMP, essentially weighting the expected annual damages by their annualprobability <strong>of</strong> occurrence. Damages were then capitalized over a 50-year period <strong>of</strong> analysis,consistent with the period <strong>of</strong> analysis over which maintenance and replacement costs werecalculated, using the federal discount rate for 2008 <strong>of</strong> 4.875 percent.1.4.2.8 Erosion DamagesLocations <strong>of</strong> potential erosion risk were identified through community response data. TheCCSMP contains direction that erosion damages be estimated as the full value <strong>of</strong> structures at“imminent risk” <strong>of</strong> damage due to stream bank erosion, and that erosion damages not be assessedfor loss <strong>of</strong> land. Field visits to areas identified as erosion problems were performed.Properties and infrastructure were judged to be at imminent risk if they were located within30 feet <strong>of</strong> a site <strong>of</strong> active erosion, characterized by exposed earth, lack <strong>of</strong> vegetation, or collapsingbanks. The estimated market value <strong>of</strong> the structure derived from CCTA data was used toestimate erosion damages for structures deemed at imminent risk. For infrastructure at riskother than property, such as roads and utilities, an estimate <strong>of</strong> the replacement value <strong>of</strong> thesestructures was used to assess erosion damages.1.4.2.9 Transportation DamagesTransportation damage generally was estimated as 15 percent <strong>of</strong> property damage due t<strong>of</strong>looding. In some specific instances, significant transportation damages may occur in absence<strong>of</strong> attendant property damage due to flooding. For the <strong>Cal</strong>umet-<strong>Sag</strong> Channel <strong>Water</strong>shed,specific transportation damages were calculated when flooding fully blocked allaccess to a specific area in the watershed and these damages were not adequately capturedas a fraction <strong>of</strong> property damages. In such instances, transportation damages were calculatedaccording to FEMA guidance in the document “What Is a Benefit?” (FEMA, 2001). Theduration <strong>of</strong> road closure was estimated for the modeled storms, and transportation damagewas calculated according to a value <strong>of</strong> $32.23 per hour <strong>of</strong> delay per vehicle based on averagetraffic counts.1.4.3 Alternative Development and EvaluationPotential stormwater improvements, referred to within the <strong>DWP</strong> as alternatives, were developedusing a systematic procedure to screen, develop, and evaluate technologies consistentlythroughout the <strong>Cal</strong>umet-<strong>Sag</strong> Channel <strong>Water</strong>shed. Tributary-specific technologies werescreened and evaluated in consideration <strong>of</strong> the stormwater problems identified throughcommunity response data and modeling. An alternative is a combination <strong>of</strong> the technologiesdeveloped to address the identified stormwater problems. In many instances, communitieshad ideas or suggestions regarding potential resolution <strong>of</strong> their stormwater problems, and1-14
1. INTRODUCTIONthese ideas were solicited during workshops and subsequent comment periods and were consideredduring alternative development.Alternatives were evaluated with respect to their ability to reduce flooding, erosion, andother damages under existing conditions. The reduction in expected damages for an alternativeis called a benefit. Conceptual level costs were developed for each alternative usingcountywide unit cost data that considered expected expenses such as excavation, landacquisition,pipe costs, channel lining, etc. Standard countywide markups were used to accountfor the cost <strong>of</strong> utility relocation, pr<strong>of</strong>it, design engineering and construction managementcosts, and contingency. Expected maintenance and replacement costs were consideredover a 50-year design period. Detailed design studies are required to confirm the details associatedwith the feasibility <strong>of</strong> construction and precise configuration <strong>of</strong> proposed facilities.Additional non-economic factors, such as the number <strong>of</strong> structures protected, the expectedwater-quality benefit, and the impact on wetland or riparian areas were considered in alternativedevelopment and evaluation.1.4.3.1 Flood ControlFlood control technologies were considered during the development <strong>of</strong> alternatives for addressingflooding problems, as summarized in Table 1.4.1. After selection <strong>of</strong> an appropriatetechnology or technologies for a problem area, and review <strong>of</strong> information provided by communitiesand obtained from other sources (such as aerial photography and parcel data) regardingpotentially available land, conceptual alternatives were developed.Hydrologic or hydraulic models for alternative conditions were created to analyze the effect<strong>of</strong> the conceptual alternatives. Initial model runs were performed to determine whether an alternativesignificantly affected water surface elevation (WSEL) near the target problem area,or had negative impacts in other parts <strong>of</strong> the tributary area. For models that resulted in significantreduction in WSEL, a full set <strong>of</strong> alternative conditions model runs was performed, andexpected damages due to flooding were evaluated for the alternative conditions. Benefits werecalculated based on damages reduced from existing to proposed conditions.1.4.3.2 Floodpro<strong>of</strong>ing and AcquisitionAlternatives consisting <strong>of</strong> structural flood control measures may not feasibly provide a 100-year level <strong>of</strong> protection for all structures. The <strong>DWP</strong> identifies areas that will experience floodingat the 100-year event, even if recommended alternatives are implemented. Floodpro<strong>of</strong>ingand/or acquisition <strong>of</strong> such structures are nonstructural flood control measures that may reduceor eliminate damages during flood events, which is why these measures are listed in Table1.4.1. However, due to the localized nature <strong>of</strong> implementing such solutions, the <strong>District</strong>may look to address structures that are candidates for nonstructural flood control measuresunder separate initiatives, outside <strong>of</strong> the Capital Improvement Program (CIP).1.4.3.3 Erosion ControlErosion control alternatives were developed to address problem areas where erosion problemson regional waterways were determined to threaten structures. Damages were calculatedbased on the value <strong>of</strong> the threatened structures. Erosion control alternativesconsidered a full range <strong>of</strong> alternative technologies as summarized in Table 1.4.2.1-15
CALUMET-SAG CHANNEL DETAILED WATERSHED PLAN1.4.3.4 <strong>Water</strong> QualityThe potential effect <strong>of</strong> alternatives on water quality was considered qualitatively. Most detentionbasins built for flood control purposes have an ancillary water quality benefit because pollutantsin sediment will settle out while water is detained. Sediments can be removed as a part<strong>of</strong> maintenance <strong>of</strong> the detention basin, preventing the pollutants from entering the waterway.Detention basins typically have a sediment forebay specifically designed for this purpose. Somedetention basins could be designed as created wetland basins with wetland plants includedwhich could naturally remove pollutants and excess nutrients from the basin. Erosion controlalternatives can help address water quality problems through reduction <strong>of</strong> sedimentation.TABLE 1.4.1Flood Control TechnologiesFlood ControlOption Description Technology RequirementsDetention/RetentionDetention facilities(Dry basins)Retention facilities(Wet basins)Pumped detentionUnderground detentionBioretentionImpoundments to temporarily store stormwaterin normally dry basins.Impoundments that include a permanent poolwhich stores stormwater and removes it throughinfiltration and evaporation. Retention facilitiesgenerally have an outfall to the receiving waterwaythat is located at an elevation above thepermanent pool.Similar to detention or retention facilities, butincludes a portion <strong>of</strong> the impoundment whichcannot be drained by gravity and must bepumped out.A specialized form <strong>of</strong> storage where stormwateris detained in underground facilities such asvaults or tunnels. Underground detention mayalso be pumped.Decentralized microbasins distributed throughouta site or watershed to control run<strong>of</strong>f close towhere it is generated. Run<strong>of</strong>f is detained in thebioretention facilities and infiltrated into the soiland removed through evapotranspiration.Open space, available land. Only anupstream option.Open space, available land. Only anupstream option.Open space, available land. Only anupstream option. Best applied whensignificant area is available to allow forfilling only during large storms.Space without structures, availableland. Only an upstream option. Significantlymore expensive than aboveground facilities. Surface disruptionmust be acceptable during construction.Open space, multiple available opportunitiesfor various sizes <strong>of</strong> openspace.Conveyance ImprovementCulvert/bridge replacementChannel improvementEnhancement <strong>of</strong> the hydraulic capacity <strong>of</strong> culvertsor bridges through size increase, roughnessreduction, and removal <strong>of</strong> obstacles (forexample, piers).Enhancement <strong>of</strong> the hydraulic capacity <strong>of</strong> thechannels by enlarging cross sections (for example,floodplain enhancement), reducing roughness(for example, lining), or channelrealignment.Applicable only if restricted flow and nonegative impact upstream or downstream.May require compensatorystorage to prevent negative downstreamimpact. Permitting requirementsand available adjacent land.No negative upstream or downstreamimpact <strong>of</strong> increased conveyance capacity.Permitting requirements andavailable adjacent land. Permanentand/or construction easements.1-16
1. INTRODUCTIONTABLE 1.4.1Flood Control TechnologiesFlood ControlOption Description Technology RequirementsFlood BarriersLeveesFloodwallsAcquisitionFloodpro<strong>of</strong>ingElevationDry Floodpro<strong>of</strong>ingWet Floodpro<strong>of</strong>ingEarth embankments built along rivers andstreams to keep flood waters within a channel.Vertical walls typically made <strong>of</strong> concrete or otherhard materials built along rivers and streams tokeep flood waters within a channel.Acquisition and demolition <strong>of</strong> properties in thefloodplain to permanently eliminate flood damages.In some cases, acquired property can beused for installation <strong>of</strong> flood control facilities.Modification <strong>of</strong> a structure’s foundation to elevatethe building above a given flood level.Typically applied to houses.Installation <strong>of</strong> impermeable barriers and floodgates along the perimeter <strong>of</strong> a building to keepflood waters out. Typically deployed aroundcommercial and industrial buildings that cannotbe elevated or relocated.Implementation <strong>of</strong> measures that do not preventwater from entering a building but minimizedamages; for example, utility relocation and installation<strong>of</strong> resistant materials.Permitting requirements and availableadjacent land. Wide floodplains will beanalyzed. Requires 3 feet <strong>of</strong> freeboardto remove structures behind leveesfrom regulatory floodplain. Often requirescompensatory storage.Permitting requirements and availableadjacent land. Permanent and/or constructioneasements.Severe flooding, repetitive losses,other alternatives are not feasible.Severe flooding, repetitive losses,other alternatives are not feasibleBetter suited for basement or shallowflooding. Need the ability to provideclosure <strong>of</strong> openings in walls or levees.Plan for emergency access to permitevacuation.Most applicable for larger buildingswhere content damage due to floodingcan be minimized. <strong>Water</strong>pro<strong>of</strong>ingsealant applied to walls and floors, afloor drain and sump pump.TABLE 1.4.2Erosion Control TechnologiesErosion ControlOption Description Technology RequirementsNatural (vegetatedor bioengineered)stabilizationVegetating bysodding, seeding,or plantingThe stabilization and protection <strong>of</strong> eroding overland flow areasor stream banks with selected vegetation using bioengineeringtechniques. The practice applies to natural or excavated channelswhere the stream banks are susceptible to erosion fromthe action <strong>of</strong> water, ice, or debris and the problem can besolved using vegetation. Vegetative stabilization is generallyapplicable where bankfull flow velocity does not exceed 5 ft/secand soils are more erosion resistant, such as clayey soils.Combinations <strong>of</strong> the stabilization methods listed below andothers may be used.Establishing permanent vegetative cover to stabilize disturbed orexposed areas. Required in open areas to prevent erosion andprovide run<strong>of</strong>f control. This stabilization method <strong>of</strong>ten includesthe use <strong>of</strong> geotextile materials to provide stability until the vegetationis established and able to resist scour and shear forces.Requires stream bankslopes flat enough to preventslope failure basedupon underlying soils.Channels with steep bankswith no room for expansionor high bank full velocities(> 5 ft/sec) should avoidthese technologies.1-17
CALUMET-SAG CHANNEL DETAILED WATERSHED PLANTABLE 1.4.2Erosion Control TechnologiesErosion ControlOption Description Technology RequirementsVegetated armoring(jointplanting)Vegetated cellulargrid (erosionblanket)Reinforcedgrass systemsLive cribwallStructural stabilizationInterlockingconcreteRiprapGabionsGrade ControlConcretechannelsThe insertion <strong>of</strong> live stakes, trees, shrubs, and other vegetationin the openings or joints between rocks in riprap or articulatedblock mat (ABM). The object is to reinforce riprap or ABM byestablishing roots into the soil. Drainage may also be improvedthrough extracting soil moisture.Lattice-like network <strong>of</strong> structural material installed with plantedvegetation to facilitate the establishment <strong>of</strong> the vegetation, butnot strong enough to armor the slope. Typically involves theuse <strong>of</strong> coconut or plastic mesh fiber (erosion blanket) that maydisintegrate over time after the vegetation is established.Similar to the vegetated cellular grid, but the structural coverageis designed to be permanent. The technology can includethe use <strong>of</strong> mats, meshes, interlocking concrete blocks, or theuse <strong>of</strong> geocells containing fill material.Installation <strong>of</strong> a regular framework <strong>of</strong> logs, timbers, rock, andwoody cuttings to protect an eroding channel bank with structuralcomponents consisting <strong>of</strong> live wood.Stabilization <strong>of</strong> eroding stream banks or other areas by use <strong>of</strong>designed structural measures, such as those described below.Structural stabilization is generally applicable where flow velocitiesexceed 5 ft/sec or where vegetative stream bank protectionis inappropriate.Interlocking concrete may include A-Jacks®, ABM, or similarstructural controls that form a grid or matrix to protect thechannel from erosion. A-Jacks armor units may be assembledinto a continuous, flexible matrix that provides channel toe protectionagainst high velocity flow. The matrix <strong>of</strong> A-Jacks can bebackfilled with topsoil and vegetated to increase system stabilityand to provide in-stream habitat. ABM can be used with orwithout joint planting with vegetation. ABM is available in severalsizes and configurations from several manufacturers. Thesize and configuration <strong>of</strong> the ABM is determined by the shearforces and site conditions <strong>of</strong> the channel.A section <strong>of</strong> rock placed in the channel or on the channel banksto prevent erosion. Riprap typically is underlain by a sand andgeotextile base to provide a foundation for the rock, and to preventscour behind the rock.Gabions are wire mesh baskets filled with river stone <strong>of</strong> specificsize to meet the shear forces in a channel. Gabions are usedmore <strong>of</strong>ten in urban areas where space is not available forother stabilization techniques. Gabions can provide stabilitywhen designed and installed correctly, but failure more <strong>of</strong>ten issudden rather than gradual.A constructed concrete channel designed to convey flow at ahigh velocity (greater than 5 ft/sec) where other stabilizationmethods cannot be used. May be suitable in situations wheredownstream areas can handle the increase in peak flows andthere is limited space available for conveyance.Prevent stream bank erosion from excessive discharge velocitieswhere stormwater flows out <strong>of</strong> a pipe. Outlet stabilizationmay include any method discussed above.Applicable to areas withsteep stream bank slopes(> 3:1) and no room forchannel expansion, or areaswith high velocities(> 5 ft/sec) can benefit fromthis technology.1-18
1. INTRODUCTION1.4.3.5 Potential Funding SourcesProjects identified in the <strong>Cal</strong>umet-<strong>Sag</strong> Channel <strong>DWP</strong> may be eligible for funding throughone <strong>of</strong> several different USACE programs. The following is a summary <strong>of</strong> the USACE programsthat may be available for <strong>DWP</strong> identified flood and erosion control projects:• Section 205 <strong>of</strong> the <strong>Water</strong> Resources Development Act <strong>of</strong> 2005 allows the USACE to participatein funding small flood control projects <strong>of</strong> up to $7,000,000 (in federal costs), witha local cost-share requirement <strong>of</strong> 35 percent <strong>of</strong> the total project cost. USACE funding beyondthe maximum limit set for Section 205 projects is possible, but would require studyauthority and specific authorization for construction.• Section 219 <strong>of</strong> the <strong>Water</strong> Resources Development Act <strong>of</strong> 2005 allows the USACE to participatein environmental infrastructure projects. Section 219 does not have a maximumproject cost limit and requires a 25 percent local share <strong>of</strong> cost participation.• Section 14 <strong>of</strong> the 1946 Flood Control Act allows the USACE to participate in projects tomake emergency streambank repairs up to an amount <strong>of</strong> $1.5 million. Section 14 requiresa 35 percent local share <strong>of</strong> cost participation and can only be used to protect publicinfrastructure. Private property is not eligible for Section 14 funding.In addition to the USACE, FEMA is also a potential federal partner for funding projects. TheFlood Mitigation Assistance (FMA) program was created as part <strong>of</strong> the National Flood InsuranceReform Act (NFIRA) <strong>of</strong> 1994 (42 U.S.C. 4101) with the goal <strong>of</strong> reducing or eliminatingclaims under the National Flood Insurance Program (NFIP). FEMA provides FMA fundsto assist States and communities in implementing measures that reduce or eliminate thelong-term risk <strong>of</strong> flood damage to buildings, manufactured homes, and other structures insurableunder the National Flood Insurance Program. Project grants are available to statesand communities to implement measures to reduce flood losses, such as elevation, acquisition,or relocation <strong>of</strong> NFIP-insured structures. States are encouraged to prioritize FMA fundsfor applications that include repetitive loss properties; these include structures with 2 ormore losses each with a claim <strong>of</strong> at least $1,000 within any 10-year period since 1978. Moreinformation about FMA funding is available at http://www.fema.gov/government/grant/fma/index.shtm.1-19
2. <strong>Water</strong>shed Characteristics2.1 General <strong>Water</strong>shed DescriptionThe <strong>Cal</strong>umet-<strong>Sag</strong> Channel <strong>Water</strong>shed is in the southwestern part <strong>of</strong> Cook County. The majorreceiving water body for the watershed—the <strong>Cal</strong>umet-<strong>Sag</strong> Channel—was constructed in 1922and later widened to improve shipping capacity. It connects in <strong>Cal</strong>umet Park with the Little<strong>Cal</strong>umet River and in Lemont with the CSSC. The largest tributaries to the <strong>Cal</strong>umet-<strong>Sag</strong>Channel include Tinley Creek, Mill Creek, and Stony Creek. The <strong>District</strong> has establishedboundaries <strong>of</strong> the <strong>Cal</strong>umet-<strong>Sag</strong> Channel <strong>Water</strong>shed for purposes <strong>of</strong> its stormwater managementprogram. Figure ES.1 shows the location and the <strong>District</strong>’s established boundaries <strong>of</strong> the<strong>Cal</strong>umet-<strong>Sag</strong> Channel <strong>Water</strong>shed. It should be noted that in some areas, the boundaries establishedby the <strong>District</strong> differ with natural watershed boundaries. For example, the boundaryextends to the Cook-Will County line, which includes the upstream parts <strong>of</strong> Spring Creek,Long Run Creek, Marley Creek, and Tampier Slough, although these waterways drain southwestinto Will County, and are tributary to the Hickory Creek <strong>Water</strong>shed which eventuallydrains to the Des Plaines River. The scope <strong>of</strong> the <strong>Cal</strong>umet-<strong>Sag</strong> Channel <strong>DWP</strong> includes thesewaterways and also some that drain to the I&M Canal, in addition to those draining to the<strong>Cal</strong>umet-<strong>Sag</strong> Channel.Figure ES.1 shows the municipal boundaries and the major streams within the <strong>Cal</strong>umet-<strong>Sag</strong>Channel <strong>Water</strong>shed. Figure ES.1 also shows the subwatershed divides for the major streamswithin the <strong>Cal</strong>umet-<strong>Sag</strong> Channel <strong>Water</strong>shed. Table 2.1.1 lists the municipalities within the <strong>Cal</strong>umet-<strong>Sag</strong>Channel <strong>Water</strong>shed. Table 2.1.2 lists the major streams and tributaries to the <strong>Cal</strong>umet-<strong>Sag</strong>Channel and stream lengths. Each stream is briefly described with a narrative in the followingsubsection.TABLE 2.1.1Municipalities in the <strong>Cal</strong>umet-<strong>Sag</strong> Channel <strong>Water</strong>shedMunicipality% <strong>of</strong> MunicipalityArea within <strong>Cal</strong>umet-<strong>Sag</strong>Channel<strong>Water</strong>shed% <strong>of</strong> <strong>Cal</strong>umet-<strong>Sag</strong>Channel <strong>Water</strong>shedArea by MunicipalityMunicipality% <strong>of</strong> MunicipalityArea within <strong>Cal</strong>umet-<strong>Sag</strong>Channel<strong>Water</strong>shed% <strong>of</strong> <strong>Cal</strong>umet-<strong>Sag</strong>Channel <strong>Water</strong>shedArea by MunicipalityAlsip 100 4.2 Midlothian 19 0.4Bedford Park 98 3.8 Oak Forest 27 1.0Blue Island 71 1.9 Oak Lawn 100 5.7Bridgeview 100 2.7 Orland Hills 82 0.6Burbank 100 2.8 Orland Park 92 11.6Chicago 3 4.9 Palos Heights 100 2.5Chicago Ridge 100 1.5 Palos Hills 100 2.7Crestwood 96 1.9 Palos Park 100 2.5Evergreen Park 98 2.0 Robbins 23 0.2Hickory Hills 100 1.9 Summit 76 1.0Hometown 53 0.2 Tinley Park 6 0.6Justice 99 1.9 Willow Springs 48 1.2Lemont 85 3.6 Worth 100 1.6Merrionette Park 100 0.32-1
CALUMET-SAG CHANNEL DETAILED WATERSHED PLANTABLE 2.1.2<strong>Cal</strong>umet-<strong>Sag</strong> Channel <strong>Water</strong>shed Open Channel Stream LengthsOpen Channel Name Length (miles) Open Channel Name Length (miles)<strong>Cal</strong>umet-<strong>Sag</strong> Channel 15.8 <strong>Cal</strong>umet-<strong>Sag</strong> Tributary C 1.6I & M Canal 15.4 I & M Canal Tributary A 1.6Tinley Creek 9.3 Oak Lawn Creek 1.4Mill Creek 6.7 Ken Kay Ditch 1.4West Stony Creek 5.9 I & M Canal Tributary B 1.4Marley Creek a 5.9 Boca Rio Ditch 1.1Long Run Creek a 4.4 Melvina Ditch 1.0East Stony Creek 4.0 <strong>Cal</strong>umet-<strong>Sag</strong> Tributary B 1.0Spring Creek a 3.3 Justice Ditch 0.9Crooked Creek 2.9 Crestwood Drainage Ditch 0.9<strong>Cal</strong>umet-<strong>Sag</strong> Tributary A 2.5 I & M Canal Tributary D 0.8Tampier Slough a 2.4 Merrionette Park Ditch 0.7Mosquito Creek 2.4 71st Street Ditch 0.6Lucas Ditch 2.1 <strong>Cal</strong>umet-<strong>Sag</strong> Tributary AA 0.6Navajo Creek 2.1 I & M Canal Tributary C 0.5Mill Creek West Branch 1.9 Arroyo Ditch 0.2Lucas Diversion Ditch 1.7 Total 104.4a Stream drains southwest into Will County.Table 2.1.3 lists the subwatersheds each municipality drains to, with subwatersheds listed indecreasing order based upon the area within the municipality. Although municipalities contributestormwater to the listed subwatersheds, the actual stream may not be includedwithin the municipality’s boundaries.TABLE 2.1.3Municipality and Subwatersheds within the Municipality BoundaryMunicipalityAlsipBedford ParkBlue IslandSubwatersheds within Municipality Boundary (square miles)Stony Creek East(3.21), <strong>Cal</strong>-<strong>Sag</strong> 7(1.49), Mosquito Creek(0.91), <strong>Cal</strong>-<strong>Sag</strong> 8(0.51), <strong>Cal</strong>-<strong>Sag</strong>6 (0.24), <strong>Cal</strong>-<strong>Sag</strong> 9 b , Merrionette Park Ditch bc , Ken Kay Ditch b , Stony Creek b , Tinley Creek bStony Creek(2.57), Melvina Ditch(2.57 c ), I&M Canal(1.17), I&M 5(0.93), 71st St. Ditch(0.42)<strong>Cal</strong>-<strong>Sag</strong> 10(1.77), Stony Creek East(1.14), Merrionette Park Ditch(0.14 c ), <strong>Cal</strong>-<strong>Sag</strong> 9 b , <strong>Cal</strong>-<strong>Sag</strong> 8 bBridgeview Stony Creek(2.14), 71st St. Ditch(1.93), Lucas Diversion Ditch(1.9 c ), Melvina Ditch(0.21 c ),79th St. Ditch b , I&M 5 bBurbank Stony Creek(4.12), Melvina Ditch(3.76 c ), Oak Lawn Creek(0.36 c )<strong>Cal</strong>umet Park <strong>Cal</strong>-<strong>Sag</strong> 10(0.81)ChicagoChicago RidgeCrestwoodEvergreen ParkForest ViewStony Creek East(4.12), Merrionette Park Ditch(3.07 c ), City <strong>of</strong> Chicago CombinedSewer(2.9), Stony Creek(0.91), Melvina Ditch bc , I&M 5 b , <strong>Cal</strong>-<strong>Sag</strong> 10 bStony Creek(2.2), Melvina Ditch(0.18 c ), Oak Lawn Creek(0.18 c ), <strong>Cal</strong>-<strong>Sag</strong> 7 b , Lucas DiversionDitch bc<strong>Cal</strong>-<strong>Sag</strong> Trib C(1.56), Crestwood Drainage Ditch(0.76), <strong>Cal</strong>-<strong>Sag</strong> 9(0.25), TinleyCreek(0.14), <strong>Cal</strong>-<strong>Sag</strong> 6 b , <strong>Cal</strong>-<strong>Sag</strong> 8 bStony Creek(3.09), Merrionette Park Ditch bc , Stony Creek East bI&M 5 b2-2
2. WATERSHED CHARACTERISTICSTABLE 2.1.3Municipality and Subwatersheds within the Municipality BoundaryMunicipalitySubwatersheds within Municipality Boundary (square miles)Hickory Hills Stony Creek(1.46), 79th St. Ditch(1.07), Lucas Diversion Ditch(0.96 c ), Lucas Ditch(0.5 c ),I&M Trib D(0.22), Crooked Creek bHodgkins I&M Canal(0.49)Hometown Stony Creek b , Oak Lawn Creek bcJustice 71st St. Ditch(1.08), 79th St. Ditch(0.91), Justice Ditch(0.3), I&M Canal(0.26), I&M 4(0.18),Stony Creek(0.12), Lucas Diversion Ditch(0.12 c )LemontLong Run Creek(1.69), Castle Bowl(1.5), I&M Trib A(0.9), I&M Trib B&C(0.6), Sanitary ShipCanal (0.58), <strong>Cal</strong>-<strong>Sag</strong> 1(0.3), I&M 2(0.27), I&M 1(0.22), I&M Canal b , <strong>Cal</strong>-<strong>Sag</strong> 2 b , I&M 3 b , TampierSlough bLyonsI&M 5 bMatteson Boca Rio Ditch(0.1), Arroyo Ditch bMc Cook I&M 5 b , I&M Canal bMerrionette Park Stony Creek East(0.39), Merrionette Park Ditch(0.38 c )Midlothian <strong>Cal</strong>-<strong>Sag</strong> Trib C(0.85)Oak Forest Boca Rio Ditch(1.0), <strong>Cal</strong>-<strong>Sag</strong> Trib C(0.45), Arroyo Ditch(0.17)Oak Lawn Stony Creek(7.47), Oak Lawn Creek(3.08 c ), Melvina Ditch(1.51 c ), Stony Creek East(1.05),Lucas Diversion Ditch bc , <strong>Cal</strong>-<strong>Sag</strong> 7 bOrland Hills Tinley Creek(0.86), Marley Creek bOrland Park Marley Creek(6.12), Tinley Creek(4.16), Mill Creek(3.4), Spring Creek(1.75), Long RunCreek(1.56), Will County Trib 2(0.38), Boca Rio Ditch(0.21), Tampier Slough(0.13), NavajoCreek bPalos Heights Navajo Creek(2.21), <strong>Cal</strong>-<strong>Sag</strong> 5(1.44), <strong>Cal</strong>-<strong>Sag</strong> 6(0.51), Tinley Creek(0.13), <strong>Cal</strong>-<strong>Sag</strong> 7 b ,<strong>Cal</strong>-<strong>Sag</strong> Trib B b , Ken Kay Ditch bPalos Hills Stony Creek(3.96), Lucas Ditch(2.0 c ), Lucas Diversion Ditch(0.38 c ), Crooked Creek(0.32),<strong>Cal</strong>-<strong>Sag</strong> 5 b , <strong>Cal</strong>-<strong>Sag</strong> 4 b , <strong>Cal</strong>-<strong>Sag</strong> 2 bPalos Park Mill Creek(1.52), <strong>Cal</strong>-<strong>Sag</strong> Trib B(0.97), Tampier Slough(0.46), <strong>Cal</strong>-<strong>Sag</strong> 4(0.32), <strong>Cal</strong>-<strong>Sag</strong>5(0.19), <strong>Cal</strong>-<strong>Sag</strong> 3 b , Navajo Creek bRiverdale <strong>Cal</strong>-<strong>Sag</strong> 10(0.15)Robbins<strong>Cal</strong>-<strong>Sag</strong> 9(0.25), <strong>Cal</strong>-<strong>Sag</strong> Trib C bSummitI&M 5(1.18), I&M Canal bTinley Park Tinley Creek(0.59), Will County Trib 2(0.17), Arroyo Ditch b , Boca Rio Ditch bUnincorporated/ Mill Creek(5.7), Long Run Creek(5.02), Tinley Creek(4.53), <strong>Cal</strong>-<strong>Sag</strong> 2(3.38), I&M 3(3.32),ForestPres <strong>Cal</strong>-<strong>Sag</strong> 3(3.21), Marley Creek(3.2), Crooked Creek(3.13), <strong>Cal</strong>-<strong>Sag</strong> Trib A(2.96), TampierSlough(2.9), I&M Trib B&C(1.94), Stony Creek East(1.23), Boca Rio Ditch(1.08), <strong>Cal</strong>-<strong>Sag</strong>1(0.94), Spring Creek(0.85), <strong>Cal</strong>-<strong>Sag</strong> 6(0.69), Stony Creek(0.66), I&M Canal(0.61), NavajoCreek(0.56), Merrionette Park Ditch(0.54 c ), I&M 2(0.51), I&M Trib D(0.49), CrestwoodDrainage Ditch(0.49), Sanitary Ship Canal(0.47), <strong>Cal</strong>-<strong>Sag</strong> Trib C(0.46), <strong>Cal</strong>-<strong>Sag</strong> 4(0.46),<strong>Cal</strong>-<strong>Sag</strong> 7(0.41), Will County Trib 2(0.39), I&M 1(0.32), Lucas Ditch(0.28c), <strong>Cal</strong>-<strong>Sag</strong>10(0.2), Castle Bowl(0.19), Melvina Ditch(0.13c), Justice Ditch(0.11), <strong>Cal</strong>-<strong>Sag</strong> Trib B(0.11),<strong>Cal</strong>-<strong>Sag</strong> 5 b , I&M 4 b , <strong>Cal</strong>-<strong>Sag</strong> 9 b , <strong>Cal</strong>-<strong>Sag</strong> 8 b , I&M Trib A b , 79th St. Ditch b , Ken Kay Ditchb,I&M 5 bWillow Springs I&M Canal(1.34), I&M 3(0.66), I&M 4(0.27), I&M Trib D(0.19), 79th St. Ditch bWorth Ken Kay Ditch(1.21), Stony Creek(0.82), <strong>Cal</strong>-<strong>Sag</strong> 7(0.2), <strong>Cal</strong>-<strong>Sag</strong> 5(0.12)a Subwatersheds are ordered in decreasing order <strong>of</strong> area within municipalityb Less than 0.1 square miles within municipality contributes to subwatershedC Subwatershed area also included in Stony Creek system2-3
CALUMET-SAG CHANNEL DETAILED WATERSHED PLAN2.2 Stormwater Problem DataTo support <strong>DWP</strong> development, the <strong>District</strong> solicited input from stakeholders within the watershed.Municipalities, townships, and countywide, statewide, and national agencies such asCook County Highway Department (CCHD), Illinois Department <strong>of</strong> Natural Resources(IDNR), Illinois Department <strong>of</strong> Transportation (IDOT), and the USACE, for example, wereasked to fill out two forms with information to support <strong>DWP</strong> development. Organizationssuch as ecosystem partnerships were also contacted by the <strong>District</strong> as part <strong>of</strong> this informationgatheringeffort. Form A included questions on stormwater data and regulations, Form Bquestions on known flooding, erosion, and stream maintenance problem areas. In addition toproblem areas reported by municipalities, townships, public agencies and other stakeholders,results <strong>of</strong> H&H modeling performed as a part <strong>of</strong> <strong>DWP</strong> development identified stormwaterproblem areas. The H&H modeling process is described in general in Section 1.3 and specificallyfor each modeled tributary in Section 3.Figure 2.2.1 and Table 2.2.1 summarize the responses to Form B questions about flooding,erosion, and stream maintenance problem areas. As noted, the scope <strong>of</strong> the <strong>DWP</strong> addressesregional problems along open channel waterways. The definition <strong>of</strong> regional problems wasprovided in Section 1.2.3 <strong>Water</strong>shed Analysis Data2.3.1 Monitoring Data2.3.1.1 USGS Gage DataThe U.S. Geological Survey (USGS) owns and maintains a nationwide network <strong>of</strong> streamgages used to record real-time measurements <strong>of</strong> the monitored stream’s water surface elevations.Rating curves developed through periodic paired stage and flow measurements areused to develop rating curves for the stream, relating estimated flow to measured stage.There are two USGS surface water data monitoring sites within the <strong>Cal</strong>umet-<strong>Sag</strong> Channel<strong>Water</strong>shed: “05536500” located on Tinley Creek near Palos Park, Illinois, and “05537500” locatedon Long Run near Lemont, Illinois. Table 2.3.1 summarizes the data available fromthese sites.The Tinley Creek gage is located in the downstream part <strong>of</strong> the watershed, near the crossing<strong>of</strong> 135th Street. The Long Run Creek gage is located at Long Run Creek’s crossing <strong>of</strong> StateStreet, just north <strong>of</strong> the Will County border.2-4
2. WATERSHED CHARACTERISTICSTABLE 2.2.1Summary <strong>of</strong> Responses to Form B QuestionnaireProblemIDMunicipalityProblem as Reported byLocal Agency Location Problem DescriptionLocal/RegionalReason forClassificationAL1 Alsip Bank erosion, sedimentation115th St. and Stony Creek culvert,just west <strong>of</strong> Cicero Ave.AL2 Alsip Pavement flooding Route 50 (Cicero Ave.) at 119thSt.AL3 Alsip Storm sewer flow restriction,bank erosion,sedimentationBR1BR2BR3BR4BremenTownshipBremenTownshipBremenTownshipBremenTownshipMaintenanceMaintenanceBasement flooding,ponding, water quality,storm sewer capacityMaintenance, pondingBU1 Burbank Overbank flooding,storm sewer capacity113th St. and Lamon Ave.Ridgeland Avenue from 135thSt. to 147th St.143rd St. from 82nd Ave. to HarlemAve.Linder Ave. between MidlothianPike and 143rd St.Ridgeland Ave. 1/8 mile north <strong>of</strong>147th St.87th St. and Natchez Ave.BU2 Burbank Pavement flooding Route 50 (Cicero Ave.) at KellerDr. (77th Street Viaduct)BV1 Bridgeview Overbank flooding,pavement flooding,storm sewer capacityRoute 43 (Harlem Ave.) at 86thSt.Severe erosion at northeast embankment,wing wall partially restricting opening <strong>of</strong> eastbarrel <strong>of</strong> culvertRegional 1IDOT reported pavement flooding Local 4, 5Siltation <strong>of</strong> East Stony Creek from 115th St.north to 11200 South interferes with drainage<strong>of</strong> a dry detention pond contributing to amosquito breeding problemDebris and siltation <strong>of</strong> box culvert due toalignment <strong>of</strong> Tinley Creek (CCHD)Overbank flooding due to lack <strong>of</strong> maintenancein Forest PreserveNatural basin collects stormwater, floodingyards and houses and causing septic systemfailureRegional 1Regional 1Local 3, 4Local 4Culvert box submerged (CCHD) Local 3, 4Overbank flooding and ponding has historicallyoccurred surrounding the MelvinaDitch Reservoir. <strong>District</strong> made improvementsto reservoir and coordination withBedford Park, with no problems at the reservoirreported since.Local 5IDOT reported pavement flooding Local 4, 5IDOT reported flooding problems(southbound)Local 4, 52-5
CALUMET-SAG CHANNEL DETAILED WATERSHED PLANTABLE 2.2.1Summary <strong>of</strong> Responses to Form B QuestionnaireProblemIDMunicipalityProblem as Reported byLocal Agency Location Problem DescriptionLocal/RegionalReason forClassificationBV2 Bridgeview Basement flooding,ponding, storm sewercapacityBV3BV4BV5Bridgeview,BurbankJustice,BridgeviewBridgeview,ChicagoRidgePavement floodingStorm sewer capacity100th Pl. between 76th Ave. andHarlem Ave.Route 43 (Harlem Ave.) at 79thSt.Roberts Rd. between 79th St.and 83rd St.Excessive ponding occurs at 100th Placebetween 76th Ave. and Harlem Ave. due todrainage problems.Local 5IDOT reported pavement flooding Local 4, 5Frequent roadway flooding due to undersizedstorm sewer Roberts Road stormsewer lacking sufficient capacityLocal 4, 5Pavement flooding Route 43 (Harlem Ave.) at I-294 IDOT reported pavement flooding Local 5CP1 <strong>Cal</strong>umet Park Pavement flooding I-57 at 127th St. (Burr Oak Ave.) IDOT reported pavement flooding Local 5CP2CR1CR2CR3<strong>Cal</strong>umetPark, ChicagoChicagoRidgeChicagoRidge, OakLawnChicagoRidgePavement flooding I-57 at 119th St. IDOT reported pavement flooding Local 4, 5Maintenance, pondingBank erosion, sedimentationOverbank floodingMelvina Ditch at West StonyCreekMelvina Ditch along ChicagoRidge Mall (between 95th St.and West Stony Creek)Confluence <strong>of</strong> Melvina Ditch withStony CreekCW1 Crestwood Pavement flooding Route 50 (Cicero Avenue) at135th St.CW2 Crestwood Maintenance Central Ave. from 127th St. to135th St.Maintenance problem at Melvina Ditch confluencewith Stony Creek. Previously reportedmaintenance request (Nov. 2006) atconfluence with Stony CreekSediment and erosion problems, lack <strong>of</strong>maintenance, High flows released from reservoircause erosion.The adverse confluence angle <strong>of</strong> MelvinaDitch with Stony Creek is perceived to contributeto higher flood stages along WestStony CreekRegional 1Regional 1Regional 1IDOT reported pavement flooding Local 5Embankments need repair and debris inembankment and waterwayRegional 12-6
2. WATERSHED CHARACTERISTICSTABLE 2.2.1Summary <strong>of</strong> Responses to Form B QuestionnaireProblemIDMunicipalityProblem as Reported byLocal Agency Location Problem DescriptionLocal/RegionalReason forClassificationCW3Alsip, Crestwood,WorthTownshipOverbank flooding,basement floodingBetween 129th St. and <strong>Cal</strong>umet-<strong>Sag</strong> Channel, west <strong>of</strong> CentralAve.Overbank flooding during heavy rain, attributedin part to double bend in Tinley Creekjust downstream <strong>of</strong> Central Ave.Regional 1FP1Forest Preserve<strong>District</strong>Overbank flooding,ponding, water quality,wetland and riparianarea degradationLaGrange and 167th St.High run<strong>of</strong>f and salt from roads has degradedhabitat and water qualityLocal 4HH1 Hickory Hills Overbank flooding,basement flooding,ponding, bank erosion,maintenance98th St. at 7700 WestDrainage ditches have insufficient capacityto convey storm flows, resulting in pondingand basement flooding. Possible maintenanceissues related to Lucas Ditch.Regional 1HH2Hickory Hills,JusticeOverbank flooding,basement flooding,ponding, storm sewercapacity, pavementflooding85th St. at 8900 WestDuring heavy rains there is insufficientstorm sewer capacity in Justice resulting inyard flooding.Local 4, 5HH3 Hickory Hills Basement flooding,ponding, storm sewercapacity85th St to 83rd St at 8600 WestInsufficient downstream capacity in Justicebacks up flowLocal 4, 5HH4 Hickory Hills Basement flooding,ponding, storm sewercapacityRoberts Road between 90th and95th St.Roberts Road storm sewer has insufficientcapacity to convey moderate floods. CookCounty will not allow additional connectionsto the Roberts Road storm sewerLocal 4, 5HH5 Hickory Hills Ponding, storm sewercapacity, maintenance91st Pl. at Kean Ave.The storm sewer to the forest preserve istypically full, and during rainfall events, thecatch basin ponds back up to a property inthe subwatershed. Maintenance issue relatedto a ditch in Forest Preserve. Thestorm sewer to the forest preserve is habituallyinundated, but during rainfall events,the catch basin starts ponding, backing upto one resident’s front door. Maintenanceissue related to ditch in Forest Preserve.Regional 12-7
CALUMET-SAG CHANNEL DETAILED WATERSHED PLANTABLE 2.2.1Summary <strong>of</strong> Responses to Form B QuestionnaireProblemIDMunicipalityProblem as Reported byLocal Agency Location Problem DescriptionLocal/RegionalReason forClassificationHH6 Hickory Hills Overbank flooding,basement flooding,ponding, bank erosion95th St. at 84th Ct. (FlamingoApartments)JU1 Justice Pavement flooding Route 171 (Archer) at I-294(Ramp to SB)JU2 Justice Ponding East <strong>of</strong> Cork Avenue between73rd Pl. and 75th St.JU3 Justice Overbank flooding,basement flooding,ponding, storm sewercapacity71st Street DitchJU4 Justice Storm sewer capacity Under Tri-State Tollway between86th and 87th Ave.LE1 Lemont Ponding Cass Street and Lemont St.,downtown LemontLT1LT3LT4LT5LemontTownshipLemontTownshipLemontTownshipLemontTownshipPavement floodingPavement floodingBank erosion, sedimentationPavement flooding,pondingRoute 171 (Archer Ave.) betweenCastlewood and Route 83Route 171 (Archer Ave.) at 131stSt.Stephen St. and north <strong>of</strong> TalcottSt.McCarthy Rd. between Bell Rd.and Will-Cook Rd., near EquestrianEstates neighborhoodRun<strong>of</strong>f from forest preserves exceeds outflowdrains and thus results in flooding twoapartment buildings to the first floor. Erosionon forest preserve property.Local 4IDOT reported pavement flooding Local 4, 5Depressional area has no natural outlet.Drains to 71st Street Ditch through undersizedstorm sewer.Insufficient capacity in 71st Street Ditch toconvey flows from upstream communitiesStorm sewer under Tri-State Tollway hasinsufficient capacity to convey flows fromHickory Hills and JusticeDuring major storm events, sewer system indowntown Lemont surcharges and overflows,flooding basements, and first floors <strong>of</strong>commercial buildings, industrial buildings,and residencesLocal 4, 5Regional 1Local 4, 5Local 5IDOT reported pavement flooding Local 2, 4IDOT reported pavement flooding Local 2, 4Tree branches and limbs are fallen in toI&M Canal and block flowageMcCarthy Road and nearby yards flood, includingproperty that contains large pond.Pond has insufficient storage volume and/oroutlet capacity to contain flows.Regional 1Local 2, 42-8
2. WATERSHED CHARACTERISTICSTABLE 2.2.1Summary <strong>of</strong> Responses to Form B QuestionnaireProblemIDMunicipalityProblem as Reported byLocal Agency Location Problem DescriptionLocal/RegionalReason forClassificationLYT1ME1Lyons TownshipMerrionettePark, ChicagoOverbank floodingPavement floodingOF3 Oak Forest Maintenance, overbankflooding, sedimentation,bankerosionOH1 Orland Hills Overbank flooding,ponding, water quality,bank erosion, wetlandand riparian areadegradationOH2 Orland Hills Overbank flooding,ponding, water quality,bank erosion, wetlandand riparian areadegradationTributary to I&M Canal CrossingLa Grange Rd.Kedzie between 119th St. to126th St.Property just north <strong>of</strong> 151st St.and Boca Rio Dr.Tinley Creek at 88th Ave.Lake Lorin and along 167thStreet between 91st Ave. andHaven Ave.OL1 Oak Lawn Maintenance Central Ave., 1/4 mile south <strong>of</strong>103rd St.OL2 Oak Lawn Bank erosion Stony Creek between 103rd St.and Central Ave.OL3OL4Oak Lawn,ChicagoOak Lawn,ChicagoOL5 Oak Lawn Overbank flooding,basement flooding,ponding, waterquality, storm sewercapacityPavement flooding due to high stages in thechannel, 8 known occurrencesRegional 1, 3IDOT reported pavement flooding Local 4, 5Private property owner in Bremen Townshipdenies access to allow Oak Forest to maintainchannel, resulting in significant sedimentationand upstream floodingCulvert and channel downstream <strong>of</strong> 88thAvenue have sediment and vegetationwhich reduces conveyanceLake Lorin vegetation, sedimentation, andoutlet condition reduces Tinley Creek conveyancein this areaRegional 1Regional 1Regional 1Siltation observed in south culvert barrel Regional 1Resident reports erosion, <strong>District</strong> field staffobserved several exposed outfallsRegional 1Pavement flooding Pulaski Road and 102nd St. IDOT reported pavement flooding Local 4, 5Pavement flooding Pulaski Rd. and 104th St. IDOT reported pavement flooding Local 4, 599th Street to 103rd St. betweenCicero Ave. and Central Ave.High water elevations on West Stony Creekmay limit drainage capacity <strong>of</strong> Oak LawnsewersLocal 52-9
CALUMET-SAG CHANNEL DETAILED WATERSHED PLANTABLE 2.2.1Summary <strong>of</strong> Responses to Form B QuestionnaireProblemIDMunicipalityProblem as Reported byLocal Agency Location Problem DescriptionLocal/RegionalReason forClassificationOL6 Oak Lawn Sedimentation, bankerosion, maintenanceOL7 Oak Lawn Severe bank erosion,sedimentation, maintenance,water qualityOL8 Oak Lawn Storm sewer capacity,bank erosion,sedimentation, waterqualityOL9 Oak Lawn Overbank flooding,storm sewer capacity,bank erosion, sedimentation,waterquality102nd St. and Merrimac Ave.(near Metra tracks)Oak Lawn Creek between MayfieldAve. and Central Ave. (near99th St. and Menard Ave.)Oak Lawn Lake along East andWest Shore Dr.Wolfe Wildlife Refuge (fromCicero Ave. and 111th St. toCentral Ave. and 105th St.)OP1 Orland Park Pavement flooding Southwest Highway and 135thSt.OP2 Orland Park Pavement flooding Route 43 (Harlem Ave.) between151st St. and 153rd St.OP3 Orland Park Overbank flooding,bank erosion, sedimentation,maintenance,wetland andriparian area degradationMarley Creek at Cameron Parkwayand Norfolk Southern R.R.Severe bank erosion, bank collapse, andsedimentation at confluence <strong>of</strong> Oak LawnCreek and Stony CreekSevere bank erosion such that residentialstructures are threatened along Oak LawnCreekSevere bank erosion such that shorelines,adjacent walks, and structures risk failing.Poorer water quality and loss <strong>of</strong> wildlifehabitat due to increased sedimentation frombank erosion.Bank erosion along Stony Creek West inwildlife preserve causes additional sedimentation,reducing storm sewer capacity andcontributing to overbank flooding in the areaRegional 1Regional 1Regional 1Regional 1Flooding several times per year Regional 1, 3IDOT reported pavement flooding Local 3, 4Flooding on Wolf Road due to restrictedconveyance in Marley Creek, seems to becaused primarily by debris and sedimentationcausing blockages in conveyanceRegional 1OP4 Orland Park Pavement flooding Southwest Highway at 151st St. IDOT reported pavement flooding Local 2, 4OP5 Orland Park Bank erosion, sedimentation151st Street and Orland BrookDr.Significant erosion and sedimentation resultsin flow restrictionRegional 12-10
2. WATERSHED CHARACTERISTICSTABLE 2.2.1Summary <strong>of</strong> Responses to Form B QuestionnaireProblemIDMunicipalityProblem as Reported byLocal Agency Location Problem DescriptionLocal/RegionalReason forClassificationOP6 Orland Park Maintenance, sedimentation,bank erosionMarley Creek at Anthony Dr. toMeade St.OP7 Orland Park Ponding Strawberry Lane (Parkview Estates)Flooding on 104th Avenue due to restrictedconveyance in Marley Creek, seems to becaused primarily by debris and sedimentationcausing blockages in conveyanceFlooding due to <strong>of</strong>fsite flows from outsidevillageOP8 Orland Park Overbank flooding Tinley Creek at 82nd Avenue Overbank flooding due to undersized culvertalong Tinley Creek and lack <strong>of</strong> maintenancedownstreamOP9 Orland Park Overbank flooding Long Run Creek Crossing 143rdStreet (West <strong>of</strong> Wolf Road)OP10 Orland Park Bank erosion, sedimentationOP11 Orland Park Bank erosion, sedimentationOP12 Orland Park Bank erosion, sedimentationDeluga Woods subdivision between155th and 159th St.143rd St. and Wolf Rd.108th Ave. at Marley CreekcrossingOP13 Orland Park Pavement flooding Route 7 (Southwest Hwy) atRoute 45 (La Grange Rd.)Pavement flooding due to high stages in thechannel, 18 known occurrencesLack <strong>of</strong> maintenance in unincorporated arearesults in overbank floodingErosion/sedimentation causes flow restrictionresulting in floodingSilt in three 10-foot by 8-foot box culvertwhere Marley Creek crosses 108th AvenueRegional 1Regional 1Regional 1Regional 1Regional 1Regional 1Regional 1IDOT reported pavement flooding Regional 1OP14 Orland Park Pavement flooding Route 7 at 145th St. to 148th St. IDOT reported pavement flooding Local 2, 4OP15 Orland Park Sedimentation, overbankfloodingOT1OT2Orland TownshipOrland TownshipOverbank flooding,pondingBank erosion, sedimentation167th St. and 88th Ave. (Fernwayarea)114th Court and 157th StreetWill-Cook Road at Long RunCreek crossingSedimentation and culvert restrictions resultin frequent overbank flooding <strong>of</strong> the Fernwayarea. Village has contracted engineeringfor culvert replacement and sedimentremovalHeavy rains cause overflow <strong>of</strong> Spring Creekinto adjacent subdivisionSilt in culvert, and severe erosion alongsoutheast embankmentRegional 1Regional 1Regional 12-11
CALUMET-SAG CHANNEL DETAILED WATERSHED PLANTABLE 2.2.1Summary <strong>of</strong> Responses to Form B QuestionnaireProblemIDMunicipalityProblem as Reported byLocal Agency Location Problem DescriptionLocal/RegionalReason forClassificationPH1PH2PH3PH4PH5PH6PH7PH8PH9PH10PH11PalosHeightsPalosHeightsPalosHeightsPalosHeightsPalosHeightsPalosHeightsPalosHeightsPalosHeightsPalosHeightsPalosHeightsBremenTownship,PalosHeightsOverbank flooding135th St. from Harlem Avenue toRidgeland AvenuePavement flooding due to high stages in thechannel, 28 known occurrencesLocal 2, 4Ponding 12605 Melvina Avenue Ponding in ROW about 2 to 5 times a year Local 4PondingPondingPondingPondingPondingBasement flooding,pondingPalos Meadows Subdivisionnear 131st Street and 71st Avenue(includes 13013 Oak ParkAvenue)12500 McCarthy Rd. and onCarmichael Dr. west <strong>of</strong> 76th Ave.21 Country Squire Court near76th Avenue and College Drive12601 Harold Ave., 12542 74thAve., and 12542 75th Ave.124th Avenue and 69th Court;and 12217 68th CourtFlooding throughout neighborhood 2 to 5times a yearStorm sewer restriction at McCarthy Rd.and ponding at nearby school detentionpondPonding in ROW and front yard, 2 to 5times a yearRegional 1Local 4Local 4Ponding in ROW 2 to 5 times a year Local 4, 5Ponding in ROW 2 to 5 times a year Local 4, 512002 Harold Avenue Basement and backyard flooding due tonarrow conveyance <strong>of</strong> overflow from 76thAvenuePonding 12102,12232, 12303, and 1231271st AvenuePondingPavement flooding12333 69th Avenue near NavajoCreek and Oak Park Avenue andCollege DriveRoute 43 (Harlem Avenue) at135th StreetLocal 4Ponding in ROW 2 to 5 times a year Local 5Flooding in street right-<strong>of</strong>-way (ROW) infront <strong>of</strong> residence, about 2 to 5 times a yearLocal 4, 5IDOT reported pavement flooding Local 4, 52-12
2. WATERSHED CHARACTERISTICSTABLE 2.2.1Summary <strong>of</strong> Responses to Form B QuestionnaireProblemIDMunicipalityProblem as Reported byLocal Agency Location Problem DescriptionLocal/RegionalReason forClassificationPH12PH13PH14PH15PH16PH17PH18PH19PH20PH21PH22PH23PalosHeightsPalosHeightsPalosHeightsPalosHeightsPalosHeightsPalosHeightsPalosHeightsPalosHeightsPalosHeightsPalosHeightsPalosHeightsPalosHeightsPonding 12911 71st Court Sewer backup caused by high NavajoCreek elevation 2 to 5 times a yearLocal 5Ponding 13032 71st Avenue Flooding in backyard 2 to 5 times a year Regional 1Ponding 6843 Evergreen Avenue Ponding in right-<strong>of</strong>-way (ROW) 2 to 5 timesa yearPondingApproximately 150 ft west <strong>of</strong>76th Avenue on north side <strong>of</strong>McIntosh DriveLocal 4, 5Flooding 2 to 5 times a year Local 4Flooding 11938 68th Court Flooding in ROW 2 to 5 times a year Local 4Overbank flooding,basement floodingNashville Avenue and 125thStreetFlooding in ROW 2 to 5 times a year Regional 1Flooding 127th Street and 70th Avenue Navajo Creek elevation affects this area Regional 1Basement flooding,ponding, storm sewercapacityPonding, pavementfloodingApproximately 150 ft north <strong>of</strong>131st Street on west side <strong>of</strong> CypressLane12001 73rd Ct., 12151 73rd Ave.,and 12412 73rd Ave.Flooding 2 to 5 times a year Local 5Flooding in ROW 2 to 5 times a year Local 5Storm sewer capacity 7350 Choctaw Rd. Flooding in backyard 2 to 5 times a year Local 5Ponding 12224 Cheyenne Dr. Ponding in ROW 2 to 5 times a year Local 5PondingPHI1 Palos Hills Overbank flooding,basement flooding,ponding12250 76th Ave. and 12223 RichardAve.100th Place and 78th AvenuePonding in ROW 2 to 5 times a year Local 5Lucas Diversion Ditch has insufficient capacity,overflowing into existing undersizeddetention area and nearby homes.Regional 12-13
CALUMET-SAG CHANNEL DETAILED WATERSHED PLANTABLE 2.2.1Summary <strong>of</strong> Responses to Form B QuestionnaireProblemIDMunicipalityProblem as Reported byLocal Agency Location Problem DescriptionLocal/RegionalReason forClassificationPHI2 Palos Hills Ponding, storm sewercapacityPHI3 Palos Hills Overbank flooding,basement flooding,bank erosionPHI4Palos Hills,BridgeviewBasement flooding,ponding, storm sewercapacity, bank erosion,maintenancePHI5 Palos Hills Overbank flooding,pondingPHI6 Palos Hills Bank erosion, sedimentationPHI7 Palos Hills Overbank flooding,pondingPHI8 Palos Hills Overbank Flooding,storm sewer capacity,bank erosion, wetlandand riparian areadegradationPHI9Palos Hills,BridgeviewBasement flooding,ponding, storm sewercapacity, bank erosion,maintenance82nd Avenue and Eleanor Avenue111th Street and 86th Avenue(11118 Spathis Drive)Lucas Diversion Ditch from102nd Street to 105th StreetKean Avenue and Los PalosLane101st Street and Roberts Road88th Avenue and 99th StreetSedimentation in Lucas Ditch upstream <strong>of</strong>103rd Street restricts Lucas Ditch capacity.Lucas Ditch floods adjacent buildings whenStony Creek is high, sometimes resulting inerosion as well. Former study recommendedbuilding a levee wall to isolate thefloodplain.Debris and sediment build up restricts flowin Lucas Diversion Ditch causing basementflooding north <strong>of</strong> 103rd Street in Bridgeview/Palos HillsFlows in Hickory Hills have no retention,and the Los Palos Hills reservoir has insufficientcapacity to capture larger storms.Overflows flood the intersection. In 100-yearfloodplain. Palos Hills wants larger outlet t<strong>of</strong>orest preserve.Debris at upstream end <strong>of</strong> culvert, far upstreamportion <strong>of</strong> Lucas Ditch, where itcrosses Roberts RoadLocalized flooding in sewered headwaters<strong>of</strong> Lucas Ditch. Previous studies have identifiedneed for additional storage and increasedconveyance.96th Street and Arrowhead Drive Flooding and erosion problems due to highflows. The buildings threatened by erosionare actually in Hickory Hills. Plan developedto address erosion, increase conveyance,and add retention in Forest PreserveLucas Diversion Ditch from103rd Street to 105th StreetSediment and debris buildup in Lucas DiversionDitchRegional 1Regional 1Regional 1Regional 1Local 4, 5Local 4, 5Local 4, 5Regional 12-14
2. WATERSHED CHARACTERISTICSTABLE 2.2.1Summary <strong>of</strong> Responses to Form B QuestionnaireProblemIDMunicipalityProblem as Reported byLocal Agency Location Problem DescriptionLocal/RegionalReason forClassificationPP1 Palos Park Overbank flooding,ponding, storm sewercapacity, bank erosion,wetland and riparianareadegradationMcCarthy Road, between OakRidge and 79th AvenueFloodwaters exceed capacity, damaginghomes, 2+ times per yearLocal 4PP2 Palos Park Overbank flooding,basement flooding,ponding, storm sewercapacity, bank erosion80th Ave. between 126th St. and127th St.Floodwaters exceed capacity resulting indamage to homes. Occurs 2+ times peryearLocal 4PP3 Palos Park Overbank flooding,basement flooding,storm sewer capacity,bank erosion119th Street and Timber LaneFloodwaters exceed capacity <strong>of</strong> box culvertunder 119th StreetRegional 1, 2PP4 Palos Park Overbank flooding,basement flooding,storm sewer capacity,bank erosionSW Hwy between S. WoodlandTrail and 121st StreetDiversion from Mill Creek is conveyed alongRR ROW. This flow leaves RR ROW andspills into SW Hwy at this location. Closes SWHwy, and flooding several homes along RRROWRegional 1, 3PP5 Palos Park Overbank flooding,basement flooding,water quality, stormsewer capacity, bankerosion, wetland andriparian area degradation,maintenance123rd Street between HobartAvenue and Elm StreetFloodwater exceeds conveyance capacity,also erosion affecting northern GroundhogSloughRegional 1, 2PP6 Palos Park Overbank flooding,basement flooding,ponding, storm sewercapacity, bank erosionSouthwest Highway between131st Street and 135th StreetFlooding due to insufficient capacity reducesor prevents access to businesses inthis areaRegional 1, 22-15
CALUMET-SAG CHANNEL DETAILED WATERSHED PLANTABLE 2.2.1Summary <strong>of</strong> Responses to Form B QuestionnaireProblemIDMunicipalityProblem as Reported byLocal Agency Location Problem DescriptionLocal/RegionalReason forClassificationPP7 Palos Park Overbank flooding,storm sewer capacity,bank erosionPP8 Palos Park Overbank flooding,basement flooding,storm sewer capacity,bank erosion127th Street and 86th AvenueKinvarra Drive and Wild CherryLane (9845 Wild Cherry Lane)Mill Creek diverts to RR ROW ditch at thislocation. Insufficient capacity to convey waterunder 86th Avenue results in flooding <strong>of</strong>SW HwyExcessive floodwaters result in flooding <strong>of</strong> anumber <strong>of</strong> houses at least 3 times in the last10 years. Stream maintenance is requireddownstream to address sedimentation anddebris.Regional 1, 2Regional 1, 2PP9 Palos Park Pavement flooding Route 7 at 123rd Street IDOT reported pavement flooding Local 2, 4PP10 Palos Park Overbank flooding,basement flooding,storm sewer capacity,bank erosionPT1PT2PT3PT4PT5PT6PT7Palos TownshipPalos TownshipPalos TownshipPalos TownshipPalos TownshipPalos TownshipPalos TownshipPondingPondingPondingPondingPavement floodingOverbank flooding,water quality, wetlandand riparian areadegradationPonding116th Avenue and 123rd Street127th Street and DeerwoodDriveHalfway between 104th Ave. andIndian Trail Dr. on Lakeland Dr.West end <strong>of</strong> Bernice Drive near104th Avenue and 131 st StreetIntersection <strong>of</strong> Stephen Driveand Walter DriveKean Ave. at 100th Street to111th StreetU.S. Route 45 at Crooked CreekIntersection <strong>of</strong> Bernice Drive andAdsit RoadFloodwaters exceed capacity, 1 time peryearLocal 4Ponding Local 4Ponding Local 4Ponding Local 4Ponding Local 4IDOT reported pavement flooding Regional 1, 2Flooding overtops the banks and decreaseswater qualityRegional 1, 3Ponding Local 42-16
2. WATERSHED CHARACTERISTICSTABLE 2.2.1Summary <strong>of</strong> Responses to Form B QuestionnaireProblemIDMunicipalityProblem as Reported byLocal Agency Location Problem DescriptionLocal/RegionalReason forClassificationPT8SU1Palos TownshipChicago, Village<strong>of</strong>SummitMaintenancePavement floodingNorth and East <strong>of</strong> intersection <strong>of</strong>111th Street (Route 83) and104th AvenueRoute 43 (Harlem Avenue) at63rd Street to 65th StreetCCHD reported flooding due to debrisblockages within a poorly maintained ditchon Forest Preserve propertyLocal 4IDOT reported pavement flooding Local 3, 4SU4 Summit Pavement flooding Route 171 at 63rd Street IDOT reported pavement flooding Local 4, 5WO1 Worth Pavement flooding Ridgeland Avenue at 111thStreetWO2 Worth Bank erosion Stony Creek between Oak Lawnand 76th AvenueWO3 Worth Ponding, bank erosion Ken Kay Ditch at 116th Streetand Harlem AvenueWO4 Worth Ponding, pavementfloodingWS1WS2WS3WillowSpringsWillowSpringsWillowSpringsPavement floodingIDOT reported pavement flooding Local 4Stream bank is in need <strong>of</strong> stabilization anddebris removal to restore the natural conveyance<strong>of</strong> Stony CreekCreek is in need <strong>of</strong> sediment removal.Ponding occurs in the village and withinIDOT ROW adjacent to the creek.Regional 1Local 475th Avenue at 109th Street Pavement flooding and property flooding Local 4, 5Archer Avenue at LaGrangeRoadIDOT reported pavement flooding Local 4Overbank flooding I&M Canal Crossing Rte 171 Pavement flooding due to high stages in thechannel, three known occurrencesOverbank flooding,pondingWillow Drive and Archer RoadReasons for Regional / Local Classifications:1. Located on a regional waterway with greater than 0.5 square mile drainage area2. Roadway culvert (two-lane road)3. Roadway culvert (greater than two-lane road)4. Located in headwater area (less than 0.5 square mile drainage area)5. Located within storm sewer system (regardless <strong>of</strong> drainage area)Channel draining Renaissance Developmentalong Metra tracks near I&M Canaldoes not drain sufficientlyLocal 5Local 4, 52-17
CALUMET-SAG CHANNEL DETAILED WATERSHED PLANTABLE 2.3.1USGS Gage Data in the <strong>Cal</strong>umet-<strong>Sag</strong> Channel <strong>Water</strong>shedDescription USGS 5536500 USGS 05537500Location Tinley Creek near Palos Park Long Run near LemontLatitude 41°38'48" 41°38'33"Longitude 87°45'59" NAD27 87°59'57" NAD27Cook County, Hydrologic Unit07120004: Des Plaines <strong>Water</strong>shedCook County, Hydrologic Unit07120004: Des Plaines <strong>Water</strong>shedContributing drainage area: 11.20 square miles 20.9 square milesDatum <strong>of</strong> gauge: 607.40 ft above sea level NGVD29 637.20 ft above sea level NGVD29Data Type Begin Date End Date Begin Date End DateReal-time This is a real-time site. This is a real-time site.Peak stream flow 09/26/1951 04/25/2007 09/27/1951 08/24/2007Daily DataDischarge, cubic ft per second(ft 3 /sec)07/11/1951 09/30/2008 07/01/1951 03/30/2009Gage height, ft 10/1/1993 03/30/2009 10/01/1991 03/30/2009Daily StatisticsDischarge, ft 3 /sec 07/11/1951 09/30/2008 07/01/1951 09/30/2007Gage height, ft 10/01/1993 09/30/2008 10/01/1991 09/30/2007Monthly StatisticsDischarge, ft 3 /sec 1951–07 2008–09 1951–07 2007–09Gage height, ft 1993–10 2008–09 1991–10 2007–09Annual StatisticsDischarge, ft 3 /sec 1951 2008 1951 2007Gage height, ft 1994 2008 1992 2007Field/lab water quality samples 10/09/1974 07/13/2000 10/09/1974 08/30/19832.3.1.2 Rainfall DataThe Illinois State <strong>Water</strong> Survey (ISWS) owns and maintains 25 rain gages in or near CookCounty. Nine ISWS rain gages—11, 12, 13, 15, 16, 17, 18, 20, and 21—cover the <strong>Cal</strong>umet-<strong>Sag</strong>Channel <strong>Water</strong>shed. Rainfall is recorded continuously at 10-minute intervals, processed bythe ISWS to ensure quality, and available for purchase. ISWS rainfall data was obtained forspecific gages and dates to support calibration <strong>of</strong> the Tinley Creek model and model verificationfor streams for which high water mark information was available. The <strong>District</strong> ownsand maintains two rain gages in the <strong>Cal</strong>umet-<strong>Sag</strong> Channel <strong>Water</strong>shed that record rainfall at10-minute intervals. One gage is located in Lemont, and the other is located at the MelvinaDitch Reservoir. <strong>District</strong> rainfall data was used for qualitative comparison against ISWSgage data. Figure 2.3.1 shows locations where rainfall gage data was available to support the<strong>Cal</strong>umet-<strong>Sag</strong> Channel <strong>Water</strong>shed <strong>DWP</strong>. The Tinley Creek subbasins are shown on Figure2-18
2. WATERSHED CHARACTERISTICS2.3.1 color-coded to indicate which subbasins were associated with which rainfall gages duringthe calibration process, which is discussed in detail in Section 3.29.2.2.3.1.3 Stage DataThe wet well elevation <strong>of</strong> Melvina Ditch Reservoir is recorded continuously on paper charts.These charts were obtained for the storms on September 11, 2000, August 23, 2007, and September13-14, 2008, to support model calibration efforts for the Melvina Ditch model. Figure2.3.1 shows locations where monitoring data was available to support the <strong>Cal</strong>umet-<strong>Sag</strong>Channel <strong>Water</strong>shed <strong>DWP</strong>. It shows the subbasins in the Tinley Creek watershed colorcodedto identify the ISWS rain gage used in the hydrologic model used for calibration. Thiessenpolygons, which divide the watershed into areas closest to each ISWS rain gage, arealso shown.2.3.2 Subwatershed DelineationThe <strong>Cal</strong>umet-<strong>Sag</strong> Channel <strong>Water</strong>shed was divided into subwatersheds representing areastributary to the waterways in the study area. Elevation data provided by Cook County, describedfurther in Section 2.3.4, was the principal data source used for subwatershed delineation.Drainage divides were established based upon consideration <strong>of</strong> the direction <strong>of</strong> steepestdescent from local elevation maxima. Occasionally, Cook County elevation data contains constructedstructures that do not represent surface hydrology, for instance, raised roadways thatdo not restrict overland flow. The delineation in these areas was modified to best represent surfacehydrology. The storm-sewer network was also considered in the delineation <strong>of</strong> some areas,particularly in the low gradient areas north <strong>of</strong> the <strong>Cal</strong>umet-<strong>Sag</strong> Channel where groundslope was slight or inconclusive. Finally, reference <strong>of</strong> previous studies and consultation withcommunity representatives helped resolve subwatershed boundaries in areas <strong>of</strong> question.Following the definition <strong>of</strong> subwatersheds, tributaries studied in detail were divided intosmaller subbasins, represented in the hydrologic model as having a unified response to rainfall.The size <strong>of</strong> subbasins varied based upon the drainage network density and proximity tothe hydraulically modeled waterway. Subbasin boundaries were modified to generally encompassareas with similar development patterns. Boundaries were defined to most accuratelyrepresent the actual area tributary to specific modeled elements, such as constrictionscaused by crossings, and reservoirs.Figure 2.3.2 shows the subwatersheds and subbasins developed for the <strong>DWP</strong>. Subbasinswere not defined for areas that were not modeled in detail.2.3.3 Drainage NetworkThe principal waterways <strong>of</strong> the <strong>Cal</strong>umet-<strong>Sag</strong> Channel <strong>Water</strong>shed were defined duringPhase A <strong>of</strong> the watershed study. Initial identification <strong>of</strong> the stream centerline was made usingplanimetry data obtained from Cook County. Stream centerlines were reviewed againstaerial photography and Cook County contour data at a 1:500 scale, and modified to bestrepresent existing conditions. These streamlines were included in the topographic model <strong>of</strong>the <strong>Cal</strong>umet-<strong>Sag</strong> Channel <strong>Water</strong>shed (see Section 2.3.4), and collect run<strong>of</strong>f from uplanddrainage areas. Secondary drainageways that were not modeled were identified based uponreview <strong>of</strong> contour data. In flat, heavily sewered areas, consultation <strong>of</strong> sewer atlases and dis-2-19
CALUMET-SAG CHANNEL DETAILED WATERSHED PLANcussion with community representatives helped to identify significant drainage paths. Secondarydrainageways were used to help define flow paths in the hydrologic models for individualtributaries. Figure 2.3.3 shows the major drainageways within the <strong>Cal</strong>umet-<strong>Sag</strong>Channel <strong>Water</strong>shed superimposed upon an elevation map <strong>of</strong> the watershed.2.3.4 Topography and BenchmarksThe topography <strong>of</strong> the <strong>Cal</strong>umet-<strong>Sag</strong> Channel <strong>Water</strong>shed boundary is defined by the geologichistory <strong>of</strong> the area. The southernmost extent <strong>of</strong> glacial Lake Chicago extended roughly to thelocation <strong>of</strong> the <strong>Cal</strong>umet-<strong>Sag</strong> Channel. The Stony Creek drainage system, which comprisesboth natural and constructed waterways, exists upon the very topography <strong>of</strong> the former lakeplain. Moraine formations to the west <strong>of</strong> the Stony Creek system, and in the south portion <strong>of</strong>the watershed, demarcate the southernmost boundary <strong>of</strong> the most recent glacial extent. Areassouth <strong>of</strong> the <strong>Cal</strong>umet-<strong>Sag</strong> Channel are characterized by greater topographic relief.Topographic data for the <strong>Cal</strong>umet-<strong>Sag</strong> Channel watershed was developed from Cook Countylight detection and ranging (LiDAR) data generated from a 2003 LiDAR mission (CookCounty, 2003). The LiDAR data was obtained along with break lines from Cook County. Adigital elevation model (DEM) was developed for the <strong>Cal</strong>umet-<strong>Sag</strong> Channel <strong>Water</strong>shedmodel based upon a subset <strong>of</strong> filtered elevation points. Figure 2.3.3 shows elevations withinthe watershed.Stream channel cross section and stream crossing structure (such as bridge and culvert) topographicdata was collected during field survey work conducted primarily between August2007 and February 2008 to support the <strong>DWP</strong>. (Some additional field survey work wasperformed between March 2008 and June 2008, and in January 2009.)The reference benchmarks created during the Cook County aerial mapping project completedin 2003 were used to establish first-order control for field survey work. One hundred thirtyfivecontrol points were established during the mapping project. Of those, 25 are NationalGeodetic Survey (NGS)/High Accuracy Reference Network (HARN) control stations withinCook County and environs. The remaining points were either existing or new points identifiedas photo control specifically for the mapping project. Twelve NGS monuments within theregion surrounding the <strong>Cal</strong>umet-<strong>Sag</strong> Channel <strong>Water</strong>shed were observed, referenced toHARN, and used to establish first-order control, meeting the horizontal and vertical accuracystandards specified in FEMA’s Guidelines and Specifications for Flood Hazard Mapping, “Guidancefor Aerial Mapping” (FEMA 2003). The horizontal ground control was established byGPS technology, and horizontal positioning accuracy meets the specifications <strong>of</strong> the FederalGeodetic Control Subcommittee (FGCS) Second Order Class One.2.3.5 Soil ClassificationsNRCS soil data representative <strong>of</strong> 2002 conditions was obtained for Cook County except forunmapped areas (which include the City <strong>of</strong> Chicago and some portions <strong>of</strong> nearby communities).Morley silt loam is the predominating soil type in the study area, which has a clayey andsilty subsoil. Along Stony Creek, the Muskego and Houghton mucks were also identified,which are poorly drained, organic soils. Other types <strong>of</strong> silt loams and urban altered soils arealso found in the watershed.2-20
2. WATERSHED CHARACTERISTICSThe NRCS soil data includes hydrologic soil group, representing the minimum infiltrationrate <strong>of</strong> the soil after wetting. Table 2.3.2 summarizes the hydrologic soil groups.TABLE 2.3.2Hydrologic Soil GroupsHydrologicSoil Group Description TextureInfiltrationRates (in./hr)ALow run<strong>of</strong>f potential and high infiltrationrates even when wettedSand, loamy sand, or sandy loam > 0.30B Moderate infiltration rates when wetted Silt loam or loam 0.15–0.30C Low infiltration rates when wetted Sandy clay loam 0.05–0.15DHigh run<strong>of</strong>f potential and very low infiltrationwhen wettedClay loam, silty clay loam, sandyclay, silty clay, or clay0–0.05All data from Technical Release 55, Urban Hydrology for Small <strong>Water</strong>sheds, NRCS, June 1986Soil groups with drainage characteristics affected by ahigh water table are indicated with a “/D” designation,where the letter preceding the slash indicates thehydrologic group <strong>of</strong> the soil under drained conditions.Thus, an “A/D” indicates that the soil has characteristics<strong>of</strong> the A soil group if drained but the D group ifnot. Because <strong>of</strong> the difficulty <strong>of</strong> establishing the extent<strong>of</strong> drainage <strong>of</strong> these soils for each mapped soil polygon,it was assumed that 50 percent (by area) <strong>of</strong> the soiltypes are drained. Table 2.3.3 summarizes the distribution<strong>of</strong> hydrologic soil type throughout the <strong>Cal</strong>umet-<strong>Sag</strong> Channel <strong>Water</strong>shed. Figure 2.3.4 shows the distribution<strong>of</strong> soil types throughout the watershed.TABLE 2.3.3Hydrologic Soil Group DistributionHydrologicSoil Group% <strong>of</strong> <strong>Cal</strong>umet-<strong>Sag</strong>Channel <strong>Water</strong>shedUnmapped 51.4A 0.3A/D 1.6B 4.6B/D 9.2C 31.5C/D 0.22.3.6 Land UseD 1.2Land use has a significant effect on basin hydrology, affecting the volume <strong>of</strong> run<strong>of</strong>f producedby a given area and the speed <strong>of</strong> run<strong>of</strong>f delivered to the receiving system. Imperviousareas restrict infiltration and produce more run<strong>of</strong>f, which is <strong>of</strong>ten delivered to receiving systemsmore rapidly through storm sewer networks. Land use was one <strong>of</strong> two principal inputsinto the calculation <strong>of</strong> CN for the <strong>Cal</strong>umet-<strong>Sag</strong> Channel <strong>Water</strong>shed, detailed moreextensively in Section 1.3.2.A 2001 land use inventory for the Chicago metropolitan area was received from CMAP inGIS format. The data was used to characterize existing conditions land use within the<strong>Cal</strong>umet-<strong>Sag</strong> Channel <strong>Water</strong>shed. The data include 49 land use classifications, grouped intoseven general categories for summarizing land use within the <strong>DWP</strong>. Table 2.3.4 summarizesthe land use distribution within the <strong>Cal</strong>umet-<strong>Sag</strong> Channel <strong>Water</strong>shed. Figure 2.3.5 showsthe distribution <strong>of</strong> general land use categories throughout the watershed.2-21
CALUMET-SAG CHANNEL DETAILED WATERSHED PLAN2.3.7 Anticipated Development and Future ConditionsAnticipated development within the <strong>Cal</strong>umet-<strong>Sag</strong>Channel <strong>Water</strong>shed was analyzedusing population projection data. Projectedfuture conditions land use data for the <strong>Cal</strong>umet-<strong>Sag</strong>Channel <strong>Water</strong>shed are unavailablefrom CMAP or other regional agencies. Projected2030 population data for Cook Countywas obtained from CMAP. Population datawas overlaid upon subwatershed boundariesto identify the potential for increases in subwatershedpopulations. Table 2.3.5 showssubwatersheds with a projected populationincrease from the year 2000 population. Projectedincreases in population along with currentsubwatershed land use conditions makeTABLE 2.3.4Land Use Distribution within the <strong>Cal</strong>umet-<strong>Sag</strong> Channel<strong>Water</strong>shedLand Use Type Area (mi 2 ) Area (%)Residential 63 40Forest/Open Land 52 33Commercial/Industrial 16 10<strong>Water</strong>/Wetland 7 5Agricultural 7 5Transportation/Utility 5 3Institutional 5 3it likely that there will also be a corresponding increase in impervious surface area. This potentialchange in impervious surface area could contribute to higher flow rates and volumes<strong>of</strong> stormwater run<strong>of</strong>f drained by those tributaries.TABLE 2.3.5Projected Population Increase by SubwatershedName 2000 Population 2030 Population % ChangePopulationChange71st St. Ditch 10,120 10,385 3 26579th St. Ditch 13,654 14,036 3 383<strong>Cal</strong>-<strong>Sag</strong> 1 167 707 324 540<strong>Cal</strong>-<strong>Sag</strong> 10 19,209 19,586 2 377<strong>Cal</strong>-<strong>Sag</strong> 2 69 73 6 4<strong>Cal</strong>-<strong>Sag</strong> 3 129 248 92 119<strong>Cal</strong>-<strong>Sag</strong> 4 1,406 1,433 2 27<strong>Cal</strong>-<strong>Sag</strong> 5 4,364 5,159 18 795<strong>Cal</strong>-<strong>Sag</strong> 6 4,496 4,784 6 288<strong>Cal</strong>-<strong>Sag</strong> 7 2,366 2,731 15 365<strong>Cal</strong>-<strong>Sag</strong> 8 1,032 1,201 16 168<strong>Cal</strong>-<strong>Sag</strong> 9 1,643 1,740 6 97<strong>Cal</strong>-<strong>Sag</strong> Trib A 1,166 3,937 238 2,771<strong>Cal</strong>-<strong>Sag</strong> Trib B 1,913 2,008 5 95<strong>Cal</strong>-<strong>Sag</strong> Trib C 10,656 11,704 10 1,048Castle Bowl 5,188 7,194 39 2,006City <strong>of</strong> Chicago 22,185 23,931 8 1,7462-22
2. WATERSHED CHARACTERISTICSTABLE 2.3.5Projected Population Increase by SubwatershedName 2000 Population 2030 Population % ChangePopulationChangeCrestwood DrainageDitch 4,446 5,088 14 642Crooked Creek 1,436 1,504 5 67I&M 1 634 1,381 118 747I&M 2 15 533 3,423 518I&M 3 1,312 1,894 44 582I&M 4 739 1,068 44 329I&M Canal 2,136 2,646 24 510I&M Trib A 3,072 3,363 9 291I&M Trib B&C 2,094 4,373 109 2,279Justice Ditch 2,018 2,156 7 139Ken Kay Ditch 5,333 5,562 4 229Long Run Creek 14,041 19,675 40 5,634Lucas Ditch 10,353 10,591 2 238Marley Creek 15,296 22,457 47 7,161Merrionette ParkDitch 28,435 28,818 1 383Mill Creek 17,103 19,518 14 2,415Mosquito Creek 2,399 2,638 10 240Navajo Creek 7,574 8,529 13 955Oak Lawn Creek 21,446 22,633 6 1,187Sanitary Ship Canal 545 2,173 299 1,627Spring Creek 2,235 5,669 154 3,434Stony Creek 152,749 153,960 1 1,211Stony Creek East 61,251 63,945 4 2,693Tampier Slough 1,350 1,697 26 347Tinley Creek 32,882 34,780 6 1,898Will County Trib 2 960 2,545 165 1,5852-23
CALUMET-SAG CHANNEL DETAILED WATERSHED PLANManagement <strong>of</strong> future development may be regulated through both local ordinances andthe WMO as described below in Section 2.3.9. This regulation would be an effort to preventan increase in peak flows, via the construction <strong>of</strong> site-specific stormwater controls. The impact<strong>of</strong> the modified hydrologic and hydraulic characteristics <strong>of</strong> the subwatersheds due tochanging land use over time may require the recommended projects to be re-evaluated underthe conditions at the time <strong>of</strong> implementation to refine the details <strong>of</strong> the final design. Toaccomplish this, it is recommended that at the time projects are implemented, if updatedland use and topographic information is available, the H&H models be rerun incorporatingthis new data.2.3.8 Wetland and Riparian AreasWetland areas within the <strong>Cal</strong>umet-<strong>Sag</strong> Channel <strong>Water</strong>shed were identified using National WetlandsInventory (NWI) mapping. NWI data includes approximately 9.9 square miles <strong>of</strong> wetlandareas in the <strong>Cal</strong>umet-<strong>Sag</strong> Channel <strong>Water</strong>shed. Riparian areas are defined as vegetatedareas between aquatic and upland ecosystems adjacent to a waterway or body <strong>of</strong> water thatprovide flood management, habitat, and water quality enhancement. Identified riparian areasdefined as part <strong>of</strong> the <strong>DWP</strong> <strong>of</strong>fer potential opportunities for restoration. Figures 2.3.6 and2.3.7 contain mapping <strong>of</strong> wetland and riparian areas in the <strong>Cal</strong>umet-<strong>Sag</strong> Channel <strong>Water</strong>shed.2.3.9 Management <strong>of</strong> Future Conditions through the Regulations <strong>of</strong>Site Stormwater ManagementThe <strong>District</strong> regulates the discharge <strong>of</strong> stormwater run<strong>of</strong>f from development projects locatedwithin separate sewer areas within the <strong>District</strong>’s corporate boundaries through its SewerPermit Ordinance. Currently, development projects meeting certain thresholds must providestormwater detention in an effort to restrict the post-development flow rate to the predevelopmentflow rate. A number <strong>of</strong> communities enforce standards beyond the <strong>District</strong>’scurrently required standards and thresholds. This <strong>DWP</strong> supports the continued regulation<strong>of</strong> future development through countywide stormwater management.The Cook County <strong>Water</strong>shed Management Ordinance (WMO) is under development and isproposed to provide uniform minimum countywide standards for site stormwater run<strong>of</strong>ffor events up to and including the 100-year event that are appropriate for Cook County.This effort seeks to prevent post-development flows from exceeding pre-development conditions.The WMO is proposed to be a comprehensive ordinance addressing site run<strong>of</strong>f,floodplains, floodways, wetlands, soil erosion and sedimentation, water quality, and riparianenvironments.2-24
3. Tributary Characteristics and Analysis3.1 71st Street DitchThe 71st Street Ditch is a manmade waterway in thenorthwestern part <strong>of</strong> the <strong>Cal</strong>umet-<strong>Sag</strong> Channel <strong>Water</strong>shedthat discharges into the I&M Canal. The 71st Street Ditchis about 5,000 feet long, draining an area <strong>of</strong> 3.43 squaremiles. Table 3.1.1 lists the communities draining to the71st Street Ditch. Although the Village <strong>of</strong> Hickory Hills isnot included in the drainage area in Table 3.1.1, a maximumdischarge <strong>of</strong> 7.5 cubic feet per second (cfs) ispumped from the Hickory Hills Reservoir to the 71stStreet Ditch through the Roberts Road Storm Sewer.TABLE 3.1.1Communities Draining to 71st StreetDitchTributary AreaCommunity(mi 2 )Bridgeview 1.93Justice 1.08Bedford Park 0.42Table 3.1.2 summarizes the land use distributionwithin the 71st Street Ditch subwatershed. Figure3.1.1 is an overview <strong>of</strong> the tributary area <strong>of</strong>the subwatershed. Reported stormwater problemareas, flood inundation areas, and proposed alternativeprojects are also shown on the figure,and are discussed in the following subsections.3.1.1 Sources <strong>of</strong> DataTABLE 3.1.2Land Use Distribution for 71st Street DitchAreaLand Use Category (acres) %Residential 883.9 40.3Forest/Open Land 689.6 31.4Commercial/Industrial 523.7 23.9Institutional 49.6 2.33.1.1.1 Previous StudiesTransportation/Utility 43.4 2The IDNR completed a study focusing on floodingproblems in the Cork Avenue localized depressionalAgricultural 4 0.2area (IDNR 2000). H&H analyses were performed along with a damage analysis<strong>of</strong> the flooded properties. The principal recommendation <strong>of</strong> the study was to increase thesize <strong>of</strong> the storm sewer from the Cork Avenue depressional area to the 71st Street Ditch andto construct a larger culvert under the Illinois Central Railroad for conveying the additionalflows to the I&M Canal. The B/C ratio <strong>of</strong> the project as determined by IDNR for its study is0.34. The Village <strong>of</strong> Justice has noted the following concerns with the proposed project:• Ground cover at the northern end <strong>of</strong> Cork Avenue may be insufficient for installing a48-inch pipe.• The increase in pipe size at the railroad crossing is constrained by existing utilities andmay require village land acquisition.A study by Patrick Engineering to investigate the drainage capabilities <strong>of</strong> the Roberts Roadstorm sewer from Archer Avenue to 111th Street revealed that the sewer is significantly undersizedfor much <strong>of</strong> the part draining north to the 71st Street Ditch (Patrick Engineering3-1
CALUMET-SAG CHANNEL DETAILED WATERSHED PLAN2006). Replacement <strong>of</strong> the system with an upsized, larger proposed system was recommended.3.1.1.2 <strong>Water</strong> Quality DataThe Illinois Environmental Protection Agency (IEPA) does not have any sites in the Ambient<strong>Water</strong> Quality Monitoring Network on the 71st Street Ditch. There are also no reachesidentified as impaired in the IEPA’s 2008 Integrated <strong>Water</strong> Quality Report, which includes theClean <strong>Water</strong> Act (CWA) 303(d) and 305(b) lists. No total maximum daily loads (TMDLs)have been established for the 71st Street Ditch. According to a water permit discharge queryby the U.S. Environmental Protection Agency (USEPA), there are no National Pollutant DischargeElimination System (NPDES) permits issued by IEPA for discharges to the 71st StreetDitch. Municipalities discharging to the 71st Street Ditch are regulated by IEPA’s NPDESPhase II Stormwater Permit Program, which was instituted to improve water quality by requiringthat municipalities develop six minimum control measures for limiting run<strong>of</strong>f pollutionto receiving systems.3.1.1.3 Wetland and Riparian AreasFigures 2.3.6 and 2.3.7 contain mapping <strong>of</strong> wetland and riparian areas in the <strong>Cal</strong>umet-<strong>Sag</strong>Channel <strong>Water</strong>shed. Wetland areas were identified using National Wetlands Inventory (NWI)mapping. NWI data includes roughly 24.5 acres <strong>of</strong> wetland areas in the 71st Street Ditch subwatershed.Restoration and enhancement <strong>of</strong> wetlands were included as part <strong>of</strong> alternativesdescribed below. Approximately 21.3 acres <strong>of</strong> private property in Bedford Park, immediatelynorth <strong>of</strong> 71st Street Ditch, has been identified by WPC participants as wetland habitat. Riparianareas are defined as vegetated areas between aquatic and upland ecosystems adjacent to awaterway or body <strong>of</strong> water that provides flood management, habitat, and water quality enhancement.Identified riparian environments <strong>of</strong>fer potential opportunities for restoration.3.1.1.4 Floodplain MappingFlood inundation areas supporting the National Flood Insurance Program (NFIP) were revisedin 2008 as a part <strong>of</strong> FEMA’s Map Modernization Program. Floodplain boundaries wererevised based upon updated Cook County topographic information; however, the effectivemodels, which are used to estimate flood levels, were generally not updated. Localized Letters<strong>of</strong> Map Revisions (LOMRs) were incorporated into revised floodplain areas.The 71st Street Ditch is mapped in detail in the DFIRM mapping update, with Zone AEfloodplain shown across the length <strong>of</strong> the 71st Street Ditch. The original H&H analysis wasperformed in 1979 using TR-20 and HEC-2.Appendix A includes a comparison <strong>of</strong> FEMA’s effective floodplain mapping from updatedDFIRM panels with inundation areas developed for the <strong>DWP</strong>.3.1.1.5 Stormwater Problem DataTable 3.1.3 summarizes reported problem areas reviewed as a part <strong>of</strong> the <strong>DWP</strong> development.The problem area data was obtained primarily from Form B questionnaire response data providedby watershed communities, agencies, and stakeholders to the <strong>District</strong>. Problems are3-2
3. TRIBUTARY CHARACTERISTICS AND ANALYSISclassified in Table 3.1.3 as regional or local. This classification is based on a process describedin Section 2.2 <strong>of</strong> this report.3.1.1.6 Near-Term Planned Projects<strong>Water</strong>shed communities, agencies, and stakeholders were asked about near-term plannedprojects so that the implementation <strong>of</strong> near-term flood control projects by others is consideredin development <strong>of</strong> the <strong>DWP</strong>. No near-term planned projects by others have been identifiedfor the 71st Street Ditch subwatershed.TABLE 3.1.3Community Response Data for the 71st Street DitchProblemIDMunicipalityProblems as Reportedby LocalAgencyLocationProblem DescriptionLocal/RegionalResolution in <strong>DWP</strong>BV3Bridgeview,BurbankPavementfloodingRoute 43(HarlemAve.) at79th St.IDOT reportedpavement floodingLocalProblem not locatedalong intercommunitywaterway.BV4Justice,BridgeviewStorm sewercapacityRoberts Rd.between79th St. and83rd St.Frequent roadwayfloodingdue to undersizedstormsewer, RobertsRoad stormsewer lackingsufficient capacityLocalAlthough this is a localproblem, recommendedalternativeSFDT-1 may provideadditional capacity forupsizing Roberts Rd.storm sewer in thefuture.JU2 Justice Overbankflooding,basementflooding, ponding,stormsewer capacityEast <strong>of</strong> CorkAve between73rdPl. and 75thSt.Depressionalarea has nonatural outlet.Drains to 71stStreet Ditchthrough undersizedstormsewerLocalAlthough this is a localproblem, recommendedalternativeSFDT-2 provides additionaldischarge capacityto I&M Canal,which is a component<strong>of</strong> IDNR plan to addresslocal problem.JU3 Justice Overbankflooding,basementflooding, ponding,stormsewer capacity71st StreetDitchInsufficient capacityin 71stStreet Ditch toconvey flowsfrom upstreamcommunitiesRegionalRecommended alternativeSFDT-1 andSFDT-2 reduce stagealong 71st StreetDitch3.1.2 <strong>Water</strong>shed Analysis3.1.2.1 Hydrologic Model DevelopmentSubbasin Delineation. The 71st Street Ditch drainage area was delineated based upon LiDARtopographic data developed by Cook County in 2003. Through review <strong>of</strong> past studies anddiscussion with representatives from the Village <strong>of</strong> Bridgeview, the southern extent <strong>of</strong> the71st Street Ditch tributary area in Bridgeview was defined as 83rd Street. The oil plant north<strong>of</strong> 71st Street Ditch has its own collection system for treating and discharging stormwater tothe I&M canal. The depressional area around problem JU2 was included in the 71st Street3-3
CALUMET-SAG CHANNEL DETAILED WATERSHED PLANDitch watershed, since it drains to the ditch through a 24-inch storm sewer. Twenty-twosubbasins, averaging 99.8 acres in size, were identified for the 71st Street Ditch.Hydrologic Parameter <strong>Cal</strong>culations. CNs were estimated for each subbasin based upon NaturalResources Conservation Service (NRCS) soil data and 2001 Chicago <strong>Metropolitan</strong>Agency for Planning (CMAP) land use data. This method is further described in Section1.3.2, with lookup values for specific combinations <strong>of</strong> land use and soil data presented inAppendix C. An area-weighted average <strong>of</strong> the CN was generated for each subbasin.The lag time, used to convert excess precipitation into a run<strong>of</strong>f hydrograph, was assumed tobe 0.6 times the time <strong>of</strong> concentration for all subbasins. The time <strong>of</strong> concentration, or time <strong>of</strong>travel from the hydrologically most distant part <strong>of</strong> the subbasin, was estimated by usingstandard procedures assuming a length <strong>of</strong> sheet flow, shallow concentrated flow, and channelflow. In some instances, modification to parameter estimates was necessary to more accuratelycharacterize very flat or heavily sewered subwatersheds. Appendix G provides asummary <strong>of</strong> the hydrologic parameters used for subbasins in each subwatershed.The depressional area near JU2 just east <strong>of</strong> Cork Avenue was modeled as a reservoir withinHEC-HMS with a 24-inch outlet. A simulated overland flow outlet at an elevation <strong>of</strong>596.5 feet was included in the model to represent the interbasin flow to Justice Ditch. Thisflow was loaded to the Justice Ditch hydraulic model.3.1.2.2 Hydraulic Model DevelopmentField Data, Investigation, and Existing Model Data. No hydraulic models that met <strong>District</strong> criteria,as identified in Section 6.3.3.2 <strong>of</strong> the CCSMP, were available for <strong>DWP</strong> development.Surveys <strong>of</strong> 71st Street Ditch and all crossings were performed to characterize the channeland near overbank geometry. Cross-sectional geometry in the non-surveyed overbank areawas obtained from Cook County topographic data and combined with the surveyed channelcross section. Field visits were performed to assess channel and overbank roughness characteristics,which were combined with information from photographs and aerial photographyto assign modeled Manning’s n roughness coefficients along the modeled stream length.Boundary Conditions. The I&M Canal, which the 71st Street Ditch discharges into, was assumedto be hydraulically connected to the CSSC and to have roughly the same stage as theCSSC. Modeled elevation <strong>of</strong> the CSSC for the modeled recurrence interval storms is summarizedin Appendix E. The estimated elevation for the 100-year storm at the outlet <strong>of</strong> the 71stStreet Ditch was 585.37 feet NAVD 88, roughly 2.2 feet above the invert <strong>of</strong> the 71st StreetDitch near its confluence with the I&M Canal. This relatively shallow depth indicates thatthe downstream stage <strong>of</strong> 71st Street Ditch is controlled not by the receiving system, but byits own capacity to convey flows received from its tributary area. Therefore, normal depth,assuming a friction slope <strong>of</strong> 0.001, was used as a downstream boundary condition for the71st Street Ditch.3.1.2.3 <strong>Cal</strong>ibration and VerificationNo monitored or observed data was available for the 71st Street Ditch. Curve numbers werereduced by 10 percent for existing and alternative conditions analysis based upon the calibration<strong>of</strong> streams with monitoring data as described in Section 1.3.8.3-4
3. TRIBUTARY CHARACTERISTICS AND ANALYSIS3.1.2.4 Existing Conditions EvaluationFlood Inundation Areas. Figure 3.1.1 shows inundation areas along the 71st Street Ditch producedby the hydraulic model for the 100-year, 12-hour duration design storm.Hydraulic Pr<strong>of</strong>iles. Appendix H contains hydraulic pr<strong>of</strong>iles <strong>of</strong> existing conditions in the 71stStreet Ditch system. Pr<strong>of</strong>iles are shown for the 2-, 5-, 10-, 25-, 50-, 100-, and 500-year recurrenceinterval design storms.3.1.3 Development and Evaluation <strong>of</strong> Alternatives3.1.3.1 Problem DefinitionHydraulic model results were reviewed with inundation mapping to identify locationswhere property damage due to flooding is predicted. Table 3.1.4 summarizes problem areasidentified through hydraulic modeling <strong>of</strong> the 71st Street Ditch.TABLE 3.1.4Modeled Problem Definition for 71st Street DitchProblemIDLocationRecurrence Interval<strong>of</strong> Flooding (yr)AssociatedForm BResolution in <strong>DWP</strong>MPA31MPA32Along 71st Street Ditch to thesouth, west <strong>of</strong> Cork Ave.Along 71st Street Ditch to thesouth, east <strong>of</strong> Cork Ave.25, 50, 100 JU3 Recommended alternativesSFDT-1 andSFDT-2 reduce stagealong 71st Street Ditch100 JU3 Recommended alternativesSFDT-1 andSFDT-2 reduce stagealong 71st Street Ditch3.1.3.2 Damage AssessmentDamages were assessed for the 71st StreetDitch over a 50-year period using the methodologyoutlined in Section 1.4.2 <strong>of</strong> this reportand Section 6.6 <strong>of</strong> the CCSMP.Estimated damages are listed in Table 3.1.5.3.1.3.3 Technology ScreeningTABLE 3.1.5Estimated Damages for 71st Street DitchDamageCategoryEstimatedDamageProperty $78,100Erosion 0Flood control technologies were screened toidentify those most appropriate for addressingthe flooding problems along the 71st Street Ditch. Increased conveyance, storage, andlevees were identified as potential technologies for addressing flooding problems along the71st Street Ditch.NoteTransportation $11,700 Assumed as 15% <strong>of</strong>property damagedue to floodingRecreation 03-5
CALUMET-SAG CHANNEL DETAILED WATERSHED PLAN3.1.3.4 Alternative DevelopmentFlood Control Alternatives. Two flood control alternatives were developed to address overbankflooding problems from the 71st Street Ditch. The alternatives are summarized in Table3.1.6.Erosion Control Alternatives. No erosion control alternatives were developed for the 71stStreet Ditch.TABLE 3.1.6Flood Control Alternatives for 71st Street DitchAlternative Location DescriptionSFDT-1SFDT-2Between Archer Ave. and RobertsRd.71st St. extended along underneathrailroad tracksConstruct a 60-acre-foot detention pond including somewetland habitat on the northeast corner <strong>of</strong> ResurrectionCemetery between Archer Avenue and Roberts Road.Jack additional 48-inch outlet beneath railroad tracks toconvey additional flow to I&M Canal.3.1.3.5 Alternative Evaluation and SelectionSFDT-1 proposes a 60 acre-foot detention basin on the northern corner <strong>of</strong> ResurrectionCemetery, north <strong>of</strong> the existing 71st Street Ditch drainage channel from Bridgeview. It isproposed that the site grading for the proposed SFDT-1 improvement be designed to supportwetlands. Inclusion <strong>of</strong> wetland in the detention area would provide water quality andhabitat benefits in addition to helping address downstream flooding.SFDT-2 proposes that an additional 48-inch outlet from the 71st Street Ditch be jacked beneaththe existing railroad, providing additional conveyance to the I&M Canal. Althoughthis alternative lowers the WSEL more than SFDT-1 in the vicinity <strong>of</strong> the crossing, its upstreamimpacts are less, resulting in fewer benefits than SFDT-1.Damages shown in Table 3.1.5 are associated only with regional overbank flooding. They donot include localized damages that may also be reduced through the construction <strong>of</strong> the alternativessummarized in Table 3.1.6. Both SDFT-1 and SFDT-2 have the potential to improvelocal problem areas. As described in Section 3.1.1.1, the IDNR previouslyrecommended a flood control alternative that consisted <strong>of</strong> a 48-inch storm sewer relievingthe depressed area adjacent to problem location JU2 and discharging to the 71st Street Ditch.It also included a new outlet to the I&M Canal, which is consistent with SFDT-2 summarizedin Table 3.1.6. The average annual damages computed by the IDNR were $16,100($299,700 over 50 years using the discount rate <strong>of</strong> this study) and include local and regionaldamages. The recommended alternative for the 71st Street Ditch may facilitate the implementation<strong>of</strong> the IDNR proposed plan. Only regional benefits are reported in Table 3.1.8,however, for consistency in countywide prioritization <strong>of</strong> stormwater improvements.Alternative SFDT-1, shown in Figure 3.1.2, may also help to address local flooding <strong>of</strong> theRoberts Road storm sewer reported by both Justice and Bridgeview in Problem BV4. If thestorm sewer were upsized, as recommended in the Patrick Engineering report referenced inSection 3.1.1.1, without compensatory storage, overbank flooding along the 71st Street Ditchwould worsen. Construction <strong>of</strong> SFDT-1 would enable increasing conveyance along the RobertsRoad sewer without exacerbating existing flooding problems along the 71st Street Ditch.3-6
3. TRIBUTARY CHARACTERISTICS AND ANALYSISA number <strong>of</strong> properties are at risk <strong>of</strong> shallow flooding during the 100-year flood event underexisting conditions or recommended alternative conditions. In addition, due to their locations,other properties' risk <strong>of</strong> flooding cannot be feasibly mitigated by structuralmeasures. Such properties are candidates for protection using nonstructural flood controlmeasures, such as flood-pro<strong>of</strong>ing or acquisition. These measures may be considered to addressdamages that are not fully addressed by capital projects recommended in the <strong>Cal</strong>umet-<strong>Sag</strong>Channel <strong>DWP</strong>.Recommended alternatives result in reduced stage and/or flow along the modeled waterway.Table 3.1.7 provides a comparison <strong>of</strong> the modeled maximum WSEL, and modeled flowat the time <strong>of</strong> peak at representative locations along the waterway.TABLE 3.1.771st Street Ditch Existing and Alternative Condition Flow and WSEL ComparisonExistingConditions SFDT-1 SFDT-2LocationStationMaxWSEL(ft)MaxFlow(cfs)MaxWSEL(ft)MaxFlow(cfs)MaxWSEL(ft)MaxFlow(cfs)Arbor Ln and Skyline Dr.4783 594.11 52.07 594.11 52.07 594.11 52.0771st St. and 86th Ave. 3373 591.44 329.99 591.26 312.17 591.40 331.20Cork Ave. 1978 589.65 466.50 589.43 427.35 589.33 474.08200-ft downstream <strong>of</strong> Blackstone andOak Grove Ave.Confluence with I&M Canal822 589.00 211.62 588.72 188.45 588.27 154.26152 587.73 210.84 587.52 188.19 587.18 154.023.1.3.6 Data Required for Countywide Prioritization <strong>of</strong> <strong>Water</strong>shed ProjectAppendix I presents conceptual level cost estimates for the recommended alternatives. Table3.1.8 lists the total estimated cost, benefits, and B/C ratio for each alternative. Figures3.1.2 and 3.1.3 show the recommended alternatives for the 71st Street Ditch and a comparison<strong>of</strong> the existing conditions inundation mapping and inundation mapping for recommendedalternative SFDT-1 and SFDT-2, respectively.3-7
CALUMET-SAG CHANNEL DETAILED WATERSHED PLANTABLE 3.1.871st Street Ditch Project Alternative Matrix to Support <strong>District</strong> Capital Improvement Program (CIP) PrioritizationProjectDescriptionB/CRatioNet Benefits($)Total ProjectCost ($)CumulativeStructuresProtectedFundingPossibilities<strong>Water</strong>QualityBenefit Recommended Communities InvolvedSFDT-160 ac-ft DetentionPond0.07a 395,400 5,452,100 12 Positive Yes Justice, Bridgeview, Hickory HillsSFDT-2Additional outletto I&M Canal0.04 31,400 716,700 14 IDNR No ImpactYesJustice, Bridgeview, Hickory Hills,Bedford Parka B/C ratio includes estimated benefits <strong>of</strong> $60,000 per acre for additional wetland area associated with detention facility.Note: Net Benefits values do not include local benefits or non-economic benefits.3-8
3. TRIBUTARY CHARACTERISTICS AND ANALYSIS3.2 79th Street SewerThe 79th Street Sewer is located in southwesternCook County, near the northwestern boundary<strong>of</strong> the <strong>Cal</strong>umet-<strong>Sag</strong> Channel <strong>Water</strong>shed. Theprimary conveyance within this tributary area isthe 79th Street Sewer, which begins at RobertsRoad and flows west, paralleling I-294 for 0.6mile before discharging into the I&M canal. Thesewer drains 2.08 square miles <strong>of</strong> tributary area.Closed conduit systems, such as the 79th StreetDitch, were not modeled or evaluated forstormwater improvements as a component <strong>of</strong>the <strong>Cal</strong>umet-<strong>Sag</strong> Channel <strong>DWP</strong>. Table 3.2.1summarizes the communities that are tributaryto the 79th Street Sewer. Land use within thedrainage area <strong>of</strong> the 79th Street Sewer is predominatelyresidential as shown in Table 3.2.2.TABLE 3.2.1Communities Draining to 79th Street SewerCommunity/Tributary Tributary Area (mi 2 )Hickory Hills 1.07Justice 0.91Unincorporated/ForestPreserveAn area <strong>of</strong> 0.8 square mile <strong>of</strong> Hickory Hills Forest/Open Land 125.9 9.5drains to the 203 acre-foot Hickory Hills Reservoir.This reservoir was sized to provide 100-Commercial/Industrial 82 6.2Transportation/Utility 56.6 4.3year flood protection (Stanley Consultants,1987). Discharges from the reservoir are limitedto 15 cfs, which is generally split equally betweenthe 79th Street Sewer and the RobertsInstitutional<strong>Water</strong>/Wetland38.924.92.91.9Road Sewer (discharging into 71st Street Ditch) depending on the capacity <strong>of</strong> each sewer,which is monitored by telemetry.0.05Bridgeview 0.03Willow Springs 0.02TABLE 3.2.2Land Use Distribution for 79th Street SewerAreaLand Use Category (acres) %Residential 996.8 75.3Figure 3.2.1 provides an overview <strong>of</strong> the tributary area <strong>of</strong> the subwatershed and reportedstormwater problem areas.3.2.1 Sources <strong>of</strong> Data3.2.1.1 Previous StudiesThe report entitled Project Planning for Flood Control, developed by Stanley Consultants in1987, summarized the final design for the Hickory Hills reservoir. The volume elevation relationshipfor the reservoir, confirmation <strong>of</strong> tributary area, and discharge characteristicswere obtained from this report and included in the hydrologic model.3.2.1.2 <strong>Water</strong> Quality DataThe 79th Street Sewer is an enclosed waterway, and therefore, it is not eligible for IEPA’sAmbient <strong>Water</strong> Quality Network, the Integrated <strong>Water</strong> Quality Report, or NPDES point sourcedischarge permits. Municipalities discharging to the 79th Street Sewer are regulated byIEPA’s NPDES Phase II Stormwater Permit Program, which was created to improve the waterquality <strong>of</strong> stormwater run<strong>of</strong>f from urban areas, and requires that municipalities obtain3-9
CALUMET-SAG CHANNEL DETAILED WATERSHED PLANpermits for discharging stormwater and implement the six minimum control measures forlimiting run<strong>of</strong>f pollution to receiving systems.3.2.1.3 Wetland and Riparian AreasFigures 2.3.6 and 2.3.7 contain mapping <strong>of</strong> wetland and riparian areas in the watershed.Wetland areas were identified using NWI mapping. NWI data includes roughly 20.5 acres<strong>of</strong> wetland area in the 79th Street Sewer watershed. Riparian areas are defined as vegetatedareas between aquatic and upland ecosystems adjacent to a waterway or body <strong>of</strong> water thatprovides flood management, habitat, and water quality enhancement. Identified riparianenvironments <strong>of</strong>fer potential opportunities for restoration.3.2.1.4 Floodplain MappingFloodplain mapping for the 79th Street Sewer includes the Hickory Hills Reservoir, as wellas 10 acres <strong>of</strong> Zone AH flooding west <strong>of</strong> the Hickory Hills Reservoir. Effective flooding resultsare based on modeling from 1978, although hydrologic or hydraulic modeling methodsare not specified in the Flood Insurance Study (FIS). Appendix A includes a comparison <strong>of</strong>FEMA’s effective floodplain mapping from updated DFIRM panels with inundation areasdeveloped for the <strong>DWP</strong>.3.2.1.5 Stormwater Problem DataCommunities, agencies (e.g., IDOT, CCHD), and stakeholders submitted Form B questionnaireresponse data to the <strong>District</strong> summarizing known stormwater problems within theirjurisdictions. Table 3.2.3 lists reported problems within the 79th Street Sewer subwatershed.TABLE 3.2.3Community Response Data for the 79th Street SewerProblemIDBV4HH3MunicipalityJustice,BridgeviewHickoryHillsProblems asReported byLocal Agency Location Problem DescriptionStorm sewercapacityBasementflooding,ponding,storm sewercapacityJU1 Justice PavementfloodingJU4 Justice Storm sewercapacityRoberts Rd.between 79thSt. and 83rdSt.85th St to83rd St at8600 WestRoute 171(Archer) atI-294(ramp tosouthbound)Under tollwaybetween 86thand 87thAve.Frequent roadwayflooding due to undersizedstorm sewer.Roberts Rd. stormsewer lacking sufficientcapacity.Insufficient downstreamcapacity inJustice backs up flow.IDOT reported pavementflooding.Storm sewer undertollway has insufficientcapacity for conveyingflows from HickoryHills and Justice.Local/RegionalLocalLocalLocalLocalResolution in <strong>DWP</strong>Although this is a localproblem, alternativeSFDT-1 mayprovide capacity forupsizing Roberts Rd.storm sewer in thefuture.Problem not locatedon a regional waterway.This is a localstorm sewer systemproblem.Problem not locatedalong intercommunitywaterway.Problem not locatedon a regional waterway.This is a localstorm sewer systemproblem3-10
3. TRIBUTARY CHARACTERISTICS AND ANALYSIS3.2.1.6 Near-Term Planned Projects<strong>Water</strong>shed communities, agencies, and stakeholders were asked about near-term plannedprojects so that the implementation <strong>of</strong> near-term flood control projects by others is consideredin development <strong>of</strong> the <strong>DWP</strong>. No near-term planned projects by others have been identifiedfor the 79th Street Sewer subwatershed.3.2.2 <strong>Water</strong>shed Analysis3.2.2.1 Hydrologic Model DevelopmentSubbasin Delineation. The 79th Street Sewer drainage area was delineated based upon Li-DAR topographic data developed by Cook County in 2003. Plans <strong>of</strong> the IDOT storm seweralong 79th Street were not available, and assumptions were made to define subwatershedboundaries for this area. Sixteen (16) subbasins, averaging 82.94 acres in size, were delineatedwithin the 79th Street Sewer subwatershed area.Hydrologic Parameter <strong>Cal</strong>culations. CNs were estimated for each subbasin based upon NRCSsoil data and 2001 CMAP land use data. This method is further described in Section 1.3.2,with lookup values for specific combinations <strong>of</strong> land use and soil data presented in AppendixC. An area-weighted average <strong>of</strong> the CN was generated for each subbasin.The lag time, used to convert excess precipitation into a run<strong>of</strong>f hydrograph, was assumed tobe 0.6 times the time <strong>of</strong> concentration for all subbasins. The time <strong>of</strong> concentration, or time <strong>of</strong>travel from the hydrologically most distant part <strong>of</strong> the subbasin, was estimated by usingstandard procedures assuming a length <strong>of</strong> sheet flow, shallow concentrated flow, and channelflow. In some instances, modification to parameter estimates was necessary to more accuratelycharacterize very flat or heavily sewered subwatersheds. Appendix G provides asummary <strong>of</strong> the hydrologic parameters used for subbasins in each subwatershed.3.2.2.2 Hydraulic Model DevelopmentNo hydraulic model was developed for the closed conduit drainage system <strong>of</strong> the 79thStreet Sewer.3.2.2.3 <strong>Cal</strong>ibration and VerificationNo measured or observed flows or stage data was available for the 79th Street Sewer subwatershed.Curve numbers were reduced by 10 percent for existing and alternative conditionsanalysis based upon the calibration <strong>of</strong> streams with monitoring data as described inSection 1.3.8.3.2.2.4 Existing Conditions EvaluationNo flood inundation areas or hydraulic models were developed for the 79th Street Sewer.3.2.3 Development and Evaluation <strong>of</strong> AlternativesThe 79th Street Sewer, as well as several storm sewers discharging to it, is reported to beundersized and contributing to flooding within the communities <strong>of</strong> Justice and HickoryHills. The scope <strong>of</strong> the <strong>Cal</strong>umet-<strong>Sag</strong> Channel <strong>DWP</strong> does not include evaluating <strong>of</strong> stormsewer networks. A hydraulic analysis <strong>of</strong> the 79th Street Sewer, and the tributary local sew-3-11
CALUMET-SAG CHANNEL DETAILED WATERSHED PLANers, would be required to calculate damages created by a lack <strong>of</strong> conveyance and to developand evaluate alternative improvement projects. No alternatives were developed for the 79thStreet Sewer.3-12
3. TRIBUTARY CHARACTERISTICS AND ANALYSIS3.3 Arroyo DitchArroyo Ditch is a small manmade waterway, about0.2 mile long, tributary to Boca Rio Ditch in theTinley Creek subwatershed, south <strong>of</strong> the <strong>Cal</strong>umet-<strong>Sag</strong> Channel in southwestern Cook County. Threecommunities have areas tributary to Arroyo Ditch,as described in Table 3.3.1. The area tributary to ArroyoDitch is principally residential, with a significantamount <strong>of</strong> open land and forest preserveproperty as listed in Table 3.3.2.Figure 3.3.1 provides an overview <strong>of</strong> the tributaryarea <strong>of</strong> the subwatershed. Reported stormwaterproblem areas and flood inundation areas are alsoshown on the figure and discussed in the followingsubsections.As a tributary to Boca Rio Ditch, Arroyo Ditch is acomponent <strong>of</strong> the Tinley Creek system. Despite itssmall tributary area, development <strong>of</strong> a hydraulicmodel for Arroyo Ditch was necessary to properlyrepresent peak stormwater flows in this area.TABLE 3.3.1Communities Draining to Arroyo DitchTributary AreaCommunity/Tributary (mi 2 )Oak Forest 0.17Matteson 0.07Tinley Park 0.01TABLE 3.3.2Land Use Distribution for Arroyo DitchAreaLand Use (acres) %Residential 101.6 64.8Forest/Open Land 52.3 33.3Commercial/Industrial 3 1.93.3.1 Sources <strong>of</strong> Data3.3.1.1 Previous StudiesNo studies <strong>of</strong> Arroyo Ditch were identified for consideration as a component <strong>of</strong> <strong>DWP</strong> development.3.3.1.2 <strong>Water</strong> Quality DataThe IEPA does not have any sites in the Ambient <strong>Water</strong> Quality Monitoring Network on ArroyoDitch. There are also no reaches identified as impaired in the IEPA’s 2008 Integrated<strong>Water</strong> Quality Report, which includes the CWA 303(d) and 305(b) lists. No TMDLs have beenestablished for Arroyo Ditch. According to a USEPA water permit discharge query, thereare no NPDES permits issued by IEPA for discharges to the Arroyo Ditch. Municipalitiesdischarging to Arroyo Ditch are regulated by IEPA’s NPDES Phase II Stormwater PermitProgram, which was created to improve the water quality <strong>of</strong> stormwater run<strong>of</strong>f from urbanareas, and requires that municipalities obtain permits for discharging stormwater and implementthe six minimum control measures for limiting run<strong>of</strong>f pollution to receiving systems.3.3.1.3 Wetland and Riparian AreasFigures 2.3.6 and 2.3.7 contain mapping <strong>of</strong> wetland and riparian areas in the <strong>Cal</strong>umet-<strong>Sag</strong>Channel <strong>Water</strong>shed. Wetland areas were identified using National Wetlands Inventory (NWI)mapping. NWI data includes roughly 1.4 acres <strong>of</strong> wetland areas within the Arroyo Ditchsubwatershed. Riparian areas are defined as vegetated areas between aquatic and upland ecosystemsadjacent to a waterway or body <strong>of</strong> water that provides flood management, habitat, and3-13
CALUMET-SAG DETAILED WATERSHED PLANwater quality enhancement. Identified riparian environments <strong>of</strong>fer potential opportunities forrestoration.3.3.1.4 Floodplain MappingFlood inundation areas supporting the NFIP were revised in 2008 as a part <strong>of</strong> FEMA’s MapModernization Program. Floodplain boundaries were revised per updated Cook County topographicinformation. However, the effective models, which are used to estimate floodlevels, generally were not updated. LOMRs were incorporated into the revised floodplains.Arroyo Ditch is not mapped in detail in the DFIRM mapping update, although backwaterfrom Boca Rio Ditch is extended as Zone AE flooding along Arroyo Drive. Appendix A includesa comparison <strong>of</strong> FEMA’s effective floodplain mapping from updated DFIRM panelswith inundation areas developed for the <strong>DWP</strong>.3.3.1.5 Stormwater Problem DataCommunities, agencies (e.g., IDOT, CCHD), and stakeholders submitted <strong>District</strong> Form Bquestionnaire response data to the <strong>District</strong> summarizing known stormwater problemswithin their jurisdictions. No Form B responses related to Arroyo Ditch were submitted.3.3.1.6 Near-Term Planned Projects<strong>Water</strong>shed communities, agencies, and stakeholders were asked about near-term plannedprojects so that the implementation <strong>of</strong> near-term flood control projects by others is consideredin development <strong>of</strong> the <strong>DWP</strong>. No near-term planned projects by others have been identifiedfor the Arroyo Ditch subwatershed.3.3.2 <strong>Water</strong>shed Analysis3.3.2.1 Hydrologic Model DevelopmentSubbasin Delineation. The Arroyo Ditch tributary area was delineated based primarily uponLiDAR topographic data developed by Cook County in 2003. The topographic delineationgenerally was representative <strong>of</strong> drainage patterns in the Arroyo Ditch basin; however, somemodifications were required to reflect manmade modifications to drainage patterns. Part <strong>of</strong>the basin is adjacent to the Little <strong>Cal</strong>umet <strong>Water</strong>shed. The <strong>Cal</strong>umet-<strong>Sag</strong> and Little <strong>Cal</strong>umetboundaries were compared, and minor discrepancies were identified. Discrepancies wereresolved through additional review <strong>of</strong> topographic data, consultation with local communities,and coordination with other watershed planning consultants.Table 3.3.3 summarizes the total drainage area,number <strong>of</strong> subbasins, and average subbasin sizefor Arroyo Ditch and its tributaries.Hydrologic Parameter <strong>Cal</strong>culations. CNs were estimatedfor each subbasin based upon NRCS soildata and 2001 CMAP land use data. This methodTABLE 3.3.3Arroyo Ditch Subbasin SummaryDrainageArea (mi 2 )Number <strong>of</strong>ModeledSubbasinsAverage ModeledSubbasinSize (acres)0.25 1 156.87is further described in Section 1.3.2, with lookup values for specific combinations <strong>of</strong> land useand soil data presented in Appendix C. An area-weighted average <strong>of</strong> the CN was generatedfor each subbasin.3-14
3. TRIBUTARY CHARACTERISTICS AND ANALYSISThe lag time, used to convert excess precipitation into a run<strong>of</strong>f hydrograph, was assumed tobe 0.6 times the time <strong>of</strong> concentration for all subbasins. The time <strong>of</strong> concentration, or time <strong>of</strong>travel from the hydrologically most distant part <strong>of</strong> the subbasin, was estimated by usingstandard procedures assuming a length <strong>of</strong> sheet flow, shallow concentrated flow, and channelflow. In some instances, modification to parameter estimates was necessary to more accuratelycharacterize very flat or heavily sewered subwatersheds. Appendix G provides asummary <strong>of</strong> the hydrologic parameters used for each subwatershed.3.3.2.2 Hydraulic Model DevelopmentField Data, Investigation, and Existing Model Data. No hydraulic models that meet <strong>District</strong> criteria,as identified in Section 6.3.3.2 <strong>of</strong> the CCSMP, were available for <strong>DWP</strong> development. Theopen channel <strong>of</strong> Arroyo Ditch and all crossings were surveyed to characterize the channel andnear overbank geometry. Cross-sectional geometry in the non-surveyed overbank area wasobtained from Cook County topographic data and combined with the surveyed channel crosssection. Field visits were performed to assess channel and overbank roughness characteristics,which were combined with information from photographs and aerial photography to assignManning’s n roughness coefficients along the modeled stream length.Boundary Conditions. The Arroyo Ditch hydraulic model was run as a component <strong>of</strong> the largerTinley Creek hydraulic model, with downstream water surface elevations defined by theBoca Rio Ditch tributary model.3.3.2.3 <strong>Cal</strong>ibration and VerificationNo measured or observed flows or stage data was available for Arroyo Ditch for comparisonwith modeled values. Curve numbers were reduced by 10 percent for existing and alternativeconditions analysis based upon the calibration <strong>of</strong> streams with monitoring data asdescribed in Section 1.3.8.3.3.2.4 Existing Conditions EvaluationFlood Inundation Areas. Figure 3.3.1 shows inundation areas produced by the hydraulicmodel for the 100-year, 12-hour duration Huff Quartile II design storm.Hydraulic Pr<strong>of</strong>iles. Appendix H contains hydraulic pr<strong>of</strong>iles <strong>of</strong> existing conditions in the ArroyoDitch system. Pr<strong>of</strong>iles are shown for the 2-, 5-, 10-, 25-, 50-, 100-, and 500-year recurrenceinterval design storms.3.3.3 Development and Evaluation <strong>of</strong> AlternativesNo regional stormwater problems were identified in the Arroyo Ditch subwatershed. The hydraulicmodel <strong>of</strong> Arroyo Ditch does not predict any overbank property damage due to floodingfor any <strong>of</strong> the modeled design events. Flooding along Arroyo Drive and Las Flores Drivewas predicted for events <strong>of</strong> a 25-year magnitude or greater, but did not extend to homes alongthose drives. No stormwater improvements were developed for Arroyo Ditch. Alternativeimprovements to address regional problems are not recommended for Arroyo Ditch.3-15
3. TRIBUTARY CHARACTERISTICS AND ANALYSIS3.4 Boca Rio DitchBoca Rio Ditch is a tributary to Tinley Creeklocated south <strong>of</strong> the <strong>Cal</strong>umet-<strong>Sag</strong> Channel inthe southeastern portion <strong>of</strong> the <strong>Cal</strong>umet-<strong>Sag</strong>Channel <strong>Water</strong>shed. The drainage area <strong>of</strong> BocaRio Ditch is roughly 2.3 square miles. Table3.4.1 lists the communities draining to Boca RioDitch. Table 3.4.2 summarizes the land use distributionwithin the Boca Rio Ditch tributaryarea. The upstream part <strong>of</strong> Boca Rio Ditch generallyis residential, with the downstream partdraining through Cook County Forest Preserveproperty. Figure 3.4.1 is an overview <strong>of</strong> thetributary area <strong>of</strong> the subwatershed. Reportedstormwater problem areas and flood inundationareas are also shown on the figure, and arediscussed in the following subsections.3.4.1 Sources <strong>of</strong> Data3.4.1.1 Previous StudiesNo studies <strong>of</strong> Boca Rio Ditch were identifiedfor consideration as a component <strong>of</strong> <strong>DWP</strong> development.TABLE 3.4.1Communities Draining to Boca Rio DitchCommunity/TributaryTributaryArea (mi 2 )Unincorporated/Forest Preserve 1.0Oak Forest 1.0Orland Park 0.2Matteson 0.1TABLE 3.4.2Land Use Distribution for Boca Rio DitchLand Use Category Area (acres) %Forest/Open Land 696.1 47.3Residential 563.5 38.3Commercial/Industrial 96.1 6.5Agricultural 55 3.7Institutional 32 2.2<strong>Water</strong>/Wetland 21.6 1.5Transportation/Utility 7.5 0.53.4.1.2 <strong>Water</strong> Quality DataThe IEPA does not have any sites in the Ambient <strong>Water</strong> Quality Monitoring Network on theBoca Rio Ditch. There are also no reaches identified as impaired in the IEPA’s 2008 Integrated<strong>Water</strong> Quality Report, which includes the CWA 303(d) and 305(b) lists. No TMDLs have beenestablished for Boca Rio Ditch. According to a USEPA water permit discharge query, there areno NPDES permits issued by IEPA for discharges to the Boca Rio Ditch. Municipalities dischargingto Boca Rio Ditch are regulated by IEPA’s NPDES Phase II Stormwater Permit Program,which was created to improve the water quality <strong>of</strong> stormwater run<strong>of</strong>f from urban areas,and requires that municipalities obtain permits for discharging stormwater and implementthe six minimum control measures for limiting run<strong>of</strong>f pollution to receiving systems.3.4.1.3 Wetland and Riparian AreasFigures 2.3.6 and 2.3.7 contain mapping <strong>of</strong> wetland and riparian areas in the <strong>Cal</strong>umet-<strong>Sag</strong>Channel <strong>Water</strong>shed. Wetland areas were identified using National Wetlands Inventory (NWI)mapping. NWI data includes roughly 67.3 acres <strong>of</strong> wetland areas in the Boca Rio Ditch subwatershed.Riparian areas are defined as vegetated areas between aquatic and upland ecosystemsadjacent to a waterway or body <strong>of</strong> water that provides flood management, habitat, andwater quality enhancement. Identified riparian environments <strong>of</strong>fer potential opportunities forrestoration.3-17
CALUMET-SAG DETAILED WATERSHED PLAN3.4.1.4 Floodplain MappingFlood inundation areas supporting the NFIP were revised in 2008 as a part <strong>of</strong> FEMA’s MapModernization Program. Floodplain boundaries were revised based upon updated CookCounty topographic information, however, the effective models, which are used to estimateflood levels, were generally not updated. LOMRs were incorporated in the revised floodplains.Regression equations from 1973 and WSP-2 were used for the effective hydrologicand hydraulic Boca Rio Ditch models, respectively. The models were developed in 1977.Appendix A includes a comparison <strong>of</strong> FEMA’s effective floodplain mapping from updatedDFIRM panels with inundation areas developed for the <strong>DWP</strong>.3.4.1.5 Stormwater Problem DataCommunities, regional agencies (e.g., IDOT, CCHD), and stakeholders submitted <strong>District</strong>Form B questionnaire response data summarizing known stormwater problems within theirjurisdictions. Stormwater problems were classified as regional or local based upon the criteriadescribed in Section 1 <strong>of</strong> the report. Table 3.4.3 summarizes Form B data for Boca Rio Ditch.TABLE 3.4.3Community Response Data for Boca Rio DitchProblemIDMunicipalityProblems asReported byLocal Agency Location Problem DescriptionLocal/RegionalResolution in <strong>DWP</strong>BR4BremenTownshipMaintenance,pondingRidgelandAvenue1/8 milenorth <strong>of</strong>147thStreetCulvert box submerged(CCHD)LocalProblem not locatedalong a regionalwaterwayOF3 Oak Forest Maintenance,overbankflooding,sedimentation,bankerosionPropertyjust north<strong>of</strong> 151stStreet andBoca RioDriveProperty owner inBremen Townshipdenies access to allowOak Forest tomaintain channel, resultingin significantsedimentation andupstream flooding.RegionalAccess to privateproperty must begranted to allowOak Forest to performstream maintenancein thisarea. Capital improvementprojectnot created for thisarea.Problem OF3 is a continuing maintenance concern for the Village <strong>of</strong> Oak Forest, which hasrepeatedly been denied access to 1,800 feet <strong>of</strong> Boca Rio Ditch by the property owner. Routinemaintenance to remove debris and other obstructions is important for preserving theconveyance capacity <strong>of</strong> streams and to avoid causing upstream damages. Although not includedas a capital project within the <strong>DWP</strong>, it is imperative that the Village <strong>of</strong> Oak Forest orthe <strong>District</strong> be granted access to the property to perform stream maintenance. Failure toproperly maintain this waterway will ultimately result in severe flow restriction and maycause upstream property damage during a significant rain event.3-18
3. TRIBUTARY CHARACTERISTICS AND ANALYSIS3.4.1.6 Near-Term Planned Projects<strong>Water</strong>shed communities, agencies, and stakeholders were asked about near-term plannedprojects so that the implementation <strong>of</strong> near-term flood control projects by others is consideredin development <strong>of</strong> the <strong>DWP</strong>. No near-term planned projects by others have been identifiedfor the Boca Rio Ditch subwatershed.3.4.2 <strong>Water</strong>shed Analysis3.4.2.1 Hydrologic Model DevelopmentSubbasin Delineation. The Boca Rio Ditch tributary area was delineated based primarilyupon LiDAR topographic data developed by Cook County in 2003. The topographic delineationwas generally representative <strong>of</strong> drainage patterns in the Boca Rio Ditch subwatershed;however, subwatersheds sometimes were split or modified to reflect manmademodifications to topographic drainage patterns.Part <strong>of</strong> the Boca Rio Ditch basin is adjacentto the Little <strong>Cal</strong>umet <strong>Water</strong>shed.Initial boundaries <strong>of</strong> the <strong>Cal</strong>umet-<strong>Sag</strong>and Little <strong>Cal</strong>umet <strong>Water</strong>sheds werecompared, and discrepancies identified.Discrepancies were generally minorand were resolved by manualreview <strong>of</strong> topographic data and consultationwith local communities.Table 3.4.4 summarizes the total drainagearea, number <strong>of</strong> subbasins, and averagesubbasin size for Boca Rio Ditchand its tributaries.TABLE 3.4.4Boca Rio Ditch Subbasin SummarySubbasinDrainageArea(mi 2 )Number <strong>of</strong>ModeledSubbasinsBoca Rio Ditch 2.30 13 112.85Major Tributaries to Boca Rio DitchArroyo Ditch 0.25 1 156.87Total 2.55 14 115.99AverageModeledSubbasin Size(acres)Hydrologic Parameter <strong>Cal</strong>culations. CNs were estimated for each subbasin based upon NRCSsoil data and 2001 CMAP land use data. This method is further described in Section 1.3.2,with lookup values for specific combinations <strong>of</strong> land use and soil data presented in AppendixC. An area-weighted average <strong>of</strong> the CN was generated for each subbasin.The lag time, used to convert excess precipitation into a run<strong>of</strong>f hydrograph, was assumed tobe 0.6 times the time <strong>of</strong> concentration for all subbasins. The time <strong>of</strong> concentration, or time <strong>of</strong>travel from the hydrologically most distant part <strong>of</strong> the subbasin, was estimated by usingstandard procedures assuming a length <strong>of</strong> sheet flow, shallow concentrated flow, and channelflow. In some instances, modification to parameter estimates was necessary to more accuratelycharacterize very flat or heavily sewered subwatersheds. Appendix G provides asummary <strong>of</strong> the hydrologic parameters used for subbasins in each subwatershed.3.4.2.2 Hydraulic Model DevelopmentField Data, Investigation, and Existing Model Data. No hydraulic models that met the <strong>District</strong>criteria for use in the <strong>DWP</strong>, as identified in Section 6.3.3.2 <strong>of</strong> the CCSMP, were identified asavailable to directly contribute to the development <strong>of</strong> the <strong>Cal</strong>umet-<strong>Sag</strong> Channel <strong>DWP</strong>. Surveys<strong>of</strong> the open channel part <strong>of</strong> the Boca Rio Ditch and all crossings were performed to3-19
CALUMET-SAG DETAILED WATERSHED PLANcharacterize the channel and near overbank geometry. Cross-sectional geometry in the nonsurveyedoverbank area was obtained from Cook County topographic data and combinedwith the surveyed channel cross section. Field visits were performed to assess channel andoverbank roughness characteristics, which were combined with information from photographsand aerial photography to assign modeled Manning’s n roughness coefficients alongthe modeled stream length.Boundary Conditions. The Boca Rio Ditch model was run as a component <strong>of</strong> the Tinley Creeksystem model, with downstream water surface elevations defined by the dynamic modeledwater surface <strong>of</strong> the Tinley Creek hydraulic model developed as a part <strong>of</strong> the <strong>Cal</strong>umet-<strong>Sag</strong>Channel <strong>DWP</strong>.3.4.2.3 <strong>Cal</strong>ibration and VerificationNo measured or observed flows or stage data was available for Boca Rio Ditch for comparisonwith modeled values. Curve numbers were reduced by 10 percent for existing and alternativeconditions analysis based upon the calibration <strong>of</strong> streams with monitoring data asdescribed in Section 1.3.8.3.4.2.4 Existing Conditions EvaluationFlood Inundation Areas. Figure 3.4.1 shows inundation areas along Boca Rio Ditch producedby the hydraulic model for the 100-year, 12-hour duration design storm.Hydraulic Pr<strong>of</strong>iles. Appendix H contains hydraulic pr<strong>of</strong>iles <strong>of</strong> existing conditions in the BocaRio Ditch system. Pr<strong>of</strong>iles are shown for the 2-, 5-, 10-, 25-, 50-, 100-, and 500-year recurrenceinterval design storms.3.4.3 Development and Evaluation <strong>of</strong> AlternativesNo regional stormwater problems were identified in the Boca Rio Ditch subwatershed. Thehydraulic model <strong>of</strong> Boca Rio Ditch does not predict any overbank property damage due t<strong>of</strong>looding for any <strong>of</strong> the modeled design events. Flooding is predicted along 151st Street andLas Flores Drive, but is confined to roadways. No stormwater improvements were developedfor Boca Rio Ditch. Alternative improvements to address regional problems are notrecommended for Boca Rio Ditch.3-20
3. TRIBUTARY CHARACTERISTICS AND ANALYSIS3.5 <strong>Cal</strong>umet-<strong>Sag</strong> Tributary A<strong>Cal</strong>umet-<strong>Sag</strong> Tributary A is located in southwesternCook County, south <strong>of</strong> the <strong>Cal</strong>umet-<strong>Sag</strong>Channel, in the western part <strong>of</strong> the <strong>Cal</strong>umet-<strong>Sag</strong>Channel <strong>Water</strong>shed. Table 3.5.1 summarizes theareas <strong>of</strong> communities that drain to <strong>Cal</strong>umet-<strong>Sag</strong>Tributary A. <strong>Cal</strong>umet-<strong>Sag</strong> Tributary A is a naturalopen-channel stream draining 2.96 square milesthat discharges into the <strong>Cal</strong>umet-<strong>Sag</strong> Channel. The<strong>Cal</strong>umet-<strong>Sag</strong> Tributary A subwatershed contains amix <strong>of</strong> suburban development and available openland. Most <strong>of</strong> the open land within the watershedis Cook County Forest Preserve property. Table3.5.2 lists the land use breakdown by area withinthe <strong>Cal</strong>umet-<strong>Sag</strong> Tributary A subwatershed.Figure 3.5.1 is an overview <strong>of</strong> the tributary area <strong>of</strong>the subwatershed. Reported stormwater problemareas and flood inundation areas are also shownon the figure, and are discussed in the followingsubsections.TABLE 3.5.1Communities Draining to <strong>Cal</strong>umet-<strong>Sag</strong> Tributary ACommunity Tributary Area (mi 2 )Unincorporated/Forest Preserve2.96TABLE 3.5.2Land Use Distribution for <strong>Cal</strong>umet-<strong>Sag</strong> Tributary ALand Use Area(acres)%Forest/Open Land 1,055.8 55.8Residential 612.4 32.3Agricultural 119.8 6.3<strong>Water</strong>/Wetland 85.9 4.5Institutional 17 0.9Commercial/Industrial 2.9 0.23.5.1 Sources <strong>of</strong> Data3.5.1.1 Previous StudiesNo studies <strong>of</strong> <strong>Cal</strong>umet-<strong>Sag</strong> Tributary A were identified for consideration as a component <strong>of</strong><strong>DWP</strong> development.3.5.1.2 <strong>Water</strong> Quality DataThe IEPA does not have any site in the Ambient <strong>Water</strong> Quality Monitoring Network for<strong>Cal</strong>umet-<strong>Sag</strong> Tributary A. There are also no reaches identified as impaired in the IEPA’s 2008Integrated <strong>Water</strong> Quality Report, which includes the 303(d) and 305(b) lists. No TMDLs havebeen established for <strong>Cal</strong>umet-<strong>Sag</strong> Tributary A. According to a USEPA water permit dischargequery, one point source discharge location was identified on <strong>Cal</strong>umet-<strong>Sag</strong> Tributary Aat the Holy Family Villa Nursing Home in Lemont Township (IL0024678). Municipalities dischargingto the <strong>Cal</strong>umet-<strong>Sag</strong> Channel are regulated by IEPA’s NPDES Phase II StormwaterPermit Program, which seeks to improve water quality by requiring that municipalities developsix minimum control measures for limiting run<strong>of</strong>f pollution to receiving systems.3.5.1.3 Wetland and Riparian AreasFigures 2.3.6 and 2.3.7 contain mapping <strong>of</strong> wetland and riparian areas in the <strong>Cal</strong>umet-<strong>Sag</strong>Channel <strong>Water</strong>shed. Wetland areas were identified using National Wetlands Inventory (NWI)mapping. NWI data includes roughly 209.8 acres <strong>of</strong> wetland areas in the <strong>Cal</strong>umet-<strong>Sag</strong> TributaryA subwatershed. Riparian areas are defined as vegetated areas between aquatic and uplandecosystems adjacent to a waterway or body <strong>of</strong> water that provides flood management,3-21
CALUMET-SAG DETAILED WATERSHED PLANhabitat, and water quality enhancement. Identified riparian environments <strong>of</strong>fer potential opportunitiesfor restoration.3.5.1.4 Floodplain MappingFlood inundation areas supporting the NFIP were revised in 2008 as a part <strong>of</strong> FEMA’s MapModernization program. Floodplain boundaries were revised based upon updated CookCounty topographic information; however, the effective models, which are used to estimateflood levels, were generally not updated. LOMRs were incorporated in the revised floodplains.<strong>Cal</strong>umet-<strong>Sag</strong> Tributary A is mapped in detail in the DFIRM mapping update, with Zone AEfloodplain defined for the length <strong>of</strong> <strong>Cal</strong>umet-<strong>Sag</strong> Tributary A. According to the FIS, the originalhydrologic and hydraulic analysis was performed in 1976. The hydrologic modeling wasperformed using Regression Equations 73 and 75 and Log-Pearson Type III (L-PTIII). Hydraulicrouting performed was steady state and used the WSP-2 modeling application.Appendix A includes a comparison <strong>of</strong> FEMA’s effective floodplain mapping from updatedDFIRM panels with inundation areas developed for the <strong>DWP</strong>.3.5.1.5 Stormwater Problem DataCommunities, regional agencies (e.g., IDOT, CCHD), and stakeholders submitted Form Bquestionnaire response data to the <strong>District</strong> summarizing known stormwater problemswithin their jurisdictions. Stormwater problems were classified as regional or local basedupon the criteria described in Section 1. Table 3.5.3 shows reported problems along <strong>Cal</strong>umet-<strong>Sag</strong>Tributary A.TABLE 3.5.3Community Response Data for <strong>Cal</strong>umet-<strong>Sag</strong> Tributary AProblemIDMunicipalityProblems asReported byLocal Agency Location Problem DescriptionLocal/RegionalResolution in<strong>DWP</strong>LT5LemontTownshipPavementflooding,pondingMcCarthy Rd.between BellRd. and Will-Cook Rd., nearEquestrian EstatesneighborhoodMcCarthy Rd. andnearby yards flood,including propertythat contains a largepond. Pond has insufficientstorage volumeand/or outlet capacityto contain flows.LocalProblem notlocated on aregional waterway.This isa local problem.3.5.1.6 Near-Term Planned Projects<strong>Water</strong>shed communities, agencies, and stakeholders were asked about near-term plannedprojects so that the implementation <strong>of</strong> near-term flood control projects by others is consideredin development <strong>of</strong> the <strong>DWP</strong>. No near-term planned projects by others have been identifiedfor the <strong>Cal</strong>umet-<strong>Sag</strong> Tributary A subwatershed.3-22
3. TRIBUTARY CHARACTERISTICS AND ANALYSIS3.5.2 <strong>Water</strong>shed Analysis3.5.2.1 Hydrologic Model DevelopmentSubbasin Delineation. The <strong>Cal</strong>umet-<strong>Sag</strong> Tributary A tributary area was delineated based uponLiDAR topographic data developed by Cook County in 2003. Eighteen subbasins were delineatedfor the <strong>Cal</strong>umet-<strong>Sag</strong> Tributary A area, with an average subbasin area <strong>of</strong> 105.3 acresand a total drainage area <strong>of</strong> 2.96 square miles.Hydrologic Parameter <strong>Cal</strong>culations. CNs were estimated for each subbasin based upon NRCSsoil data and 2001 CMAP land use data, described further in Section 1.3.2, with lookup valuesfor specific combinations <strong>of</strong> land use and soil data presented in Appendix C. An areaweightedaverage <strong>of</strong> the CN was generated for each subbasin. The lag time, used to convertexcess precipitation into a run<strong>of</strong>f hydrograph, was assumed to be 0.6 times the time <strong>of</strong> concentrationfor all subbasins. The time <strong>of</strong> concentration, or time <strong>of</strong> travel from the hydrologicallymost distant part <strong>of</strong> the subbasin, was estimated by using standard proceduresassuming a length <strong>of</strong> sheet flow, shallow concentrated flow, and channel flow. In some instances,modification to parameter estimates was necessary to more accurately characterizevery flat or heavily sewered subwatersheds. Appendix G provides a summary <strong>of</strong> the hydrologicparameters used for subbasins in each subwatershed.3.5.2.2 Hydraulic Model DevelopmentField Data, Investigation, and Existing Model Data. No hydraulic models that met <strong>District</strong> criteria,as identified in Section 6.3.3.2 <strong>of</strong> the CCSMP, were available for <strong>DWP</strong> development.The open channel <strong>of</strong> <strong>Cal</strong>umet-<strong>Sag</strong> Tributary A and all crossings were surveyed to characterizethe channel and near overbank geometry. Cross-sectional geometry in the non-surveyedoverbank area was obtained from Cook County topographic data and combined with thesurveyed channel cross section. Field visits were performed to assess channel and overbankroughness characteristics, which were combined with information from photographs andaerial photography to assign modeled Manning’s n roughness coefficient to the stream.Boundary Conditions. Boundary condition elevations for the <strong>Cal</strong>umet-<strong>Sag</strong> Channel are basedon output from the CWS model and are included in Appendix E. The elevation produced bythe CWS model for the 100-year storm at the outlet <strong>of</strong> <strong>Cal</strong>umet-<strong>Sag</strong> Tributary A was584.22 feet (NAVD 88), which is higher than the water surface elevation generated using anormal depth based upon the channel slope. The downstream stages from the CWS modelwere used for the downstream boundary conditions <strong>of</strong> the various storms.3.5.2.3 <strong>Cal</strong>ibration and VerificationNo measured or observed stages were available for <strong>Cal</strong>umet-<strong>Sag</strong> Tributary A to comparemodel results to observed flows or stage. Curve numbers were reduced by 10 percent for existingand alternative conditions analysis based upon the calibration <strong>of</strong> streams with monitoringdata as described in Section 1.3.8.3.5.2.4 Existing Conditions EvaluationFlood Inundation Areas. Figure 3.5.1 shows inundation areas produced by the <strong>DWP</strong>’s hydraulicmodel for the 100-year, 12-hour duration design storm.3-23
CALUMET-SAG DETAILED WATERSHED PLANHydraulic Pr<strong>of</strong>iles. Appendix H contains hydraulic pr<strong>of</strong>iles <strong>of</strong> existing conditions in the<strong>Cal</strong>umet-<strong>Sag</strong> Tributary A system. Pr<strong>of</strong>iles are shown for the 2-, 5-, 10-, 25-, 50-, 100-, and500-year recurrence interval design storms.3.5.3 Development and Evaluation <strong>of</strong> AlternativesNo regional stormwater problems were identified in the <strong>Cal</strong>umet-<strong>Sag</strong> Tributary A subwatershed.The hydraulic model <strong>of</strong> <strong>Cal</strong>umet-<strong>Sag</strong> Tributary A does not predict any overbankproperty damage due to flooding for any <strong>of</strong> the modeled design events. No stormwater improvementswere developed for <strong>Cal</strong>umet-<strong>Sag</strong> Tributary A. Alternative improvements toaddress regional problems are not recommended for <strong>Cal</strong>umet-<strong>Sag</strong> Tributary A.3-24
3. TRIBUTARY CHARACTERISTICS AND ANALYSIS3.6 <strong>Cal</strong>umet-<strong>Sag</strong> Tributary B<strong>Cal</strong>umet-<strong>Sag</strong> Tributary B is a regional waterway insouthwestern Cook County, south <strong>of</strong> the <strong>Cal</strong>umet-<strong>Sag</strong> Channel and in the central part <strong>of</strong> the <strong>Cal</strong>umet-<strong>Sag</strong>Channel <strong>Water</strong>shed. The total drainagearea for <strong>Cal</strong>umet-<strong>Sag</strong> Tributary B is 1.1 squaremiles. Table 3.6.1 provides a summary <strong>of</strong> thecommunities draining to the <strong>Cal</strong>umet-<strong>Sag</strong> TributaryB subwatershed. The <strong>Cal</strong>umet-<strong>Sag</strong> TributaryB subwatershed is largely residential. Table 3.6.2provides a summary <strong>of</strong> the land use distributionwithin the <strong>Cal</strong>umet-<strong>Sag</strong> Tributary B subwatershed.Figure 3.6.1 is an overview <strong>of</strong> the tributary area <strong>of</strong>the subwatershed. Reported stormwater problemareas, flood inundation areas, and proposed alternativeprojects are also shown on the figure, andare discussed in the following subsections.3.6.1 Sources <strong>of</strong> Data3.6.1.1 Previous StudiesNo previous studies <strong>of</strong> <strong>Cal</strong>umet-<strong>Sag</strong> Tributary Bwere identified for use in the development <strong>of</strong><strong>DWP</strong>s.TABLE 3.6.1Communities Draining to <strong>Cal</strong>umet-<strong>Sag</strong> Tributary BTributaryCommunityArea (mi 2 )Palos Park 0.97Unincorporated/Forest Preserve0.11Palos Heights 0.03TABLE 3.6.2Land Use Distribution for <strong>Cal</strong>umet-<strong>Sag</strong> Tributary BLand UseCategory Area (acres) %Residential 662.5 92.9Institutional 16.6 2.3Transportation/UtilityCommercial/IndustrialForest/OpenLand13.7 1.910 1.45.7 0.8<strong>Water</strong>/Wetland 4.4 0.63.6.1.2 <strong>Water</strong> Quality DataThe IEPA does not have any sites in the Ambient <strong>Water</strong> Quality Monitoring Network on<strong>Cal</strong>umet-<strong>Sag</strong> Tributary B. No reaches are identified as impaired in the IEPA’s 2008 Integrated<strong>Water</strong> Quality Report, which includes the CWA 303(d) and 305(b) lists. No TMDLs have beenestablished for <strong>Cal</strong>umet-<strong>Sag</strong> Tributary B. According to a USEPA water permit dischargequery, there are no NPDES permits issued by IEPA for discharges to <strong>Cal</strong>umet-<strong>Sag</strong> TributaryB. Municipalities discharging to <strong>Cal</strong>umet-<strong>Sag</strong> Tributary B are regulated by IEPA’s NPDESPhase II Stormwater Permit Program, which was created to improve the water quality <strong>of</strong>stormwater run<strong>of</strong>f from urban areas, and requires that municipalities obtain permits for dischargingstormwater and implement the six minimum control measures for limiting run<strong>of</strong>fpollution to receiving systems.3.6.1.3 Wetland and Riparian AreasFigures 2.3.6 and 2.3.7 contain mapping <strong>of</strong> wetland and riparian areas in the <strong>Cal</strong>umet-<strong>Sag</strong>Channel <strong>Water</strong>shed. Wetland areas were identified using National Wetlands Inventory (NWI)mapping. NWI data includes 12.4 acres <strong>of</strong> wetland area in the <strong>Cal</strong>umet-<strong>Sag</strong> Tributary Bsubwatershed. Riparian areas are defined as vegetated areas between aquatic and upland ecosystemsadjacent to a waterway or body <strong>of</strong> water that provides flood management, habitat, and3-25
CALUMET-SAG DETAILED WATERSHED PLANwater quality enhancement. Identified riparian environments <strong>of</strong>fer potential opportunities forrestoration.3.6.1.4 Floodplain MappingFlood inundation areas supporting the NFIP were revised in 2008 as a part <strong>of</strong> FEMA’s MapModernization Program. Floodplain boundaries were revised based upon updated CookCounty topographic information; however, the effective models, which are used to estimateflood levels, generally were not updated. LOMRs were incorporated into revised floodplainareas.<strong>Cal</strong>umet-<strong>Sag</strong> Tributary B is mapped in detail in the DFIRM mapping update, with Zone AEfloodplain shown from Southwest Highway in Palos Park to the <strong>Cal</strong>umet-<strong>Sag</strong> Channel. Theoriginal hydrologic and hydraulic analysis was performed in 1976. Hydrologic modelingwas performed using Regression Equations 73 and 75. Hydraulic routing performed wassteady state and used the WSP-2 modeling application.Appendix A includes a comparison <strong>of</strong> FEMA’s effective floodplain mapping from updatedDFIRM panels with inundation areas developed for the <strong>DWP</strong>.3.6.1.5 Stormwater Problem DataCommunities, regional agencies (IDOT, CCHD), and stakeholders submitted <strong>District</strong> FormB questionnaire response data to the <strong>District</strong> summarizing known stormwater problemswithin their jurisdictions. Stormwater problems were classified as regional or local basedupon the criteria described in Section 1 <strong>of</strong> the report. Table 3.6.3 summarizes the Form Bdata for <strong>Cal</strong>umet-<strong>Sag</strong> Tributary B.3.6.1.6 Near-Term Planned Project<strong>Water</strong>shed communities, agencies, and stakeholders were asked about near-term plannedprojects so that the implementation <strong>of</strong> near-term flood control projects by others is consideredin development <strong>of</strong> the <strong>DWP</strong>. No near-term planned projects by others have been identifiedfor the <strong>Cal</strong>umet-<strong>Sag</strong> Tributary B subwatershed.3.6.2 <strong>Water</strong>shed Analysis3.6.2.1 Hydrologic Model DevelopmentSubbasin Delineation. The <strong>Cal</strong>umet-<strong>Sag</strong> Tributary B subwatershed area was delineated basedprimarily upon LiDAR topographic data developed by Cook County in 2003. The area wasreviewed and area southeast <strong>of</strong> Southwest Highway was added to the original delineationbased on contour data and aerials. Nine subbasins were delineated for the <strong>Cal</strong>umet-<strong>Sag</strong>Tributary B tributary area, with an average subbasin area <strong>of</strong> 80 acres.Hydrologic Parameter <strong>Cal</strong>culations. CNs were estimated for each subbasin based upon NRCSsoil data and 2001 CMAP land use data. This method is further described in Section 1.3.2,with lookup values for specific combinations <strong>of</strong> land use and soil data presented in AppendixC. An area-weighted average <strong>of</strong> the CN was generated for each subbasin.3-26
3. TRIBUTARY CHARACTERISTICS AND ANALYSISThe lag time, used to convert excess precipitation into a run<strong>of</strong>f hydrograph, was assumed tobe 0.6 times the time <strong>of</strong> concentration for all subbasins. The time <strong>of</strong> concentration, or time <strong>of</strong>travel from the hydrologically most distant part <strong>of</strong> the subbasin, was estimated by usingstandard procedures assuming a length <strong>of</strong> sheet flow, shallow concentrated flow, and channelflow. In some instances, modification to parameter estimates was necessary to more accuratelycharacterize very flat or heavily sewered subwatersheds. Appendix G provides asummary <strong>of</strong> the hydrologic parameters used for subbasins in each subwatershed.TABLE 3.6.3Community Response Data for <strong>Cal</strong>umet-<strong>Sag</strong> Tributary BProblemIDMunicipalityProblems asReported byLocal Agency Location Problem DescriptionLocal/RegionalResolutionin <strong>DWP</strong>PP3 Palos Park Overbankflooding,basementflooding, stormsewer capacity,bank erosion119th St.and TimberLn.Floodwaters exceedcapacity <strong>of</strong> box culvertunder 119th St.RegionalProposed alternativeCSTB-3 addressesfloodingin this area.PP4 Palos Park Overbankflooding,basementflooding, stormsewer capacity,bank erosionSW Hwybetween S.WoodlandTrail and121st St.Diversion from MillCreek is conveyedalong RR Row. Thisflow leaves RRROW and spills intoSW Hwy at this location.Closes SWHwy, and floodingseveral homesalong RR ROW.RegionalField assessmentidentified nostructural damagesassociatedwith bank erosion.ProjectMICR-4 will reduceflow to therailroad ditchfrom MICR to thisarea.PP7 Palos Park Overbankflooding, stormsewer capacity,bank erosion127th St. and86th Ave.Mill Creek diverts toRR ROW ditch atthis location. Insufficientcapacity toconvey water under86th Avenue resultsin flooding <strong>of</strong> SWHwy.RegionalProject MICR-4addresses thisproblem.PP9 Palos Park PavementfloodingRoute 7 at123rd St.IDOT reportedpavement flooding.LocalProblem not locatedon a regionalwaterway.This is a localproblem.Flow Diversions. There is a flow diversion located southwest <strong>of</strong> the intersection <strong>of</strong> 86th Avenueand 127th Street that can result in stormwater from the Mill Creek subwatershed overtoppingthe subwatershed divide and flowing into the <strong>Cal</strong>umet-<strong>Sag</strong> Tributary Bsubwatershed under some conditions. A railway ditch intersects what was once a naturaldrainage divide between the Mill Creek and <strong>Cal</strong>umet-<strong>Sag</strong> Tributary B subwatersheds at thislocation. When water surface elevations in Mill Creek reach an elevation <strong>of</strong> approximately667 feet NAVD 88, Mill Creek overflows into the railroad ditch, which flows to <strong>Cal</strong>umet-<strong>Sag</strong>3-27
CALUMET-SAG DETAILED WATERSHED PLANTributary B. The overflow hydrograph generated in the Mill Creek hydraulic model wasused as input to <strong>Cal</strong>umet-<strong>Sag</strong> Tributary B hydrologic model to properly represent existingconditions. This flow diversion results in an inundation area crossing the subwatershed dividein this location as shown on Figure 3.6.1.3.6.2.2 Hydraulic Model DevelopmentField Data, Investigation, and Existing Model Data. No hydraulic models that met the <strong>District</strong>criteria for use in the <strong>DWP</strong>, as identified in Section 6.3.3.2 <strong>of</strong> the CCSMP, were identified forthe <strong>Cal</strong>umet-<strong>Sag</strong> Tributary B subwatershed. The open channel <strong>of</strong> <strong>Cal</strong>umet-<strong>Sag</strong> Tributary Band all crossings were surveyed to characterize the channel and near overbank geometry.Cross-sectional geometry in the non-surveyed overbank area was obtained from CookCounty topographic data and combined with the surveyed channel cross section. Field visitswere performed to assess channel and overbank roughness characteristics, which werecombined with information from photographs and aerial photography to assign modeledManning’s n roughness coefficients along the modeled stream length.Boundary Conditions. Appendix E contains boundary condition elevations determined for the<strong>Cal</strong>umet-<strong>Sag</strong> Channel based on output from the CWS model. The elevation produced by theCWS model for the 100-year storm at the outlet <strong>of</strong> <strong>Cal</strong>umet-<strong>Sag</strong> Tributary B was 584.83 feetNAVD 88, less than 2 feet above the invert <strong>of</strong> <strong>Cal</strong>umet-<strong>Sag</strong> Tributary B near its confluencewith the <strong>Cal</strong>umet-<strong>Sag</strong> Channel. The shallow depth indicates that the downstream stage on<strong>Cal</strong>umet-<strong>Sag</strong> Tributary B is controlled not by the receiving system but by its own capacity toconvey flow received from its tributary area. Normal depth assuming a friction slope <strong>of</strong> 0.0216was used as a downstream boundary condition for <strong>Cal</strong>umet-<strong>Sag</strong> Tributary B.3.6.2.3 <strong>Cal</strong>ibration and VerificationIn the hours following the August 20, 2007 storm, a high water elevation mark was observedat the downstream side <strong>of</strong> the Autobahn Drive South bridge at the downstream end <strong>of</strong><strong>Cal</strong>umet-<strong>Sag</strong> Tributary B. The rainfall data from ISWS gage 16, which is the rainfall gageclosest to the observed high water elevation, was obtained for this time period. Gage 16 recorded1.2 inches <strong>of</strong> rainfall over a 7-hour period.Table 3.6.4 lists the location and elevation <strong>of</strong> the field-observed water surface elevation andthe peak modeled water surface elevation. The model results are listed for both initial (precalibration)model results and calibrated model results (with the 10 percent reduction appliedto the curve number values). The difference between the observed and calibratedmodel water surface elevations are generally considered to be acceptable due to the margin<strong>of</strong> error associated with high water mark elevation data. High water elevations were takenat a point in time when it is not certain that the peak water elevation occurred.TABLE 3.6.4Comparison <strong>of</strong> Observed and Model Result <strong>Water</strong> Surface Elevations for August 20, 2007 Storm EventLocationObserved High <strong>Water</strong>Surface Elevation (ft)Initial Model Results<strong>Water</strong> Surface Elevation(ft)<strong>Cal</strong>ibrated ModelResults <strong>Water</strong> SurfaceElevation (ft)Autobahn Drive South 598.7 600.89 599.813-28
3. TRIBUTARY CHARACTERISTICS AND ANALYSIS3.6.2.4 Existing Conditions EvaluationFlood Inundation Areas. Flood inundation areas were developed based on HEC-RAS watersurface elevations and Cook County topographic data. Figure 3.6.1 shows inundation areasproduced by the <strong>DWP</strong>’s hydraulic model for the 100-year, 12-hour duration design storm.Hydraulic Pr<strong>of</strong>iles. Appendix H contains hydraulic pr<strong>of</strong>iles <strong>of</strong> existing conditions in the<strong>Cal</strong>umet-<strong>Sag</strong> Tributary B system. Pr<strong>of</strong>iles are shown for the 2-, 5-, 10-, 25-, 50-, 100-, and 500-year recurrence interval design storms.3.6.3 Development and Evaluation <strong>of</strong> Alternatives3.6.3.1 Problem DefinitionHydraulic model results were reviewed with inundation mapping to identify locationswhere property damage due to flooding is predicted. Table 3.6.5 provides a summary <strong>of</strong> majorproblem areas identified through modeling <strong>of</strong> <strong>Cal</strong>umet-<strong>Sag</strong> Tributary B.TABLE 3.6.5Modeled Problem Definition for <strong>Cal</strong>umet-<strong>Sag</strong> Tributary BProblemIDLocationRecurrence Interval<strong>of</strong> Flooding (yr)AssociatedForm BResolution in <strong>DWP</strong>MPA1MPA2Area southeast <strong>of</strong>culvert, at 119thStreet and TimberLaneArea east <strong>of</strong> tributarynear Autobahn DriveSouth crossing25, 50, 100, 500 PP-3 Proposed alternative CSTB-3 addressesflooding in this area.25, 50, 100, 500 Sufficient land was not available inthe area for potential capital projectsthat could address problem.Such properties are candidates forprotection using nonstructural floodcontrol measures, such as floodpro<strong>of</strong>ingor acquisition.MPA3Area upstream <strong>of</strong>Timber Lane near121st Street andSouthwest Hwy2, 5, 10, 25, 50, 100,500PP-4Field assessment identified nostructural damages associated withbank erosion. Project MICR-4 willreduce flow to the railroad ditchfrom MICR to this area.3.6.3.2 Damage AssessmentDamages due to flooding were calculated for <strong>Cal</strong>umet-<strong>Sag</strong> Tributary B in accordance with themethodology described in Section 1.4.2 and are listed in Table 3.6.6.3-29
CALUMET-SAG DETAILED WATERSHED PLAN3.6.3.3 Technology ScreeningFlood control technologies were screenedto identify those most appropriate to addressthe flooding problems in <strong>Cal</strong>umet-<strong>Sag</strong> Tributary B. Storage and increasedconveyance were the two primary alternativesconsidered. Levees were not consideredbecause <strong>of</strong> proximity <strong>of</strong>structures to the channel.3.6.3.4 Alternative DevelopmentTABLE 3.6.6Estimated Damages for <strong>Cal</strong>umet-<strong>Sag</strong> Tributary BDamageCategoryEstimatedDamage ($)Property 886,700Erosion 0Flood Control Alternatives. Alternative solutionsfor regional flooding were developed and evaluated consistent with the methodologydescribed in Section 1.4 <strong>of</strong> this report. Table 3.6.7 summarizes the flood control alternativesdeveloped for <strong>Cal</strong>umet-<strong>Sag</strong> Tributary B. Potential stormwater detention basin sitesunder Alternatives CSTB-2, CSTB-3, and CSTB-5 require buyouts <strong>of</strong> developed and undevelopedresidential properties that are within inundation areas for the site <strong>of</strong> the proposedalternatives.NoteTransportation 133,000 Assumed as 15% <strong>of</strong>property damage dueto floodingRecreation 0Stormwater detention alternatives were modeled for <strong>Cal</strong>umet-<strong>Sag</strong> Tributary B with the goal <strong>of</strong>reducing flood damages upstream <strong>of</strong> 119th Street. Sufficient land was not found to be availablefor detention alternatives that would address the flooding downstream <strong>of</strong> 119th Street.TABLE 3.6.7Flood Control Alternatives for <strong>Cal</strong>umet-<strong>Sag</strong> Tributary BAlternative Number Location DescriptionCSTB-1CSTB-2CSTB-3CSTB-4CSTB-5<strong>Cal</strong>umet-<strong>Sag</strong> Tributary Bdownstream <strong>of</strong> Timber Ln.<strong>Cal</strong>umet-<strong>Sag</strong> Tributary Bupstream <strong>of</strong> Timber Ln.<strong>Cal</strong>umet-<strong>Sag</strong> Tributary Bbetween Southwest Hwyand 119th St.119th St. and <strong>Cal</strong>umet-<strong>Sag</strong> Tributary BTimber Ln. and <strong>Cal</strong>umet-<strong>Sag</strong> Tributary BConstruct 3 ac-ft stormwater detention basinConstruct 2.1 ac-ft stormwater detention basin. This alternativedid not effectively reduce water surface elevationsin the flooding problem area, thus benefits and costs werenot developed.Construct two detention basins for a total <strong>of</strong> 10 ac-ft <strong>of</strong>storage; expand one existing detention basin, and increaseconveyance capacity <strong>of</strong> two culvert crossingsEnlarge culvert size. This alternative caused increaseddownstream water surface elevations, thus benefits andcosts were not developed.Total <strong>of</strong> 14 ac-ft <strong>of</strong> detention basins both upstream anddownstream <strong>of</strong> Timber Lane. This alternative did not effectivelyreduce water surface elevations in the flooding problemarea to any greater extent than CSTB-3, thus benefitsand costs were not developed.Erosion Control Alternatives. No erosion alternatives have been developed for <strong>Cal</strong>umet-<strong>Sag</strong>Tributary B. An erosion problem was reported as PP4, but since it does not threaten anystructures, it does not have any damages.3-30
3. TRIBUTARY CHARACTERISTICS AND ANALYSIS3.6.3.5 Alternative Evaluation and SelectionAlternatives included in Table 3.6.7 were evaluated to determine their effectiveness andproduce data required for the countywide prioritization <strong>of</strong> watershed projects. Flood controlalternatives were modeled to evaluate their impact on water elevations and flood damages.Modeling analysis concluded that CSTB-2 did not effectively lower water surface elevations,primarily because it is located too far upstream <strong>of</strong> problem areas. CSTB-4 caused downstreamwater surface elevations to increase. CSTB-5 did not lower water surface elevationssignificantly more than CSTB-3.For these reasons, benefits and costs were calculated only for Alternatives CSTB-1 andCSTB-3. Alternative CSTB-3 was most effective in lowering flood depths and damages. Table3.6.9 provides a summary <strong>of</strong> B/C ratio, net benefits, total project costs, number <strong>of</strong> structuresprotected, and other relevant alternative data. Alternatives that did not produce asignificant change in inundation areas are not listed as benefits were negligible, and thuscosts were not calculated for these alternatives.A number <strong>of</strong> properties are at risk <strong>of</strong> shallow flooding during the 100-year flood event underexisting conditions or recommended alternative conditions. In addition, due to their locations,other properties' risk <strong>of</strong> flooding cannot be feasibly mitigated by structuralmeasures. Such properties are candidates for protection using nonstructural flood controlmeasures, such as flood-pro<strong>of</strong>ing or acquisition. These measures may be considered to addressdamages that are not fully addressed by capital projects recommended in the <strong>Cal</strong>umet-<strong>Sag</strong>Channel <strong>DWP</strong>.Recommended alternatives result in reduced stage and/or flow along the modeled waterway.Table 3.6.8 provides a comparison <strong>of</strong> the modeled maximum WSEL, and modeled flowat the time <strong>of</strong> peak at representative locations along the waterway.TABLE 3.6.8<strong>Cal</strong>umet-<strong>Sag</strong> Tributary B Existing and Alternative Condition Flow and WSEL ComparisonExisting ConditionsCSTB-3LocationStationMaxWSEL (ft)Max Flow(cfs)MaxWSEL (ft)Max Flow(cfs)40-ft upstream <strong>of</strong> Timber Ln. 4086 619.56 172.89 619.50 160.70100-ft upstream <strong>of</strong> 119th St. 2858 614.34 278.56 612.91 279.36150-ft downstream <strong>of</strong> <strong>Cal</strong>umet-<strong>Sag</strong> Rd. 1803 609.03 406.10 609.03 405.95Confluence with <strong>Cal</strong>umet-<strong>Sag</strong> Channel 194 586.60 430.94 586.59 429.593.6.3.6 Data Required for Countywide Prioritization <strong>of</strong> <strong>Water</strong>shed ProjectsAppendix I presents conceptual level cost estimates for the recommended alternatives. Table3.6.9 lists the total estimated cost, benefits, and B/C ratio for each alternative.Table 3.6.9 summarizes the alternatives analyzed. Figure 3.6.2 shows the location <strong>of</strong> recommendedalternative CSTB-3 and a comparison <strong>of</strong> the inundation mapping for existing conditionsand with the recommended alternative CSTB-3.3-31
CALUMET-SAG DETAILED WATERSHED PLANTABLE 3.6.9<strong>Cal</strong>umet-<strong>Sag</strong> Tributary B Project Alternative Matrix to Support <strong>District</strong> CIP PrioritizationProjectDescriptionB/CRatioNet Benefits($)Total ProjectCost ($)CumulativeStructuresProtectedFundingPossibilities<strong>Water</strong>QualityBenefitRecommendedCommunitiesInvolvedCSTB-1Construct a detention basin justDS <strong>of</strong> Timber Ln.0.03 18,100 649,100 1 SlightlyPositiveNoPalos ParkCSTB-3Add 10 ac-ft <strong>of</strong> additional detentionand increase conveyance0.31 669,700 2,131,500 6 SlightlyPositiveYesPalos ParkNote: Net Benefits values do not include local benefits or non-economic benefits.3-32
3. TRIBUTARY CHARACTERISTICS AND ANALYSIS3.7 <strong>Cal</strong>umet-<strong>Sag</strong> Tributary CThe <strong>Cal</strong>umet-<strong>Sag</strong> Tributary C is located in southwesternCook County, south <strong>of</strong> the <strong>Cal</strong>umet-<strong>Sag</strong>Channel and in the eastern part <strong>of</strong> the <strong>Cal</strong>umet-<strong>Sag</strong> Channel <strong>Water</strong>shed. Table 3.7.1 lists the areas<strong>of</strong> communities draining to the subwatershed. Thedrainage area is 3.35-square-miles. <strong>Cal</strong>umet-<strong>Sag</strong>Tributary C is a natural open-channel stream untilit reaches the Midlothian Turnpike, where it entersa storm sewer system that conveys flow alongCicero Avenue and discharges into the <strong>Cal</strong>umet-<strong>Sag</strong> Channel. Table 3.7.2 lists the land use breakdownby area within the subwatershed.Figure 3.7.1 is an overview <strong>of</strong> the tributary area <strong>of</strong>the subwatershed. It also shows reported stormwaterproblem areas and flood inundation areas,which are discussed in the following subsections.3.7.1 Sources <strong>of</strong> Data3.7.1.1 Previous StudiesNo studies <strong>of</strong> <strong>Cal</strong>umet-<strong>Sag</strong> Tributary C were identifiedfor consideration as a part <strong>of</strong> the <strong>Cal</strong>umet-<strong>Sag</strong> Channel <strong>DWP</strong> development.TABLE 3.7.1Communities Draining to <strong>Cal</strong>umet-<strong>Sag</strong> Tributary CTributary AreaCommunity(mi 2 )Crestwood 1.56Midlothian 0.85Unincorporated/ForestPreserve0.46Oak Forest 0.45Robbins 0.03TABLE 3.7.2Land Use Distribution for <strong>Cal</strong>umet-<strong>Sag</strong> Tributary CAreaLand Use (acres) %Residential 1,035.5 48.3Commercial/Industrial 486.7 22.7Forest/Open Land 471.5 22Institutional 59.6 2.8Agricultural 57.8 2.7Transportation/Utility 30.7 1.43.7.1.2 <strong>Water</strong> Quality DataThe IEPA does not have any sites in the Ambient <strong>Water</strong> Quality Monitoring Network on<strong>Cal</strong>umet-<strong>Sag</strong> Tributary C. No reaches are identified as impaired in the IEPA’s 2008 Integrated<strong>Water</strong> Quality Report, which includes the CWA 303(d) and 305(b) lists. No TMDLshave been established for <strong>Cal</strong>umet-<strong>Sag</strong> Tributary C. According to a USEPA water permitdischarge query, there are no NPDES permits issued by IEPA for discharges to <strong>Cal</strong>umet-<strong>Sag</strong>Tributary C. Municipalities discharging to <strong>Cal</strong>umet-<strong>Sag</strong> Tributary C are regulated by IEPA’sNPDES Phase II Stormwater Permit Program, which was created to improve the water quality<strong>of</strong> stormwater run<strong>of</strong>f from urban areas, and requires that municipalities obtain permitsfor discharging stormwater and implement the six minimum control measures for limitingrun<strong>of</strong>f pollution to receiving systems.3.7.1.3 Wetland and Riparian AreasFigures 2.3.6 and 2.3.7 contain mapping <strong>of</strong> wetland and riparian areas in the <strong>Cal</strong>umet-<strong>Sag</strong>Channel <strong>Water</strong>shed. Wetland areas were identified using NWI mapping. NWI data includesroughly 23.6 acres <strong>of</strong> wetland areas in the <strong>Cal</strong>umet-<strong>Sag</strong> Tributary C subwatershed. Riparianareas are defined as vegetated areas between aquatic and upland ecosystems adjacent to a waterwayor body <strong>of</strong> water that provides flood management, habitat, and water quality enhancement.Identified riparian environments <strong>of</strong>fer potential opportunities for restoration.3-33
CALUMET-SAG DETAILED WATERSHED PLAN3.7.1.4 Floodplain MappingFloodplain areas supporting the NFIP were revised in 2008 as a part <strong>of</strong> FEMA’s Map ModernizationProgram. Floodplain boundaries were revised based upon updated Cook Countytopographic information; however, the effective models, which are used to estimate floodlevels, were generally not updated. LOMRs were incorporated in the revised floodplains.The <strong>Cal</strong>umet-<strong>Sag</strong> Tributary C is mapped in detail in the DFIRM mapping update, with ZoneAE floodplain defined for the length <strong>of</strong> <strong>Cal</strong>umet-<strong>Sag</strong> Tributary C.According to the FIS, the original hydrologic and hydraulic analysis was performed in 1976.The hydrologic modeling was performed using Regression Equations 73 and 75. Hydraulicrouting performed was steady state and used the WSP-2 modeling application.Appendix A includes a comparison <strong>of</strong> FEMA’s effective floodplain mapping from updatedDFIRM panels with inundation areas developed for the <strong>DWP</strong>.3.7.1.5 Stormwater Problem DataCommunities, agencies (e.g., IDOT, CCHD), and stakeholders submitted Form B questionnaireresponse data to the <strong>District</strong> summarizing known stormwater problems within theirjurisdictions. Table 3.7.3 lists problems reported along <strong>Cal</strong>umet-<strong>Sag</strong> Tributary C.TABLE 3.7.3Community Response Data for <strong>Cal</strong>umet-<strong>Sag</strong> Tributary CProblemID Municipality Problems List Location Problem DescriptionLocal/RegionalResolutionin <strong>DWP</strong>BR3BremenTownshipBasement flooding,ponding,water quality,storm sewer capacityLinder Ave. betweenMidlothianPike and143rd St.Natural basin collectsstormwater,flooding yards andhouses and causingseptic system failureLocalProblem not locatedon a regionalwaterway.This is a localproblem.CW1 Crestwood Pavement floodingRoute 50(Cicero Ave.) at135th St.IDOT reportedpavement floodingLocalProblem not locatedon a regionalwaterway.This is a localstorm sewer systemproblem.3.7.1.6 Near-Term Planned Projects<strong>Water</strong>shed communities, agencies, and stakeholders were asked about near-term plannedprojects so that the implementation <strong>of</strong> near-term flood control projects by others is consideredin development <strong>of</strong> the <strong>DWP</strong>. No near-term planned projects by others have been identifiedfor the <strong>Cal</strong>umet-<strong>Sag</strong> Tributary C subwatershed.3.7.2 <strong>Water</strong>shed Analysis3.7.2.1 Hydrologic Model DevelopmentSubbasin Delineation. The <strong>Cal</strong>umet-<strong>Sag</strong> Tributary C area was delineated based upon LiDARtopographic data developed by Cook County in 2003. Twenty-one subbasins were delineatedfor the <strong>Cal</strong>umet-<strong>Sag</strong> Tributary C area, with an average area <strong>of</strong> 102 acres each, and a total3-34
3. TRIBUTARY CHARACTERISTICS AND ANALYSISdrainage area <strong>of</strong> 3.4 square miles. Part <strong>of</strong> the basin is adjacent to the Little <strong>Cal</strong>umet <strong>Water</strong>shed.The <strong>Cal</strong>umet-<strong>Sag</strong> and Little <strong>Cal</strong>umet boundaries were compared, and minor discrepancieswere identified. Discrepancies were resolved through additional review <strong>of</strong> topographicdata, consultation with local communities, and coordination with other watershedplanning consultants.Hydrologic Parameter <strong>Cal</strong>culations. CNs were estimated for each subbasin based upon NRCSsoil data and 2001 CMAP land use data. This method is further described in Section 1.3.2,with lookup values for specific combinations <strong>of</strong> land use and soil data presented in AppendixC. An area-weighted average <strong>of</strong> the CN was generated for each subbasin.The lag time, used to convert excess precipitation into a run<strong>of</strong>f hydrograph, was assumed tobe 0.6 times the time <strong>of</strong> concentration for all subbasins. The time <strong>of</strong> concentration, or time <strong>of</strong>travel from the hydrologically most distant part <strong>of</strong> the subbasin, was estimated by usingstandard procedures assuming a length <strong>of</strong> sheet flow, shallow concentrated flow, and channelflow. In some instances, modification to parameter estimates was necessary to more accuratelycharacterize very flat or heavily sewered subwatersheds. Appendix G provides asummary <strong>of</strong> the hydrologic parameters used for subbasins in each subwatershed.3.7.2.2 Hydraulic Model DevelopmentField Data, Investigation, and Existing Model Data. No hydraulic models that met <strong>District</strong> criteria,as identified in Section 6.3.3.2 <strong>of</strong> the CCSMP, were identified for the <strong>Cal</strong>umet-<strong>Sag</strong>Tributary C subwatershed. The open channel <strong>of</strong> <strong>Cal</strong>umet-<strong>Sag</strong> Tributary C and all crossingswere surveyed to characterize the channel and near overbank geometry. Cross-sectional geometryin the non-surveyed overbank area was obtained from Cook County topographicdata and combined with the surveyed channel cross section. Field visits were performed toassess channel and overbank roughness characteristics, which were combined with informationfrom photographs and aerial photography to assign modeled Manning’s n roughnesscoefficient to the stream.3.7.2.3 Boundary ConditionsThe downstream boundary condition <strong>of</strong> the <strong>Cal</strong>umet-<strong>Sag</strong> Tributary C model is the upstreamend <strong>of</strong> a 42- by 84-inch elliptical pipe that carries flows from the subwatershed to the <strong>Cal</strong>umet-<strong>Sag</strong>Channel. This storm sewer starts at the Midlothian Turnpike and discharges to the<strong>Cal</strong>umet-<strong>Sag</strong> Channel west <strong>of</strong> Cicero Avenue. A rating curve was defined to represent theinflow capacity to this storm sewer.3.7.2.4 <strong>Cal</strong>ibration and VerificationNo measured or observed stages were available for <strong>Cal</strong>umet-<strong>Sag</strong> Tributary C to comparemodel results to support making calibration modifications to the model. Curve numberswere reduced by 10 percent for existing and alternative conditions analysis based upon thecalibration <strong>of</strong> streams with monitoring data as described in Section 1.3.8. The model resultsare consistent with anecdotal reports from local communities that the stormwater detentionbasin at 143rd Street and Linder Avenue frequently overtops.3.7.2.5 Existing Conditions EvaluationFlood Inundation Areas. Figure 3.7.1 shows inundation areas produced by the <strong>DWP</strong>’s hydraulicmodel for the 100-year, 12-hour duration design storm.3-35
CALUMET-SAG DETAILED WATERSHED PLANHydraulic Pr<strong>of</strong>iles. Appendix H contains hydraulic pr<strong>of</strong>iles <strong>of</strong> existing conditions in the<strong>Cal</strong>umet-<strong>Sag</strong> Tributary C system. Pr<strong>of</strong>iles are shown for the 2-, 5-, 10-, 25-, 50-, 100- and500-year recurrence interval design storms.3.7.3 Development and Evaluation <strong>of</strong> Alternatives3.7.3.1 Problem DefinitionTable 3.7.4 summarizes problem areas identified through hydraulic modeling <strong>of</strong> <strong>Cal</strong>umet-<strong>Sag</strong> Tributary C. Though no Form Bs were submitted related to the modeled problem areaslisted in Table 3.7.4, communities did confirm that Problem IDs MPA4 and MPA5 do correspondto known flooding areas.TABLE 3.7.4Modeled Problem Definition for <strong>Cal</strong>umet-<strong>Sag</strong> Tributary CProblemIDLocationRecurrence Interval(yr) <strong>of</strong> FloodingAssociatedForm BResolution in <strong>DWP</strong>MPA4Area at 143 rd Street andLinder Avenue50, 100, 500 Sufficient land was not availablein the area for potentialcapital projects that could addressthe problem. Suchproperties are candidates forprotection using nonstructuralflood control measures, suchas flood-pro<strong>of</strong>ing or acquisition.MPA5Area between tributary andLavergne Avenue from143rd Street to MidlothianTurnpike2, 5, 10, 25, 50, 100,500Sufficient land was not availablein the area for potentialcapital projects that could addressthe problem. Suchproperties are candidates forprotection using nonstructuralflood control measures, suchas flood-pro<strong>of</strong>ing or acquisition.3.7.3.2 Damage Assessment TABLE 3.7.5Estimated Damages for <strong>Cal</strong>umet-<strong>Sag</strong> Tributary CEconomic damages were defined followingthe protocol defined in Chapter 6.6 <strong>of</strong>Damage EstimatedCategory Damage ($)Notethe CCSMP. No erosion or recreationdamages due to flooding were identified Property 464,500for <strong>Cal</strong>umet-<strong>Sag</strong> Tributary C. TransportationErosion 0damages were estimated as 15 per-Transportation 69,700 Assumed as 15% <strong>of</strong>cent <strong>of</strong> property damages. Table 3.7.5 listsproperty damage due tothe damage assessment for existing conditions.flooding3.7.3.3 Technology ScreeningFlood control technologies were screened to identify those most appropriate for addressingthe flooding problems in <strong>Cal</strong>umet-<strong>Sag</strong> Tributary C. Increased conveyance or storage was3-36
3. TRIBUTARY CHARACTERISTICS AND ANALYSISidentified as the principal technologies applicable for addressing stormwater problems in<strong>Cal</strong>umet-<strong>Sag</strong> Tributary C.3.7.3.4 Alternative DevelopmentFlood Control Alternatives. Alternative solutions to regional flooding problems were developedand evaluated consistent with the methodology described in Section 1.4 <strong>of</strong> this report.Table 3.7.6 summarizes flood control alternatives developed for <strong>Cal</strong>umet-<strong>Sag</strong> Tributary C.Local communities suggested several potential locations for detention facilities for flooddamage reduction alternatives. These included Cook County Forest Preserve propertyonline with <strong>Cal</strong>umet-<strong>Sag</strong> Tributary C just upstream <strong>of</strong> Central Avenue, and a floodplainarea with homes just north <strong>of</strong> 143rd Street at Linder Avenue. WPC participants suggestedthat the Central Avenue storm sewer system that discharges to <strong>Cal</strong>umet-<strong>Sag</strong> Tributary Cmay be contributing to high flows. Therefore, the sewer was routed to the proposed pondupstream <strong>of</strong> Central Avenue in the alternatives analysis.Alternative CSTC-1 is an in-line pond at the headwaters <strong>of</strong> the tributary providing approximately37 ac-ft <strong>of</strong> detention. A moderate amount <strong>of</strong> excavation is needed to constructthe stormwater detention facility. The storm sewer along Central Avenue from 147th Streetwill be diverted across Central Avenue to the proposed facility, since it has been identifiedas a source <strong>of</strong> flooding. Alternatives CSTC-2 and CSTC-3 are conveyance improvement alternativesthat reduce hydraulic restrictions.TABLE 3.7.6Flood Control Alternatives for <strong>Cal</strong>umet-<strong>Sag</strong> Tributary CAlternativeNumber Location DescriptionCSTC-1CSTC-1bCSTC-2CSTC-3West <strong>of</strong> CentralAvenueWest <strong>of</strong> CentralAvenueLinder Avenue and143rd StreetLinder Avenue143rd Street, andMidlothian TurnpikeConstruct a 37 acre-feet detention pond on Cook County Forest Preserveproperty at Central Avenue between 147th Street and Midlothian.Also, the existing Central Avenue storm sewer should be diverted into apond.Construct a 12 acre-feet detention pond on Cook County Forest Preserveproperty at Central Avenue between 147th Street and Midlothian.This alternative did not effectively reduce water surface elevations in theflooding problem area, thus benefits and costs were not developed.Increase dimensions <strong>of</strong> culverts at two road crossings to a 3.5-foot by 6-foot- elliptical pipe at Linder Avenue and two 2.5-foot by 3.75-foot ellipticalpipes at 143rd Street. This alternative did not effectively reduce watersurface elevations in the flooding problem area, thus benefits and costswere not developed.Alternative CSTC-2, plus increase the downstream boundary culvert size(currently 42-inch by 84-inch elliptical pipe) to double current capacity.This alternative did not effectively reduce water surface elevations inthe flooding problem area, thus benefits and costs were not developed.3.7.3.5 Alternative Evaluation and SelectionAlternatives included in Table 3.7.6 were evaluated to determine their effectiveness andproduce data required for the countywide prioritization <strong>of</strong> watershed projects. Flood controlalternatives were modeled to evaluate their impact on water elevations and flood damage3-37
CALUMET-SAG DETAILED WATERSHED PLANreduction. Table 3.7.7 provides a summary <strong>of</strong> B/C ratio, net benefits, total project costs,number <strong>of</strong> structures protected, and other relevant alternative data. Alternatives that didnot produce a significant change in inundation areas are described in this report, but benefitswere negligible and conceptual level costs were not developed for these alternatives.CSTC-1 was evaluated at a size <strong>of</strong> 37 acre-feet, which required excavation incurring significantcost while only reducing damages significantly to two properties, which resulted in alow B/C ratio. CSTC-1b, a variation on CSTC-1, was also considered, in which a controlstructure would restrict flow from the area without significant excavation, relying on about12 acre-feet <strong>of</strong> existing depressional area. This was modeled, and determined to have nobenefit to the affected structures. Model analysis concluded that CSTC-1b, CSTC-2, andCSTC-3 were not effective in reducing flood damages.A number <strong>of</strong> properties are at risk <strong>of</strong> shallow flooding during the 100-year flood event underexisting conditions or recommended alternative conditions. In addition, due to their locations,other properties' risk <strong>of</strong> flooding cannot be feasibly mitigated by structuralmeasures. Such properties are candidates for protection using nonstructural flood controlmeasures, such as flood-pro<strong>of</strong>ing or acquisition. These measures may be considered to addressdamages that are not fully addressed by capital projects recommended in the <strong>Cal</strong>umet-<strong>Sag</strong>Channel <strong>DWP</strong>.3.7.3.6 Data Required for Countywide Prioritization <strong>of</strong> <strong>Water</strong>shed ProjectsTable 3.7.7 lists alternatives evaluated in detail.3-38
3. TRIBUTARY CHARACTERISTICS AND ANALYSISTABLE 3.7.7<strong>Cal</strong>umet-<strong>Sag</strong> Tributary C Project Alternative Matrix to Support <strong>District</strong> CIP PrioritizationProjectDescriptionB/CRatioNet Benefits($)Total ProjectCost ($)CumulativeStructuresProtectedFundingPossibilities<strong>Water</strong> QualityBenefit Recommended Communities InvolvedCSTC-137 ac-ft detentionpond0.05 196,900 4,355,700 8 Positive No Crestwood, MidlothianNote: Net Benefits values do not include local benefits or non-economic benefits.3-39
3. TRIBUTARY CHARACTERISTICS AND ANALYSIS3.8 Castle BowlCastle Bowl is located in southwestern CookCounty, south <strong>of</strong> the I&M Canal, in the westernportion <strong>of</strong> the <strong>Cal</strong>umet-<strong>Sag</strong> Channel <strong>Water</strong>shed.Table 3.8.1 lists the areas <strong>of</strong> communities thatdrain to Castle Bowl. The population density <strong>of</strong>the Castle Bowl subwatershed is relatively highwith a mix <strong>of</strong> suburban development and littleavailable open land. Most <strong>of</strong> the open land withinthe watershed is Cook County Forest Preserveproperty. The drainage area is 1.7-square-miles.The Castle Bowl area, shown in Figure 3.8.1 is tributaryto the Hillview Ditch, which is an openchannelstream until it reaches the School GullyCulvert and then flows through a concrete channelleading to the downtown Village <strong>of</strong> Lemont stormsewer system. The storm sewer system dischargesinto the I&M Canal. Table 3.8.2 lists land use byarea within the Castle Bowl subwatershed.TABLE 3.8.1Communities Draining to Castle BowlCommunity Tributary Area (mi 2 )Lemont 1.5Unincorporated/ ForestPreserveA detailed hydraulic model was not developed forHillview Ditch as only the Village <strong>of</strong> Lemont isAgricultural 13.1 1.2tributary to the open channel portion <strong>of</strong> the ditch. Thus, any potential stormwater problem onthis portion <strong>of</strong> the ditch would be classified as a local problem. Areas entirely drained bystorm sewers such as the downtown Lemont were generally not studied in detail as a part <strong>of</strong>the <strong>Cal</strong>umet-<strong>Sag</strong> Detailed <strong>Water</strong>shed Plan development.3.8.1 Sources <strong>of</strong> Data0.2TABLE 3.8.2Land Use Distribution for Castle BowlAreaLand Use (acres) %Residential 638.2 59Forest/Open Land 244 22.6Institutional 130.9 12.1Commercial/Industrial 37.1 3.4<strong>Water</strong>/Wetland 13.7 1.33.8.1.1 Previous StudiesOne study <strong>of</strong> Castle Bowl was identified for consideration as a component <strong>of</strong> <strong>DWP</strong> development—areport titled Construction and Maintenance <strong>of</strong> Dams: Dam Safety Permit for Castle BowlRetention Facility, prepared for the Village <strong>of</strong> Lemont by Engineering Resource Associates, Inc.(2006). The report includes information on the proposed Castle Bowl retention facility.3.8.1.2 <strong>Water</strong> Quality DataThe IEPA does not have any sites in the Ambient <strong>Water</strong> Quality Monitoring Network onHillview Ditch. No reaches are identified as impaired in the IEPA’s 2008 Integrated <strong>Water</strong>Quality Report, which includes the CWA 303(d) and 305(b) lists. No TMDLs have been establishedfor Hillview Ditch. According to a USEPA water permit discharge query, there are noNPDES permits issued by IEPA for discharges to Hillview Ditch. Municipalities dischargingto Hillview Ditch are regulated by IEPA’s NPDES Phase II Stormwater Permit Program,which was created to improve the water quality <strong>of</strong> stormwater run<strong>of</strong>f from urban areas, andrequires that municipalities obtain permits for discharging stormwater and implement thesix minimum control measures for limiting run<strong>of</strong>f pollution to receiving systems.3-41
CALUMET-SAG DETAILED WATERSHED PLAN3.8.1.3 Wetland and Riparian AreasFigures 2.3.6 and 2.3.7 contain mapping <strong>of</strong> wetland and riparian areas in the <strong>Cal</strong>umet-<strong>Sag</strong>Channel <strong>Water</strong>shed. Wetland areas were identified using National Wetlands Inventory (NWI)mapping. NWI data includes 18.1 acres <strong>of</strong> wetland area in the Castle Bowl subwatershed. Riparianareas are defined as vegetated areas between aquatic and upland ecosystems adjacent toa waterway or body <strong>of</strong> water that provides flood management, habitat, and water quality enhancement.Identified riparian environments <strong>of</strong>fer potential opportunities for restoration.3.8.1.4 Floodplain MappingFlood inundation areas supporting the NFIP were revised in 2008 as a part <strong>of</strong> FEMA’s MapModernization Program. Floodplain boundaries were revised based upon updated CookCounty topographic information; however, the effective models, which are used to estimateflood levels, were generally not updated. LOMRs were incorporated in the revised floodplains.Castle Bowl and Hillview Ditch were not mapped in detail in the DFIRM mappingupdate. According to the FIS, no hydrologic or hydraulic analyses have been performed.3.8.1.5 Stormwater Problem DataCommunities, agencies (e.g., IDOT, CCHD), and stakeholders submitted Form B questionnaireresponse data to the <strong>District</strong> summarizing known stormwater problems within theirjurisdictions. Table 3.8.3 lists reported problems within the Castle Bowl subwatershed.TABLE 3.8.3Community Response Data for Castle BowlProblemIDMunicipalityProblem asReported byLocal AgencyLocationProblemDescriptionLocal/RegionalResolutionin <strong>DWP</strong>LT4LemontTownshipBank erosion,sedimentationStephen St.and North <strong>of</strong>Talcott St.Tree branches anddebris in I&M Canalblock flowRegionalMaintenanceand debris removalrecommended.LE1 Lemont Ponding Cass Streetand LemontStreet,downtownLemontDuring majorstorms, sewer systemin downtownLemont surcharges,flooding basements,and first floors <strong>of</strong>commercial, industrial,and residentialbuildingsLocalProblem notlocated on aregional waterway.This is alocal stormsewer systemproblem.3.8.1.6 Near-Term Planned Projects<strong>Water</strong>shed communities, agencies, and stakeholders were asked about near-term plannedprojects so that the implementation <strong>of</strong> near-term flood control projects by others is consideredin development <strong>of</strong> the <strong>DWP</strong>. No near-term planned projects by others have been identifiedfor the Castle Bowl subwatershed.3-42
3. TRIBUTARY CHARACTERISTICS AND ANALYSIS3.8.2 <strong>Water</strong>shed Analysis3.8.2.1 Hydrologic Model DevelopmentSubbasin Delineation. The Castle Bowl tributary area was delineated based upon LiDAR topographicdata developed by Cook County in 2003. Eleven subbasins were delineated for theCastle Bowl area, with an average subbasin area <strong>of</strong> 107.6 acres and a total drainage area <strong>of</strong>1.85 square miles.Hydrologic Parameter <strong>Cal</strong>culations. CNs were estimated for each subbasin based upon NRCSsoil data and 2001 CMAP land use data. This method is further described in Section 1.3.2,with lookup values for specific combinations <strong>of</strong> land use and soil data presented in AppendixC. An area-weighted average <strong>of</strong> the CN was generated for each subbasin.The lag time, used to convert excess precipitation into a run<strong>of</strong>f hydrograph, was assumed tobe 0.6 times the time <strong>of</strong> concentration for all subbasins. The time <strong>of</strong> concentration, or time <strong>of</strong>travel from the hydrologically most distant part <strong>of</strong> the subbasin, was estimated by usingstandard procedures assuming a length <strong>of</strong> sheet flow, shallow concentrated flow, and channelflow. In some instances, modification to parameter estimates was necessary to more accuratelycharacterize very flat or heavily sewered subwatersheds. Appendix G provides asummary <strong>of</strong> the hydrologic parameters used for subbasins in each subwatershed.3.8.2.2 Hydraulic Model DevelopmentA detailed hydraulic model was not developed for Hillview Ditch as only the Village <strong>of</strong> Lemontis tributary to the open channel portion <strong>of</strong> the ditch. Thus, any potential stormwaterproblem on this portion <strong>of</strong> the ditch would be classified as a local problem. Heavily seweredareas such as the downtown Lemont storm sewer system were generally not studied in detailin the <strong>Cal</strong>umet-<strong>Sag</strong> Detailed <strong>Water</strong>shed Plan.3.8.3 Development and Evaluation <strong>of</strong> AlternativesNo regional problem areas were identified in the Castle Bowl subwatershed, so no alternativeswere developed. The proposed Castle Bowl detention basin was analyzed in terms <strong>of</strong>benefits that it provided to regional problems located on the I&M Canal downstream <strong>of</strong> CastleBowl. It was determined that the implementation <strong>of</strong> the Castle Bowl detention basin producesnegligible benefits to regional problems, as discussed in Section 3.11.3.4.3-43
3. TRIBUTARY CHARACTERISTICS AND ANALYSIS3.9 Crestwood Drainage DitchCrestwood Drainage Ditch is a manmade waterwaylocated in southwestern Cook County, south <strong>of</strong> the<strong>Cal</strong>umet-<strong>Sag</strong> Channel, in the eastern part <strong>of</strong> the<strong>Cal</strong>umet-<strong>Sag</strong> Channel <strong>Water</strong>shed. The 0.9-mile-longstream drains a contributing area <strong>of</strong> 1.3 square miles.Table 3.9.1 summarizes the communities that aretributary to Crestwood Drainage Ditch. Figure 3.9.1provides an overview <strong>of</strong> the tributary area <strong>of</strong> thesubwatershed. Reported stormwater problem areas,and flood inundation areas are also shown and arediscussed in the following subsections.The upstream part <strong>of</strong> the Crestwood Drainage Ditchsubwatershed is principally Cook County ForestPreserve land, with a mixture <strong>of</strong> residential andcommercial/industrial land use north and east <strong>of</strong>Central Avenue. Table 3.9.2 summarizes the landuse distribution for areas draining to CrestwoodDrainage Ditch.3.9.1 Sources <strong>of</strong> Data3.9.1.1 Previous StudiesNo studies <strong>of</strong> Crestwood Drainage Ditch were identifiedfor consideration as a component <strong>of</strong> <strong>DWP</strong> development.TABLE 3.9.1Communities Draining to Crestwood DrainageDitchCommunity Tributary Area (mi 2 )Crestwood 0.76Unincorporated/Forest Preserve0.49TABLE 3.9.2Land Use Distribution for Crestwood DrainageDitchLand Use Area (acres) %Residential 386.2 47.7Forest/OpenLandCommercial/Industrial274.1 33.879.4 9.8Institutional 58.2 7.2Agricultural 8.7 1.1<strong>Water</strong>/Wetland 2.8 0.3Transportation/Utility0.5 0.13.9.1.2 <strong>Water</strong> Quality DataThe IEPA does not have any sites in the Ambient <strong>Water</strong> Quality Monitoring Network onCrestwood Drainage Ditch. No reaches are identified as impaired in the IEPA’s 2008 Integrated<strong>Water</strong> Quality Report, which includes the CWA 303(d) and 305(b) lists. No TMDLshave been established for Crestwood Drainage Ditch. According to a USEPA water permitdischarge query, there are no NPDES permits issued by IEPA for discharges to CrestwoodDrainage Ditch. Municipalities discharging to Crestwood Drainage Ditch are regulated byIEPA’s NPDES Phase II Stormwater Permit Program, which was created to improve the waterquality <strong>of</strong> stormwater run<strong>of</strong>f from urban areas, and requires that municipalities obtainpermits for discharging stormwater and implement the six minimum control measures forlimiting run<strong>of</strong>f pollution to receiving systems.3.9.1.3 Wetland and Riparian AreasFigures 2.3.6 and 2.3.7 contain mapping <strong>of</strong> wetland and riparian areas in the <strong>Cal</strong>umet-<strong>Sag</strong>Channel <strong>Water</strong>shed. Wetland areas were identified using National Wetlands Inventory(NWI) mapping. NWI data includes roughly 9.2 acres <strong>of</strong> wetland areas in the CrestwoodDrainage Ditch subwatershed. Riparian areas are defined as vegetated areas between aquatic3-45
CALUMET-SAG DETAILED WATERSHED PLANand upland ecosystems adjacent to a waterway or body <strong>of</strong> water that provides flood management,habitat, and water quality enhancement. Identified riparian environments <strong>of</strong>fer potentialopportunities for restoration.3.9.1.4 Floodplain MappingFlood inundation areas supporting the NFIP were revised in 2008 as a part <strong>of</strong> FEMA’s MapModernization Program. Floodplain boundaries were revised based upon updated CookCounty topographic information; however, the effective models, which are used to estimateflood levels, were generally not updated. LOMRs were incorporated in the revised floodplains.Crestwood Drainage Ditch is mapped in detail in the DFIRM mapping update, withZone AE floodplain defined for the length <strong>of</strong> Crestwood Drainage Ditch. According to theFIS, the original H&H analysis was performed in 1979. The hydrologic modeling was performedusing regression equations from 1975 and L-PTIII. Hydraulic routing performed wassteady state and used the WSP-2 modeling application.Appendix A includes a comparison <strong>of</strong> FEMA’s effective floodplain mapping from updatedDFIRM panels with inundation areas developed for the <strong>DWP</strong>.3.9.1.5 Stormwater Problem DataCommunities, regional agencies (e.g., IDOT, CCHD), and stakeholders submitted Form Bquestionnaire response data to the <strong>District</strong> summarizing known stormwater problems withintheir jurisdictions. No problems were reported by communities related to the CrestwoodDrainage Ditch.3.9.1.6 Near-Term Planned Projects<strong>Water</strong>shed communities, agencies, and stakeholders were asked about near-term plannedprojects so that the implementation <strong>of</strong> near-term flood control projects by others is consideredin development <strong>of</strong> the <strong>DWP</strong>. No near-term planned projects by others have been identifiedfor the Crestwood Drainage Ditch subwatershed.3.9.2 <strong>Water</strong>shed Analysis3.9.2.1 Hydrologic Model DevelopmentSubbasin Delineation. The Crestwood Drainage Ditch tributary area was delineated basedupon LiDAR topographic data developed by Cook County in 2003. Ten subbasins were delineatedfor the Crestwood Drainage Ditch area, with an average subbasin area <strong>of</strong> 81 acresand a total drainage area <strong>of</strong> 1.27 square miles.Hydrologic Parameter <strong>Cal</strong>culations. CNs were estimated for each subbasin based upon NRCSsoil data and 2001 CMAP land use data. This method is further described in Section 1.3.2,with lookup values for specific combinations <strong>of</strong> land use and soil data presented in AppendixC. An area-weighted average <strong>of</strong> the CN was generated for each subbasin.The lag time, used to convert excess precipitation into a run<strong>of</strong>f hydrograph, was assumed tobe 0.6 times the time <strong>of</strong> concentration for all subbasins. The time <strong>of</strong> concentration, or time <strong>of</strong>travel from the hydrologically most distant part <strong>of</strong> the subbasin, was estimated by usingstandard procedures assuming a length <strong>of</strong> sheet flow, shallow concentrated flow, and chan-3-46
3. TRIBUTARY CHARACTERISTICS AND ANALYSISnel flow. In some instances, modification to parameter estimates was necessary to more accuratelycharacterize very flat or heavily sewered subwatersheds. Appendix G provides asummary <strong>of</strong> the hydrologic parameters used for subbasins in each subwatershed.3.9.2.2 Hydraulic Model DevelopmentField Data, Investigation, and Existing Model Data. No hydraulic models that met <strong>District</strong> criteria,as identified in Section 6.3.3.2 <strong>of</strong> the CCSMP, were available for <strong>DWP</strong> development.The open channel <strong>of</strong> Crestwood Drainage Ditch and all crossings were surveyed to characterizethe channel and near overbank geometry. Cross-sectional geometry in the nonsurveyedoverbank area was obtained from Cook County topographic data and combinedwith the surveyed channel cross section. Field visits were performed to assess channel andoverbank roughness characteristics, which were combined with information from photographsand aerial photography to assign modeled Manning’s n roughness coefficient to thestream.Boundary Conditions. Boundary condition elevations for the <strong>Cal</strong>umet-<strong>Sag</strong> Channel based onoutput from the CWS model are included in Appendix E. The elevation produced by theCWS model for the 100-year storm at the outlet <strong>of</strong> Crestwood Drainage Ditch was 585.10feet NAVD 88, 3 feet above the invert <strong>of</strong> Crestwood Drainage Ditch near its confluence withthe <strong>Cal</strong>umet-<strong>Sag</strong> Channel. This relatively shallow depth indicates that downstream stage onCrestwood Drainage Ditch is controlled, not by the receiving system, but by its own capacityto convey flows received from its tributary area. Normal depth assuming a friction slope<strong>of</strong> 0.002 was used as a downstream boundary condition for the Crestwood Drainage Ditch,which resulted in a WSEL 4.5 feet higher than the CWS model outlet elevation.3.9.2.3 <strong>Cal</strong>ibration and VerificationNo measured or observed stages were available for Crestwood Drainage Ditch to comparemodel results to observed flows or stage. Curve numbers were reduced by 10 percent for existingand alternative conditions analysis based upon the calibration <strong>of</strong> streams with monitoringdata as described in Section 1.3.8.3.9.2.4 Existing Conditions EvaluationFlood Inundation Areas. Figure 3.9.1 shows inundation areas produced by the <strong>DWP</strong>’s hydraulicmodel for the 100-year, 12-hour duration design storm. The existing FEMA floodplainfrom the adjacent Tinley Creek subwatershed extends into the Crestwood DrainageDitch subwatershed as flow from Tinley Creek may reach this area when the subwatersheddivide is overtopped. A berm now exists along Tinley Creek in this area, which hydraulicmodel results have shown to largely prevent floodwaters from Tinley Creek from extendinginto the Crestwood Drainage Ditch subwatershed.Hydraulic Pr<strong>of</strong>iles. Appendix H contains hydraulic pr<strong>of</strong>iles <strong>of</strong> existing conditions in theCrestwood Drainage Ditch system. Pr<strong>of</strong>iles are shown for the 2-, 5-, 10-, 25-, 50-, 100-, and500-year recurrence interval design storms.3-47
CALUMET-SAG DETAILED WATERSHED PLAN3.9.3 Development and Evaluation <strong>of</strong> AlternativesCrestwood Drainage Ditch is predicted to remain in its banks for the 100-year event, withthe exception <strong>of</strong> the detention area at the north end <strong>of</strong> the stream near its confluence withthe <strong>Cal</strong>umet-<strong>Sag</strong> Channel. No modeled problem locations or damages are predicted forCrestwood Drainage Ditch. Therefore, no alternatives were developed for CrestwoodDrainage Ditch.3-48
3. TRIBUTARY CHARACTERISTICS AND ANALYSIS3.10 Crooked CreekCrooked Creek is located in southwestern CookCounty, north <strong>of</strong> the <strong>Cal</strong>umet-<strong>Sag</strong> Channel, in thenorthwestern part <strong>of</strong> the <strong>Cal</strong>umet-<strong>Sag</strong> Channel <strong>Water</strong>shed.Table 3.10.1 summarizes areas <strong>of</strong> communitiesthat drain to Crooked Creek. The populationdensity <strong>of</strong> the Crooked Creek subwatershed is lowwith a relatively small area <strong>of</strong> suburban developmentin the upper tributary area, and the subwatershedhas a significant amount <strong>of</strong> open land withinCook County Forest Preserve property. The drainagearea is 3.5 square miles. Crooked Creek is a naturalopen-channel stream that begins at the Belly DeepSlough, drains through the <strong>Sag</strong>anashkee Slough, anddischarges into the <strong>Cal</strong>umet-<strong>Sag</strong> Channel. Table3.10.2 lists the land use breakdown by area withinthe Crooked Creek subwatershed. Figure 3.10.1 is anoverview <strong>of</strong> the tributary area <strong>of</strong> the subwatershed.Reported stormwater problem areas and flood inundationareas are also shown on the figure, and arediscussed in the following subsections.TABLE 3.10.1Communities Draining to Crooked CreekCommunityUnincorporated/ForestPreserveTributaryArea (mi 2 )3.13Palos Hills 0.32Hickory Hills 0.07TABLE 3.10.2Land Use Distribution for Crooked CreekLand Use Acres %Forest/Open Land 1,979.1 88.7Residential 126.1 5.7<strong>Water</strong>/Wetland 107 4.8Commercial/Industrial 19.1 0.93.10.1 Sources <strong>of</strong> Data3.10.1.1 Previous StudiesNo studies <strong>of</strong> Crooked Creek were identified for consideration as a component <strong>of</strong> <strong>DWP</strong> development.3.10.1.2 <strong>Water</strong> Quality DataThe IEPA does not have any sites in the Ambient <strong>Water</strong> Quality Monitoring Network onCrooked Creek. No reaches are identified as impaired in the IEPA’s 2008 Integrated <strong>Water</strong>Quality Report, which includes the CWA 303(d) and 305(b) lists. Crooked Creek is the maintributary to the <strong>Sag</strong>anashkee Slough, an impaired water body per the IEPA 303(d) Report(ILH-01_RHH). The <strong>Sag</strong>anashkee Slough’s designated use is for fish consumption and isimpaired by suspended solids, nickel, phosphorus, sedimentation, siltation, silver, and polychlorinatedbiphenyls (PCBs). There are no TMDLs established for Crooked Creek or <strong>Sag</strong>anashkeeSlough. According to a USEPA water permit discharge query, there are no NPDESpermits issued by IEPA for discharges to Crooked Creek or <strong>Sag</strong>anashkee Slough. Municipalitiesdischarging to Crooked Creek are regulated by IEPA’s NPDES Phase II StormwaterPermit Program, which was created to improve the water quality <strong>of</strong> stormwater run<strong>of</strong>f fromurban areas, and requires that municipalities obtain permits for discharging stormwater andimplement the six minimum control measures for limiting run<strong>of</strong>f pollution to receiving systems.3-49
CALUMET-SAG DETAILED WATERSHED PLAN3.10.1.3 Wetland and Riparian AreasFigures 2.3.6 and 2.3.7 contain mapping <strong>of</strong> wetland and riparian areas in the <strong>Cal</strong>umet-<strong>Sag</strong>Channel <strong>Water</strong>shed. Wetland areas were identified using National Wetlands Inventory (NWI)mapping. NWI data includes roughly 225.1 acres <strong>of</strong> wetland areas in the Crooked Creek subwatershed.Riparian areas are defined as vegetated areas between aquatic and upland ecosystemsadjacent to a waterway or body <strong>of</strong> water that provides flood management, habitat, andwater quality enhancement. Identified riparian environments <strong>of</strong>fer potential opportunities forrestoration.3.10.1.4 Floodplain MappingFlood inundation areas supporting the NFIP were revised in 2008 as a part <strong>of</strong> FEMA’s MapModernization Program. Floodplain boundaries were revised based upon updated CookCounty topographic information; however, the effective models, which are used to estimateflood levels, were generally not updated. LOMRs were incorporated in the revised floodplains.Crooked Creek is not mapped in detail in the DFIRM mapping update, with ZoneAE floodplain defined for the length <strong>of</strong> Crooked Creek. The DFIRM contains only the BellyDeep Slough and <strong>Sag</strong>anashkee Slough portions <strong>of</strong> the creek, and those sloughs are markedas Unnumbered Zone A.Appendix A includes a comparison <strong>of</strong> FEMA’s effective floodplain mapping from updatedDFIRM panels with inundation areas developed for the <strong>DWP</strong>.3.10.1.5 Stormwater Problem DataCommunities, regional agencies (e.g., IDOT, CCHD), and stakeholders submitted Form Bquestionnaire response data to the <strong>District</strong> summarizing known stormwater problemswithin their jurisdictions. Table 3.10.3 lists reported problems along Crooked Creek.3.10.1.6 Near-Term Planned Projects<strong>Water</strong>shed communities, agencies, and stakeholders were asked about near-term plannedprojects so that the implementation <strong>of</strong> near-term flood control projects by others is consideredin development <strong>of</strong> the <strong>DWP</strong>. No near-term planned projects by others have been identifiedfor the Crooked Creek subwatershed.3.10.2 <strong>Water</strong>shed Analysis3.10.2.1 Hydrologic Model DevelopmentSubbasin Delineation. The Crooked Creek tributary area was delineated based upon LiDARtopographic data developed by Cook County in 2003. Nineteen subbasins were delineatedfor the Crooked Creek area, with an average subbasin area <strong>of</strong> 118.2 acres and a total drainagearea <strong>of</strong> 3.5 square miles.Hydrologic Parameter <strong>Cal</strong>culations. CNs were estimated for each subbasin based upon NRCSsoil data and 2001 CMAP land use data. This method is further described in Section 1.3.2,with lookup values for specific combinations <strong>of</strong> land use and soil data presented in AppendixC. An area-weighted average <strong>of</strong> the CN was generated for each subbasin.3-50
3. TRIBUTARY CHARACTERISTICS AND ANALYSISThe lag time, used to convert excess precipitation into a run<strong>of</strong>f hydrograph, was assumed tobe 0.6 times the time <strong>of</strong> concentration for all subbasins. The time <strong>of</strong> concentration, or time <strong>of</strong>travel from the hydrologically most distant part <strong>of</strong> the subbasin, was estimated by usingstandard procedures assuming a length <strong>of</strong> sheet flow, shallow concentrated flow, and channelflow. In some instances, modification to parameter estimates was necessary to more accuratelycharacterize very flat or heavily sewered subwatersheds. Appendix G provides asummary <strong>of</strong> the hydrologic parameters used for subbasins in each subwatershed.TABLE 3.10.3Community Response Data for Crooked CreekProblemIDMunicipalityProblems asReported byLocal Agency Location Problem DescriptionLocal/RegionalResolutionin <strong>DWP</strong>PHI5 Palos Hills Overbankflooding,pondingKean Ave.and Los PalosLn.Flows in Hickory Hillshave no retention,and the Los PalosHills reservoir hasinsufficient capacityto capture largerstorms. Overflowsflood the intersection.In 100-year event.RegionalModel results didnot show propertydamage due t<strong>of</strong>looding in thisarea. Previous observationsmayhave been the result<strong>of</strong> a conditionalready remedied,downstream debrisor maintenanceissue, or a localissue.PT5PalosTownshipPavementfloodingKean Ave.at 100th St.to 111th St.IDOT reports pavementfloodingRegionalModel results didnot confirm roadwayflooding dueto a regional problemin this area.Previous observationsmay havebeen the result <strong>of</strong> acondition alreadyremedied or a localissue.PT6PalosTownshipOverbankflooding, waterquality,wetland riparianU.S. Rte 45at CrookedCreekFlooding overtops thebanks and decreasewater qualityRegionalModel results didnot confirm roadwayflooding dueto a regional problemin this area.Previous observationsmay havebeen the result <strong>of</strong> acondition alreadyremedied or a localissue.3.10.2.2 Hydraulic Model DevelopmentField Data, Investigation, and Existing Model Data. No hydraulic models that met <strong>District</strong> criteria,as identified in Section 6.3.3.2 <strong>of</strong> the CCSMP, were available for <strong>DWP</strong> development.Thirteen structures were surveyed. Since a detailed study was not required, cross-sectionalgeometry was obtained solely from Cook County topographic data. Field visits were per-3-51
CALUMET-SAG DETAILED WATERSHED PLANformed to assess channel and overbank roughness characteristics, which were combinedwith information from photographs and aerial photography to assign modeled Manning’s nroughness coefficient to the stream.Boundary Conditions. Appendix E contains boundary condition elevations for the <strong>Cal</strong>umet-<strong>Sag</strong> Channel based on output from the CWS model. As Crooked Creek flows into the <strong>Sag</strong>anashkeeSlough before reaching the <strong>Cal</strong>umet-<strong>Sag</strong> Channel, the CWS model output watersurface elevation was not used to define the downstream boundary condition in this case.Downstream stage was assumed to be controlled by the capacity <strong>of</strong> Crooked Creek to conveyflows received from its tributary area. A normal depth with a friction slope <strong>of</strong> 0.002 wasevaluated as the downstream boundary condition for Crooked Creek and resulted in aWSEL about 3 feet higher than the normal pool level <strong>of</strong> the <strong>Sag</strong>anashkee Slough.3.10.2.3 <strong>Cal</strong>ibration and VerificationNo measured or observed stages were available for Crooked Creek to compare model resultsto observed flows or stage. Curve numbers were reduced by 10 percent for existingand alternative conditions analysis based upon the calibration <strong>of</strong> streams with monitoringdata as described in Section 1.3.8.3.10.2.4 Existing Conditions EvaluationFlood Inundation Areas. Figure 3.10.1 shows inundation areas produced by the <strong>DWP</strong>’s hydraulicmodel for the 100-year, 12-hour duration design storm.Hydraulic Pr<strong>of</strong>iles. Appendix H contains hydraulic pr<strong>of</strong>iles <strong>of</strong> existing conditions in theCrooked Creek system. Pr<strong>of</strong>iles are shown for the 2-, 5-, 10-, 25-, 50-, 100-, and 500-year recurrenceinterval design storms.3.10.3 Development and Evaluation <strong>of</strong> AlternativesThere were no problem areas identified through hydraulic modeling <strong>of</strong> Crooked Creek, sono alternatives were developed. While three reported problem areas were classified as regionalproblems based on the information reported, hydraulic model results did not confirmexistence <strong>of</strong> these problems. Previous observations may have been the result <strong>of</strong> a conditionalready remedied or a local issue.3-52
3. TRIBUTARY CHARACTERISTICS AND ANALYSIS3.11 Illinois and Michigan CanalThe I&M Canal is located in southwestern CookCounty in the western part <strong>of</strong> the <strong>Cal</strong>umet-<strong>Sag</strong>Channel <strong>Water</strong>shed. The I&M Canal south <strong>of</strong> the<strong>Cal</strong>umet-<strong>Sag</strong> Channel was modeled in detail. TheI&M Canal north <strong>of</strong> the channel was modeled inlimited detail. The part <strong>of</strong> the I&M Canal discussedin this subsection is that south <strong>of</strong> the<strong>Cal</strong>umet-<strong>Sag</strong> Channel. Table 3.11.1 lists the areas<strong>of</strong> communities that drain to the I&M Canal. Thepopulation density <strong>of</strong> the I&M Canal subwatershedis low with a mix <strong>of</strong> suburban developmentand a high amount <strong>of</strong> open land. Most <strong>of</strong> the openland within the watershed is Cook County ForestPreserve Property.TABLE 3.11.1Communities Draining to I&M CanalCommunityTributaryArea (mi 2 )Unincorporated/Forest Preserve 3.21Lemont 3.49TABLE 3.11.2Land Use Distribution for I&M CanalLand Use Acres %Commercial/Industrial 216.3 8.1Forest/Open Land 999.2 37.5Institutional 0.7 0The drainage area is roughly 6.7 square miles. TheI&M Canal is a manmade canal that has been Residential 121.1 4.5dammed and blocked at two locations. It receives Transportation/Utility 773.8 29flow from I&M Tributary A and I&M Tributary<strong>Water</strong>/Wetland 555.5 20.8B & C (also known as Convent Creek) near Lemont,as well as from the Castle Bowl subwatershed(also known as School Gully and Hillview Ditch) in Lemont. It discharges to the CSSCthrough a channel on the International-Matex Tank Terminals (IMTT) industrial property.Table 3.11.2 lists the land use breakdown by area within the I&M Canal subwatershed. Figure3.11.1 provides an overview <strong>of</strong> the tributary area <strong>of</strong> the subwatershed. Reported stormwaterproblem areas and proposed alternative projects are also shown on the figure, and arediscussed in the following subsections.3.11.1 Sources <strong>of</strong> Data3.11.1.1 Previous StudiesChristopher B. Burke Engineering conducted a study detailed in the Flood Mitigation StudiesFinal Report prepared for the Village <strong>of</strong> Lemont (Christopher B. Burke Engineering, 1997).The study recommended increasing the culvert size on a channel on the IMTT propertythrough which the I&M Canal discharges to the CSSC and constructing a new outlet to theCSSC at the KA Steel property in Lemont.3.11.1.2 <strong>Water</strong> Quality DataThe IEPA does not have any sites in the Ambient <strong>Water</strong> Quality Monitoring Network on theI&M Canal. No reaches are identified as impaired in the IEPA’s 2008 Integrated <strong>Water</strong> QualityReport, which includes the CWA 303(d) and 305(b) lists. No TMDLs have been establishedfor the I&M Canal. Table 3.11.3 lists point source NPDES discharge permits identifiedthrough a USEPA water permit discharge query for facilities in the I&M Canal subwatershedarea. IMTT’s permits list the receiving water as the <strong>Cal</strong>umet-<strong>Sag</strong> Channel, but the permitsare included in this list since this particular property is discussed in this section.3-53
CALUMET-SAG DETAILED WATERSHED PLANTABLE 3.11.3Point Source Dischargers in I&M Canal AreaName NPDES Community Receiving <strong>Water</strong>wayIMTT—Lemont IL0005126 Lemont <strong>Cal</strong>umet-<strong>Sag</strong> ChannelIMTT—Lemont SW discharge only IL0061182 Lemont <strong>Cal</strong>umet-<strong>Sag</strong> ChannelKA Steel and Chemicals, Inc. IL0022934 Lemont I&M Canal, CSSCCook Composite and Polymers IL0002399 Lemont I&M CanalNote: NPDES facilities were identified from the USEPA <strong>Water</strong> Discharge Permits Query Form athttp://www.epa.gov/enviro/html/pcs/pcs_query_java.html.Municipalities discharging to the I&M Canal are regulated by IEPA’s NPDES Phase IIStormwater Permit Program, which was created to improve the water quality <strong>of</strong> stormwaterrun<strong>of</strong>f from urban areas, and requires that municipalities obtain permits for dischargingstormwater and implement the six minimum control measures for limiting run<strong>of</strong>f pollutionto receiving systems.3.11.1.3 Wetland and Riparian AreasFigures 2.3.6 and 2.3.7 contain mapping <strong>of</strong> wetland and riparian areas in the <strong>Cal</strong>umet-<strong>Sag</strong>Channel <strong>Water</strong>shed. Wetland areas were identified using National Wetlands Inventory(NWI) mapping. NWI data includes roughly 843 acres <strong>of</strong> wetland areas in the I&M Canalsubwatershed. Riparian areas are defined as vegetated areas between aquatic and uplandecosystems adjacent to a waterway or body <strong>of</strong> water that provides flood management, habitat,and water quality enhancement. Identified riparian environments <strong>of</strong>fer potential opportunitiesfor restoration.3.11.1.4 Floodplain MappingFlood inundation areas supporting the NFIP were revised in 2008 as a part <strong>of</strong> FEMA’s MapModernization Program. Floodplain boundaries were revised based upon updated CookCounty topographic information, but the effective models, which are used to estimate floodlevels, generally were not updated. LOMRs were incorporated in the revised floodplains.I&M Canal is not mapped in detail in the DFIRM mapping update but does have Zone Afloodplain defined for the length <strong>of</strong> I&M Canal. Appendix A includes a comparison <strong>of</strong>FEMA’s effective floodplain mapping from updated DFIRM panels with inundation areas developedfor the <strong>DWP</strong>.3.11.1.5 Stormwater Problem DataCommunities, agencies (e.g., IDOT, CCHD), and stakeholders submitted Form B questionnaireresponse data to the <strong>District</strong> summarizing known stormwater problems within theirjurisdiction. Table 3.11.4 shows reported problems within the I&M Canal subwatershed.3.11.1.6 Near-Term Planned Projects<strong>Water</strong>shed communities, agencies, and stakeholders were asked about near-term plannedprojects so that the implementation <strong>of</strong> near-term flood control projects by others is consideredin development <strong>of</strong> the <strong>DWP</strong>. No near-term planned projects by others have been identifiedfor the I&M Canal subwatershed.3-54
3. TRIBUTARY CHARACTERISTICS AND ANALYSISTABLE 3.11.4Community Response Data for I&M CanalProblemIDMunicipalityProblems asReported byLocal Agency Location Problem DescriptionLocal/RegionalResolution in<strong>DWP</strong>LT4LemontTownshipBank erosion,sedimentationStephenStreet andNorth <strong>of</strong>Talcott St.Tree branches and debrisin I&M Canal block flowRegionalMaintenanceand debris removalrecommended.LT1LemontTownshipPavementfloodingRoute 171(ArcherAve.) betweenCastlewoodand Rte 83IDOT reported pavementflooding.LocalRoadway floodingissue notlocated on aregional waterway.This is alocal problem.LE1 Lemont Ponding Cass St.and LemontSt., downtownLemontDuring major storms, thesewer system in downtownLemont surchargesand overflows, floodingbasements, and first floors<strong>of</strong> buildings and residences.LocalProblem notlocated on aregional waterway.This is alocal stormsewer systemproblem.WS1WillowSpringsOverbankfloodingI&M CanalCrossingRte 171Pavement flooding due tohigh stages in the channel,three known occurrencesLocalProblem notlocated on aregional waterway.This is alocal problem.WS2WillowSpringsOverbankflooding,pondingWillowDrive andArcherRoadChannel draining RenaissanceDevelopment alongMetra tracks near I&MCanal does not drain sufficientlyLocalProblem notlocated on aregional waterway.This is alocal problem.3.11.2 <strong>Water</strong>shed Analysis3.11.2.1 Hydrologic Model DevelopmentSubbasin Delineation. The I&M Canal subwatershed was delineated based upon LiDAR topographicdata developed by Cook County in 2003. Forty-three subbasins, with an averagearea <strong>of</strong> 106 acres, were delineated for the I&M Canal area, which has a total drainage area <strong>of</strong>6.7 square miles.Hydrologic Parameter <strong>Cal</strong>culations. CNs were estimated for each subbasin based upon NRCSsoil data and 2001 CMAP land use data. This method is further described in Section 1.3.2,with lookup values for specific combinations <strong>of</strong> land use and soil data presented in AppendixC. An area-weighted average <strong>of</strong> the CN was generated for each subbasin.The lag time, used to convert excess precipitation into a run<strong>of</strong>f hydrograph, was assumed tobe 0.6 times the time <strong>of</strong> concentration for all subbasins. The time <strong>of</strong> concentration, or time <strong>of</strong>travel from the hydrologically most distant part <strong>of</strong> the subbasin, was estimated by usingstandard procedures assuming a length <strong>of</strong> sheet flow, shallow concentrated flow, and channelflow. In some instances, modification to parameter estimates was necessary to more ac-3-55
CALUMET-SAG DETAILED WATERSHED PLANcurately characterize very flat or heavily sewered subwatersheds. Appendix G provides asummary <strong>of</strong> the hydrologic parameters used for subbasins in each subwatershed.3.11.2.2 Hydraulic Model DevelopmentField Data, Investigation, and Existing Model Data. No hydraulic models that met <strong>District</strong> criteria,as identified in Section 6.3.3.2 <strong>of</strong> the CCSMP, were available for <strong>DWP</strong> development.Because the I&M Canal is dammed and blocked on both its upstream and downstreamends, it functions as a level-pool reservoir that is appropriately modeled as such within thehydrologic model. No hydraulic models were required to analyze flooding <strong>of</strong> the KA Steeland IMTT properties located near the I&M Canal since water surface elevations were producedthrough hydrologic modeling.Boundary Conditions. Boundary condition elevations for the <strong>Cal</strong>umet-<strong>Sag</strong> Channel based onoutput from the CWS model are included in Appendix E. The elevation produced by theCWS model for the 100-year storm at the outlet <strong>of</strong> I&M Canal was 583.92 feet NAVD 88.3.11.2.3 <strong>Cal</strong>ibration and VerificationNo measured or observed stages were available for the I&M Canal to compare model resultsto observed flows or stage. Curve numbers were reduced by 10 percent for existing and alternativeconditions analysis based upon the calibration <strong>of</strong> streams with monitoring data asdescribed in Section 1.3.8.3.11.2.4 Existing Conditions EvaluationFlood Inundation Areas. Figure 3.11.1 shows inundation areas produced for the 100-year, 12-hour duration storm.Hydraulic Pr<strong>of</strong>iles. Hydraulic pr<strong>of</strong>iles were not produced as hydraulic modeling was not performed.3.11.3 Development and Evaluation <strong>of</strong> Alternatives3.11.3.1 Problem DefinitionHydraulic model results were reviewed with inundation mapping to identify locationswhere property damage due to flooding is predicted. Table 3.11.5 summarizes problem areasidentified through hydrologic modeling <strong>of</strong> the I&M Canal.TABLE 3.11.5Modeled Problem Definition for the I&M CanalProblemIDLocationRecurrence Interval(yr) <strong>of</strong> FloodingAssociatedForm BResolution in <strong>DWP</strong>MPA47MPA48KA Steel and Chemicals,15185 Main Street, LemontIMTT, 13589 Main Street,Lemont25, 50, 100 Project IMCA-1 addressesthis flooding.100 Project IMCA-1 addressesthis flooding.3-56
3. TRIBUTARY CHARACTERISTICS AND ANALYSIS3.11.3.2 Damage AssessmentTABLE 3.11.6Estimated Damages for the I & M CanalDamageCategoryProperty 30,400Erosion 0EstimatedDamage($) NoteTransportation 4,600 Assumed as 15% <strong>of</strong> propertydamage due to floodingDamages were defined following theprotocol established in Chapter 6.6 <strong>of</strong>the CCSMP. <strong>Water</strong> surface elevationsproduced by the hydrologic model forthe level-pool reservoir that representedthe I&M Canal were used to definedamages. No erosion damages orrecreation damages due to floodingwere identified for the I&M Canal.Transportation damages were estimatedas 15 percent <strong>of</strong> property damages. Although no Form B was submitted, WPC participantsdid confirm the existence <strong>of</strong> problems at the KA Steel and IMTT sites (Problem IDsMPA47 and MPA48). Estimated Damages for the I&M Canal are listed in Table 3.11.6.3.11.3.3 Technology ScreeningFlood control technologies were screened to identify those most appropriate for addressingthe flooding problems in the I&M Canal. Increased conveyance or storage was identified asthe principal technologies applicable for addressing stormwater problems in the I&M Canal.3.11.3.4 Alternative DevelopmentFlood Control Alternatives. Alternative solutions to regional flooding problems were developedand evaluated consistent with the methodology described in Section 1.4. Table 3.11.7summarizes flood control alternatives developed for the I&M Canal. Based on communityfeedback, alternatives developed for the I&M Canal were taken from two previous studies:Flood Mitigation Studies Final Report by Christopher B. Burke Engineering, Ltd. and Constructionand Maintenance <strong>of</strong> Dams: Dam Safety Permit for Castle Bowl Retention Facility by EngineeringResource Associates.TABLE 3.11.7Flood Control Alternatives for I&M CanalAlternative Location DescriptionIMCA-1IMTT and KASteel sitesConstruct new outlet channel at KA Steel site, and replace two 48-inch culvertsat IMTT site with three 5- by 10-foot box culverts.IMCA-2 Castle Bowl Construct 18 acre-foot Castle Bowl detention basin. This alternative did noteffectively reduce water surface elevations in the flooding problem area, thusbenefits and costs were not developed.3.11.3.5 Alternative Evaluation and SelectionAlternatives included in Table 3.11.7 were evaluated to determine their effectiveness andproduce data required for the countywide prioritization <strong>of</strong> watershed projects. Flood controlalternatives were modeled to evaluate their impact on water elevations and flood damages.Recommended alternative IMCA-1 results in reduced stage <strong>of</strong> the I&M Canal sufficient toaddress all existing conditions damages due to flooding. Table 3.11.8 provides a comparison<strong>of</strong> the modeled maximum WSEL, and modeled flow at the time <strong>of</strong> peak on the I&M Canal.3-57
CALUMET-SAG DETAILED WATERSHED PLANTABLE 3.11.8I&M Canal Existing and Alternative Condition Flow and WSEL ComparisonExisting ConditionsIMCA-1Location100 YrWSEL (ft)Max Flow(cfs)100 YrWSEL (ft)Max Flow(cfs)I&M Canal 584.5 2203 581.6 2155Table 3.11.9 provides a summary B/C ratio, net benefits, total project costs, number <strong>of</strong> structuresprotected, and other relevant alternative data. Analysis showed that IMCA-2 did notreduce existing conditions damages, thus this alternative does not appear in Table 3.11.9.3.11.3.6 Data Required for Countywide Prioritization <strong>of</strong> <strong>Water</strong>shed ProjectsAppendix I presents conceptual level cost estimates for the recommended alternative. Table3.11.9 lists the alternative analyzed in detail. The recommended alternative, IMCA-1, consists<strong>of</strong> construction <strong>of</strong> a new outlet channel at the KA Steel site and replacement <strong>of</strong> the two48-inch culverts at the IMTT site with three 5- by 10-foot box culverts. Figure 3.11.2 showsthe location <strong>of</strong> recommended alternative IMCA-1 and a comparison <strong>of</strong> the inundation mappingfor existing conditions and with the recommended alternative IMCA-1.TABLE 3.11.9I&M Canal Project Alternative Matrix to Support <strong>District</strong> CIP PrioritizationProjectDescriptionB/CRatioNetBenefits($)Total ProjectCost ($)CumulativeStructuresProtected<strong>Water</strong>QualityBenefitRecommendedInvolvedCommunityIMCA-1Constructnew outlets0.03 34,700 1,043,800 3 No ImpactYesLemontNote: Net Benefits values do not include local benefits or non-economic benefits.3-58
3. TRIBUTARY CHARACTERISTICS AND ANALYSIS3.12 Illinois and Michigan Canal Tributary AThe I&M Canal Tributary A is located in southwesternCook County, south <strong>of</strong> the <strong>Cal</strong>umet-<strong>Sag</strong>Channel, in the western part <strong>of</strong> the <strong>Cal</strong>umet-<strong>Sag</strong>Channel <strong>Water</strong>shed. Table 3.12.1 summarizesthe areas <strong>of</strong> communities that drain to I&MTributary A. The I&M Tributary A subwatershedcontains a mix <strong>of</strong> suburban developmentand some available open land. The drainagearea is 0.95 square miles. I&M Tributary A is anatural open-channel stream that drains into theI&M Canal in Lemont. Table 3.12.2 lists the landuse breakdown by area within the I&M TributaryA subwatershed. Figure 3.12.1 provides anoverview <strong>of</strong> the tributary area <strong>of</strong> the subwatershed.Reported stormwater problem areas andflood inundation areas are also shown on thefigure, and are discussed in the following subsections.3.12.1 Sources <strong>of</strong> DataTABLE 3.12.1Communities Draining to I&M Tributary ACommunity Tributary Area (mi 2 )Lemont 0.9Unincorporated/ForestPreserve0.05TABLE 3.12.2Land Use Distribution for I&M Tributary ALand Use Acres %Residential 373.4 61.1Forest/open land 118.3 19.3Commercial/industrial 60.3 9.9Institutional 39.4 6.4Agricultural 15.5 2.5Transportation/utility 4.6 0.73.12.1.1 Previous StudiesChristopher B. Burke Engineering conducted a study for the Village <strong>of</strong> Lemont (ChristopherB. Burke Engineering, 1997). The study recommended increasing the Main Street, New Avenue,and railroad crossings <strong>of</strong> I&M Tributary A to 8-foot-high by 12-foot-wide culverts. Becausethese are the sizes <strong>of</strong> the culverts at Main Street and the railroad crossing, and theculverts appear to have been constructed recently, it is believed that the recommendationsfor these two culverts from this study were implemented. The New Avenue structure consists<strong>of</strong> a 6- by 10-foot box culvert and a 5- by 8-foot box culvert.3.12.1.2 <strong>Water</strong> Quality DataThe IEPA does not have any sites in the Ambient <strong>Water</strong> Quality Monitoring Network on I&MTributary A. No reaches are identified as impaired in the IEPA’s 2008 Integrated <strong>Water</strong> QualityReport, which includes the CWA 303(d) and 305(b) lists. No TMDLs have been establishedfor I&M Tributary A. According to a USEPA water permit discharge query, there are noNPDES permits issued by IEPA for discharges to I&M Tributary A. Municipalities dischargingto I&M Tributary A are regulated by IEPA’s NPDES Phase II Stormwater Permit Program,which was created to improve the water quality <strong>of</strong> stormwater run<strong>of</strong>f from urban areas, andrequires that municipalities obtain permits for discharging stormwater and implement the sixminimum control measures for limiting run<strong>of</strong>f pollution to receiving systems.3.12.1.3 Wetland and Riparian AreasFigures 2.3.6 and 2.3.7 contain mapping <strong>of</strong> wetland and riparian areas in the <strong>Cal</strong>umet-<strong>Sag</strong>Channel <strong>Water</strong>shed. Wetland areas were identified using National Wetlands Inventory3-59
CALUMET-SAG DETAILED WATERSHED PLAN(NWI) mapping. NWI data includes roughly 1.8 acres <strong>of</strong> wetland areas in the I&M TributaryA subwatershed. Riparian areas are defined as vegetated areas between aquatic and uplandecosystems adjacent to a waterway or body <strong>of</strong> water that provides flood management, habitat,and water quality enhancement. Identified riparian environments <strong>of</strong>fer potential opportunitiesfor restoration.3.12.1.4 Floodplain MappingFloodplain areas supporting the NFIP were revised in 2008 as a part <strong>of</strong> FEMA’s Map ModernizationProgram. Floodplain boundaries were revised based upon updated Cook Countytopographic information, but the effective models, which are used to estimate flood levels,generally were not updated. LOMRs were incorporated in the revised floodplains. I&MTributary A is mapped in detail in the DFIRM mapping update, with Zone AE floodplaindefined for the length <strong>of</strong> I&M Tributary A. According to the FIS, the original hydrologic andhydraulic analysis was performed in 1988. The hydrologic modeling was performed usingRegression Equations 73 and 75. Hydraulic routing performed was steady state and usedthe WSP-2 modeling application.Appendix A includes a comparison <strong>of</strong> FEMA’s effective floodplain mapping from updatedDFIRM panels with inundation areas developed for the <strong>DWP</strong>.3.12.1.5 Stormwater Problem DataCommunities, agencies (e.g., IDOT, CCHD), and stakeholders submitted Form B questionnaireresponse data to the <strong>District</strong> summarizing known stormwater problems within theirjurisdictions. No problems were reported along I&M Tributary A.3.12.1.6 Near-Term Planned Projects<strong>Water</strong>shed communities, agencies, and stakeholders were asked about near-term plannedprojects so that the implementation <strong>of</strong> near-term flood control projects by others is consideredin development <strong>of</strong> the <strong>DWP</strong>. No near-term planned projects by others have been identifiedfor the I&M Tributary A subwatershed.3.12.2 <strong>Water</strong>shed Analysis3.12.2.1 Hydrologic Model DevelopmentSubbasin Delineation. The I&M Tributary A tributary area was delineated based upon LiDARtopographic data developed by Cook County in 2003. Eight subbasins were delineated for theI&M Tributary A area, with an average subbasin area <strong>of</strong> 76.5 acres and a total drainage area<strong>of</strong> 0.95 square mile.Hydrologic Parameter <strong>Cal</strong>culations. CNs were estimated for each subbasin based upon NRCSsoil data and 2001 CMAP land use data. This method is further described in Section 1.3.2,with lookup values for specific combinations <strong>of</strong> land use and soil data presented in AppendixC. An area-weighted average <strong>of</strong> the CN was generated for each subbasin.The lag time, used to convert excess precipitation into a run<strong>of</strong>f hydrograph, was assumed tobe 0.6 times the time <strong>of</strong> concentration for all subbasins. The time <strong>of</strong> concentration, or time <strong>of</strong>travel from the hydrologically most distant part <strong>of</strong> the subbasin, was estimated by using3-60
3. TRIBUTARY CHARACTERISTICS AND ANALYSISstandard procedures assuming a length <strong>of</strong> sheet flow, shallow concentrated flow, and channelflow. In some instances, modification to parameter estimates was necessary to more accuratelycharacterize very flat or heavily sewered subwatersheds. Appendix G provides asummary <strong>of</strong> the hydrologic parameters used for subbasins in each subwatershed.3.12.2.2 Hydraulic Model DevelopmentField Data, Investigation, and Existing Model Data. No hydraulic models that met <strong>District</strong> criteria,as identified in Section 6.3.3.2 <strong>of</strong> the CCSMP, were available for <strong>DWP</strong> development. Theopen channel <strong>of</strong> I&M Tributary A and all crossings were surveyed to characterize the channeland near overbank geometry. Cross-sectional geometry in the non-surveyed overbank areawas obtained from Cook County topographic data and combined with the surveyed channelcross section data. Field visits were performed to assess channel and overbank roughnesscharacteristics, which were combined with information from photographs and aerial photographyto assign modeled Manning’s n roughness coefficient to the stream.Boundary Conditions. Boundary condition elevations determined for tributaries to the<strong>Cal</strong>umet-<strong>Sag</strong> Channel based on output from the CWS model are included in Appendix E.The elevation produced by the CWS model for the 100-year storm at the outlet <strong>of</strong> I&MTributary A was 581.32 feet NAVD 88, roughly 2 feet above the invert <strong>of</strong> I&M Tributary Anear its confluence with the <strong>Cal</strong>umet-<strong>Sag</strong> Channel. This shallow depth indicates that downstreamstage on I&M Tributary A is not controlled by the receiving system, but by its owncapacity to convey flows received from its tributary area. Normal depth at the downstreammost cross section <strong>of</strong> the I&M Tributary A hydraulic model assuming a friction slope <strong>of</strong>0.032 was used as a downstream boundary condition for I&M Tributary A.3.12.2.3 <strong>Cal</strong>ibration and VerificationNo measured or observed stages were available for I&M Tributary A to compare model resultsto observed flows or stage. Curve numbers were reduced by 10 percent for existingand alternative conditions analysis based upon the calibration <strong>of</strong> streams with monitoringdata as described in Section 1.3.8.3.12.2.4 Existing Conditions EvaluationFlood Inundation Areas. Figure 3.12.1 shows inundation areas produced by the <strong>DWP</strong>’s hydraulicmodel for the 100-year, 12-hour duration design storm.Hydraulic Pr<strong>of</strong>iles. Appendix H contains hydraulic pr<strong>of</strong>iles <strong>of</strong> existing conditions in the I&MTributary A system. Pr<strong>of</strong>iles are shown for the 2-, 5-, 10-, 25-, 50-, 100-, and 500-year recurrenceinterval design storms.3.12.3 Development and Evaluation <strong>of</strong> AlternativesThere were no regional problem areas reported or identified through hydraulic modeling <strong>of</strong>I&M Tributary A, so no alternatives were developed.3-61
3. TRIBUTARY CHARACTERISTICS AND ANALYSIS3.13 Illinois and Michigan Canal Tributary B and CI&M Tributary B & C is located in southwestern CookCounty, south <strong>of</strong> the <strong>Cal</strong>umet-<strong>Sag</strong> Channel, in thewestern part <strong>of</strong> the <strong>Cal</strong>umet-<strong>Sag</strong> Channel <strong>Water</strong>shed.The areas <strong>of</strong> communities that drain to I&M TributaryB & C are summarized in Table 3.13.1. I&M TributaryB & C is a natural open-channel stream that drainsapproximately a 2.5 square mile area, discharginginto the I&M Canal. The population density <strong>of</strong> theI&M Tributary B & C subwatershed is low with a mix<strong>of</strong> suburban development and a high portion <strong>of</strong> openland. Most <strong>of</strong> the open land within the watershed isCook County Forest Preserve property. Table 3.13.2lists the land use breakdown by area within the I&MTributary B & C subwatershed. Figure 3.13.1 providesan overview <strong>of</strong> the tributary area <strong>of</strong> the subwatershed.Reported stormwater problem areas and floodinundation areas are also shown on the figure, andare discussed in the following subsections.TABLE 3.13.1Communities Draining to I&M Tributary B & CTributary AreaCommunity(mi 2 )Unincorporated/ForestPreserve1.94Lemont 0.6TABLE 3.13.2Land Use Distribution for I&M Tributary B & CLand Use Area (acres) %Forest/Open Land759.2 46.9Residential 442.9 27.3<strong>Water</strong>/Wetland 195.1 12.1Agricultural 176.4 10.93.13.1 Sources <strong>of</strong> Data3.13.1.1 Previous StudiesInstitutional 30 1.9Commercial/Industrial15.8 1No studies <strong>of</strong> I&M Tributary B & C were identified for consideration as a component <strong>of</strong><strong>DWP</strong> development.3.13.1.2 <strong>Water</strong> Quality DataThe IEPA does not have any sites in the Ambient <strong>Water</strong> Quality Monitoring Network onI&M Tributary B & C. There are no reaches identified as impaired in the IEPA’s 2008 Integrated<strong>Water</strong> Quality Report, which includes the CWA 303(d) and 305(b) lists. No TMDLshave been established for I&M Tributary B & C. According to a USEPA water permit dischargequery, there are no NPDES permits issued by IEPA for discharges to I&M TributaryB & C. Municipalities discharging to I&M Tributary B & C are regulated by IEPA’s NPDESPhase II Stormwater Permit Program, which was created to improve the water quality <strong>of</strong>stormwater run<strong>of</strong>f from urban areas, and requires that municipalities obtain permits for dischargingstormwater and implement the six minimum control measures for limiting run<strong>of</strong>fpollution to receiving systems.3.13.1.3 Wetland and Riparian AreasFigures 2.3.6 and 2.3.7 contain mapping <strong>of</strong> wetland and riparian areas in the <strong>Cal</strong>umet-<strong>Sag</strong>Channel <strong>Water</strong>shed. Wetland areas were identified using National Wetlands Inventory(NWI) mapping. NWI data includes roughly 83.5 acres <strong>of</strong> wetland areas in the I&M TributaryB & C subwatershed. Riparian areas are defined as vegetated areas between aquaticand upland ecosystems adjacent to a waterway or body <strong>of</strong> water that provides flood man-3-63
CALUMET-SAG DETAILED WATERSHED PLANagement, habitat, and water quality enhancement. Identified riparian environments <strong>of</strong>ferpotential opportunities for restoration.3.13.1.4 Floodplain MappingFlood inundation areas supporting the NFIP were revised in 2008 as a part <strong>of</strong> FEMA’s MapModernization Program. Floodplain boundaries were revised based upon updated CookCounty topographic information; however, the effective models, which are used to estimateflood levels, were generally not updated. LOMRs were incorporated in the revised floodplains.I&M Tributary B & C is mapped in detail in the DFIRM mapping update, with ZoneAE floodplain defined for the length <strong>of</strong> I&M Tributary B & C. According to the FIS, theoriginal hydrologic and hydraulic analysis was performed in 1988. The hydrologic modelingwas performed using Regression Equations 73 and 75. Hydraulic routing performed wassteady state and used the WSP-2 modeling application.Appendix A includes a comparison <strong>of</strong> FEMA’s effective floodplain mapping from updatedDFIRM panels with inundation areas developed for the <strong>DWP</strong>.3.13.1.5 Stormwater Problem DataCommunities, agencies (e.g., IDOT, CCHD), and stakeholders submitted Form B questionnaireresponse data to the <strong>District</strong> summarizing known stormwater problems within theirjurisdictions. No problems were reported along I&M Tributary B & C.3.13.1.6 Near-Term Planned Projects<strong>Water</strong>shed communities, agencies, and stakeholders were asked about near-term plannedprojects so that the implementation <strong>of</strong> near-term flood control projects by others is consideredin development <strong>of</strong> the <strong>DWP</strong>. No near-term planned projects by others have been identifiedfor the I&M Tributary B & C subwatershed.3.13.2 <strong>Water</strong>shed Analysis3.13.2.1 Hydrologic Model DevelopmentSubbasin Delineation. The I&M Tributary B & C subwatershed was delineated based uponLiDAR topographic data developed by Cook County in 2003. Fourteen subbasins were delineatedfor the I&M Tributary B & C area, with an average subbasin area <strong>of</strong> 116 acres and atotal drainage area <strong>of</strong> 2.5 square miles.Hydrologic Parameter <strong>Cal</strong>culations. CNs were estimated for each subbasin based upon NRCSsoil data and 2001 CMAP land use data. This method is further described in Section 1.3.2,with lookup values for specific combinations <strong>of</strong> land use and soil data presented in AppendixC. An area-weighted average <strong>of</strong> the CN was generated for each subbasin.The lag time, used to convert excess precipitation into a run<strong>of</strong>f hydrograph, was assumed tobe 0.6 times the time <strong>of</strong> concentration for all subbasins. The time <strong>of</strong> concentration, or time <strong>of</strong>travel from the hydrologically most distant part <strong>of</strong> the subbasin, was estimated by usingstandard procedures assuming a length <strong>of</strong> sheet flow, shallow concentrated flow, and channelflow. In some instances, modification to parameter estimates was necessary to more accuratelycharacterize very flat or heavily sewered subwatersheds.3-64
3. TRIBUTARY CHARACTERISTICS AND ANALYSISAppendix G provides a summary <strong>of</strong> the hydrologic parameters used for subbasins in eachsubwatershed.3.13.2.2 Hydraulic Model DevelopmentField Data, Investigation, and Existing Model Data. No hydraulic models that met <strong>District</strong> criteria,as identified in Section 6.3.3.2 <strong>of</strong> the CCSMP, were available for <strong>DWP</strong> development.The open channel <strong>of</strong> I&M Tributary B & C and all crossings were surveyed to characterizethe channel and near overbank geometry. Cross-sectional geometry in the non-surveyedoverbank area was obtained from Cook County topographic data and combined with thesurveyed channel cross section. Field visits were performed to assess channel and overbankroughness characteristics, which were combined with information from photographs andaerial photography to assign modeled Manning’s n roughness coefficient to the stream.Boundary Conditions. Boundary condition elevations for the <strong>Cal</strong>umet-<strong>Sag</strong> Channel based onoutput from the CWS model are included in Appendix E. The elevation produced by theCWS model for the 100-year storm at the outlet <strong>of</strong> I&M Tributary B & C was 582.32 feetNAVD 88, which is about 10 feet below the invert <strong>of</strong> I&M Tributary B & C near its confluencewith the I&M Channel because there is a drop spillway at the outlet <strong>of</strong> the tributary.This negative tailwater situation indicates that downstream stage on I&M Tributary B & C iscontrolled not by the receiving system, but by its own capacity to convey flows receivedfrom its tributary area. Normal depth assuming a friction slope <strong>of</strong> 0.003 was thus used as adownstream boundary condition for I&M Tributary B & C.3.13.2.3 <strong>Cal</strong>ibration and VerificationNo measured or observed stages were available for I&M Tributary B & C to compare model resultsto observed flows or stage. Curve numbers were reduced by 10 percent for existing andalternative conditions analysis based upon the calibration <strong>of</strong> streams with monitoring dataas described in Section 1.3.8.3.13.2.4 Existing Conditions EvaluationFlood Inundation Areas. Figure 3.13.1 shows inundation areas produced by the <strong>DWP</strong>’s hydraulicmodel for the 100-year, 12-hour duration design storm.Hydraulic Pr<strong>of</strong>iles. Appendix H contains hydraulic pr<strong>of</strong>iles <strong>of</strong> existing conditions in the I&MTributary B & C system. Pr<strong>of</strong>iles are shown for the 2-, 5-, 10-, 25-, 50-, 100-, and 500-year recurrenceinterval design storms.3.13.3 Development and Evaluation <strong>of</strong> Alternatives3.13.3.1 Problem DefinitionHydraulic model results were reviewed with inundation mapping to identify locationswhere property damage due to flooding is predicted. Table 3.13.3 summarizes problem areasidentified through hydraulic modeling <strong>of</strong> I&M Tributary B & C.3-65
CALUMET-SAG DETAILED WATERSHED PLANTABLE 3.13.3Modeled Problem Definition for I&M Tributary B & CProblemIDLocationRecurrence Interval(yr) <strong>of</strong> FloodingAssociatedForm BResolution in <strong>DWP</strong>MPA6Area along eastern bank <strong>of</strong> tributaryat downstream end north <strong>of</strong>Main St.25, 50, 100, 500 Risk <strong>of</strong> flooding cannotbe feasibly mitigatedby structuralmeasures. Suchproperties are candidatesfor protectionusing nonstructuralflood control measures,such as floodpro<strong>of</strong>ingor acquisition.3.13.3.2 Damage AssessmentDamages were defined following the protocol established in Chapter 6.6 <strong>of</strong> the CCSMP. Noerosion damages or recreation damages due to flooding were identified for I&M Tributary B& C. Transportation damages were estimatedas 15 percent <strong>of</strong> property damages. TABLE 3.13.4Estimated Damages for I&M Tributary B & C3.13.3.3 Technology ScreeningFlood control technologies were screened toidentify those most appropriate for addressingthe flooding problems in I&M TributaryB & C. Increased conveyance or storage wereidentified as the principal technologies applicablefor addressing stormwater problemsin I&M Tributary B & C.DamageCategoryEstimatedDamage ($)Property 405,900Erosion 0NoteTransportation 60,900 Assumed as 15%<strong>of</strong> property damagedue to flooding3.13.3.4 Alternative DevelopmentFlood Control Alternatives. Alternative solutions to regional flooding problems were developedand evaluated consistent with the methodology described in Section 1.4 <strong>of</strong> this report.Flood control alternatives developed for I&M Tributary B & C were focused towards on-linedetention facilities and channel conveyance improvements and are summarized in Table3.13.5.3.13.3.5 Alternative Evaluation and SelectionAlternatives included in Table 3.13.5 were evaluated to determine their effectiveness andproduce data required for the countywide prioritization <strong>of</strong> watershed projects. Flood controlalternatives were modeled to evaluate their impact on water elevations and flood damages.None <strong>of</strong> the detention or levee alternatives analyzed effectively reduced flood damages.A number <strong>of</strong> properties are at risk <strong>of</strong> shallow flooding during the 100-year flood event underexisting conditions or recommended alternative conditions. In addition, due to their locations,other properties' risk <strong>of</strong> flooding cannot be feasibly mitigated by structural3-66
3. TRIBUTARY CHARACTERISTICS AND ANALYSISTABLE 3.13.5Flood Control Alternatives for I&M Tributary B & CAlternative Location DescriptionIMTBC–1IMTBC–2Along creek from WalkerRoad to Main StreetAlong creek from MainStreet north to railroadOn-line detention facility constructed by excavating the right overbankto create an additional 24 acre-feet <strong>of</strong> storageOn-line detention facility constructed by excavating the right overbankto create an additional 6.9 acre-feet <strong>of</strong> storageIMTBC–3 Along creek near outfall An on-line detention facility added to the Alternative IMTBC-2model constructed by excavating the left overbank to create an additional3.2 acre-feet <strong>of</strong> storageIMTBC–4Along right overbankfrom railroad to outfall <strong>of</strong>creekLevee on the right overbank as well as the southern property line <strong>of</strong>the industrial facility located east <strong>of</strong> the outfall <strong>of</strong> the creek to protectthe site from floodwatermeasures. Such properties are candidates for protection using nonstructural flood controlmeasures, such as flood-pro<strong>of</strong>ing or acquisition. These measures may be considered to addressdamages that are not fully addressed by capital projects recommended in the <strong>Cal</strong>umet-<strong>Sag</strong>Channel <strong>DWP</strong>.3.13.3.6 Data Required for Countywide Prioritization <strong>of</strong> <strong>Water</strong>shed ProjectsNone <strong>of</strong> the alternatives analyzed were effective in reducing flood damages, and therefore,benefits and costs are not presented for these alternatives. No alternatives are recommendedfor I&M Tributary B & C.3-67
3. TRIBUTARY CHARACTERISTICS AND ANALYSIS3.14 Illinois and Michigan Canal Tributary DI&M Tributary D is located in southwestern CookCounty, north <strong>of</strong> the <strong>Cal</strong>umet-<strong>Sag</strong> Channel, in thenorthern part <strong>of</strong> the <strong>Cal</strong>umet-<strong>Sag</strong> Channel <strong>Water</strong>shed.Table 3.14.1 summarizes the areas <strong>of</strong> communitiesthat drain to I&M Canal Tributary D.I&M Tributary D is a natural open-channel streamdraining 0.9 square miles <strong>of</strong> area before discharginginto the I&M Canal. The land-use distributionwithin the subwatershed is a mixture <strong>of</strong> suburbandevelopment and open land, most <strong>of</strong> which isCook County Forest Preserve property. Table3.14.2 lists the land use breakdown by areawithin the I&M Canal subwatershed.Figure 3.14.1 provides an overview <strong>of</strong> the tributaryarea <strong>of</strong> the subwatershed. Reported stormwaterproblem areas and flood inundation areas are alsoshown on the figure, and are discussed in the followingsubsections.TABLE 3.14.1Communities Draining to I&M Tributary DCommunity Tributary Area (mi 2 )Unincorporated/Forest Preserve0.49Hickory Hills 0.22Willow Springs 0.19TABLE 3.14.2Land Use Distribution for I&M Tributary DLand Use Acres %Forest/Open Land 360 62.8Residential 205.1 35.8Commercial/Industrial 8.5 1.5Institutional 0.1 03.14.1 Sources <strong>of</strong> Data3.14.1.1 Previous StudiesNo studies <strong>of</strong> I&M Tributary D were identified for consideration as a component <strong>of</strong> <strong>DWP</strong>development.3.14.1.2 <strong>Water</strong> Quality DataThe IEPA does not have any sites in the Ambient <strong>Water</strong> Quality Monitoring Network onI&M Tributary D. There are no reaches identified as impaired in the IEPA’s 2008 Integrated<strong>Water</strong> Quality Report, which includes the CWA 303(d) and 305(b) lists. No TMDLs have beenestablished for I&M Tributary D. According to a USEPA water permit discharge query,there are no NPDES permits issued by IEPA for discharges to I&M Tributary D. Municipalitiesdischarging to I&M Tributary D are regulated by IEPA’s NPDES Phase II StormwaterPermit Program, which was created to improve the water quality <strong>of</strong> stormwater run<strong>of</strong>f fromurban areas, and requires that municipalities obtain permits for discharging stormwater andimplement the six minimum control measures for limiting run<strong>of</strong>f pollution to receiving systems.3.14.1.3 Wetland and Riparian AreasFigures 2.3.6 and 2.3.7 contain mapping <strong>of</strong> wetland and riparian areas in the <strong>Cal</strong>umet-<strong>Sag</strong>Channel <strong>Water</strong>shed. NWI data includes roughly 24.8 acres <strong>of</strong> wetland areas in the I&MTributary D subwatershed. Riparian areas are defined as vegetated areas between aquatic andupland ecosystems adjacent to a waterway or body <strong>of</strong> water that provides flood management,3-69
CALUMET-SAG DETAILED WATERSHED PLANhabitat, and water quality enhancement. Identified riparian environments <strong>of</strong>fer potential opportunitiesfor restoration.3.14.1.4 Floodplain MappingFlood inundation areas supporting the NFIP were revised in 2008 as a part <strong>of</strong> FEMA’s MapModernization Program. Floodplain boundaries were revised based upon updated CookCounty topographic information; however, the effective models, which are used to estimateflood levels, were generally not updated. LOMRs were incorporated in the revised floodplains.I&M Tributary D is mapped in detail in the DFIRM mapping update, with Zone AEfloodplain defined for the length <strong>of</strong> I&M Tributary D. According to the FIS, the originalH&H analysis was performed in 1979. The hydrologic modeling was performed using RegressionEquation 73. Hydraulic routing performed was steady state and used the WSP-2modeling application.Appendix A includes a comparison <strong>of</strong> FEMA’s effective floodplain mapping from updatedDFIRM panels with inundation areas developed for the <strong>DWP</strong>.3.14.1.5 Stormwater Problem DataCommunities, agencies (e.g., IDOT, CCHD), and stakeholders submitted Form B questionnaireresponse data to the <strong>District</strong> summarizing known stormwater problems within theirjurisdictions. Table 3.14.3 shows reported problems along I&M Tributary D.TABLE 3.14.3Community Response Data for I&M Tributary DProblemIDMunicipalityProblems asReported byLocal Agency Location Problem DescriptionLocal/RegionalResolutionin <strong>DWP</strong>HH5HickoryHillsPonding,storm sewercapacity,maintenance91st Pl.at KeanAve.The storm sewer to theforest preserve is typicallyfull due to a restrictedoutfall in theforest preserve, andduring rainfall events,the catch basin pondsback up to a propertyin the subwatershed.RegionalAlthough modelresults did notshow propertydamage, <strong>DWP</strong> includesrecommendationthat ForestPreserve regradechannel to allowpositive drainage.LYT1LyonstownshipOverbankfloodingTributaryto I&MCanalCrossingLaGrangeRd.Pavement flooding dueto high stages in thechannel, 8 known occurrencesRegionalModel results didnot confirm roadwayflooding due toa regional problemin this area. Previousobservationsmay have been theresult <strong>of</strong> a conditionalready remediedor a local issue.WS1WillowSpringsPavementfloodingArcherAvenueat La-GrangeRoadIDOT reported pavementfloodingLocalProblem not locatedon a regionalwaterway. This is alocal problem.3-70
3. TRIBUTARY CHARACTERISTICS AND ANALYSIS3.14.1.6 Near-Term Planned Projects<strong>Water</strong>shed communities, agencies, and stakeholders were asked about near-term plannedprojects so that the implementation <strong>of</strong> near-term flood control projects by others is consideredin development <strong>of</strong> the <strong>DWP</strong>. No near-term planned projects by others have been identifiedfor the I&M Tributary D subwatershed.3.14.2 <strong>Water</strong>shed Analysis3.14.2.1 Hydrologic Model DevelopmentSubbasin Delineation. The I&M Tributary D area was delineated based upon LiDAR topographicdata developed by Cook County in 2003. Five subbasins were delineated for the I&MTributary D area, with an average subbasin area <strong>of</strong> 114.8 acres and a total drainage area <strong>of</strong>0.9 square mile.Hydrologic Parameter <strong>Cal</strong>culations. CNs were estimated for each subbasin based upon NRCSsoil data and 2001 CMAP land use data. This method is further described in Section 1.3.2,with lookup values for specific combinations <strong>of</strong> land use and soil data presented in AppendixC. An area-weighted average <strong>of</strong> the CN was generated for each subbasin.The lag time, used to convert excess precipitation into a run<strong>of</strong>f hydrograph, was assumed tobe 0.6 times the time <strong>of</strong> concentration for all subbasins. The time <strong>of</strong> concentration, or time <strong>of</strong>travel from the hydrologically most distant part <strong>of</strong> the subbasin, was estimated by usingstandard procedures assuming a length <strong>of</strong> sheet flow, shallow concentrated flow, and channelflow. In some instances, modification to parameter estimates was necessary to more accuratelycharacterize very flat or heavily sewered subwatersheds. Appendix G provides asummary <strong>of</strong> the hydrologic parameters used for subbasins in each subwatershed.3.14.2.2 Hydraulic Model DevelopmentField Data, Investigation, and Existing Model Data. No hydraulic models that met <strong>District</strong> criteria,as identified in Section 6.3.3.2 <strong>of</strong> the CCSMP, were available for <strong>DWP</strong> development.The open channel <strong>of</strong> I&M Tributary D and all crossings were surveyed to characterize thechannel and near overbank geometry. Cross-sectional geometry in the non-surveyed overbankarea was obtained from Cook County topographic data and combined with the surveyedchannel cross section. Field visits were performed to assess channel and overbankroughness characteristics, which were combined with information from photographs andaerial photography to assign modeled Manning’s n roughness coefficient to the stream.Boundary Conditions. Appendix E contains boundary condition elevations for the <strong>Cal</strong>umet-<strong>Sag</strong> Channel based on output from the CWS model. The elevation produced by the CWSmodel for the 100-year storm at the outlet <strong>of</strong> I&M Tributary D was 587.69 feet NAVD 88,about 3 feet above the invert <strong>of</strong> I&M Tributary D near its confluence with the I&M Canal.This shallow depth indicates that the downstream stage on I&M Tributary D is controllednot by the receiving system, but by its own capacity to convey flows received from its tributaryarea. Normal depth assuming a friction slope <strong>of</strong> 0.0025 was thus used as a downstreamboundary condition for I&M Tributary D, resulting in a 100-year elevation <strong>of</strong> 587.69 feet atthe confluence.3-71
CALUMET-SAG DETAILED WATERSHED PLAN3.14.2.3 <strong>Cal</strong>ibration and VerificationNo measured or observed stages were available for I&M Tributary D to compare model resultsto observed flows or stage. Curve numbers were reduced by 10 percent for existingand alternative conditions analysis based upon the calibration <strong>of</strong> streams with monitoringdata as described in Section 1.3.8.3.14.2.4 Existing Conditions EvaluationFlood Inundation Areas. Figure 3.14.1 shows inundation areas produced by the <strong>DWP</strong>’s hydraulicmodel for the 100-year, 12-hour duration design storm.Hydraulic Pr<strong>of</strong>iles. Appendix H contains hydraulic pr<strong>of</strong>iles <strong>of</strong> existing conditions in the I&MTributary D system. Pr<strong>of</strong>iles are shown for the 2-, 5-, 10-, 25-, 50-, 100-, and 500-year recurrenceinterval design storms.3.14.3 Development and Evaluation <strong>of</strong> AlternativesThere were no damages identified through hydraulic modeling <strong>of</strong> I&M Canal Tributary D,so no alternatives were developed. Modeling did not confirm pavement flooding where reportedby IDOT through the Form B. Previous observations may have been the result <strong>of</strong> acondition already remedied or a local issue. It is recommended that the problem reported byHickory Hills regarding flooding at 95th Street and Kean Avenue be addressed through improvingmaintenance practices on Forest Preserve property. This recommendation is discussedfurther in Section 4, Maintenance.3-72
3. TRIBUTARY CHARACTERISTICS AND ANALYSIS3.15 Justice DitchJustice Ditch is located in southwestern CookCounty, north <strong>of</strong> the <strong>Cal</strong>umet-<strong>Sag</strong> Channel, in thenorthern part <strong>of</strong> the <strong>Cal</strong>umet-<strong>Sag</strong> Channel <strong>Water</strong>shed.The drainage area <strong>of</strong> Justice Ditch is0.42 square miles. Approximately 0.31 squaremile <strong>of</strong> that area drains to the open channel part<strong>of</strong> Justice Ditch. The remaining 0.11-square-milearea to the west <strong>of</strong> Garden Lane is drained by anetwork <strong>of</strong> sewers and shallow, overland flow.Communities tributary to Justice Ditch are describedin Table 3.15.1.TABLE 3.15.1Communities Draining to Justice DitchTributaryCommunityArea (mi 2 )Justice a 0.31Unincorporated CookCounty0.11a All flows tributary to the modeled open channel<strong>of</strong> Justice Ditch are contributed from within Justice.The area draining to Justice Ditch is largely residential,with part <strong>of</strong> Bethania Cemetery drainingfrom the upstream, easternmost section <strong>of</strong> thesubwatershed. Table 3.15.2 summarizes the landuse distribution within the Justice Ditch subwatershed.TABLE 3.15.2Land Use Distribution for Justice DitchLand Use Category Area (acres) %Residential 178.4 66.9Commercial/Industrial 6.3 2.3Forest/Open Land 70.8 26.6Figure 3.15.1 is an overview <strong>of</strong> the tributary area<strong>of</strong> the subwatershed. Reported stormwater problemareas, and flood inundation areas are also Transportation/Utility 4.4 1.7Institutional 4.6 1.7shown on the figure, and are discussed below.<strong>Water</strong>/Wetland 2 0.7The modeled waterway is roughly 2,300 feet longupstream <strong>of</strong> Garden Lane, with enclosed conduits making up roughly 1,165 feet <strong>of</strong> that length.Justice Ditch discharges into a 60-inch storm sewer that conveys flows under Garden Laneand discharges to the I&M Canal west <strong>of</strong> Jocare Drive. The storm sewer is not part <strong>of</strong> the hydraulicmodel <strong>of</strong> the Justice Ditch.During intense rainfall, the Justice Ditch subwatershed receives some flows from a depressionalarea bounded roughly by 73rd Place and 75th Street to the north and south, and CorkAvenue and 88th Avenue, to the west and east. This area was included in the 71st Street Ditchdrainage area and is drained by a 24-inch sewer to the 71st Street Ditch. However, during intenserainfall events, run<strong>of</strong>f exceeds the capacity <strong>of</strong> this small sewer and reaches an elevation<strong>of</strong> about 596.5 feet, where it then overflows towards Justice Ditch, resulting in interbasin flow.The existence <strong>of</strong> the interbasin flow, and the stormwater problem associated with it, led to theneed to develop a hydraulic model for Justice Ditch to properly analyze the effects <strong>of</strong> the interbasinflow.3.15.1 Sources <strong>of</strong> Data3.15.1.1 Previous StudiesA 1980 IDOT study examined numerous stormwater improvements to Justice Ditch. Theseincluded channel improvements, various channel diversion alignments, and combinations3-73
CALUMET-SAG DETAILED WATERSHED PLAN<strong>of</strong> both. The 60-inch storm sewer under Garden Lane, which was designed to provide a10-year level <strong>of</strong> service, was constructed as a result <strong>of</strong> this study (IDOT, 1980).3.15.1.2 <strong>Water</strong> Quality DataThe IEPA does not have any sites in the Ambient <strong>Water</strong> Quality Monitoring Network on JusticeDitch. There are also no reaches identified as impaired in the IEPA’s 2008 Integrated <strong>Water</strong>Quality Report, which includes the CWA 303(d) and 305(b) lists. No TMDLs have been establishedfor Justice Ditch. According to a USEPA water permit discharge query, there are noNPDES permits issued by IEPA for discharges to Justice Ditch. Municipalities discharging toJustice Ditch are regulated by IEPA’s NPDES Phase II Stormwater Permit Program, whichwas created to improve the water quality <strong>of</strong> stormwater run<strong>of</strong>f from urban areas, and requiresthat municipalities obtain permits for discharging stormwater and implement the six minimumcontrol measures for limiting run<strong>of</strong>f pollution to receiving systems.3.15.1.3 Wetland and Riparian AreasFigures 2.3.6 and 2.3.7 contain mapping <strong>of</strong> wetland and riparian areas in the <strong>Cal</strong>umet-<strong>Sag</strong>Channel <strong>Water</strong>shed. Wetland areas were identified using National Wetlands Inventory (NWI)mapping. NWI data includes no wetland areas in the Justice Ditch tributary area. Riparianareas are defined as vegetated areas between aquatic and upland ecosystems adjacent to a waterwayor body <strong>of</strong> water that provides flood management, habitat, and water quality enhancement.Identified riparian environments <strong>of</strong>fer potential opportunities for restoration.3.15.1.4 Floodplain MappingFlood inundation areas supporting the NFIP were revised in 2008 as a part <strong>of</strong> FEMA’s MapModernization Program. Floodplain boundaries were revised based upon updated CookCounty topographic information; however, the effective models, which are used to estimateflood levels, were generally not updated. LOMRs were incorporated in the revised floodplains.TR-20 and HEC-2 were used for the effective hydrologic and hydraulic Justice Ditchmodels, respectively. According to the FIS, the original H&H analysis was performed in1979.Appendix A includes a comparison <strong>of</strong> FEMA’s effective floodplain mapping from updatedDFIRM panels with inundation areas developed for the <strong>DWP</strong>.3.15.1.5 Stormwater Problem DataCommunities, agencies (e.g., IDOT, CCHD), and stakeholders submitted Form B questionnaireresponse data to the <strong>District</strong> summarizing known stormwater problems within theirjurisdictions. Table 3.15.3 lists reported problems for Justice Ditch. JU2 is in the 71st StreetDitch <strong>Water</strong>shed, but is included below because resolution <strong>of</strong> the problem there would helpboth subwatersheds. The Village <strong>of</strong> Justice has indicated that, since the installation <strong>of</strong> a 36-inch lateral sewer connected to the Garden Lane sewer, overbank flooding associated withJustice Ditch has not been a problem.3.15.1.6 Near-Term Planned Projects<strong>Water</strong>shed communities, agencies, and stakeholders were asked about near-term plannedprojects so that the implementation <strong>of</strong> near-term flood control projects by others is consid-3-74
3. TRIBUTARY CHARACTERISTICS AND ANALYSISTABLE 3.15.3Community Response Data for Justice DitchProblemIDMunicipalityProblemsas Reportedby LocalAgencyLocationProblemDescriptionLocal/RegionalResolutionin <strong>DWP</strong>JU2 a Justice Ponding East <strong>of</strong> CorkAve. between73rd Pl. and75th St.Depressionalarea has nonatural outlet.Presently drainsto 71st StreetDitch throughan undersizedstorm sewer.LocalAlthough this is a localproblem, recommendedalternative SFDT-2 providesadditional dischargecapacity to I&MCanal, which is a component<strong>of</strong> the IDNR planto address local problems.a Problem located in 71st Street Ditch <strong>Water</strong>shed, but affects Justice Ditch for larger storms.ered in development <strong>of</strong> the <strong>DWP</strong>. No near-term planned projects by others have been identifiedfor the Justice Ditch subwatershed.3.15.2 <strong>Water</strong>shed Analysis3.15.2.1 Hydrologic Model DevelopmentSubbasin Delineation. The Justice Ditch tributary area was delineated based upon LiDAR topographicdata developed by Cook County in 2003. The area draining to problem area JU2was included in the original delineation <strong>of</strong> Justice Ditch. However, further review <strong>of</strong> the1980 IDOT study and the contour data in this area suggested that this location would drainto the 71st Street Ditch for small- to medium-sized storms, with inter-basin flow to JusticeDitch occurring when water levels exceed an elevation <strong>of</strong> 596.5 feet. Further cause for inclusion<strong>of</strong> this area in the 71st Street Ditch drainage basin is the proposed solution for localdrainage issues in this area, which would increase discharge to the 71st Street Ditch throughan enlarged sewer.Three subbasins were delineated for the Justice Ditch tributary area, with an average subbasinarea <strong>of</strong> 89 acres. Subbasin W540 drains a mobile home park area west <strong>of</strong> Garden Lane,and was modeled exclusively hydrologically as a tributary to the CSSC.Hydrologic Parameter <strong>Cal</strong>culations. CNs were estimated for each subbasin based upon NRCSsoil data and 2001 CMAP land use data. This method is further described in Section 1.3.2,with lookup values for specific combinations <strong>of</strong> land use and soil data presented in AppendixC. An area-weighted average <strong>of</strong> the CN was generated for each subbasin.The lag time, used to convert excess precipitation into a run<strong>of</strong>f hydrograph, was assumed tobe 0.6 times the time <strong>of</strong> concentration for all subbasins. The time <strong>of</strong> concentration, or time <strong>of</strong>travel from the hydrologically most distant part <strong>of</strong> the subbasin, was estimated by usingstandard procedures assuming a length <strong>of</strong> sheet flow, shallow concentrated flow, and channelflow. In some instances, modification to parameter estimates was necessary to more accuratelycharacterize very flat or heavily sewered subwatersheds. Appendix G provides asummary <strong>of</strong> the hydrologic parameters used for subbasins in each subwatershed.3-75
CALUMET-SAG DETAILED WATERSHED PLANInflow. Interbasin flow from the 71st Street Ditch to the Justice Ditch subwatershed begins tooccur when water surface elevations in the area surrounding problem JU2 exceed an elevation<strong>of</strong> 596.5 feet, which is where overland flow to Justice Ditch occurs. The overland flowsexiting the 71st Street Ditch tributary area were loaded into the Justice Ditch model.3.15.2.2 Hydraulic Model DevelopmentField Data, Investigation, and Existing Model Data. No hydraulic models that met <strong>District</strong> criteria,as identified in Section 6.3.3.2 <strong>of</strong> the CCSMP, were available for <strong>DWP</strong> development.The open channel <strong>of</strong> Justice Ditch and all crossings were surveyed, along with the intakestructure for the Garden Lane channel diversion, to characterize the channel and near overbankgeometry. Cross-sectional geometry in the non-surveyed overbank area was obtainedfrom Cook County topographic data and combined with the surveyed channel cross section.Field visits were performed to assess channel and overbank roughness characteristics,which were combined with information from photographs and aerial photography to assignmodeled Manning’s n roughness coefficient to the stream.Boundary Conditions. The Justice Ditch model was extended slightly downstream <strong>of</strong> GardenLane. The pipe discharging into the drop structure to the Garden Lane sewer is restrictive,and results in an increased stage at the upstream face <strong>of</strong> a structure located at the JusticeDitch intersection with Garden Lane. The simulated water surface elevation upstream <strong>of</strong>Garden Lane thus functions as the boundary condition for the Justice Ditch.3.15.2.3 <strong>Cal</strong>ibration and VerificationNo measured or observed stages were available for Justice Ditch to compare model resultsto observed flows or stage. Curve numbers were reduced by 10 percent for existing and alternativeconditions analysis based upon the calibration <strong>of</strong> streams with monitoring data asdescribed in Section 1.3.8.3.15.2.4 Existing Conditions EvaluationFlood Inundation Areas. Figure 3.15.1 shows inundation areas produced by the <strong>DWP</strong>’s hydraulicmodel for the 100-year, 12-hour duration design storm.Hydraulic Pr<strong>of</strong>iles. Appendix H contains hydraulic pr<strong>of</strong>iles <strong>of</strong> existing conditions in the JusticeDitch system. Pr<strong>of</strong>iles are shown for the 2-, 5-, 10-, 25-, 50-, 100-, and 500-year recurrenceinterval design storms.3.15.3 Development and Evaluation <strong>of</strong> Alternatives3.15.3.1 Problem DefinitionModel results show that overbank flooding along the Justice Ditch is significant for every recurrenceinterval storm evaluated as a part <strong>of</strong> the <strong>Cal</strong>umet-<strong>Sag</strong> Channel <strong>DWP</strong>. Stormwaterconveyed to the Justice Ditch originates within the Village <strong>of</strong> Justice and problems associatedwith the flooding <strong>of</strong> Justice Ditch have been classified as local. WPC participants familiar withthe area have noted that flooding along Justice Ditch has not been a problem since the GardenLane sewer was installed along with the 36-inch lateral sewer beneath 76th Place connectingto the Garden Lane sewer. The existing conditions hydraulic model developed for the <strong>DWP</strong>3-76
3. TRIBUTARY CHARACTERISTICS AND ANALYSISindicates that parts <strong>of</strong> the Justice Ditch tributary area are at risk <strong>of</strong> flooding, even with thesechanges in place. Differences between model results and local understanding <strong>of</strong> flood problemsmay result from the impact <strong>of</strong> unmodeled or simplified storm sewers and culverts thatmay significantly affect routing <strong>of</strong> flows in the small drainage area <strong>of</strong> Justice Ditch. Table3.15.4 provides a summary <strong>of</strong> problem areas identified through modeling <strong>of</strong> Justice Ditch.TABLE 3.15.4Modeled Problem Definition for Justice DitchProblem IDLocationRecurrence Interval(yr) <strong>of</strong> FloodingAssociatedForm BResolution in <strong>DWP</strong>MPA7MPA8Along JusticeDitch, betweenGardenLane andBanks StreetBetween 76thPlace and75th Streetand CorkAvenue andBanks Street2, 5, 10, 25, 50, 100 Although this is a local problem,recommended alternative SFDT-2provides additional discharge capacityto I&M Canal, which is acomponent <strong>of</strong> the IDNR plan to addresslocal problems.2, 5, 10, 25, 50, 100 Although this is a local problem,recommended alternative SFDT-2provides additional discharge capacityto I&M Canal, which is acomponent <strong>of</strong> the IDNR plan to addresslocal problems.Since problem areas within the Justice Ditch subwatershed are classified as local, no damageshave been assigned for Justice Ditch. No alternatives have therefore been developed forthe Justice Ditch subwatershed.3-77
3. TRIBUTARY CHARACTERISTICS AND ANALYSIS3.16 Ken Kay DitchKen Kay Ditch is located in southwestern CookCounty, north <strong>of</strong> the <strong>Cal</strong>umet-<strong>Sag</strong> Channel, inthe center <strong>of</strong> the <strong>Cal</strong>umet-<strong>Sag</strong> Channel <strong>Water</strong>shed.Table 3.16.1 summarizes the areas <strong>of</strong> communitiesthat drain to Ken Kay Ditch. Thesubwatershed consists mostly <strong>of</strong> suburban residentialdevelopment with some open land.The drainage area is 1.3 square miles. Ken KayDitch is an open-channel stream that serves as alateral drainage ditch parallel to the <strong>Cal</strong>umet-<strong>Sag</strong>Channel, which it discharges into at both ends <strong>of</strong>Ken Kay Ditch. Table 3.16.2 lists the land usebreakdown by area within the <strong>Cal</strong>umet-<strong>Sag</strong> subwatershed.Figure 3.16.1 is an overview <strong>of</strong> thetributary area <strong>of</strong> the subwatershed. Reportedstormwater problem areas are also shown on thefigure, and are discussed in the following subsections.No hydraulic model was developed for Ken KayDitch. All areas tributary to Ken Kay Ditch aredrained through storm sewer systems that arecompletely within the Village <strong>of</strong> Worth. Problemsalong Ken Kay Ditch are classified as local.TABLE 3.16.1Communities Draining to Ken Kay DitchCommunity Tributary Area (mi 2 )Worth 1.21Unincorporated/ForestPreserve0.03Alsip 0.02Palos Heights 0.01TABLE 3.16.2Land Use Distribution for Ken Kay DitchLand UseArea(acres)Residential 534.5 65.8Forest/Open Land 177.2 21.8Commercial/Industrial 70 7.5Transportation/Utility 23.5 2.9Institutional 15.6 1.9<strong>Water</strong>/Wetland 0.3 0Agricultural 0.1 0%3.16.1 Sources <strong>of</strong> Data3.16.1.1 Previous StudiesNo studies <strong>of</strong> Ken Kay Ditch were identified for consideration as a component <strong>of</strong> <strong>DWP</strong> development.3.16.1.2 <strong>Water</strong> Quality DataThe IEPA does not have any sites in the Ambient <strong>Water</strong> Quality Monitoring Network onKen Kay Ditch. There are no reaches identified as impaired in the IEPA’s 2008 Integrated <strong>Water</strong>Quality Report, which includes the CWA 303(d) and 305(b) lists. No TMDLs have been establishedfor Ken Kay Ditch. According to a USEPA water permit discharge query, there areno NPDES permits issued by IEPA for discharges to Ken Kay Ditch. Municipalities dischargingto Ken Kay Ditch are regulated by IEPA’s NPDES Phase II Stormwater PermitProgram, which was created to improve the water quality <strong>of</strong> stormwater run<strong>of</strong>f from urbanareas, and requires that municipalities obtain permits for discharging stormwater and implementthe six minimum control measures for limiting run<strong>of</strong>f pollution to receiving systems.3-79
CALUMET-SAG DETAILED WATERSHED PLAN3.16.1.3 Wetland and Riparian AreasFigures 2.3.6 and 2.3.7 contain mapping <strong>of</strong> wetland and riparian areas in the <strong>Cal</strong>umet-<strong>Sag</strong>Channel <strong>Water</strong>shed. Wetland areas were identified using National Wetlands Inventory (NWI)mapping. NWI data includes roughly 31.1 acres <strong>of</strong> wetland areas in the Ken Kay Ditch subwatershed.Riparian areas are defined as vegetated areas between aquatic and upland ecosystemsadjacent to a waterway or body <strong>of</strong> water that provides flood management, habitat, andwater quality enhancement. Identified riparian environments <strong>of</strong>fer potential opportunities forrestoration.3.16.1.4 Floodplain MappingFlood inundation areas supporting the NFIP were revised in 2008 as a part <strong>of</strong> FEMA’s MapModernization Program. Floodplain boundaries were revised based upon updated CookCounty topographic information; however, the effective models, which are used to estimateflood levels, generally were not updated. LOMRs were incorporated in the revised floodplains.Ken Kay Ditch is not mapped in detail in the DFIRM mapping update, and so therewas no known model that meets the criteria established in Chapter 6 <strong>of</strong> the CCSMP for usein the development <strong>of</strong> <strong>DWP</strong>s.3.16.1.5 Stormwater Problem DataCommunities, agencies (IDOT, CCHD), and stakeholders submitted Form B questionnaireresponse data to the <strong>District</strong> summarizing known stormwater problems within their jurisdictions.Table 3.16.3 shows one reported problem along Ken Kay Ditch. This problem had areadily apparent solution because the problem is related to channel maintenance. Poor grading<strong>of</strong> the channel was identified as a potential hazard to human health and safety causedby mosquito breeding in shallow stagnant waters. This problem is classified as local, however,and has not been attributed to any flood damages along the Ken Kay Ditch.TABLE 3.16.3Community Response Data for Ken Kay DitchProblemIDMunicipalityProblems asReported byLocal Agency Location Problem DescriptionLocal/RegionalResolutionin <strong>DWP</strong>WO3 Worth Ponding,bank erosionKen KayDitch at116th Streetand HarlemAvenueCreek is in need <strong>of</strong> sedimentremoval. Pondingoccurs in the village andwithin IDOT ROW adjacentto the creek.LocalField assessmentidentified the needfor maintenanceand grading to aiddrainage.3.16.1.6 Near-Term Planned Projects<strong>Water</strong>shed communities, agencies, and stakeholders were asked about near-term plannedprojects so that the implementation <strong>of</strong> near-term flood control projects by others is consideredin development <strong>of</strong> the <strong>DWP</strong>. No near-term planned projects by others have been identifiedfor the Ken Kay Ditch subwatershed.3-80
3. TRIBUTARY CHARACTERISTICS AND ANALYSIS3.16.2 <strong>Water</strong>shed Analysis3.16.2.1 Hydrologic Model DevelopmentCNs were estimated for each subbasin based upon NRCS soil data and 2001 CMAP land usedata. This method is further described in Section 1.3.2, with lookup values for specific combinations<strong>of</strong> land use and soil data presented in Appendix C. An area-weighted average <strong>of</strong>the CN was generated for each subbasin.The lag time, used to convert excess precipitation into a run<strong>of</strong>f hydrograph, was assumed tobe 0.6 times the time <strong>of</strong> concentration for all subbasins. The time <strong>of</strong> concentration, or time <strong>of</strong>travel from the hydrologically most distant part <strong>of</strong> the subbasin, was estimated by usingstandard procedures assuming a length <strong>of</strong> sheet flow, shallow concentrated flow, and channelflow. In some instances, modification to parameter estimates was necessary to more accuratelycharacterize very flat or heavily sewered subwatersheds. Appendix G provides asummary <strong>of</strong> the hydrologic parameters used for subbasins in each subwatershed.3.16.2.2 Hydraulic Model DevelopmentField Data, Investigation, and Existing Model Data. No hydraulic models that met <strong>District</strong> criteria,as identified in Section 6.3.3.2 <strong>of</strong> the CCSMP, were available for <strong>DWP</strong> development.No hydraulic model was developed for Ken Kay Ditch because there is only one communitywith significant amount <strong>of</strong> drainage area within the Ken Kay Ditch watershed. Any potentialstormwater problem along Ken Kay Ditch would be classified as a local problem.3.16.2.3 <strong>Cal</strong>ibration and VerificationNo measured or observed stages were available for Ken Kay Ditch to compare model resultsto observed flows or stage. Curve numbers were reduced by 10 percent for existing and alternativeconditions analysis based upon the calibration <strong>of</strong> streams with monitoring data asdescribed in Section 1.3.8.3.16.3 Development and Evaluation <strong>of</strong> AlternativesThere were no regional problems reported or damages identified in the Ken Kay Ditch subwatershed,so no alternatives were developed.3-81
3. TRIBUTARY CHARACTERISTICS AND ANALYSIS3.17 Long Run CreekLong Run Creek is a regional waterway located insouthwestern Cook County, in the southern part <strong>of</strong>the <strong>Cal</strong>umet-<strong>Sag</strong> Channel <strong>Water</strong>shed. There arethree distinct areas within Cook County that eachdrain to three waterways tributary to Long RunCreek. From west to east, the three subwatershedareas are an area that drains primarily to Long RunCreek Tributary B, the Tampier Slough drainagearea, and the area that drains to Long Run CreekTributary A and the main branch <strong>of</strong> Long RunCreek. From its headwaters located roughly southwest<strong>of</strong> the intersection <strong>of</strong> Wolf Road and 143rdStreet in Orland Park, Long Run Creek flowsroughly northwest and crosses into Will Countynear the intersection <strong>of</strong> Will-Cook Road and 139thStreet. Long Run Creek Tributary A discharges intothis stretch <strong>of</strong> Long Run Creek northwest <strong>of</strong> the intersection<strong>of</strong> Wolf Road and 143rd Street. Long RunCreek flows for approximately 4.8 miles within WillCounty, before crossing briefly back into CookCounty near the intersection <strong>of</strong> State Street andArcher Avenue south <strong>of</strong> Lemont, where Long RunCreek Tributary B discharges into Long Run Creek.Near this location, Long Run Creek then flows backinto Will County.TABLE 3.17.1Communities Draining to Long Run CreekCommunity Tributary Area (mi 2 )Unincorporated/Forest Preserve7.93Lemont 1.70Orland Park 3.40Palos Park 0.92TABLE 3.17.2Land Use Distribution for Long Run CreekAreaLand Use Category (acres) %Agricultural 1120.0 12.6Commercial/Industrial 159.4 1.8Forest/Open Land 2792.8 31.5Institutional 82.1 0.9Residential 3904.6 44.1Transportation/Utility 90.3 1.0<strong>Water</strong>/Wetland 708.3 8.0The total drainage area to Long Run Creek within Cook County to the point where flow returnsto Will County near Lemont is 13.8 square miles. Table 3.17.1 lists the communitieswithin Cook County that drain to Long Run Creek.The Long Run Creek subwatershed contains a mix <strong>of</strong> suburban development with openspace and agricultural area. Table 3.17.2 summarizes the land use distribution within theLong Run Creek subwatershed.Figures 3.17.1a and b show an overview <strong>of</strong> the tributary area <strong>of</strong> the subwatershed. Reportedstormwater problem areas, flood inundation areas, and proposed alternative projects arealso shown on the figure and discussed in the following subsections.3.17.1 Sources <strong>of</strong> Data3.17.1.1 Previous StudiesWill County recently created H&H models <strong>of</strong> existing conditions in Long Run Creek to examinefloodplain areas and channel improvements for the part <strong>of</strong> Long Run Creek in WillCounty. The extent <strong>of</strong> the H&H model does not include the parts <strong>of</strong> Long Run Creek inCook County, and so it did not contribute directly to the development <strong>of</strong> the <strong>Cal</strong>umet-<strong>Sag</strong>Channel <strong>DWP</strong>.3-83
CALUMET-SAG DETAILED WATERSHED PLAN3.17.1.2 <strong>Water</strong> Quality DataMonitoring Data. The IEPA does not have any sites in the Ambient <strong>Water</strong> Quality MonitoringNetwork on Long Run Creek. No reaches are identified as impaired in the IEPA’s 2008 Integrated<strong>Water</strong> Quality Report, which includes the CWA Sections 303(d) and 305(b) lists. TampierSlough, which is a wetland area draining to Long Run Creek from the north, is on theIEPA’s 303(d) report because <strong>of</strong> total phosphorus and total suspended solids (TSS). NoTMDLs have been established for Long Run Creek. According to a USEPA water permitdischarge query, there are no NPDES permits issued by IEPA for discharges to Long RunCreek. Municipalities discharging to Long Run Creek are regulated by the IDNR’s NPDESPhase II Stormwater Permit Program, which was created to improve the water quality <strong>of</strong>stormwater run<strong>of</strong>f from urban areas, and requires that municipalities obtain permits for dischargingstormwater and implement the six minimum control measures for limiting run<strong>of</strong>fpollution to receiving systems.3.17.1.3 Wetland and Riparian AreasFigures 2.3.6 and 2.3.7 contain mapping <strong>of</strong> wetland and riparian areas in the <strong>Cal</strong>umet-<strong>Sag</strong>Channel <strong>Water</strong>shed. Wetland areas were identified using National Wetlands Inventory (NWI)mapping. NWI data includes 773.8 acres <strong>of</strong> wetland area in the Long Run Creek subwatershedarea within Cook County. Tampier Slough accounts for 370 acres <strong>of</strong> this area. Riparianareas are defined as vegetated areas between aquatic and upland ecosystems adjacent to a waterwayor body <strong>of</strong> water that provides flood management, habitat, and water quality enhancement.Identified riparian environments <strong>of</strong>fer potential opportunities for restoration.3.17.1.4 Floodplain MappingFlood inundation areas supporting the NFIP were revised in 2008 as a part <strong>of</strong> FEMA’s MapModernization program. Floodplain boundaries were revised based upon updated CookCounty topographic information, but the effective models, which are used to estimate floodlevels, generally were not updated. LOMRs were incorporated into revised floodplain areas.Long Run Creek is mapped in detail in the DFIRM mapping update, with Zone AE floodplainshown across the length <strong>of</strong> Long Run Creek. The original hydrologic and hydraulicanalysis was performed in 1979. The hydrologic modeling was performed using L-PTIII andRegression Equations 73 and 75. Hydraulic routing performed was steady state and usedthe WSP-2 modeling application.Appendix A includes a comparison <strong>of</strong> FEMA’s effective floodplain mapping from updatedDFIRM panels with inundation areas developed for the <strong>DWP</strong>.3.17.1.5 Stormwater Problem DataCommunities, agencies (IDOT, CCHD), and stakeholders submitted <strong>District</strong> Form B questionnaireresponse data to the <strong>District</strong> summarizing stormwater problems within their jurisdictions.Stormwater problems were classified as regional or local based upon the criteriadescribed in Section 1 <strong>of</strong> the report. Table 3.17.3 summarizes the Form B data for Long RunCreek.3-84
3. TRIBUTARY CHARACTERISTICS AND ANALYSIS3.17.1.6 Near-Term Planned Projects<strong>Water</strong>shed communities, agencies, and stakeholders were asked about near-term plannedprojects so that the implementation <strong>of</strong> near-term flood control projects by others is consideredin development <strong>of</strong> the <strong>DWP</strong>. No near-term planned projects by others have been identifiedfor the Long Run Creek subwatershed.3.17.2 <strong>Water</strong>shed Analysis3.17.2.1 Hydrologic Model DevelopmentSubbasin Delineation. The Long Run Creek subwatershed was delineated based upon Li-DAR topographic data developed by Cook County in 2003. The subwatershed drainage areaincludes 9.5 square miles <strong>of</strong> area in Will County that drain into Cook County. The areawithin Will County was delineated using USGS maps showing 10-foot contours where Li-DAR data was unavailable. Inclusion <strong>of</strong> this area was necessary to account for total flowvolumes into Long Run Creek.TABLE 3.17.3Community Response Data for Long Run CreekProblem IDMunicipalityProblems asReported byLocal AgencyLocationProblemDescriptionLocal/RegionalResolutionin <strong>DWP</strong>LT3LemontTownshipPavementfloodingRoute 171(ArcherAvenue) at131st StreetIDOT reportedpavementfloodingLocalProblem not locatedon a regional waterway.This is a localproblem.OP11OrlandParkBank erosion,sedimentation143rd Streetand WolfRoadErosion/sedimentation causesflow restrictionand floodingRegionalSedimentation notnoted in field survey.May have been addressedby recentmaintenance activities.OP9OrlandParkOverbankfloodingLong RunCreekCrossing143rd Street(West <strong>of</strong>Wolf Road)Pavementflooding due tohigh stages inthe channel,18 known occurrencesRegionalProject LRCR-5 willraise 143rd Street toaddress transportationdamages.OT2OrlandTownshipBank erosion,sedimentationWill-CookRoad atLong RunCreekcrossingSilt in culvert,and severeerosion alongsoutheast embankmentRegionalErosion area visitedand determined notto threaten any structures.Siltation notnoted in field survey;may have been addressedby recentmaintenance.PP10PalosParkOverbankflooding,basementflooding, stormsewer capacity,bank erosion116th Avenueand123rd StreetFloodwatersexceed capacity,1 time peryearLocalProblem not locatedon a regional waterway.This is a localproblem.3-85
CALUMET-SAG DETAILED WATERSHED PLANEighty subbasins were delineated for the Long Run Creek tributary area, with an averagesubbasin area <strong>of</strong> 180 acres, including those delineated within Will County. Excluding WillCounty subbasins, the average size is 127.47 acres.Hydrologic Parameter <strong>Cal</strong>culations. CNs were estimated for each subbasin based upon NRCSsoil data and 2001 CMAP land use data. This method is further described in Section 1.3.2,with lookup values for specific combinations <strong>of</strong> land use and soil data presented in AppendixC. An area-weighted average <strong>of</strong> the CN was generated for each subbasin.The lag time, used to convert excess precipitation into a run<strong>of</strong>f hydrograph, was assumed tobe 0.6 times the time <strong>of</strong> concentration for all subbasins. The time <strong>of</strong> concentration, or time <strong>of</strong>travel from the hydrologically most distant part <strong>of</strong> the subbasin, was estimated by usingstandard procedures assuming a length <strong>of</strong> sheet flow, shallow concentrated flow, and channelflow. In some instances, modification to parameter estimates was necessary to more accuratelycharacterize very flat or heavily sewered subwatersheds. Appendix G provides asummary <strong>of</strong> the hydrologic parameters used for subbasins in each subwatershed.For Will County subwatershed areas tributary to Long Run Creek where LiDAR data wasmissing, drainage paths and lag times were approximated using USGS data and availableaerial photography. This was adjusted based on the historic gage record explained in moredetail in Section 3.17.2.3.3.17.2.2 Hydraulic Model DevelopmentField Data, Investigation, and Existing Model Data. No hydraulic models that met <strong>District</strong> criteria,as identified in Section 6.3.3.2 <strong>of</strong> the CCSMP, were available for <strong>DWP</strong> development.The open channel <strong>of</strong> Long Run Creek and all crossings were surveyed to characterize thechannel and near overbank geometry. Cross-sectional geometry in the non-surveyed overbankarea was obtained from Cook County topographic data and combined with the surveyedchannel cross section. Stream sections in Will County were not modeledhydraulically. Field visits were performed to assess channel and overbank roughness characteristics,which were combined with information from photographs and aerial photographyto assign modeled Manning’s n roughness coefficient to the stream.Boundary Conditions. Long Run Creek was modeled in two separate reaches: Long RunCreek upstream <strong>of</strong> Will-Cook Road and Long Run Creek Tributary B. Normal depth was setas the boundary condition for both reaches <strong>of</strong> Long Run Creek at each point <strong>of</strong> dischargeinto Will County. A slope <strong>of</strong> 0.0026 was used for Long Run Creek upstream <strong>of</strong> Will-CookRoad, and a slope <strong>of</strong> 0.0015 was used for Long Run Creek Tributary B where it dischargesinto Long Run Creek. These values are based on the slopes <strong>of</strong> the streams at each location.3.17.2.3 <strong>Cal</strong>ibration and VerificationUSGS Gage 05537500 is located on Long Run Creek at its crossing <strong>of</strong> State Road in southwesternCook County, near Lemont. The gage records instantaneous stage and flow data forLong Run Creek. The data is available on the USGS Web site in “real-time,” meaning usuallywithin hours from the time that it was recorded. Summarized daily, monthly, andyearly data is also available. The drainage area <strong>of</strong> Long Run Creek to the gage location is20.9 square miles, including 9.5 square miles within Will County. The gage record spansfrom 1951 to the present.3-86
3. TRIBUTARY CHARACTERISTICS AND ANALYSISAn event-based calibration <strong>of</strong> Long Run Creek was not performed because the Will Countypart <strong>of</strong> Long Run Creek, approximately 4.8 miles <strong>of</strong> Long Run Creek draining 16.8 acres,was not modeled hydraulically. At least one in-line reservoir is present on the Will Countyportion <strong>of</strong> Long Run Creek, based upon review <strong>of</strong> aerial photographs. The hydrologicmodel for the Will County tributary area <strong>of</strong> Long Run Creek was also <strong>of</strong> limited detail.The absence <strong>of</strong> hydraulic routing in the Will County part <strong>of</strong> Long Run Creek initially resultedin an overprediction <strong>of</strong> flows by the model at the downstream reach <strong>of</strong> Long RunCreek. A hydrologic routing element was added to the model to account for the storage andflood routing attenuation in this area. Flood quartiles for modeled recurrence intervals fromEstimating Flood-Peak Discharge Magnitude and Frequencies for Rural Streams in Illinois (USGS,2004) were used to calibrate the hydrologic model. Table 3.17.4 compares the gaged andmodeled flows for the range <strong>of</strong> recurrence intervals.The comparison <strong>of</strong> modeled and gaged flowsfor the range <strong>of</strong> modeled design events aregenerally in close agreement, particularly forthe larger magnitude events. Curve numberswere reduced by 10 percent for existing andalternative conditions analysis based uponthe calibration <strong>of</strong> streams with monitoringdata as described in Section 1.3.8.TABLE 3.17.4Modeled Peak Flow versus Gage Record FlowRecurrenceIntervalModeled PeakFlow (cfs)Gage RecordFlow (cfs)%Difference2 611 602 15 1,039 1,090 -510 1,461 1,510 -325 2,011 2,140 -63.17.2.4 Existing Conditions Evaluation50 2,508 2,700 -7Flood Inundation Areas. Flood inundation areaswere developed based on HEC-RAS wa-100 3,033 3,340 -9ter surface elevations and Cook Countytopographic data. Figures 3.17.1a and b show500 5,040 5,160 -2inundation areas produced by the <strong>DWP</strong>’s hydraulic model for the 100-year, 12-hour durationdesign storm.Hydraulic Pr<strong>of</strong>iles. Appendix H contains hydraulic pr<strong>of</strong>iles <strong>of</strong> existing conditions in the LongRun Creek system. Pr<strong>of</strong>iles are shown for the 2-, 5-, 10-, 25-, 50-, 100-, and 500-year recurrenceinterval design storms.3.17.3 Development and Evaluation <strong>of</strong> Alternatives3.17.3.1 Problem DefinitionHydraulic model results were reviewed with inundation mapping to identify locationswhere property damage due to flooding is predicted. Table 3.17.5 summarizes major problemareas identified through modeling <strong>of</strong> Long Run Creek.3-87
CALUMET-SAG DETAILED WATERSHED PLANTABLE 3.17.5Modeled Problem Definition for Long Run CreekProblem IDLocationRecurrenceInterval <strong>of</strong>Flooding (yr) Associated Form B Resolution in <strong>DWP</strong>MPA10Area south <strong>of</strong>139th Streetand Will-CookRoad10, 25, 50, 100 OT2 Risk <strong>of</strong> flooding cannot be feasiblymitigated by structural measures.Such properties arecandidates for protection usingnonstructural flood control measures,such as flood-pro<strong>of</strong>ing oracquisition.3.17.3.2 Damage AssessmentDamages due to flooding werecalculated for Long Run Creek inaccordance with the methodologydescribed in Section 1.4 and aresummarized in Table 3.17.6.Transportation damages were calculatedfor flooding overtopping143rd Street at the Long Run Creekcrossing.TABLE 3.17.6Estimated Damages for Long Run CreekDamageCategoryEstimatedDamage ($)Property 62,000Erosion 0NoteTransportation 60,500 Assumed as 15% <strong>of</strong> propertydamage plus damages dueto overtopping <strong>of</strong> 143rdStreetRecreation 03.17.3.3 Technology ScreeningFlood control technologies were screened to identify those most appropriate for addressingthe flooding problems in Long Run Creek. Storage, levees, and increased conveyance wereconsidered as possible alternatives.3.17.3.4 Alternative DevelopmentFlood Control Alternatives. Alternative solutions to regional flooding were developed andevaluated consistent with the methodology described in Section 1.4 <strong>of</strong> this report. Table3.17.7 summarizes flood control alternatives developed for Long Run Creek.Erosion Control Alternatives. No erosion control alternatives were developed for Long RunCreek. Reported erosion problems were determined not to threaten any structures.3.17.3.5 Alternative Evaluation and SelectionFive alternatives were developed for Long Run Creek to reduce damages associated withproblems MPA10 and OP9. LRCR-1 consists <strong>of</strong> a levee coupled with compensatory storagein the opposite bank <strong>of</strong> the problem area near Will-Cook Road, and model results show thatthis alternative reduced flooding for the 25-year storm. Limited land availability in the rightoverbank area to provide compensatory storage prevented provision <strong>of</strong> a higher level <strong>of</strong>service, and floodwaters are predicted to circumvent the levee and cause damages for stormevents larger than the 25-year storm. This alternative was not recommended because it only3-88
3. TRIBUTARY CHARACTERISTICS AND ANALYSISTABLE 3.17.7Flood Control Alternatives for Long Run CreekAlternative Number Location DescriptionLRCR-1LRCR-2LRCR-3LRCR-4LRCR-5Long Run Creek at Will-Cook Road crossingLong Run Creek at Will-Cook Road crossingLong Run Creek andLong Run Creek TributaryA confluenceLong Run Creek at RugglesCourtLong Run Creek at 143 rdStreetA 300-foot levee in left overbank area with excavation inright overbank area to provide compensatory storageIncreased conveyance with compensatory storage downstream<strong>of</strong> Will-Cook Road. This alternative was consideredinfeasible because land was not available forcompensatory storage, thus benefits and costs were notdeveloped.47 acre-foot detention basin; this alternative did not effectivelyreduce water surface elevations in the floodingproblem area, thus benefits and costs were not developed.6 acre-foot detention basin; this alternative did not effectivelyreduce water surface elevations in the floodingproblem area, thus benefits and costs were not developed.Raise 143rd Street approximately four feet and constructculverts and weir structure to mimic existing hydraulicconditions up to the 100-year storm event.protects two structures for smaller storms, resulting in a low B/C ratio with no local or ancillarybenefits.LRCR-2 involves increasing conveyance through the culvert under Will-Cook Road whichdischarges into Will County. This alternative was found to be effective at lowering WSELsin the vicinity <strong>of</strong> problem MPA10. However, this alternative is not considered viable becausethere is not enough upstream land available to provide compensatory storage to preventflood stages from increasing downstream in Will County.Large parcels <strong>of</strong> land were unavailable near the modeled flood problem MPA10, but wereavailable farther upstream, such as at the area north <strong>of</strong> 131st Street between Parker Roadand Bell Road. Two such locations were modeled as LRCR-3 and LRCR-4. While these storagealternatives lowered the WSEL locally, that they are located too far upstream <strong>of</strong> theproblem areas to be effective in reducing flooding damages.LRCR-1 was shown to reduce damages in the Long Run Creek subwatershed while beingfeasible from a regulatory perspective, although it is not recommended for the reasons providedabove.LRCR-5 consists <strong>of</strong> raising 143rd Street to prevent road overtopping. The concept for LRCR-5 includes a new culvert and weir structure designed to mimic existing hydraulic conditionsup to the 100-year storm, with two orifices at the invert and <strong>of</strong> the size <strong>of</strong> the existing culverts,the weir at the elevation <strong>of</strong> the existing road, and a new culvert underneath the raised143rd Street sized to sufficiently convey the 100-year storm event flows without increasingpeak flows or WSELs upstream or downstream.A number <strong>of</strong> properties are at risk <strong>of</strong> shallow flooding during the 100-year flood event underexisting conditions or recommended alternative conditions. In addition, due to their lo-3-89
CALUMET-SAG DETAILED WATERSHED PLANcations, other properties' risk <strong>of</strong> flooding cannot be feasibly mitigated by structural measures.Such properties are candidates for protection using nonstructural flood control measures,such as flood-pro<strong>of</strong>ing or acquisition. These measures may be considered to addressdamages that are not fully addressed by capital projects recommended in the <strong>Cal</strong>umet-<strong>Sag</strong>Channel <strong>DWP</strong>.Table 3.17.8 below provides a summary <strong>of</strong> the depth <strong>of</strong> road flooding at 143rd Street for existingconditions and with recommended alternatives.TABLE 3.17.8Long Run Creek Road Overtopping SummaryRoad CrossingRoadElevation2-yr Depth <strong>of</strong>Flooding5-yr Depth <strong>of</strong>Flooding10-yr Depth<strong>of</strong> Flooding143rd Street 692.9 0.5 0.5 0.8143rd Street (with alternative LRCR-5) 696.9Road CrossingRoadElevation25-yr Depth<strong>of</strong> Flooding50-yr Depth<strong>of</strong> Flooding100-yr Depth<strong>of</strong> Flooding143rd Street 692.9 1.9 2.4 2.4143rd Street (with alternative LRCR-5) 696.9Note: Blank entry indicates that road crossing does not overtop for that particular storm event.3.17.3.6 Data Required for Countywide Prioritization <strong>of</strong> <strong>Water</strong>shed ProjectsAppendix I presents conceptual level cost estimates for the recommended alternative. Table3.17.9 lists benefits and costs for LRCR-5. Alternatives LRCR-1 through LRCR-4 are notlisted in Table 3.17.9 because they did not effectively reduce water surface elevations. LRCR-5 is recommended as raising 143rd Street will effectively address transportation damages atthis location. The recommended alternative LRCR-5 is shown in Figure 3.17.2. A comparison<strong>of</strong> the existing conditions and alternative conditions inundation mapping is included inthese figures.3-90
3. TRIBUTARY CHARACTERISTICS AND ANALYSISTABLE 3.17.9Long Run Creek Project Alternative Matrix to Support <strong>District</strong> CIP PrioritizationProjectDescriptionB/CRatioNet Benefits($)Total ProjectCost ($)CumulativeStructuresProtectedFundingPossibilities<strong>Water</strong>QualityBenefit Recommended Communities InvolvedLRCR-5 Raise 143rd Street 0.06 51,100 862,700 0 None Yes Orland ParkNote: Net Benefits values do not include local benefits or non-economic benefits.3-91
3. TRIBUTARY CHARACTERISTICS AND ANALYSIS3.18 Lucas DitchLucas Ditch is a manmade tributary to StonyCreek in southwestern Cook County, north <strong>of</strong> the<strong>Cal</strong>umet-<strong>Sag</strong> Channel, in the central part <strong>of</strong> the<strong>Cal</strong>umet-<strong>Sag</strong> Channel <strong>Water</strong>shed. The ditch isroughly 2.0 miles long and drains an area <strong>of</strong>2.7 square miles. Table 3.18.1 summarizes thecommunities draining to Lucas Ditch.The Lucas Ditch subwatershed contains a mix <strong>of</strong>urban development and little available open landin the upstream part <strong>of</strong> the subwatershed. Much<strong>of</strong> the area is drained by storm sewers or roadsideditches. Table 3.18.2 summarizes the landuse distribution within the subwatershed.TABLE 3.18.1Communities Draining to Lucas DitchCommunityTributaryArea (mi 2 )Palos Hills 1.96Hickory Hills 0.46Unincorporated/Forest Preserve 0.28TABLE 3.18.2Land Use Distribution for Lucas DitchLand Use Category Area (acres) %Residential 961.7 55.6The Lucas Ditch drainage system interacts withthe Lucas Diversion Ditch drainage system to theeast. No natural divide separates the manmadeLucas and Lucas Diversion Ditches, and the twodrainage systems were modeled as hydraulicallyconnected by overland flow during significantstorms. Roberts Road forms the boundary betweenForest/Open LandInstitutionalCommercial/Industrial<strong>Water</strong>/WetlandTransportation/Utility484.7187.790.63.31.92810.95.20.20.1the tributary areas <strong>of</strong> Lucas Ditch and Lucas Diversion Ditch. Roughly 577 acres <strong>of</strong> theLucas Ditch watershed drains into the Roberts Road storm sewer at its intersection with 99thStreet, and ultimately to Stony Creek. An overflow outlet at 101st Street discharges to theheadwaters <strong>of</strong> Lucas Ditch. Figure 3.18.1 provides an overview <strong>of</strong> the tributary area <strong>of</strong> the subwatershed.Reported stormwater problem areas, flood inundation areas, and proposed alternativeprojects are also shown on the figure, and are discussed in the following subsections.3.18.1 Sources <strong>of</strong> Data3.18.1.1 Previous StudiesThe following studies relevant to parts <strong>of</strong> the Lucas Ditch drainage system were reviewedand considered as a part <strong>of</strong> the <strong>Cal</strong>umet-<strong>Sag</strong> Channel <strong>DWP</strong> development.Drainage Investigation: Patrick Engineering (2006) / Cook County Highway Department: Study<strong>of</strong> Roberts Road Storm Sewer from Archer Avenue to 111th Street. The study <strong>of</strong> the RobertsRoad storm sewer found the sewer significantly undersized through Palos Hills, which resultedin pavement flooding. Significant <strong>of</strong>fsite flows are generated from the upstream parts<strong>of</strong> the Lucas Ditch watershed, contributing to the frequent surcharge <strong>of</strong> the sewer. The reportrecommended increasing the size <strong>of</strong> parts <strong>of</strong> the storm sewer from 84 to 96 inches. Thisproposed improvement has not been implemented.3-93
CALUMET-SAG DETAILED WATERSHED PLANDetention Study: Knight Infrastructure Cook County Highway Department and Illinois Department<strong>of</strong> Natural Resources: Study <strong>of</strong> Proposed Detention. This study examined the effect <strong>of</strong>two proposed stormwater detention basins on flooding problems in the upstream part <strong>of</strong> theLucas Ditch watershed. It recommends a project to expand a detention pond at 96th Streeteast <strong>of</strong> 88th Avenue from 2.2 to 4.4 acre-feet. A detention basin is proposed on a 0.9-acre siteat the intersection <strong>of</strong> 88th Avenue and 99th Street. Gabion basket check dams are proposedin the Forest Preserve to retard flows discharging to the Roberts Road Storm sewer and toreduce streambank erosion.3.18.1.2 <strong>Water</strong> Quality DataThe IEPA does not have any sites in the Ambient <strong>Water</strong> Quality Monitoring Network on theLucas Ditch. No reaches are identified as impaired in the IEPA’s 2008 Integrated <strong>Water</strong> QualityReport, which includes the CWA 303(d) and 305(b) lists. No TMDLs have been established forthe Lucas Ditch. According to a USEPA water permit discharge query, there are no NPDESpermits issued by IEPA for discharges to Lucas Ditch. Municipalities discharging to the LucasDitch are regulated by IEPA’s NPDES Phase II Stormwater Permit Program, which was createdto improve the water quality <strong>of</strong> stormwater run<strong>of</strong>f from urban areas, and requires thatmunicipalities obtain permits for discharging stormwater and implement the six minimumcontrol measures for limiting run<strong>of</strong>f pollution to receiving systems.3.18.1.3 Wetland and Riparian AreasFigures 2.3.6 and 2.3.7 contain mapping <strong>of</strong> wetland and riparian areas in the <strong>Cal</strong>umet-<strong>Sag</strong>Channel <strong>Water</strong>shed. Wetland areas were identified using National Wetlands Inventory (NWI)mapping. NWI includes roughly 17.6 acres within the Lucas Ditch subwatershed. Riparian areasare defined as vegetated areas between aquatic and upland ecosystems adjacent to a waterwayor body <strong>of</strong> water that provides flood management, habitat, and water qualityenhancement. Identified riparian environments <strong>of</strong>fer potential opportunities for restoration.3.18.1.4 Floodplain MappingFlood inundation areas supporting the National Flood Insurance Program (NFIP) were revisedin 2008 as a part <strong>of</strong> FEMA’s Map Modernization Program. Floodplain boundaries wererevised based upon updated Cook County topographic information; however, the effectivemodels, which are used to estimate flood levels, were generally not updated. Localized Letters<strong>of</strong> Map Revisions (LOMRs) were incorporated into revised floodplain areas. The originalFEMA hydrologic and hydraulic modeling was performed in 1979 using HEC-1 and WSP-2.Appendix A includes a comparison <strong>of</strong> FEMA’s effective floodplain mapping from updatedDFIRM panels with inundation areas developed for the <strong>DWP</strong>.3.18.1.5 Stormwater Problem DataCommunities, agencies (IDOT, CCHD), and stakeholders submitted <strong>District</strong> Form B questionnaireresponse data to the <strong>District</strong> summarizing known stormwater problems within their jurisdictions.Stormwater problems were classified as regional or local based upon the criteriadescribed in Section 1.4 <strong>of</strong> the report. Table 3.18.3 summarizes the Form B data for Lucas Ditch.3-94
3. TRIBUTARY CHARACTERISTICS AND ANALYSIS3.18.1.6 Near-Term Planned Projects<strong>Water</strong>shed communities, agencies, and stakeholders were asked about near-term plannedprojects so that the implementation <strong>of</strong> near-term flood control projects by others is consideredin development <strong>of</strong> the <strong>DWP</strong>. No near-term planned projects by others have been identifiedfor the Lucas Ditch subwatershed.TABLE 3.18.3Community Response Data for Lucas DitchProblemIDMunicipalityProblems asReported byLocal AgencyLocationProblemDescriptionLocal/RegionalResolutionin <strong>DWP</strong>HH6 Hickory Hills Overbankflooding,basementflooding,ponding,bank erosion95th St. at84th Ct.(FlamingoApartments)Run<strong>of</strong>f from forestpreserves exceedsoutflow drains andresults in floodingtwo apartment buildingsto the first floor.Erosion on forestpreserve property.LocalBuilding not identifiedas at imminentrisk per field visit tolocation. Reportedflooding upstream<strong>of</strong> modeled waterway.This is a localproblem.PHI2 Palos Hills Ponding,storm sewercapacity82ndAvenueand EleanorAvenueSedimentation inLucas Ditch upstream<strong>of</strong> 103rd St.restricts Lucas Ditchcapacity.RegionalProject LUDT-7address sedimentationin this area.Sufficient land wasnot available toaddress all floodingin this area.Such propertiesare candidates forprotection usingnonstructural floodcontrol measures,such as floodpro<strong>of</strong>ingor acquisition.PHI3 Palos Hills Overbankflooding,basementflooding,bank erosion111thStreet and86thAvenue(11118SpathisDrive)Lucas Ditch floodsadjacent buildingswhen Stony Creek ishigh, sometimes resultingin erosion aswell. Former studyrecommended buildinga levee wall toisolate the floodplain.RegionalProject LUDT-5 willprotect propertiesfrom floodingPHI6 Palos Hills Bank erosion,sedimentation101stStreet andRobertsRoadDebris at upstreamend <strong>of</strong> culvert, farupstream portion <strong>of</strong>Lucas Ditch, whereit crosses RobertsRoad.LocalAlthough this is alocal problem, it isaddressed as part<strong>of</strong> dredging projectLUDT-73-95
CALUMET-SAG DETAILED WATERSHED PLANTABLE 3.18.3Community Response Data for Lucas DitchProblemIDMunicipalityProblems asReported byLocal AgencyLocationProblemDescriptionLocal/RegionalResolutionin <strong>DWP</strong>PHI7 Palos Hills Overbankflooding,ponding88thAvenueand 99thStreetLocalized flooding insewered headwaters<strong>of</strong> Lucas Ditch.Previous studieshave identified needfor additional storageand increasedconveyance.LocalNot addressed in<strong>DWP</strong>. CCHD hasproposed plan toaddress problemsat this location.PHI8 Palos Hills Overbank flooding,stormsewer capacity,bank erosion,wetland riparian96th Streetand ArrowheadDriveFlooding and erosionproblems due to highflows. The buildingsthreatened by erosionare actually in HickoryHills.LocalNot addressed in<strong>DWP</strong>. CCHD hasproposed plan toaddress problemsat this location.3.18.2 <strong>Water</strong>shed Analysis3.18.2.1 Hydrologic Model DevelopmentSubbasin Delineation. The Lucas Ditch tributary area was delineated based primarily uponLiDAR topographic data developed by Cook County in 2003. The initial delineation based ontopographic data was then reviewed and modified to reflect manmade alterations to the watershedin some locations where storm sewer data was available. One specific example <strong>of</strong>these modifications includes changes made to direct flows from the Hickory Hills CountryClub and upstream areas to drain into the Roberts Road storm sewer at 98th Place.Fourteen subbasins were delineated for the Lucas Ditch tributary area, with an average subbasinarea <strong>of</strong> 124 acres and a total drainage area <strong>of</strong> 2.7 square miles.Hydrologic Parameter <strong>Cal</strong>culations. CNs were estimated for each subbasin based upon NRCSsoil data and 2001 CMAP land use data. This method is further described in Section 1.3.2,with lookup values for specific combinations <strong>of</strong> land use and soil data presented in AppendixC. An area-weighted average <strong>of</strong> the CN was generated for each subbasin.The lag time, used to convert excess precipitation into a run<strong>of</strong>f hydrograph, was assumed tobe 0.6 times the time <strong>of</strong> concentration for all subbasins. The time <strong>of</strong> concentration, or time <strong>of</strong>travel from the hydrologically most distant part <strong>of</strong> the subbasin, was estimated by usingstandard procedures assuming a length <strong>of</strong> sheet flow, shallow concentrated flow, and channelflow. In some instances, modification to parameter estimates was necessary to more accuratelycharacterize very flat or heavily sewered subwatersheds. Appendix G provides asummary <strong>of</strong> the hydrologic parameters used for subbasins in each subwatershed.Flow Diversions. The Roberts Road storm sewer has a hydraulic capacity <strong>of</strong> 384 cfs (PatrickEngineering, 2006), and an overflow outlet into Lucas Ditch at 101st Street. A simplified hydraulicmodel <strong>of</strong> the portion <strong>of</strong> the Roberts Road storm sewer south <strong>of</strong> 98th Street was constructedusing information from the Patrick Engineering study, with one outlet to StonyCreek and another representing the overflow to Lucas Ditch. The 500-year flow produced in3-96
3. TRIBUTARY CHARACTERISTICS AND ANALYSISthe 577-acre area within Lucas Ditch tributary to the storm sewer was input into the model,producing a diversion rating curve into Lucas Ditch when the inflow exceeds the capacity <strong>of</strong>the Roberts Road storm sewer. Although not fully representing the dynamics <strong>of</strong> the RobertsRoad storm sewer, this method <strong>of</strong> developing a flow diversion curve is believed to more accuratelyrepresent the system hydraulics than more simplified methods, such as taking theratio <strong>of</strong> the pipe cross-sectional area to divert flow. This diversion curve was used for allstorms to split flow between Lucas Ditch and the Roberts Road sewer.3.18.2.2 Hydraulic Model DevelopmentField Data, Investigation, and Existing Model Data. No hydraulic models that met <strong>District</strong> criteria,as identified in Section 6.3.3.2 <strong>of</strong> the CCSMP, were available for <strong>DWP</strong> development.Surveys <strong>of</strong> the open channel part <strong>of</strong> Lucas Ditch and all crossings were performed to characterizethe channel and near overbank channel geometry. Cross-sectional geometry in thenon-surveyed overbank area was obtained from Cook County topographic data and combinedwith the surveyed channel cross section. Field visits were performed to assess channeland overbank roughness characteristics, which were combined with information from photographsand aerial photography to assign modeled Manning’s n roughness coefficientsalong the modeled stream length.Boundary Conditions. The Lucas Ditch model was run as a component <strong>of</strong> the larger StonyCreek hydraulic model, with downstream boundary conditions defined by Stony CreekWSELs. A lateral structure representing the overland flow path between Lucas Ditch andLucas Diversion Ditch was defined using a weir height <strong>of</strong> 594 feet, based upon topographyin the area. This lateral structure allows interbasin flow between Lucas Ditch and Lucas DiversionDitch if WSELs exceeds the overland flow height and a head differential exists betweenthe two waterways.3.18.2.3 <strong>Cal</strong>ibration and VerificationNo measured or observed flows or stage data was available for Lucas Ditch for comparisonwith modeled values. Lucas Ditch is tributary to Stony Creek, which was calibrated usinghigh-water mark elevation data. Curve numbers were reduced by 10 percent for existing andalternative conditions analysis based upon the calibration <strong>of</strong> streams with monitoring dataas described in Section 1.3.8.3.18.2.4 Existing Conditions EvaluationFlood Inundation Areas. Figure 3.18.1 shows inundation areas produced by the <strong>DWP</strong>’s hydraulicmodel for the 100-year, 12-hour duration design storm.Hydraulic Pr<strong>of</strong>iles. Appendix H contains hydraulic pr<strong>of</strong>iles <strong>of</strong> existing conditions in the LucasDitch system. Pr<strong>of</strong>iles are shown for the 2-, 5-, 10-, 25-, 50-, 100-, and 500-year recurrenceinterval design storms.3-97
CALUMET-SAG DETAILED WATERSHED PLAN3.18.3 Development and Evaluation <strong>of</strong> Alternatives3.18.3.1 Modeled Problem DefinitionHydraulic model results were reviewed with inundation mapping to identify locationswhere property damage due to flooding is predicted. Table 3.18.4 summarizes problem arealocations identified through modeling.TABLE 3.18.4Modeled Problem Definition for Lucas DitchProblemIDLocationRecurrenceInterval <strong>of</strong>Flooding (yr) Associated Form B Resolution in <strong>DWP</strong>MPA12MPA13MPA14Between 103rd Street and105th Street, and 83rd Avenueand 84th StreetArea bounded by 103rd Street,Lucas Ditch, and Roberts RoadBetween 111th Street andWest Stony Creek Confluence50, 100 PHI2 Project LUDT-7 addressesflooding inthis area.25, 50, 100 Project LUDT-7 addressesflooding inthis area.50, 100 PHI3 Project LUDT-5 addressesflooding inthis area.3.18.3.2 Damage AssessmentDamages due to flooding were calculated for Lucas Ditch in accordance with the methodologydescribed in Section 1.4 and are summarized in Table 3.18.5.3.18.3.3 Technology ScreeningFlood control technologies werescreened to identify those most appropriatefor addressing the flooding problemsalong Lucas Ditch. Stormwaterdetention was identified as an integralcomponent <strong>of</strong> any damage reductionstrategy, with conveyance improvements,and levees (in the downstreampart <strong>of</strong> Lucas Ditch) also potentially feasibletechnologies for addressing floodTABLE 3.18.5Estimated Damages for Lucas DitchDamageCategoryEstimatedDamage ($)Property 1,038,300Erosion 0damages along Lucas Ditch. It is noted that conveyance improvement alternatives wouldrequire storage, either within the Lucas Ditch watershed or downstream in the Stony Creekcorridor to avoid negative downstream impact.NoteTransportation 155,700 Assumed as 15% <strong>of</strong>property damage (excludingdamaged parcelsat the confluence)Recreation 03.18.3.4 Alternative DevelopmentStormwater improvement alternatives were developed to address flooding problems in LucasDitch and adjacent Lucas Diversion Ditch, which are hydraulically connected during heavystorms. The alternatives listed in Table 3.18.6 have a primary benefit in Lucas Ditch, thoughmay result in additional damage reductions along the Lucas Diversion Ditch. For this reason,3-98
3. TRIBUTARY CHARACTERISTICS AND ANALYSISbenefits are presented for Lucas Diversion Ditch as well. Flood control alternatives are listedin Table 3.18.6. No erosion control alternatives were developed for Lucas Ditch.TABLE 3.18.6Flood Control Alternatives for Lucas DitchAlternative Location DescriptionLUDT-1LUDT-2LUDT-3LUDT-4LUDT-5LUDT-6LUDT-7Hickory HillsGolf CourseHickory HillsGolf CourseFrom LucasDitch to StonyCreek along83rd Avenueand PalosDriveFrom LucasDitch to StonyCreek along83rd Avenueand PalosDriveLucas Ditchand WestStony CreekconfluenceLucas Ditchupstream <strong>of</strong>103rd StreetLucas Ditchupstream <strong>of</strong>103rd Streetand HickoryHills GolfCourseExcavate roughly 60 acre-feet <strong>of</strong> storage to reduce discharge to Roberts RoadStorm Sewer/Lucas Ditch.Impound roughly 60 acre-feet <strong>of</strong> storage on to reduce discharge to RobertsRoad Storm Sewer/Lucas Ditch.Construct 96-inch channel diversion to increase conveyance from Lucas Ditchto Stony Creek. Construct 28 ac-ft detention basin.Construct 96-inch channel diversion to increase conveyance from Lucas Ditchto Stony Creek. Impound roughly 60 acre-feet <strong>of</strong> storage on Hickory Hills GolfCourseConstruct levee to restrict floodwaters from inundating structures east <strong>of</strong> LucasDitch at Stony Creek confluence. Construct roughly 9.5 ac-ft <strong>of</strong> compensatorystorage.Dredge Lucas Ditch upstream <strong>of</strong> 103rd Street, combined with 96-inch channeldiversion to Stony CreekDredge Lucas Ditch upstream <strong>of</strong> 103rd Street and impound roughly 60 acrefeet<strong>of</strong> storage on Hickory Hills Golf Course to reduce discharge to RobertsRoad Storm Sewer/Lucas Ditch3.18.3.5 Alternative Evaluation and SelectionBoth LUDT-1 and LUDT-2 propose stormwater detention volumes <strong>of</strong> roughly 60 acre-feet torelieve flooding in both the Lucas Ditch and Lucas Diversion Ditch subwatersheds and RobertsRoad corridor. LUDT-1 is significantly more expensive to construct, because <strong>of</strong> the cost<strong>of</strong> excavating a significant quantity <strong>of</strong> overburden material above the proposed overflowelevation (624 feet for LUDT-1) to obtain the necessary storage volume. Roughly 2 cubicyards <strong>of</strong> land must be excavated for each cubic yard <strong>of</strong> storage obtained in the area. LUDT-2, shown in Figure 3.18.2, requires more land acquisition but uses the natural topography <strong>of</strong>the area to provide the necessary storage volume. Roughly 8 acre-feet <strong>of</strong> excavation is includedin this alternative to obtain fill material to for the earthen dam used to retain floodwaters.Both alternatives assume availability <strong>of</strong> land at the Hickory Hills Country Club. Itmay be found that this volume <strong>of</strong> detention, required to reduce the damages indicated inTable 3.18.5, is obtainable in locations other than the Hickory Hills Country Club.Costs associated with the impoundment <strong>of</strong> flows at the Hickory Hills Country Club may notreflect all engineering costs associated with regulations <strong>of</strong> dam design and construction.3-99
CALUMET-SAG DETAILED WATERSHED PLANBoth LUDT-1 and LUDT-2 are ideally located to intercept significant flows that contribute t<strong>of</strong>looding in Lucas Ditch, and to a lesser extent Lucas Diversion Ditch, as well as the undersizedstorm sewer beneath Roberts Road. Damages associated with storm sewer systemssuch as Roberts Road are local and are not included in regional damages.LUDT-3 proposes a 96-inch channel diversion to divert some flows from Lucas Ditch southto Stony Creek along 83rd Court and Palos Lane. Approximately 28 ac-ft <strong>of</strong> detention is alsoincluded in this alternative, so that increased flow into Stony Creek does not adversely impactproperties adjacent to Stony Creek. Although water surfaces are lowered substantially,the only property damage due to flooding predicted in this area is near MPA12, comprisinga relatively small fraction <strong>of</strong> overall Lucas Ditch damages. LUDT-4 combines the channeldiversion from alternative LUDT-3 with the storage associated with alternative LUDT-2, resultingin more significant damage reduction than either alternative individually. Regulatoryapproval from regulatory agencies such as IDNR and the USACE would be requiredfor LUDT-3 or LUDT-4. The increased conveyance would involve a new outfall with additionalflow to Stony Creek. Other alternatives recommended in the <strong>DWP</strong> within the StonyCreek subwatershed include storage and will result in lower peak flow rates on Stony Creekfollowing implementation. All flows from individual tributaries are relatively small in comparisonto total flow within the <strong>Cal</strong>umet-<strong>Sag</strong> Channel.LUDT-5 protects several parcels at the confluence <strong>of</strong> Lucas Ditch with Stony Creek that arepredicted to be inundated during minor storms and to have flood depths up to 2.49 feet forthe 100-year storm. Construction <strong>of</strong> a levee along the east bank <strong>of</strong> Stony Creek is recommendedto protect the structures from inundation. Since inundation in the area is a result <strong>of</strong>backwater from Stony Creek, the construction <strong>of</strong> a levee does not raise upstream stages onLucas Ditch. To compensate for loss <strong>of</strong> current floodplain storage, the conceptual cost estimatefor LUDT-5 includes roughly 9.5 acre-feet <strong>of</strong> storage upstream in the Stony Creek watershed.Interior drainage behind the proposed levee was assumed to need a dischargecapacity roughly equal to 10 acre-feet in a 24-hour period.LUDT-6 includes the dredging <strong>of</strong> Lucas Ditch upstream <strong>of</strong> 103rd Street. Sedimentation hasreduced culvert openings and decreased channel capacity in Lucas Ditch north <strong>of</strong> 103rdStreet by 1 to 1.5 feet, according to the field survey. Initial model runs including solely adredging component reduced water surface elevation north <strong>of</strong> 103rd Street, however increasedflows and predicted water surface levels downstream. Therefore, it was necessaryeither to reduce upstream flows by storage, or to increase downstream conveyance also toavoid exacerbating downstream flooding. LUDT-6 includes LUDT-3 with the channel diversionproposed in LUDT-3. LUDT-7 pairs the channel dredging component <strong>of</strong> LUDT-6 withthe storage on Hickory Hills golf course proposed in LUDT-2.LUDT-5, shown in Figure 3.18.3, is recommended to address significant predicted damagesat the confluence <strong>of</strong> Lucas Ditch with Stony Creek. LUDT-7 is recommended to reduceflooding damages in Lucas Ditch and Lucas Diversion Ditch, including potential local benefitsin the Roberts Road corridor, and to help reduce overbank flooding in Lucas Ditch upstream<strong>of</strong> 103rd street. The land necessary for construction <strong>of</strong> detention basin on the HickoryHills golf course may not be currently available for use as a stormwater facility, howevershould be considered for this purpose in the event <strong>of</strong> future development, given its ideal locationto intercept flows to an area with significant damages.3-100
3. TRIBUTARY CHARACTERISTICS AND ANALYSISTABLE 3.18.7Lucas Ditch Existing and Alternative Condition Flow and WSEL ComparisonExisting ConditionsLUDT-7LocationStation100 YrWSEL (ft)Max Flow(cfs)100 YrWSEL (ft)Max Flow(cfs)Roughly 200-ft downstream <strong>of</strong>Roberts Road 10561.6 593.12 143.31 592.87 92.92Roughly 300-ft downstream <strong>of</strong>82nd Ave. 8968.99 591.94 174.39 591.13 123.16Roughly 200-ft downstream <strong>of</strong>103rd St. 7650.485 591.15 209.64 590.54 140.01Just upstream <strong>of</strong> Winter Park Dr. 4719 589.90 282.31 589.41 250.02Roughly 230-ft downstream <strong>of</strong>107th St. 3251.408 588.71 298.07 588.41 263.77Roughly 250-ft upstream <strong>of</strong> theconfluence with West StonyCreek 343.5076 587.43 372.29 587.35 310.19Recommended alternatives result in reduced stage and/or flow along the modeled waterway.Table 3.18.7 provides a comparison <strong>of</strong> the modeled maximum WSEL, and modeledflow at the time <strong>of</strong> peak at representative locations along the waterway. LUDT-5, althoughrecommended, is not included in this table because it results in no impact on the water surfaceelevations.A number <strong>of</strong> properties are at risk <strong>of</strong> shallow flooding during the 100-year flood event underexisting conditions or recommended alternative conditions. In addition, due to their locations,other properties' risk <strong>of</strong> flooding cannot be feasibly mitigated by structuralmeasures. Such properties are candidates for protection using nonstructural flood controlmeasures, such as flood-pro<strong>of</strong>ing or acquisition. These measures may be considered to addressdamages that are not fully addressed by capital projects recommended in the <strong>Cal</strong>umet-<strong>Sag</strong>Channel <strong>DWP</strong>.3.18.3.6 Data Required for Countywide Prioritization <strong>of</strong> <strong>Water</strong>shed ProjectsAppendix I presents conceptual level cost estimates for the recommended alternatives. Table3.18.8 lists alternatives analyzed in detail. Based on a comparison <strong>of</strong> B/C ratios, the recommendedalternatives are LUDT-5 and LUDT-7, and are shown in Figures 3.18.2 and3.18.3. A comparison <strong>of</strong> the existing conditions and alternative conditions inundation mappingis included in these figures.3-101
CALUMET-SAG DETAILED WATERSHED PLANTABLE 3.18.8Lucas Ditch Project Alternative Matrix to Support <strong>District</strong> CIP PrioritizationProjectDescriptionB/CRatioNet Benefits($)Total ProjectCost ($)CumulativeStructuresProtectedFundingPossibilities<strong>Water</strong>QualityBenefitRecommendedCommunities InvolvedLUDT-1Storage on HickoryHills golf course createdby excavation0.02 276,200 12,584,400 49 SlightlyPositiveNoHickory Hills, PalosHills, BridgeviewLUDT-2Storage on HickoryHills golf course createdby impoundment0.06 276,200 4,282,700 49 SlightlyPositiveNoHickory Hills, PalosHills, BridgeviewLUDT-396-inch channel diversionto Stony Creek0.01 75,000 6,720,300 9 SlightlyNegativeNoPalos HillsLUDT-4 LUDT-2 and LUDT-3 0.03 259,100 8,080,900 45 NoImpactNoPalos Hills, HickoryHills, BridgeviewLUDT-5Levee at confluencewith Stony Creek, andcompensatory storage0.27 845,200 3,136,900 4 NoImpactYesPalos HillsLUDT-6Dredging upstream <strong>of</strong>103rd Street combinedwith 96-inch channeldiversion beneath PalosLane0.02 144,500 6,910,300 26 NoImpactNoPalos Hills, HickoryHills, BridgeviewLUDT-7Dredge Lucas Ditchupstream <strong>of</strong> 103rdStreet and provideroughly 60 ac-ft <strong>of</strong> detentionon Hickory Hillsgolf course0.08 340,200 4,472,600 54 SlightlyPositiveYesPalos Hills, HickoryHills, BridgeviewNote: Net Benefits values do not include local benefits or non-economic benefits.3-102
3. TRIBUTARY CHARACTERISTICS AND ANALYSIS3.19 Lucas Diversion DitchThe area tributary to Lucas Diversion Ditch is generallyflat and drained almost entirely by storm sewers.Interpretation <strong>of</strong> storm sewer data was used inconjunction with topographic data to define thesubwatershed boundaries with 71st Street Ditch tothe north, Melvina Ditch to the east, and Lucas Ditchto the west. Table 3.19.1 summarizes the communitiesthat drain to the Lucas Diversion Ditch.The 3.4 square miles tributary area to Lucas DiversionDitch is heavily developed, with predominantlyresidential and commercial/industrial development.Table 3.19.2 summarizes the land use distributionwithin the Lucas Diversion Ditch subwatershed.The drainage system <strong>of</strong> Lucas Diversion Ditch is interconnectedwith the Lucas Ditch system. No natural divideseparates the manmade Lucas and LucasDiversion Ditches, and the two drainage systems weremodeled as hydraulically connected by overland flowduring significant storms. Roberts Road was defined asthe boundary between the tributary areas <strong>of</strong> LucasDitch and Lucas Diversion Ditch.TABLE 3.19.1Communities Draining to Lucas Diversion DitchCommunityTributaryArea (mi 2 )Bridgeview 1.89Hickory Hills 0.96Palos Hills 0.38Justice 0.1Oak Lawn 0.05Chicago Ridge 0.03TABLE 3.19.2Land Use Distribution for Lucas Diversion DitchAreaLand Use Category (acres) %Residential 1,043.8 47.8Commercial/Industrial 636.7 29.2Transportation/Utility 212 9.7Forest/Open Land 208 9.5Institutional 73.8 3.4I-294 bisects the Lucas Diversion Ditch watershed,<strong>Water</strong>/Wetland 7.1 0.3providing a barrier to stormwater run<strong>of</strong>f tributary tothe Lucas Diversion Ditch. A large part <strong>of</strong> the area north <strong>of</strong> the I-294 collects stormwater run<strong>of</strong>fthrough storm sewers up to 72 inches in diameter that discharge into two detention pondsnortheast <strong>of</strong> the intersection <strong>of</strong> 95th Street and I-294. A storm sewer discharges from the detentionponds to Lucas Diversion Ditch. Additional flows from the area north <strong>of</strong> I-294 drainsouth through either the Harlem Avenue storm sewer or overland flow routes into StonyCreek. Figure 3.19.1 provides an overview <strong>of</strong> the tributary area <strong>of</strong> the subwatershed. Reportedstormwater problem areas, flood inundation areas, and proposed alternative projects are alsoshown on the figure, and are discussed in the following subsections.3.19.1 Sources <strong>of</strong> Data3.19.1.1 Previous StudiesNo studies <strong>of</strong> Lucas Diversion Ditch were found to exist. An ongoing study being performedby Robinson Engineering was identified in the community response data fromBridgeview, but the study report was not obtained. The IDOT study, Strategic Planning Studyfor Flood Control, Justice, (1980) and the Patrick Engineering Roberts Road Drainage Investigationstudy (2006) were both useful in confirming drainage patterns at boundaries <strong>of</strong> theLucas Diversion Ditch subwatershed.3-103
CALUMET-SAG DETAILED WATERSHED PLANThe Patrick Engineering study found the Roberts Road storm sewer to be significantly undersizedthrough Palos Hills and to cause pavement flooding. Significant <strong>of</strong>fsite flows are generatedfrom the upstream part <strong>of</strong> the Lucas Ditch <strong>Water</strong>shed, contributing to the frequentsurcharge <strong>of</strong> this sewer. The report recommended upsizing parts <strong>of</strong> the Roberts Road stormsewer from 84 to 96 inches. The proposed improvement has not yet been implemented.3.19.1.2 <strong>Water</strong> Quality DataThe IEPA does not have any sites in the Ambient <strong>Water</strong> Quality Monitoring Network onLucas Diversion Ditch. There are also no reaches identified as impaired in the IEPA’s 2008Integrated <strong>Water</strong> Quality Report, which includes the CWA 303(d) and 305(b) lists. No TMDLshave been established for Lucas Diversion Ditch. According to a USEPA water permit dischargequery, no NPDES permits were issued by IEPA for discharges to Lucas DiversionDitch. Municipalities discharging to Lucas Diversion Ditch are regulated by IEPA’s NPDESPhase II Stormwater Permit Program, which was created to improve the water quality <strong>of</strong>stormwater run<strong>of</strong>f from urban areas, and requires that municipalities obtain permits for dischargingstormwater and implement the six minimum control measures for limiting run<strong>of</strong>fpollution to receiving systems.3.19.1.3 Wetland and Riparian AreasFigures 2.3.6 and 2.3.7 contain mapping <strong>of</strong> wetland and riparian areas in the <strong>Cal</strong>umet-<strong>Sag</strong>Channel <strong>Water</strong>shed. Wetland areas were identified using National Wetlands Inventory (NWI)mapping. NWI data include roughly 11.9 acres <strong>of</strong> wetland areas in the Lucas DiversionDitch subwatershed Riparian areas are defined as vegetated areas between aquatic and uplandecosystems adjacent to a waterway or body <strong>of</strong> water that provides flood management, habitat,and water quality enhancement. Identified riparian environments <strong>of</strong>fer potential opportunitiesfor restoration.3.19.1.4 Floodplain MappingFlood inundation areas supporting the National Flood Insurance Program (NFIP) were revisedin 2008 as a part <strong>of</strong> FEMA’s Map Modernization Program. Floodplain boundaries wererevised based upon updated Cook County topographic information; however, the effectivemodels, which are used to estimate flood levels, were generally not updated. Localized Letters<strong>of</strong> Map Revisions (LOMRs) were incorporated into revised floodplain areas. The originalFEMA hydrologic and hydraulic analysis was performed in 1979 using HEC-1 and HEC-RAS.Appendix A includes a comparison <strong>of</strong> FEMA’s effective floodplain mapping from updatedDFIRM panels with inundation areas developed for the <strong>DWP</strong>.3.19.1.5 Stormwater Problem DataCommunities, agencies (e.g., IDOT, CCHD), and stakeholders submitted Form B questionnaireresponse data to the <strong>District</strong> summarizing known stormwater problems within theirjurisdictions. Community response data from Bridgeview, Palos Hills, and Hickory Hillswere used to help define stormwater problems related to Lucas Diversion Ditch. Problemswere classified as local or regional based upon the criteria described in Section 1. Table3.19.3 provides a summary <strong>of</strong> Form B data for Lucas Diversion Ditch.3-104
3. TRIBUTARY CHARACTERISTICS AND ANALYSIS3.19.1.6 Near-Term Planned Projects<strong>Water</strong>shed communities, agencies, and stakeholders were asked about near-term plannedprojects so that the implementation <strong>of</strong> near-term flood control projects by others is consideredin development <strong>of</strong> the <strong>DWP</strong>. No near-term planned projects by others have been identifiedfor the Lucas Diversion Ditch subwatershed.3.19.2 <strong>Water</strong>shed Analysis3.19.2.1 Hydrologic Model DevelopmentSubbasin Delineation. The Lucas Diversion Ditch tributary area was delineated based uponLiDAR topographic data developed by Cook County in 2003. Twenty-five subwatersheds areaswere defined with an average size <strong>of</strong> 87.6 acres. The topographic delineation was reviewedand modified in some locations to reflect manmade alterations to the watershed. Thedelineation was modified at the crossing <strong>of</strong> Harlem Avenue and I-294 to allow the upstreampart <strong>of</strong> Lucas Diversion Ditch watershed to drain to Stony Creek.TABLE 3.19.3Community Response Data for Lucas Diversion DitchProblemIDMunicipalityProblems asReported byLocal Agency Location Problem DescriptionLocal/RegionalResolutionin <strong>DWP</strong>BV1 Bridgeview Overbankflooding,pavementflooding,storm sewercapacityRoute 43(HarlemAve.) at86th St.IDOT reported floodingproblems (southbound)LocalProblem not locatedalong a regionalwaterway.BV2 Bridgeview Basementflooding,ponding,storm sewercapacity100th Pl.between76th Ave.and HarlemAve.Excessive ponding occursat 100th Pl. between76th Ave. andHarlem Ave. due todrainage problems.LocalAlthough this is alocal problem, itmay benefit fromproject LDDT-3.BV5Bridgeview,ChicagoRidgePavementfloodingRoute 43(HarlemAve.) atI-94IDOT reported pavementflooding.LocalProblem not locatedalong a regionalwaterway.HH1Hickory Hills Overbankflooding,basementflooding,ponding,bank erosion,maintenance98th St. at7700 WestDrainage ditches haveinsufficient capacity toconvey storm flows, resultingin ponding andbasement flooding. Possiblemaintenance issuesrelated to Lucas Ditch.RegionalProject LDDT-3will lower waterelevations indownstream waterwayfor localsewers in thisarea.HH4Hickory Hills Basementflooding,ponding,storm sewercapacityRobertsRd. between90thand 95thStreetsRoberts Road storm sewerhas insufficient capacity toconvey moderate floods.Cook County will not allowadditional connections tothe Robert Rd. stormsewer.LocalLUDT-7 will increaseconveyance<strong>of</strong> overflow fromRoberts Rd. sewer.3-105
CALUMET-SAG DETAILED WATERSHED PLANTABLE 3.19.3Community Response Data for Lucas Diversion DitchProblemIDMunicipalityProblems asReported byLocal Agency Location Problem DescriptionLocal/RegionalResolutionin <strong>DWP</strong>PHI1 Palos Hills Overbankflooding,basementflooding,ponding100th Pl.and 78thAve.Lucas Diversion Ditch hasinsufficient capacity, overflowinginto existing undersizeddetention areaand nearby homes.RegionalProject LDDT-3provides stormwaterdetention toaddress problem.Sufficient landwas not availableto address allflooding in thisarea. Such propertiesare candidatesforprotection usingnonstructuralflood controlmeasures, suchas flood-pro<strong>of</strong>ingor acquisition.PHI4Palos Hills,BridgeviewBasementflooding,ponding,storm sewercapacity,bank erosion,maintenanceLucas DiversionDitch from102ndStreet to105th St.Debris and sedimentbuild up restricts flow inLucas Diversion Ditchcausing basement floodingnorth <strong>of</strong> 103rd St. inBridgeview/ Palos Hills.RegionalLDDT-3 includesclearing/dredgingdownstream <strong>of</strong>103rd Street.PHI6 Palos Hills Bank erosion,sedimentation101st St.and RobertsRd.Debris at upstream end<strong>of</strong> culvert, far upstreampart <strong>of</strong> Lucas Ditch,where it crosses RobertsRd.LocalProblem not locatedalong a regionalwaterway.PHI9Palos Hills,BridgeviewBasementflooding,ponding,storm sewercapacity,bank erosion,maintenanceLucas DiversionDitch from103rd St.to 105thSt.Sediment and debrisbuildup in Lucas DiversionDitchRegionalProject LDDT-3addresses accumulation<strong>of</strong> sedimentand debrisdownstream <strong>of</strong>103rd Street.The northern boundary <strong>of</strong> the Lucas Diversion Ditch tributary area was set at 83rd Street,based upon information from a previous study (IDOT, 1980). The delineation was modifiedalong a part <strong>of</strong> Roberts Road to force flows from the Hickory Hills Country Club and upstreamareas to drain into the Roberts Road storm sewer at 98th Place. The areas are classifiedas being within the Lucas Ditch watershed, but they may drain to Lucas Diversion Ditch duringheavy rainfalls.Hydrologic Parameter <strong>Cal</strong>culations. CNs were estimated for each subbasin based upon NRCSsoil data and 2001 CMAP land use data. This method is described in Section 1.3.2, withlookup values for specific combinations <strong>of</strong> land use and soil data presented in Appendix C.An area-weighted average <strong>of</strong> the CN was generated for each subbasin.3-106
3. TRIBUTARY CHARACTERISTICS AND ANALYSISThe lag time, used to convert excess precipitation into a run<strong>of</strong>f hydrograph, was assumed tobe 0.6 times the time <strong>of</strong> concentration for all subbasins. The time <strong>of</strong> concentration, or time <strong>of</strong>travel from the hydrologically most distant part <strong>of</strong> the subbasin, was estimated by usingstandard procedures assuming a length <strong>of</strong> sheet flow, shallow concentrated flow, and channelflow. In some instances, modification to parameter estimates was necessary to more accuratelycharacterize very flat or heavily sewered subwatersheds. Appendix G provides asummary <strong>of</strong> the hydrologic parameters used for subbasins in each subwatershed.Flow Diversion. Stormwater from north <strong>of</strong> I-294 is understood to drain into the Lucas DiversionDitch through a storm sewer beneath the interstate that discharges from detention pondsnorth <strong>of</strong> the interstate. Inflow into the Lucas Diversion hydraulic model was limited to 80 cfs,based upon the estimated capacity <strong>of</strong> the 60-inch pipe flowing southwest beneath the tollway.Review <strong>of</strong> contour data suggests that excess flow drains beneath the Tri-State Tollway alongHarlem Avenue to the West Branch <strong>of</strong> Stony Creek, either within a storm sewer or overland.3.19.2.2 Hydraulic Model DevelopmentField Data, Investigation, and Existing Model Data. No hydraulic models that met <strong>District</strong> criteria,as identified in Section 6.3.3.2 <strong>of</strong> the CCSMP, were available for <strong>DWP</strong> development. Surveys<strong>of</strong> the open channel part <strong>of</strong> Lucas Ditch and all crossings were performed to characterizethe channel and near overbank channel geometry. Cross-sectional geometry in the nonsurveyedoverbank area was obtained from Cook County topographic data and combined withthe surveyed channel cross section. Field visits were performed to assess channel and overbankroughness characteristics, which were combined with information from photographs and aerialphotography to assign modeled Manning’s n roughness coefficients along the modeledstream length.Boundary Conditions. A lateral structure representing the overland flow path between LucasDitch and Lucas Diversion Ditch was defined using a weir height <strong>of</strong> 594 feet, based upontopography in the area. This lateral structure allows interbasin flow between Lucas Ditchand Lucas Diversion Ditch if WSELs exceed the overland flow height and a head differentialexists between the two waterways.The Lucas Diversion Ditch model was run as a component <strong>of</strong> the larger Stony Creek hydraulicmodel, with downstream water surface defined by the Stony Creek water surfaceelevation.3.19.2.3 <strong>Cal</strong>ibration and VerificationNo measured or observed stages were available for Lucas Diversion Ditch to compare modelresults to observed flows or stage. Lucas Diversion Ditch is tributary to Stony Creek, whichwas calibrated using high-water mark elevation data. Curve numbers were reduced by10 percent for existing and alternative conditions analysis based upon the calibration <strong>of</strong>streams with monitoring data as described in Section 1.3.8.3.19.2.4 Existing Conditions EvaluationFlood Inundation Areas. Figure 3.19.1 shows inundation areas along Lucas Diversion Ditchproduced by the hydraulic model for the 100-year, 12-hour duration design storm.3-107
CALUMET-SAG DETAILED WATERSHED PLANHydraulic Pr<strong>of</strong>ile. Appendix H contains hydraulic pr<strong>of</strong>iles <strong>of</strong> existing conditions in the LucasDiversion Ditch system. Pr<strong>of</strong>iles are shown for the 2-, 5-, 10-, 25-, 50-, 100-, and 500-year recurrenceinterval design storms.3.19.3 Development and Evaluation <strong>of</strong> Alternatives3.19.3.1 Problem DefinitionHydraulic model results were reviewed with inundation mapping to identify locationswhere property damage due to flooding is predicted. Table 3.19.4 summarizes problem arealocations determined through modeling.TABLE 3.19.4Modeled Problem Definition for Lucas Diversion DitchProblemIDLocationRecurrenceInterval <strong>of</strong>Flooding (yr)AssociatedForm BResolution in <strong>DWP</strong>MPA9Roberts Road to Lucas Diversion Ditch,north <strong>of</strong> 103rd Street10, 25, 50, 100 PHI1 Project LDDT-3 addressesflooding inthis area. Sufficientland was not availableto address allflooding in this area.Such properties arecandidates for protectionusing nonstructuralflood controlmeasures, such asflood-pro<strong>of</strong>ing or acquisition.3.19.3.2 Damage AssessmentDamages due to flooding werecalculated for Lucas DiversionDitch in accordance with themethodology described in Section1.4, as summarized in Table3.19.5.3.19.3.3 Technology ScreeningTABLE 3.19.5Estimated Damages for Lucas Diversion DitchDamageCategoryEstimatedDamage ($)Property 1,279,100Erosion 0Flood control technologies were Recreation 0screened to identify those mostappropriate for addressing the flooding problems in the Lucas Diversion Ditch. Stormwaterdetention and conveyance improvements were also identified as potential technologies foraddressing flood damages in Lucas Ditch. It is noted that conveyance improvements wouldrequire storage, either within the Lucas Diversion Ditch watershed or upstream <strong>of</strong> LucasDiversion Ditch’s confluence with Stony Creek, to avoid translating flood problems downstream.NoteTransportation 191,900 Assumed as 15% <strong>of</strong> propertydamage (excluding damagedparcels at the confluence)3-108
3. TRIBUTARY CHARACTERISTICS AND ANALYSISTABLE 3.19.6Flood Control Alternatives for Lucas Diversion DitchAlternative Location DescriptionLDDT-1 ComEd ROW Excavate 17 acre-feet <strong>of</strong> detention at existing baseball diamond.LDDT-2LDDT-3LDDT-4LDDT-5ComEd ROW andalong 76th Avenuenorth <strong>of</strong> 103rdStreetComEd ROW,along 76th Avenuenorth <strong>of</strong> 103rdStreet, and LDDTsouth <strong>of</strong> 103rdStreetComEd ROW andalong 76th Avenuenorth <strong>of</strong> 103rdStreetAlong 76th Avenuenorth <strong>of</strong> 100thPlaceConstruct three detention basins <strong>of</strong> 17, 10, and 36 acre-feet.Construct detention per LDDT-2 along with channel clearing/dredgingdownstream <strong>of</strong> 103rd Street.Construction <strong>of</strong> four detention basins <strong>of</strong> 17, 10, and 36 acre-feet, and 32acre-feet. Construct berm around wetland area in lower Bridgeview area.Construct 36 acre-ft detention basin3.19.3.4 Alternative DevelopmentFlood control alternatives for Lucas Diversion Ditch are listed in Table 3.19.6. No erosioncontrol alternatives were developed for Lucas Diversion Ditch.3.19.3.5 Alternative Evaluation and SelectionLDDT-1 consists <strong>of</strong> increasing the detention from the ComEd right-<strong>of</strong>-way, and converting abaseball field north <strong>of</strong> the property to detention. The alternative was designed to reducedamages from smaller storms causing flood damage (10- to-25-year recurrence interval) andprovides limited benefits for higher magnitude events.LDDT-2 and LDDT-3 provide significantly more stormwater detention in the Lucas DiversionDitch subwatershed. Increasing the available conveyance capacity downstream <strong>of</strong>103rd Street, in combination with increased detention, results in more benefits and a higherbenefit-cost ratio than detention alone. Although LDDT-4 has the highest benefits <strong>of</strong> themodeled alternatives, the benefit-cost ratio is less than that <strong>of</strong> LDDT-3. Two other noneconomicconsiderations prevent the recommendation <strong>of</strong> LDDT-4:• Proposed additional detention on Concord homes property is near a low-lying areawhere Bridgeview experiences flooding problems. The Village has expressed concernwith collecting additional stormwater run<strong>of</strong>f into an already problematic location.• Proposed additional detention on Concord homes property is currently designated aswetland area, and regulation may prohibit significant modification for stormwater detentionpurposes. Palos Hills has noted that the area may be a designated habitat for aspecies <strong>of</strong> snake.3-109
CALUMET-SAG DETAILED WATERSHED PLANFinally, LDDT-5 includes just the 36 ac-ft detention basin proposed on private property nearthe upstream extent <strong>of</strong> Lucas Diversion Ditch. Land availability and/or overall cost may causethis alternative to be more feasible than the set <strong>of</strong> detention basins comprising LDDT-3.The predicted benefits for the Lucas Diversion Ditch alternatives occur predominantly upstream<strong>of</strong> 103rd Street. However, the modeled alternatives also result in reduced downstreamflows, and also have a benefit on Stony Creek.Recommended alternative LDDT-3 results in reduced stage and flow along the modeled waterway.Table 3.19.7 provides a comparison <strong>of</strong> the modeled maximum WSEL, and modeledflow at the time <strong>of</strong> peak at representative locations along the waterway.TABLE 3.19.7Lucas Diversion Ditch Existing and Alternative Condition Flow and WSEL ComparisonExistingConditionsLDDT-3LocationStation100 YrWSEL(ft)MaxFlow(cfs)100 YrWSEL(ft)MaxFlow(cfs)500-ft downstream <strong>of</strong> 76th Ave. 6045 594.60 641.85 594.15 450.05400-ft upstream <strong>of</strong> 103rd St. 4153 594.06 647.37 593.50 458.38Intersection <strong>of</strong> 104th Pl. andVicky Ln.2804 592.27 317.89 591.77 370.69Just upstream <strong>of</strong> 107th St. 1042 591.95 290.51 591.03 379.08A number <strong>of</strong> properties are at risk <strong>of</strong> shallow flooding during the 100-year flood event underexisting conditions or recommended alternative conditions. In addition, due to their locations,other properties' risk <strong>of</strong> flooding cannot be feasibly mitigated by structuralmeasures. Such properties are candidates for protection using nonstructural flood controlmeasures, such as flood-pro<strong>of</strong>ing or acquisition. These measures may be considered to addressdamages that are not fully addressed by capital projects recommended in the <strong>Cal</strong>umet-<strong>Sag</strong>Channel <strong>DWP</strong>.3.19.3.6 Data Required for Countywide Prioritization <strong>of</strong> <strong>Water</strong>shed ProjectsBased upon consideration <strong>of</strong> the B/C ratio and noneconomic criteria, LDDT-3, shown inFigures 3.19.2 is recommended to address damages due to flooding along the Lucas DiversionDitch. The project also has benefits outside the Lucas Diversion Ditch watershed due toreduced flow to Stony Creek. Appendix I presents conceptual level cost estimates for alternativesdiscussed in Section 3.19.3.5. Table 3.19.8 lists the total estimated cost, benefits, andB/C ratio for each alternative. A comparison <strong>of</strong> the existing conditions and alternative conditionsinundation mapping is included in Figure 3.19.2.3-110
3. TRIBUTARY CHARACTERISTICS AND ANALYSISTABLE 3.19.8Lucas Diversion Ditch Project Alternative Matrix to Support <strong>District</strong> CIP PrioritizationProjectDescriptionB/CRatioNet Benefits($)Total ProjectCost ($)CumulativeStructuresProtectedFundingPossibilities<strong>Water</strong> QualityBenefitRecommendedCommunitiesInvolvedLDDT-1One detention basinwith 17 ac-ft <strong>of</strong> storage0.09 160,900 1,883,400 8 SlightlyPositiveNoBridgeview, PalosHillsLDDT-2LDDT-3LDDT-4Three detention basinswith 63 ac-ft <strong>of</strong> storageThree detention basinswith 63 ac-ft <strong>of</strong> storageand channel clearingsouth <strong>of</strong> 103rd St.Four detention basinswith 95 ac-ft <strong>of</strong> storage0.13 848,300 6,325,500 59 SlightlyPositive0.13 885,200 6,765,000 56 SlightlyPositive0.1 1,109,000 11,648,400 65 SlightlyPositiveNoYesNoBridgeview, HickoryHills, PalosHillsBridgeview, HickoryHills, PalosHillsBridgeview, HickoryHills, PalosHillsLDDT-5 36 ac-ft detention basin 0.13 523,300 3,959,300 34 SlightlyPositiveNote: Net Benefits values do not include local benefits or non-economic benefits.NoBridgeview, HickoryHills, PalosHills3-111
3. TRIBUTARY CHARACTERISTICS AND ANALYSIS3.20 Marley CreekMarley Creek is a regional waterway located insouthwestern Cook County, in the southern portion<strong>of</strong> the <strong>Cal</strong>umet-<strong>Sag</strong> Channel <strong>Water</strong>shed.The 9.91-square-mile drainage area includes0.58 square miles <strong>of</strong> drainage area from WillCounty. Table 3.20.1 provides a summary <strong>of</strong> thecommunities within Cook County that drain toMarley Creek. Figure 3.20.1 provides an overview<strong>of</strong> the tributary area <strong>of</strong> the subwatershed.Reported stormwater problem areas, flood inundationareas, and proposed alternative projectsare also shown on the figure, and arediscussed in the following subsections.The Marley Creek subwatershed contains a mix<strong>of</strong> suburban development, open space, and agriculturalarea. Table 3.20.2 summarizes the landuse distribution within the Marley Creek subwatershed.TABLE 3.20.1Communities Draining to Marley CreekCommunityTributaryArea (mi 2 )Orland Park 6.1Unincorporated/Forest Preserve 3.2Orland Hills 0.03Will County 0.58TABLE 3.20.2Land Use Distribution for Marley CreekLand Use Category Area (acres) %Forest/Open Land 1,875 30.0Residential 1,835 29.4Agricultural 1,500 24.0Commercial/Industrial 603 9.63.20.1 Sources <strong>of</strong> Data<strong>Water</strong>/Wetland 316 5.1Institutional 105 1.73.20.1.1 Previous StudiesTransportation/Utility 15 0.2Will County recently created H&H models <strong>of</strong> existing conditions in Marley Creek to examinefloodplain areas and channel improvements for the part <strong>of</strong> Marley Creek in Will County.The extent <strong>of</strong> the H&H model did not contain the part <strong>of</strong> Marley Creek in Cook County, andso it did not contribute directly to the development <strong>of</strong> the <strong>Cal</strong>umet-<strong>Sag</strong> Channel <strong>DWP</strong>.3.20.1.2 <strong>Water</strong> Quality DataThe IEPA does not have any sites in the Ambient <strong>Water</strong> Quality Monitoring Network onMarley Creek. No reaches are identified as impaired in the IEPA’s 2008 Integrated <strong>Water</strong>Quality Report, which includes the CWA 303(d) and 305(b) lists. Lake Sedgewick, which is areservoir draining to the upstream end <strong>of</strong> Marley Creek from the North, is on the IEPA’s303(d) list due to total mercury and TSS. No TMDLs have been established for MarleyCreek. According to a USEPA water permit discharge query, there is an NPDES permit issuedby IEPA to the Andrew Corporation, located in Orland Park, for discharges to MarleyCreek. Municipalities discharging to Marley Creek are regulated by IEPA’s NPDES Phase IIStormwater Permit Program, which was created to improve the water quality <strong>of</strong> stormwaterrun<strong>of</strong>f from urban areas, and requires that municipalities obtain permits for dischargingstormwater and implement the six minimum control measures for limiting run<strong>of</strong>f pollutionto receiving systems.3-113
CALUMET-SAG DETAILED WATERSHED PLAN3.20.1.3 Wetland and Riparian AreasFigures 2.3.6 and 2.3.7 contain mapping <strong>of</strong> wetland and riparian areas in the <strong>Cal</strong>umet-<strong>Sag</strong>Channel <strong>Water</strong>shed. Wetland areas were identified using National Wetlands Inventory(NWI) mapping. NWI data includes roughly 297 acres <strong>of</strong> wetland area in the Marley Creektributary area. Riparian areas are defined as vegetated areas between aquatic and upland ecosystemsadjacent to a waterway or body <strong>of</strong> water that provides flood management, habitat, andwater quality enhancement. Identified riparian environments <strong>of</strong>fer potential opportunities forrestoration.3.20.1.4 Floodplain MappingFlood inundation areas supporting the NFIP were revised in 2008 as a part <strong>of</strong> FEMA’s MapModernization Program. Floodplain boundaries were revised based upon updated CookCounty topographic information; however, the effective models, which are used to estimateflood levels, were generally not updated. LOMRs were incorporated into revised floodplainareas.Marley Creek is mapped in detail in the DFIRM mapping update, with Zone AE floodplainshown across the length <strong>of</strong> Marley Creek. The original hydrologic and hydraulic analysisdeveloped to produce floodplain mapping was completed in 1976. The hydrologic modelingwas performed using Regression Equations 73 and 75. Steady state hydraulic routing waswas performed using the WSP-2 modeling application.Appendix A includes a comparison <strong>of</strong> FEMA’s effective floodplain mapping from updatedDFIRM panels with inundation areas developed for the <strong>DWP</strong>.3.20.1.5 Stormwater Problem DataCommunities, agencies (e.g., IDOT, CCHD), and stakeholders submitted Form B questionnaireresponse data to the <strong>District</strong> summarizing known stormwater problems within theirjurisdictions. Stormwater problems were classified as regional or local based upon the criteriadescribed in Section 1 <strong>of</strong> the report. Table 3.20.3 summarizes the Form B data for MarleyCreek.3.20.1.6 Near-Term Planned Projects<strong>Water</strong>shed communities, agencies, and stakeholders were asked about near-term plannedprojects so that the implementation <strong>of</strong> near-term flood control projects by others is consideredin development <strong>of</strong> the <strong>DWP</strong>. No near-term planned projects by others have been identifiedfor the Marley Creek subwatershed.3.20.2 <strong>Water</strong>shed Analysis3.20.2.1 Hydrologic Model DevelopmentSubbasin Delineation. The Marley Creek subwatershed was delineated based upon LiDARtopographic data developed by Cook County in 2003. The subwatershed drainage area includes0.56 square mile in Will County that drains into Cook County. The area within WillCounty was delineated using USGS maps showing 10-foot contours. Forty-six subbasins3-114
3. TRIBUTARY CHARACTERISTICS AND ANALYSISTABLE 3.20.3Community Response Data for Marley CreekProblemIDMunicipalityProblems asReported byLocal Agency Location Problem DescriptionLocal/RegionalResolutionin <strong>DWP</strong>FP1ForestPreserve<strong>District</strong>Overbankflooding, ponding,waterquality, wetlandriparianLaGrangeand 167thStreetHigh run<strong>of</strong>f and salt fromroads has degradedhabitat and water quality.LocalProblem not locatedon a modeled,regionalwaterwayOP12OrlandParkBank erosion,sedimentation108th Avenueat MarleyCreekcrossingSilt in three 10- by 8-footbox culverts where MarleyCreek crosses 108thAvenue.RegionalMaintenance recommendedto addressproblem, notassociated withproperty damages.Sediment was observedin the boxculverts.OP3OrlandParkOverbankflooding, bankerosion, sedimentation,maintenance,wetland riparianMarleyCreek atCameronParkwayand NorfolkSouthernR.R.Flooding on Wolf Roaddue to restricted conveyancein Marley Creek,seems to be caused primarilyby debris andsedimentation causingblockages in conveyance.RegionalStream maintenanceand debrisremoval recommendedto addressproblem.Sediment was notobserved in MarleyCreek in thisarea during fieldvisit. Adjacentproperty damagedue to floodingaddressed byproject MACR-1.OP6OrlandParkMaintenance,sedimentation,bank erosionMarleyCreek atAnthonyDrive toMeadeStreetFlooding on 104th Avenuedue to restrictedconveyance in MarleyCreek, seems to becaused primarily by debrisand sedimentationcausing blockages inconveyance.RegionalStream maintenanceand debrisremoval recommendedto addressproblem.Debris was observedin MarleyCreek in thisarea. No propertydamage due t<strong>of</strong>looding.were delineated for the Marley Creek Tributary area, with an average subbasin area <strong>of</strong> 138acres.Hydrologic Parameter <strong>Cal</strong>culations. CNs were estimated for each subbasin based upon NRCSsoil data and 2001 CMAP land use data. This method is further described in Section 1.3.2,with lookup values for specific combinations <strong>of</strong> land use and soil data presented in AppendixC. An area-weighted average <strong>of</strong> the CN was generated for each subbasin.The lag time, used to convert excess precipitation into a run<strong>of</strong>f hydrograph, was assumed tobe 0.6 times the time <strong>of</strong> concentration for all subbasins. The time <strong>of</strong> concentration, or time <strong>of</strong>travel from the hydrologically most distant part <strong>of</strong> the subbasin, was estimated by using3-115
CALUMET-SAG DETAILED WATERSHED PLANstandard procedures assuming a length <strong>of</strong> sheet flow, shallow concentrated flow, and channelflow. In some instances, modification to parameter estimates was necessary to more accuratelycharacterize very flat or heavily sewered subwatersheds. Appendix G provides asummary <strong>of</strong> the hydrologic parameters used for subbasins in each subwatershed.For Will County subbasins tributary to Marley Creek, drainage paths and lag times wereapproximated using available USGS data and available aerial photography.3.20.2.2 Hydraulic Model DevelopmentField Data, Investigation, and Existing Model Data. No hydraulic models that met <strong>District</strong> criteria,as identified in Section 6.3.3.2 <strong>of</strong> the CCSMP, were available for <strong>DWP</strong> development.Surveys <strong>of</strong> the open channel part <strong>of</strong> Marley Creek and all crossings were performed to characterizethe channel and near overbank channel geometry. Cross-sectional geometry in thenon-surveyed overbank area was obtained from Cook County topographic data and combinedwith the surveyed channel cross section. Stream sections in Will County were notmodeled hydraulically. Field visits were performed to assess channel and overbank roughnesscharacteristics, which were combined with information from photographs and aerialphotography to assign modeled Manning’s n roughness coefficient to the stream.Boundary Conditions. Normal depth with a friction slope <strong>of</strong> 0.002 was used as the boundarycondition for Marley Creek at the point <strong>of</strong> discharge into Will County.3.20.2.3 <strong>Cal</strong>ibration and VerificationNo measured or observed stages were available for Marley Creek to compare model results.Curve numbers were reduced by 10 percent for existing and alternative conditions analysisbased upon the calibration <strong>of</strong> streams with monitoring data as described in Section 1.3.8.3.20.2.4 Existing Conditions EvaluationFlood Inundation Areas. Flood Inundation areas were developed based on HEC-RAS watersurface elevations and Cook County topographic data. Figure 3.20.1 shows inundation areasproduced by the <strong>DWP</strong>’s hydraulic model for the 100-year, 12-hour duration design storm.Hydraulic Pr<strong>of</strong>iles. Appendix H contains hydraulic pr<strong>of</strong>iles <strong>of</strong> existing conditions in the MarleyCreek system. Pr<strong>of</strong>iles are shown for the 2-, 5-, 10-, 25-, 50-, 100-, and 500-year recurrenceinterval design storms.3.20.3 Development and Evaluation <strong>of</strong> Alternatives3.20.3.1 Problem DefinitionHydraulic model results were reviewed with inundation mapping to identify locationswhere property damage due to flooding is predicted. Table 3.20.4 summarizes major problemareas identified through modeling <strong>of</strong> Marley Creek.3.20.3.2 Damage AssessmentEconomic damages were defined following the protocol defined in Chapter 6.6 <strong>of</strong> theCCSMP. No erosion or recreation damages due to flooding were identified for Marley3-116
3. TRIBUTARY CHARACTERISTICS AND ANALYSISCreek. Transportation damages were estimated as 15 percent <strong>of</strong> property damages. Table3.20.5 lists the damage assessment for existing conditions.TABLE 3.20.4Modeled Problem Definition for Marley CreekProblemIDLocationRecurrence Interval<strong>of</strong> Flooding (yr)AssociatedForm BResolution in <strong>DWP</strong>MPA15MPA16Area nearWest Dr. andCentennialDr. intersectionArea north <strong>of</strong>173rd St. andWolf Rd.100, 500 Model results show roadway flooding, but noproperty damage. Due to the availability <strong>of</strong> alternativeroutes, a resolution to transportationdamages has been deemed unnecessary.25, 50, 100, 500 Project MACR-1 addresses flooding in thisareaMPA17Area north <strong>of</strong>175th St. and110th Ct.5, 10, 25, 50, 100,500Project MACR-1 addresses flooding in thisareaMPA18Homes onMarley BrookCt.100, 500 OP3 Project MACR-1 addresses flooding in thisarea3.20.3.3 Technology ScreeningFlood control technologies were screened toidentify appropriate technologies for addressingthe flooding problems in MarleyCreek. Storage was the primary potentialtechnology considered for addressingflooding problems along Marley Creek.Levees were not considered as the propertieswith flood damages were located farapart and the existing inundation area israther large with deep flood elevations.TABLE 3.20.5Estimated Damages for Marley CreekDamageCategoryEstimatedDamage ($)Property 472,500Erosion 0NoteTransportation 70,900 Assumed as 15% <strong>of</strong>property damageRecreation 03.20.3.4 Alternative DevelopmentFlood Control Alternatives. Alternative solutions to regional flooding were developed andevaluated consistent with the methodology described in Section 1.3.8 <strong>of</strong> this report. Table3.20.6 summarizes flood control alternatives developed for Marley Creek.3-117
CALUMET-SAG DETAILED WATERSHED PLANTABLE 3.20.6Flood Control Alternatives for Marley CreekAlternative Number Location DescriptionMACR-1MACR-2Marley Creek atWolf Road crossingLong Run Creekat Will-CookRoad crossing117 acre-feet detention upstream <strong>of</strong> flooding problemswith overflow pipe and overflow weirThree detention basins, 117 acre-feet, 21acre-feet, 8acre-feet, each with low flow pipe and overflow weirs.This alternative did not effectively reduce water surfaceelevations beyond reduction caused by MACR-1 in theflooding problem area, thus benefits and costs were notdeveloped.Stormwater detention alternatives were modeled for Marley Creek to relieve the flooding inthe areas around Wolf Road (listed in Table 3.20.4 as modeled flooding problem areasMACR2 and MACR3). Alternative MACR-1, a detention basin on large, vacant parcels justupstream <strong>of</strong> 171st Street and Wolf Road was effective in lowering flooding damages. Onemajor parcel <strong>of</strong> open land considered for stormwater detention is owned by the Archdiocese,near the intersection <strong>of</strong> Marley Creek and Wolf Road.Erosion Control Alternatives. No erosion control alternatives were developed for MarleyCreek.3.20.3.5 Alternative Evaluation and SelectionThe alternatives listed in Table 3.20.6 were evaluated to determine their effectiveness and toproduce data required for the countywide prioritization <strong>of</strong> watershed projects. Flood controlalternatives were modeled to evaluate their impact on water elevations and flood damages.MACR-2 did not result in additional WSEL reduction as compared to MACR-1. A summary<strong>of</strong> B/C ratios, net benefits, total project costs, number <strong>of</strong> structures protected, and otherrelevant alternative data is provided in Section 3.20.3.6. Alternatives that did not produce asignificant reduction in water surface are not listed in this table.Recommended alternatives result in reduced stage and/or flow along the modeled waterway.Table 3.20.7 provides a comparison <strong>of</strong> the modeled maximum WSEL, and modeledflow at the time <strong>of</strong> peak at representative locations along the waterway.TABLE 3.20.7Marley Creek Existing and Alternative Condition Flow and WSEL ComparisonExisting ConditionsMACR-1LocationStationMaxWSEL (ft)MaxFlow(cfs)MaxWSEL (ft)MaxFlow(cfs)104th Ave and 159th St. 20877 686.07 159.38 686.07 159.87100-ft upstream <strong>of</strong> 108th Ave. 16990 685.19 560.94 685.17 561.69Downstream <strong>of</strong> Wolf Rd. 11480 679.64 672.33 679.18 609.32NE <strong>of</strong> 175th St. and Wolf Rd. 7271 677.18 903.94 676.69 775.043-118
3. TRIBUTARY CHARACTERISTICS AND ANALYSISTABLE 3.20.7Marley Creek Existing and Alternative Condition Flow and WSEL ComparisonExisting ConditionsMACR-1LocationStationMaxWSEL (ft)MaxFlow(cfs)MaxWSEL (ft)MaxFlow(cfs)104th Ave and 159th St. 20877 686.07 159.38 686.07 159.87500-ft downstream <strong>of</strong> Marley Creek Tributary Bconfluence 5177 677.02 1442.96 676.34 1215.68400-ft downstream <strong>of</strong> 179th St. 2690 673.06 1560.01 672.68 1304.69Cook-Will County line 266 670.50 1708.14 670.08 1440.32It is recognized that alternative MACR-1 is a large capital project that results in benefits to afew structures, and a low B/C ratio. When isolated structures require such a large capitalproject to address flood damages, flood-pro<strong>of</strong>ing may be a more cost-effective alternative.A number <strong>of</strong> properties are at risk <strong>of</strong> shallow flooding during the 100-year flood event underexisting conditions or recommended alternative conditions. In addition, due to their locations,other properties' risk <strong>of</strong> flooding cannot be feasibly mitigated by structuralmeasures. Such properties are candidates for protection using nonstructural flood controlmeasures, such as flood-pro<strong>of</strong>ing or acquisition. These measures may be considered to addressdamages that are not fully addressed by capital projects recommended in the <strong>Cal</strong>umet-<strong>Sag</strong>Channel <strong>DWP</strong>.Although not contributing to modeled damages, channel maintenance downstream <strong>of</strong> 108thAvenue is recommended to address debris and sedimentation in this portion <strong>of</strong> the creek.3.20.3.6 Data Required for Countywide Prioritization <strong>of</strong> <strong>Water</strong>shed ProjectsAppendix I presents conceptual level cost estimates for the recommended alternatives. Table3.20.8 lists alternatives analyzed in detail. The recommended alternative MACR-1 isshown in Figure 3.20.2. A comparison <strong>of</strong> the existing conditions and alternative conditionsinundation mapping is included in this figure.3-119
CALUMET-SAG DETAILED WATERSHED PLANTABLE 3.20.8Marley Creek Project Alternative Matrix to Support <strong>District</strong> CIP PrioritizationProjectDescriptionB/CRatioNet Benefits($)Total ProjectCost ($)CumulativeStructuresProtectedFundingPossibilities<strong>Water</strong>QualityBenefitRecommendedCommunitiesInvolvedMACR-1Construct 117 ac-ft detentionbasin0.01 160,100 15,985,700 3 SlightlyPositiveYesOrland ParkNote: Net Benefits values do not include local benefits or non-economic benefits.3-120
3. TRIBUTARY CHARACTERISTICS AND ANALYSIS3.21 Melvina DitchMelvina Ditch is tributary to Stony Creek in southwesternCook County, north <strong>of</strong> the <strong>Cal</strong>umet-<strong>Sag</strong>Channel, in the northern portion <strong>of</strong> the <strong>Cal</strong>umet-<strong>Sag</strong> Channel <strong>Water</strong>shed. The open channel portion<strong>of</strong> Melvina Ditch is just less than one mile long;however, it drains a heavily sewered tributary area<strong>of</strong> 8.5 square miles. Seven communities are tributaryto Melvina Ditch (Table 3.21.1), with principalsources <strong>of</strong> flow from Bedford Park, Burbank, andOak Lawn.The Melvina Ditch tributary area is almost entirelydeveloped, with large amounts <strong>of</strong> impervious areaassociated with residential and commercial development.The distribution <strong>of</strong> land use withinMelvina Ditch tributary area is summarized in Table3.21.2.Two reservoirs within the Melvina Ditch tributaryarea provide significant storage for the watershed.At the upstream part <strong>of</strong> the tributary area, the 300acre-feet Bedford Park reservoir detains flows fromBedford Park. The outlet from this reservoir is controlledby a sluice gate that is closed during rainfallevents to protect downstream areas. The MelvinaDitch Reservoir, located in Burbank, provides 165acre-feet <strong>of</strong> stormwater detention. During a storm,TABLE 3.21.1Communities Draining to Melvina DitchTributary AreaCommunity/Tributary (mi 2 )Burbank 3.76Bedford Park 2.57Oak Lawn 1.51Bridgeview 0.21Chicago Ridge 0.18Unincorporated/ForestPreserve0.13Chicago 0.09TABLE 3.21.2Land Use Distribution for Melvina DitchLand Use Category Area (acres) %Residential 2,883.1 53.3Commercial/ Industrial1,353 25Transportation/Utility 525.8 9.7Forest/Open Land 404.6 7.5Institutional 240.5 4.4<strong>Water</strong>/Wetland 7.1 0.1the reservoir can be pumped up to a rate <strong>of</strong> 200 cfs discharging to Melvina Ditch. A significantpart <strong>of</strong> the watershed downstream <strong>of</strong> Melvina Ditch Reservoir has no significant stormwaterdetention. Figure 3.21.1 is an overview <strong>of</strong> the tributary area <strong>of</strong> the subwatershed.Reported stormwater problem areas, flood inundation areas, and proposed alternative projectsare also shown on the figure, and are discussed in the following subsections.3.21.1 Sources <strong>of</strong> Data3.21.1.1 Previous StudiesNo recent studies <strong>of</strong> Melvina Ditch are known to exist. The report Preliminary Report onMelvina Ditch (Consoer, Townsend & Associates/<strong>District</strong>, 1968) was reviewed to obtain informationrelevant to the <strong>Cal</strong>umet-<strong>Sag</strong> Channel <strong>DWP</strong> development. It examines the capacity<strong>of</strong> Melvina Ditch to accept flows discharged from the Melvina Ditch Reservoir. No datafrom the report was used to support modeling or the development and evaluation <strong>of</strong> alternativesfor the <strong>Cal</strong>umet-<strong>Sag</strong> Channel <strong>DWP</strong>.3-121
CALUMET-SAG DETAILED WATERSHED PLAN3.21.1.2 <strong>Water</strong> Quality DataThe IEPA does not have any sites in the Ambient <strong>Water</strong> Quality Monitoring Network onMelvina Ditch. No reaches identified as impaired in the IEPA’s 2008 Integrated <strong>Water</strong> QualityReport (which includes the CWA 303(d) and 305(b) lists). No TMDLs have been established forMelvina Ditch. According to a USEPA water permit discharge query, there are no NPDESpermits issued by IEPA for discharges to Melvina Ditch. Municipalities discharging toMelvina Ditch are regulated by IEPA’s NPDES Phase II Stormwater Permit Program, whichwas created to improve the water quality <strong>of</strong> stormwater run<strong>of</strong>f from urban areas, and requiresthat municipalities obtain permits for discharging stormwater and implement the six minimumcontrol measures for limiting run<strong>of</strong>f pollution to receiving systems.3.21.1.3 Wetland and Riparian AreasFigures 2.3.6 and 2.3.7 contain mapping <strong>of</strong> wetland and riparian areas in the <strong>Cal</strong>umet-<strong>Sag</strong>Channel <strong>Water</strong>shed. Wetland areas were identified using National Wetlands Inventory (NWI)mapping. NWI data includes 87.2 acres <strong>of</strong> wetland areas in the Melvina Ditch subwatershed.Riparian areas are defined as vegetated areas between aquatic and upland ecosystems adjacentto a waterway or body <strong>of</strong> water that provides flood management, habitat, and water quality enhancement.Identified riparian environments <strong>of</strong>fer potential opportunities for restoration.3.21.1.4 Floodplain MappingFlood inundation areas supporting the NFIP were revised in 2008 as a part <strong>of</strong> FEMA’s MapModernization program. Floodplain boundaries were revised based upon updated CookCounty topographic information; however, the effective models, which are used to estimateflood levels, were generally not updated. LOMRs were incorporated in the revised floodplains.Melvina Ditch is mapped in detail in DFIRM mapping update, with Zone AE floodplain definedfor the length <strong>of</strong> the ditch. The original hydrologic and hydraulic analysis was performedin 1979. Hydrologic modeling was performed by using TR-20 in combination withregression equations from 1974. Steady state hydraulic routing was performed using theWSP-2 modeling application.Appendix A includes a comparison <strong>of</strong> FEMA’s effective floodplain mapping from updatedDFIRM panels with inundation areas developed for the <strong>DWP</strong>.3.21.1.5 Stormwater Problem DataCommunities, agencies (e.g., IDOT, CCHD), and stakeholders submitted Form B questionnaireresponse data to the <strong>District</strong> summarizing known stormwater problems within theirjurisdictions. Stormwater problems were classified as regional or local based upon the criteriadescribed in Section 1 <strong>of</strong> the report. Table 3.21.3 summarizes the Form B data.3.21.1.6 Near-Term Planned Projects<strong>Water</strong>shed communities, agencies, and stakeholders were asked about near-term plannedprojects so that the implementation <strong>of</strong> near-term flood control projects by others is consideredin development <strong>of</strong> the <strong>DWP</strong>. No near-term planned projects by others have been identifiedfor the Melvina Ditch subwatershed.3-122
3. TRIBUTARY CHARACTERISTICS AND ANALYSISTABLE 3.21.3Community Response Data for Melvina DitchProblemIDMunicipalityBU1 Burbank Overbankflooding,storm sewercapacityBU2 Burbank PavementfloodingCR1CR2CR3ChicagoRidgeChicagoRidge,Oak LawnChicagoRidgeProblems asReported byLocal Agency Location Problem DescriptionMaintenance,pondingBank erosion,sedimentationOverbankflooding87 th St. andNatchez Ave.Route 50(Cicero Ave.)at Keller Dr.(77th StreetViaduct)Melvina Ditchat West StonyCreekMelvina Ditchalong ChicagoRidge Mall(between 95thSt. and WestStony Creek)Confluence <strong>of</strong>Melvina Ditchwith StonyCreekOverbank floodingand ponding hashistorically occurredsurrounding theMelvina Ditch Reservoir.The <strong>District</strong>made improvementsto the reservoir andcoordinated withBedford Park, withno problems at thereservoir reportedsince.IDOT reportedpavement floodingPreviously reportedmaintenance request(Nov 2006) atconfluence withStony CreekSediment and erosionproblems, lack<strong>of</strong> maintenanceThe adverse confluenceangle <strong>of</strong>Melvina Ditch withStony Creek is perceivedto contributeto higher floodstages along WestStony CreekLocal/RegionalLocalLocalRegionalRegionalRegionalResolution in <strong>DWP</strong>Problem not locatedon a regionalwaterway.Problem not locatedon a regionalwaterwayRemoval <strong>of</strong> debristo be addressedby stream maintenanceProject MEDT-1addresses erosionproblems between95th and 99thStreetImpact <strong>of</strong> MelvinaDitch junction anglewas considered,and analysisconcluded that theadverse angle hasno significant impacton flooding.3.21.2 <strong>Water</strong>shed Analysis3.21.2.1 Hydrologic Model DevelopmentSubbasin Delineation. The Melvina Ditch tributary area was delineated based upon LiDARtopographic data developed by Cook County in 2003. Forty subbasins were defined with anaverage size <strong>of</strong> 146.4 acres. The Melvina Ditch tributary area is flat and generally drained bystorm sewer systems. Significant modifications to the initial topographic delineation wererequired to accurately characterize drainage patterns into the Bedford Park and MelvinaDitch Reservoirs based upon available storm sewer data.3-123
CALUMET-SAG DETAILED WATERSHED PLANHydrologic Parameter <strong>Cal</strong>culations. CNs were estimated for each subbasin based upon NRCSsoil data and 2001 CMAP land use data. This method is further described in Section 1.3.2,with lookup values for specific combinations <strong>of</strong> land use and soil data presented in AppendixC. An area-weighted average <strong>of</strong> the CN was generated for each subbasin.The lag time, used to convert excess precipitation into a run<strong>of</strong>f hydrograph, was assumed tobe 0.6 times the time <strong>of</strong> concentration for all subbasins. The time <strong>of</strong> concentration, or time <strong>of</strong>travel from the hydrologically most distant part <strong>of</strong> the subbasin, was estimated by usingstandard procedures assuming a length <strong>of</strong> sheet flow, shallow concentrated flow, and channelflow. In some instances, modification to parameter estimates was necessary to more accuratelycharacterize very flat or heavily sewered subwatersheds. Appendix G provides asummary <strong>of</strong> the hydrologic parameters used for subbasins in each subwatershed.Reservoirs. The Bedford Park and Melvina Ditch reservoirs each were represented as reservoirsin the Melvina Ditch subwatershed hydrologic model. The depth-volume relationship<strong>of</strong> the 165 acre-foot Melvina Ditch reservoir and the 277 acre-foot Bedford Park reservoirwere obtained from Cook County topographic data. The Bedford Park reservoir drains bygravity through a 4-foot sluice gate. <strong>District</strong> M&O personnel reported that the gate is closedduring storms to maximize storage in the reservoir and to reduce downstream flow to theMelvina Ditch Reservoir. The Melvina Ditch Reservoir is drained by three stormwaterpumps, each with a capacity <strong>of</strong> 66 cfs (<strong>District</strong> M&O Facilities Handbook, 2006). The maximumpumped discharge rate from Melvina Ditch Reservoir is 200 cfs.Flow Restrictions. Most <strong>of</strong> the tributary area represented in the Melvina Ditch hydrologicmodel is sewered. The storm sewer network and the hydraulic capacity generally are notrepresented in the hydrologic model. Where surface topography is very flat, indicating limitedoverland flow, it was necessary to limit the flow conveyed within the hydrologic modelto the estimated conveyance capacity <strong>of</strong> the sewer. The 120-inch pipe influent to the MelvinaDitch Reservoir was limited to 600 cfs capacity. In addition, an 84-inch storm sewer in OakLawn flows east into the discharge pipe from Melvina Ditch Reservoir at the intersection <strong>of</strong>93rd Street and Nashville Avenue. The conveyance capacity <strong>of</strong> this pipe was limited toroughly 200 cfs. Approximately 1.5 square miles <strong>of</strong> Oak Lawn discharges to Melvina Ditchthrough a number <strong>of</strong> storm sewers downstream <strong>of</strong> the Melvina Ditch Reservoir, including42-inch and 84-inch storm sewers along 93 rd Street (upstream <strong>of</strong> the open channel portion <strong>of</strong>Melvina Ditch). Peak flows from this heavily developed area <strong>of</strong> Oak Lawn are estimated asapproximately 540 cfs, which is more than twice the peak discharge from the Melvina DitchReservoir.Combined Sewer. Roughly 320 acres <strong>of</strong> the Melvina Ditch tributary area in Bedford Park isserved by combined sewers. The combined sewers convey an estimated 0.25 cfs/acre <strong>of</strong>run<strong>of</strong>f out <strong>of</strong> the Melvina Ditch subwatershed through the <strong>District</strong> interceptor. Run<strong>of</strong>f in excess<strong>of</strong> 0.25 cfs/acre was routed through the Melvina Ditch hydrologic model.3.21.2.2 Hydraulic Model DevelopmentField Data, Investigation, and Existing Model Data. No hydraulic models that met <strong>District</strong> criteria,as identified in Section 6.3.3.2 <strong>of</strong> the CCSMP, were available for <strong>DWP</strong> development.Surveys <strong>of</strong> the open channel part <strong>of</strong> Melvina Ditch and all crossings were performed tocharacterize the channel and near overbank channel geometry. Cross-sectional geometry in3-124
3. TRIBUTARY CHARACTERISTICS AND ANALYSISthe non-surveyed overbank area was obtained from Cook County topographic data andcombined with the surveyed channel cross section. Field visits were performed to assesschannel and overbank roughness characteristics, which were combined with informationfrom photographs and aerial photography to assign modeled Manning’s n roughness coefficientsalong the modeled stream length.Boundary Conditions. The Melvina Ditch model is a component <strong>of</strong> the larger Stony Creekhydraulic model, with downstream water surface defined by the Stony Creek water surfaceelevation.3.21.2.3 <strong>Cal</strong>ibration and VerificationObserved Data. The wet well elevation <strong>of</strong> Melvina Ditch Reservoir is recorded continuouslyon paper charts, which were obtained and compared with model results for the storm events<strong>of</strong> September 13, 2008 and August 23, 2007. Reservoir elevations were extracted from the chartat hourly intervals, and typical values and patterns preceding and following the storm werenoted. An elevation <strong>of</strong> 3.5 feet was observed to be the average wet well elevation when thereservoir is dry. Therefore, 3.5 feet was subtracted from charted wet-well elevations for comparisonwith the hydrologic model results. For the August 23, 2007 event, a dry weather flowvalue <strong>of</strong> 7.5 ft was subtracted from the recorded level to represent a baseflow observed on thepaper charts.Verification Results. The hydrologic and hydraulic models were evaluated using the revisedcurve numbers reduced by 10 percent from the originally calculated values, as described inSection 1.3.8. This adjustment was based upon calibration evaluations in other subwatershedsthat had gage data available. Figures 3.21.2 and 3.21.3 show model results for the reservoirdepth compared with the monitoring data. Peak depths are summarized in Table 3.21.4.As Figures 3.21.2 and 3.21.3 demonstrate,the Melvina Ditch hydrologic model is generallyaccurate in predicting reservoirdepths for the historic rainfall events considered.It is likely that operational decisions<strong>of</strong> the pumps discharging fromMelvina Ditch Reservoir, or operation <strong>of</strong>the sluice gate regulating discharge fromTABLE 3.21.4Peak DepthsRainfallEventRecordedReservoirDepth (ft)ModeledWet-WellDepth (ft)Difference(ft)08/23/2007 10.5 10.87 0.3309/13/2008 19 19.7 0.7the Bedford Park Reservoir, contribute to some <strong>of</strong> the observed discrepancy. Some <strong>of</strong> thevariables potentially impacting the ability to simulate Melvina Ditch Reservoir inflows andoutflows include the following:• Reservoir Operation—Actual operation <strong>of</strong> the Melvina Ditch Reservoir, or the upstreamBedford Park Reservoir, may deviate from generalized understanding <strong>of</strong> typical operatingprocedures. The Bedford Park sluice gate is kept closed in the hydrologic model, althoughin reality, the gate is opened following the storm to allow discharge to theMelvina Ditch Reservoir.• Monitoring Accuracy—Recorded wet well elevation data include some atypical patternsthat may not be accurate.3-125
CALUMET-SAG DETAILED WATERSHED PLAN• Rainfall Variability—A single rain gage (ISWS Gage 12) was used to represent rainfallin the 8.47-square-mile tributary area <strong>of</strong> Melvina Ditch for modeled events. Variability intiming and intensity <strong>of</strong> actual rainfall within the tributary area is likely. Likely variability<strong>of</strong> rainfall data is evident during the 9/14 storm event when recorded stage data inthe Melvina Ditch Reservoir showed an increase that did not correspond to the recordedrainfall data at ISWS Gage 12. <strong>District</strong> rain gage data was also reviewed and determinedto be consistent with ISWS gage data.• Hydraulics <strong>of</strong> Tributary System—The hydrologic model delivering flows to MelvinaDitch Reservoir has a limited ability to model hydraulic restrictions in storm sewerswithin the area tributary to the reservoir. Inflow into the Melvina Ditch Reservoir waslimited to 600 cfs based upon hydraulic limitations <strong>of</strong> the primary pipe discharging intothe reservoir. However, the hydrologic model does not generally reflect hydraulic restrictionsin within the local Burbank and Bedford Park storm sewer systems.Modifications to Model Input. Curve numbers in the Melvina Ditch subwatershed were reducedby 10 percent from the originally calculated values based upon the calibration effortdescribed in Section 1.3.8.FIGURE 3.21.2Modeled vs. Monitored Melvina Ditch Reservoir Depth during August 23, 2007 Storm1210Monitored Wet-Well DepthModeled Reservoir DepthWet Well / Reservoir Depth (ft)864208/23/07 12:00 8/24/07 0:00 8/24/07 12:00 8/25/07 0:00* Average recorded dry weather flow wet-well depth <strong>of</strong> 7.5 feet subtracted from monitored wet well depth3-126
3. TRIBUTARY CHARACTERISTICS AND ANALYSISFIGURE 3.21.3Modeled vs. Monitored Melvina Ditch Reservoir Depth during September 13, 2008 StormWet Well / Reservoir Depth (ft)252015105Modeled Reservoir DepthMonitored Wet Well09/13/08 0:00 9/13/08 12:00 9/14/08 0:00 9/14/08 12:00 9/15/08 0:00* Average recorded dry weather flow wet-well depth <strong>of</strong> 3.5 feet subtracted from monitored wet well depth3.21.2.4 Existing Conditions EvaluationFlood Inundation Areas. Figure 3.21.1 shows inundation areas along Melvina Ditch producedby the hydraulic model for the 100-year, 12-hour duration design storm. Flooding at thedownstream end <strong>of</strong> Melvina Ditch is due to backwater from Stony Creek.Hydraulic Pr<strong>of</strong>iles. Appendix H contains hydraulic pr<strong>of</strong>iles <strong>of</strong> the existing conditions in theMelvina Ditch system. Pr<strong>of</strong>iles are shown for the 2-, 5-, 10-, 25-, 50-, 100-, and 500-year recurrenceinterval design storms.3.21.3 Development and Evaluation <strong>of</strong> Alternatives3.21.3.1 Modeled Problem DefinitionHydraulic model results were reviewed with inundation mapping to identify locationswhere property damage due to flooding is predicted. Table 3.21.5 summarizes problem areasidentified through hydraulic modeling <strong>of</strong> Melvina Ditch.3-127
CALUMET-SAG DETAILED WATERSHED PLANTABLE 3.21.5Modeled Problem Definition for Melvina DitchProblemIDLocationRecurrence Interval<strong>of</strong> Flooding (yr)AssociatedForm BResolutionin <strong>DWP</strong>MPA19Between 99th Street and 98th Street, betweenMelvina Ditch and the railroad tracks25, 50, 100 ProjectsSTCR-3and STCR-8 will reducefloodingin thisarea3.21.3.2 Damage AssessmentEconomic damages were defined following the protocol defined in Chapter 6.6 <strong>of</strong> theCCSMP. Erosion damages were determined based on the values <strong>of</strong> structures located within30-feet <strong>of</strong> areas <strong>of</strong> active erosion. Other damages also included in erosion damages forMelvina Ditch include damage to the Nashville Avenue roadway and utilities and the temporaryrelocation <strong>of</strong> households for which Nashville Avenue is the only means <strong>of</strong> access. Norecreation damages due to flooding were identified for Melvina Ditch. Transportation damageswere estimated as 15 percent <strong>of</strong> property damage due to flooding. Table 3.21.6 lists thedamage assessment for existing conditions.TABLE 3.21.6Estimated Damages for Melvina DitchDamageCategoryEstimatedDamage ($)NoteProperty 170,600Erosion 340,300 6615 West 95th Street in Oak Lawn at imminent risk <strong>of</strong> damagedue to erosionTransportation 25,600 Assumed as 15% <strong>of</strong> property damage due to floodingOther – Road/Utility Repair/ReplacementOther – Temporary Relocation<strong>of</strong> Residents1,220,600 Damage to road along Nashville Avenue105,000 Temporary relocation <strong>of</strong> seven households with only NashvilleAvenue as means <strong>of</strong> access to home3.21.3.3 Technology ScreeningErosion control measures were considered for Melvina Ditch to protect buildings and adjacentinfrastructure from damage due to erosion. Due to the steep banks <strong>of</strong> Melvina Ditch,hard armoring and structural stabilization were considered the most feasible erosion protectionmeasures.3.21.3.4 Alternative DevelopmentFlood Control Alternatives. No flood control alternatives were developed for Melvina Ditch.3-128
3. TRIBUTARY CHARACTERISTICS AND ANALYSISTable 3.21.7 summarizes the two erosion control alternatives developed for Melvina Ditch.The cost estimate for MEDT-1 includes hard armoring <strong>of</strong> the west bank <strong>of</strong> Melvina Ditch between95th and 99th Streets, as well as biostabilization <strong>of</strong> half <strong>of</strong> the east bank <strong>of</strong> the channel,which may be conservative since some locations might not need lining. Some parts <strong>of</strong> the ditchdo not show signs <strong>of</strong> active erosion and may not require stabilization. The extent <strong>of</strong> stabilizationrequired to address damages should be confirmed through a detailed evaluation <strong>of</strong> site conditionsconducted during a design study.TABLE 3.21.7Erosion Control Alternatives for Melvina DitchAlternative Location DescriptionMEDT-1MEDT-2Between 95thand 99th StreetBetween 95thand 99th StreetsHard armoring <strong>of</strong> west channel banks for both channel banks between 95thand 99th Streets. Reinforced concrete walls were used in cost estimates,however, in some locations, s<strong>of</strong>ter channel protection measures may be appropriateand will be determined during the project design phase. Some excavationis required to avoid reduction <strong>of</strong> channel conveyance capacity. Someexcavated material may be replaced within the channel to provide a low flowchannel with variable habitat.Enclose Melvina Ditch in two 102-inch pipes (the dimensions <strong>of</strong> 99th Streetcrossing). Fill in above pipes and provide vegetative cover for area3.21.3.5 Alternative Evaluation and SelectionBoth MEDT-1 and MEDT-2 propose channel modifications that address all damages associatedwith erosion problems between 95th Street and 99th Street. The benefits for MEDT-2include roughly $200,000 in benefits (over a 50-year time horizon) for property damage dueto flooding and associated transportation damages. These benefits occur in a location whereOak Lawn has not indicated historic flooding problems. MEDT-1, shown in Figure 3.21.5, ismore cost-effective for addressing the erosion problems actively threatening a structure inChicago Ridge, a 2,200-foot stretch <strong>of</strong> Nashville Avenue, and associated utilities north <strong>of</strong>99th Street. Four additional noneconomic considerations favor MEDT-1 as the recommendedalternative to address damages between 95th and 99th streets:• USACE Section 14 Funding—The USACE provides financial support for channel-liningprojects that protect public infrastructure from damage due to erosion.• Downstream Impacts—Increased velocity within the enclosed conduit proposed inMEDT-2 would require dissipation downstream to avoid creating erosion damages furtherdownstream. Installation <strong>of</strong> such a structure could reduce channel conveyance.• Aquatic Habitat—Enclosure <strong>of</strong> Melvina Ditch reduces aquatic habitat within the <strong>Cal</strong>umet-<strong>Sag</strong>Channel <strong>Water</strong>shed. The 2,800-foot stretch <strong>of</strong> Melvina Ditch upstream <strong>of</strong> 99thStreet is part <strong>of</strong> the only open channel aquatic environment within the 8.47 square milewatershed.• Regulatory Feasibility—Enclosure <strong>of</strong> Melvina Ditch may present a greater permittingobstacle than lining <strong>of</strong> the channel, because <strong>of</strong> the potential downstream impact combinedwith loss <strong>of</strong> aquatic habitat.3-129
CALUMET-SAG DETAILED WATERSHED PLANMEDT-1 is recommended as a lower cost, feasible improvement to address erosion damagesthat will continue to worsen without corrective action.MEDT-1 does not address shallow flooding predicted by the existing conditions in MelvinaDitch subwatershed. A number <strong>of</strong> properties are at risk <strong>of</strong> shallow flooding during the 100-year flood event under existing conditions or recommended alternative conditions. In addition,due to their locations, other properties' risk <strong>of</strong> flooding cannot be feasibly mitigated bystructural measures. Such properties are candidates for protection using nonstructuralflood control measures, such as flood-pro<strong>of</strong>ing or acquisition. These measures may be consideredto address damages that are not fully addressed by capital projects recommended inthe <strong>Cal</strong>umet-<strong>Sag</strong> Channel <strong>DWP</strong>.3.21.3.6 Data Required for Countywide Prioritization <strong>of</strong> <strong>Water</strong>shed ProjectsAppendix I presents conceptual level cost estimates for the recommended alternatives. Table3.21.8 lists the total estimated cost, benefits, and B/C ratio for each alternative. The recommendedalternative MEDT-1 is shown in Figure 3.21.4. A comparison <strong>of</strong> the existingconditions and alternative conditions inundation mapping is included in this figure.3-130
3. TRIBUTARY CHARACTERISTICS AND ANALYSISTABLE 3.21.8Melvina Ditch Project Alternative Matrix to Support <strong>District</strong> CIP PrioritizationProjectDescriptionB/CRatioNet Benefits($)Total ProjectCost ($)CumulativeStructuresProtectedFundingPossibilities<strong>Water</strong> QualityBenefitRecommendedCommunitiesInvolvedMEDT-1MEDT-2Hard-armoring <strong>of</strong> erodingstreambankEnclosure <strong>of</strong> channelupstream <strong>of</strong> 99th Street0.58 1,665,900 2,854,500 8 USACE Slightly Positive Yes Chicago Ridge,Oak Lawn0.24 1,862,100 7,743,300 8 USACE Slightly Negative No Chicago Ridge,Oak LawnNote: Net Benefits values do not include local benefits or non-economic benefits.3-131
3. TRIBUTARY CHARACTERISTICS AND ANALYSIS3.22 Merrionette Park DitchMerrionette Park Ditch is located in southwesternCook County, north <strong>of</strong> the <strong>Cal</strong>umet-<strong>Sag</strong> Channel,in the northern part <strong>of</strong> the <strong>Cal</strong>umet-<strong>Sag</strong> Channel<strong>Water</strong>shed. The areas <strong>of</strong> communities that drain toMerrionette Park Ditch are summarized in Table3.22.1. The population density <strong>of</strong> the MerrionettePark Ditch subwatershed is relatively high with amix <strong>of</strong> urban development and little availableopen land. Figure 3.22.1 is an overview <strong>of</strong> thetributary area <strong>of</strong> the subwatershed. Reportedstormwater problem areas and flood inundationareas are shown and are discussed in the followingsubsections.The 4.2-square-mile drainage area is heavily seweredand relatively flat, and discharges to EastStony Creek. Merrionette Park Ditch consists <strong>of</strong> amanmade channel located in line with CentralPark Avenue along the Alsip municipal boundary.The ditch alignment is located directly abovea <strong>District</strong> sanitary sewer interceptor. Table 3.22.2provides a summary <strong>of</strong> land use distributionwithin the Merrionette Park Ditch subwatershed.3.22.1 Sources <strong>of</strong> DataTABLE 3.22.1Communities Draining to Merrionette Park DitchCommunityTributary Area(mi 2 )Chicago 3.07Unincorporated/Forest Preserve0.54Merrionette Park 0.38Blue Island 0.14Alsip 0.08Evergreen Park 0.01TABLE 3.22.2Land Use Distribution for Merrionette Park DitchLand Use Category Area (acres) %Residential 1742.5 64.6Forest/Open Land 673.4 25Commercial/Industrial 197.82 7.3Institutional 77.8 2.9<strong>Water</strong>/Wetland 6.4 0.23.22.1.1 Previous StudiesNo existing studies <strong>of</strong> Merrionette Park Ditch were identified for consideration as a component<strong>of</strong> <strong>DWP</strong> development.3.22.1.2 <strong>Water</strong> Quality DataThe IEPA does not have any sites in the Ambient <strong>Water</strong> Quality Monitoring Network onMerrionette Park Ditch. There are no reaches identified as impaired in the IEPA’s 2008 Integrated<strong>Water</strong> Quality Report, which includes the CWA 303(d) and 305(b) lists. No TMDLshave been established for Merrionette Park Ditch. According to a USEPA water permit dischargequery, there are no NPDES permits issued by IEPA for discharges to Merrionette ParkDitch. Municipalities discharging to Merrionette Park Ditch are regulated by IEPA’s NPDESPhase II Stormwater Permit Program, which was created to improve the water quality <strong>of</strong>stormwater run<strong>of</strong>f from urban areas, and requires that municipalities obtain permits for dischargingstormwater and implement the six minimum control measures for limiting run<strong>of</strong>fpollution to receiving systems.3-133
CALUMET-SAG DETAILED WATERSHED PLAN3.22.1.3 Wetland and Riparian AreasFigures 2.3.6 and 2.3.7 contain mapping <strong>of</strong> wetland and riparian areas in the <strong>Cal</strong>umet-<strong>Sag</strong>Channel <strong>Water</strong>shed. Wetland areas were identified using National Wetlands Inventory (NWI)mapping. NWI data includes roughly 13.8 acres <strong>of</strong> wetland areas within the MerrionettePark Ditch subwatershed. Riparian areas are defined as vegetated areas between aquatic andupland ecosystems adjacent to a waterway or body <strong>of</strong> water that provides flood management,habitat, and water quality enhancement. Identified riparian environments <strong>of</strong>fer potential opportunitiesfor restoration.3.22.1.4 Floodplain MappingFlood inundation areas supporting the NFIP were revised in 2008 as part <strong>of</strong> the FEMA’sMap Modernization Program. Floodplain boundaries were revised based upon updatedCook County topographic information; however, the effective models, which are used to estimateflood levels, were generally not updated. LOMRs were incorporated in the revisedfloodplains.Merrionette Park Ditch is mapped in detail in DFIRM mapping update, with Zone AEfloodplain defined for the length <strong>of</strong> Merrionette Park Ditch. According to the FIS, the originalhydrologic and hydraulic analysis was performed in 1978. The hydrologic modeling wasperformed by using Regression Equation 73. Steady state hydraulic modeling was performedusing the WSP-2 modeling application.Appendix A includes a comparison <strong>of</strong> FEMA’s effective floodplain mapping from updatedDFIRM panels with inundation areas developed for the <strong>DWP</strong>.3.22.1.5 Stormwater Problem DataTable 3.22.3 summarizes reported problem areas reviewed as a part <strong>of</strong> the <strong>DWP</strong> development.This reported problem area data was primarily obtained from Form B questionnaire responsedata provided by watershed communities, agencies, and stakeholders to the <strong>District</strong>. Problemsare classified in Table 3.22.3 as regional or local. This classification is based on a processdescribed in Section 1 <strong>of</strong> this report.TABLE 3.22.3Community Response Data for Merrionette Park DitchProblemIDMunicipalityProblems asReported byLocalAgencyLocationProblemDescriptionLocal/RegionalResolutionin <strong>DWP</strong>ME1MerrionettePark, ChicagoPavementfloodingKedzie Avenuebetween119th St. and126th St.IDOT reportedpavement floodingLocalProblem not locatedon a regionalwaterway.This is a localproblem.3.22.1.6 Near-Term Planned Projects<strong>Water</strong>shed communities, agencies, and stakeholders were asked about near-term plannedprojects so that the implementation <strong>of</strong> near-term flood control projects by others is consideredin development <strong>of</strong> the <strong>DWP</strong>. No near-term planned projects by others have been identifiedfor the Merrionette Park Ditch subwatershed.3-134
3. TRIBUTARY CHARACTERISTICS AND ANALYSIS3.22.2 <strong>Water</strong>shed Analysis3.22.2.1 Hydrologic Model DevelopmentSubbasin Delineation. The Merrionette Park Ditch tributary area was delineated based uponLiDAR topographic data developed by Cook County in 2003. Twenty-five subbasins were delineatedfor the Merrionette Park Ditch area, with an average subbasin area <strong>of</strong> 108 acres anda total drainage area <strong>of</strong> 4.2 square miles.Hydrologic Parameter <strong>Cal</strong>culations. CNs were estimated for each subbasin based upon NRCSsoil data and 2001 CMAP land use data. This method is further described in Section 1.3.2,with lookup values for specific combinations <strong>of</strong> land use and soil data presented in AppendixC. An area-weighted average <strong>of</strong> the CN was generated for each subbasin.The lag time, used to convert excess precipitation into a run<strong>of</strong>f hydrograph, was assumed tobe 0.6 times the time <strong>of</strong> concentration for all subbasins. The time <strong>of</strong> concentration, or time <strong>of</strong>travel from the hydrologically most distant part <strong>of</strong> the subbasin, was estimated by usingstandard procedures assuming a length <strong>of</strong> sheet flow, shallow concentrated flow, and channelflow. In some instances, modification to parameter estimates was necessary to more accuratelycharacterize very flat or heavily sewered subwatersheds. Appendix G provides asummary <strong>of</strong> the hydrologic parameters used for subbasins in each subwatershed.3.22.2.2 Hydraulic Model DevelopmentField Data, Investigation, and Existing Model Data. No hydraulic models that met <strong>District</strong> criteria,as identified in Section 6.3.3.2 <strong>of</strong> the CCSMP, were available for <strong>DWP</strong> development.The open channel <strong>of</strong> Merrionette Park Ditch and all crossings were surveyed to characterizethe channel and near overbank geometry. Cross-sectional geometry in the non-surveyedoverbank area was obtained from Cook County topographic data and combined with thesurveyed channel cross section. Field visits were performed to assess channel and overbankroughness characteristics, which were combined with information from photographs andaerial photography to assign modeled Manning’s n roughness coefficients to the stream.Boundary Conditions. The Merrionette Park Ditch model was combined with the StonyCreek model, with Merrionette Park Ditch directly tributary to East Stony Creek. The downstreamboundary condition <strong>of</strong> Merrionette Park Ditch was defined by East Stony CreekWSEL.3.22.2.3 <strong>Cal</strong>ibration and VerificationNo measured or observed stages were available for Merrionette Park Ditch to compare modelresults to observed flows or stages. Curve numbers were reduced by 10 percent for existingand alternative conditions analysis based upon the calibration <strong>of</strong> streams with monitoringdata as described in Section 1.3.8.3-135
CALUMET-SAG DETAILED WATERSHED PLAN3.22.2.4 Existing Conditions EvaluationFlood Inundation Areas. Figure 3.22.1 shows inundation areas produced by the <strong>DWP</strong>’s hydraulicmodel for the 100-year, 12-hour duration design storm.Hydraulic Pr<strong>of</strong>iles. Appendix H contains hydraulic pr<strong>of</strong>iles <strong>of</strong> existing conditions in the MerrionettePark Ditch system. Pr<strong>of</strong>iles are shown for the 2-, 5-, 10-, 25-, 50-, 100-, and 500-yearrecurrence interval design storms.3.22.3 Development and Evaluation <strong>of</strong> Alternatives3.22.3.1 Problem DefinitionHydraulic model results were reviewed with inundation mapping to identify locationswhere property damage due to flooding is predicted. Table 3.22.4 summarizes problem areasidentified through hydraulic modeling <strong>of</strong> Merrionette Park Ditch.TABLE 3.22.4Modeled Problem Definition for Merrionette Park DitchProblemIDLocationRecurrenceInterval (yr) <strong>of</strong>FloodingAssociatedForm BResolution in <strong>DWP</strong>MPA24Area around 121st andLawndale, flooding expandssouth for larger storms50, 100, 500 Risk <strong>of</strong> flooding cannot be feasiblymitigated by structural measures.Affected properties arecandidates for protection usingnonstructural flood controlmeasures, such as floodpro<strong>of</strong>ingor acquisition.3.22.3.2 Damage AssessmentEconomic damages were defined following the protocol defined in Chapter 6.6 <strong>of</strong> theCCSMP. No erosion or recreation damages due to flooding were identified for MerrionettePark Ditch. Transportation damages were estimated as 15 percent <strong>of</strong> property damages. Table3.22.5 shows the damage assessment for existing conditions.3.22.3.3 Technology ScreeningFlood control technologies were screened toidentify those most appropriate for addressingthe flooding problems in MerrionettePark Ditch. Increased conveyance or storagewas identified as the principal technologiesapplicable for addressing stormwater problemsin Merrionette Park Ditch.TABLE 3.22.5Estimated Damages for Merrionette Park DitchDamageCategoryEstimatedDamage ($)Property 393,200Erosion 0NoteTransportation 59,000 Assumed as 15%<strong>of</strong> property damagedue to flooding3.22.3.4 Alternative DevelopmentFlood Control Alternatives. Alternative solutions to regional flooding and streambank erosionproblems were developed and evaluated consistent with the methodology described inSection 1.4 <strong>of</strong> this report. Table 3.22.6 summarizes flood and erosion control alternatives de-3-136
3. TRIBUTARY CHARACTERISTICS AND ANALYSISveloped for Merrionette Park Ditch. No feedback from watershed communities was receivedrelated to stormwater detention alternatives developed for Merrionette Park Ditch.Erosion Control Alternatives. No erosion control alternatives were developed for MerrionettePark Ditch.TABLE 3.22.6Flood Control Alternatives for Merrionette Park DitchAlternative NumberLocationDescriptionMPDT-1 Oak Hill Cemetery Construct 37 acre-feet <strong>of</strong> stormwater detention on Oak HillCemetery property at the southeast corner <strong>of</strong> Central Park Avenueand 119th Street. This alternative did not effectively reducewater surface elevations in the flooding problem area, thus benefitsand costs were not developed.MPDT-2Merrionette ParkDitch at 123rd StreetIncrease size <strong>of</strong> 123rd Street culvert to 5- by 18-foot box culvert.Adequate land for compensatory storage for this alternative wasnot available, thus benefits and costs were not developed.3.22.3.5 Alternative Evaluation and SelectionAlternatives included in Table 3.22.6 were evaluated to determine their effectiveness andproduce data required for the countywide prioritization <strong>of</strong> watershed projects. Flood controlalternatives were evaluated through H&H modeling to evaluate their impact on water elevationsand flood damages. There was not sufficient available space for a detention basinlarger than the 37 acre-feet in volume at the Oak Hill Cemetery property location, evaluatedas MPDT-1. The 37 acre-foot volume was not large enough to reduce flood damages downstream.Alternative MPDT-2 reduced flood damages in the area <strong>of</strong> Merrionette Park Ditch,but increased flow downstream to Stony Creek, as compensatory storage locations were notavailable. Because MPDT-1 was not effective and MPDT-2 lacked potential compensatorystorage locations, benefits and costs were not developed for these alternatives.A number <strong>of</strong> properties are at risk <strong>of</strong> shallow flooding during the 100-year flood event underexisting conditions or recommended alternative conditions. In addition, due to their locations,other properties' risk <strong>of</strong> flooding cannot be feasibly mitigated by structuralmeasures. Such properties are candidates for protection using nonstructural flood controlmeasures, such as flood-pro<strong>of</strong>ing or acquisition. These measures may be considered to addressdamages that are not fully addressed by capital projects recommended in the <strong>Cal</strong>umet-<strong>Sag</strong>Channel <strong>DWP</strong>.3.22.3.6 Data Required for Countywide Prioritization <strong>of</strong> <strong>Water</strong>shed ProjectsNo alternatives are recommended for Merrionette Park Ditch.3-137
3. TRIBUTARY CHARACTERISTICS AND ANALYSIS3.23 Mill CreekMill Creek is a regional waterway located insouthwestern Cook County, in the southern portion<strong>of</strong> the <strong>Cal</strong>umet-<strong>Sag</strong> Channel <strong>Water</strong>shed. The10.6-square-mile drainage area for Mill Creek includes3.1 square miles <strong>of</strong> the tributary area fromMill Creek West Branch, which drains to MillCreek near where Mill Creek crosses 123rdStreet. Table 3.23.1 provides a summary <strong>of</strong> theland area <strong>of</strong> communities within the Mill Creeksubwatershed. Figure 3.23.1 is an overview <strong>of</strong> thetributary area <strong>of</strong> the subwatershed. Reportedstormwater problem areas, flood inundation areas,and proposed alternative projects are alsoshown on the figure and are discussed in the followingsubsections.The Mill Creek subwatershed contains a mix <strong>of</strong>suburban development with large areas <strong>of</strong> openland and forest preserve. Table 3.23.2 summarizesthe land use distribution within the subwatershed.3.23.1 Sources <strong>of</strong> DataTABLE 3.23.1Communities Draining to Mill CreekCommunity Tributary Area (mi 2 )Unincorporated/Forest Preserve5.7Orland Park 3.4Palos Park 1.5TABLE 3.23.2Land Use Distribution for Mill CreekAreaLand Use Category (acres) %Residential 2,801 41.1Forest/Open Land 2,708 39.7<strong>Water</strong>/Wetland 485 7.1Agricultural 299 4.4Commercial/Industrial 256 3.8Institutional 179 2.6Transportation/Utility 86 1.33.23.1.1 Previous StudiesMill Creek Model (IDNR). The HEC-1 and HEC-2 models developed by the IDNR simulated asmall tributary <strong>of</strong> the Mill Creek subwatershed (0.05 square mile). The segment <strong>of</strong> the creekmodeled is about 1,000 feet long from 135th Street to Pine Street in the Village <strong>of</strong> OrlandPark. The purpose <strong>of</strong> the modeling was to size pumps for an existing levee. The size <strong>of</strong> thearea modeled and extent <strong>of</strong> data documented prevented use <strong>of</strong> the model as a part <strong>of</strong> <strong>Cal</strong>umet-<strong>Sag</strong>Channel <strong>DWP</strong> development.Mill Creek Model (IDOT). A study was completed by Mackie Consultants for IDOT on an upstreamtributary to Mill Creek that runs along Southwest Highway (Mackie Consultants,2008). This study was performed to address flooding issues along Southwest Highway. Themodeling extent <strong>of</strong> this study did not meet the <strong>District</strong>’s requirements for use as a part <strong>of</strong> theMill Creek model; however, the results <strong>of</strong> this model and suggested alternatives were reviewedand considered as a part <strong>of</strong> the <strong>Cal</strong>umet-<strong>Sag</strong> Channel <strong>DWP</strong> development.3.23.1.2 <strong>Water</strong> Quality DataThe IEPA does not have any sites in the Ambient <strong>Water</strong> Quality Monitoring Network onMill Creek. No reaches are identified as impaired in the IEPA’s 2008 Integrated <strong>Water</strong> QualityReport, which includes the CWA 303(d) and 305(b) lists. No TMDLs have been establishedfor Mill Creek. According to a USEPA water permit discharge query, there are no NPDESpermits issued by IEPA for discharges to Mill Creek. Municipalities discharging to Mill3-139
CALUMET-SAG DETAILED WATERSHED PLANCreek are regulated by IEPA’s NPDES Phase II Stormwater Permit Program, which was createdto improve the water quality <strong>of</strong> stormwater run<strong>of</strong>f from urban areas, and requires thatmunicipalities obtain permits for discharging stormwater and implement the six minimumcontrol measures for limiting run<strong>of</strong>f pollution to receiving systems.3.23.1.3 Wetland and Riparian AreasFigures 2.3.6 and 2.3.7 contain mapping <strong>of</strong> wetland and riparian areas in the <strong>Cal</strong>umet-<strong>Sag</strong>Channel <strong>Water</strong>shed. Wetland areas were identified using NWI mapping. NWI data includes760 acres <strong>of</strong> wetland area in the Mill Creek subwatershed in Cook County. Riparian areas aredefined as vegetated areas between aquatic and upland ecosystems adjacent to a waterway orbody <strong>of</strong> water that provides flood management, habitat, and water quality enhancement. Identifiedriparian environments <strong>of</strong>fer potential opportunities for restoration.3.23.1.4 Floodplain MappingFlood inundation areas supporting the NFIP were revised in 2008 as a part <strong>of</strong> FEMA’s MapModernization Program. Floodplain boundaries were revised based upon updated CookCounty topographic information, but the effective models, which are used to estimate floodlevels, were generally not updated. LOMRs were incorporated into revised floodplain areas.Mill Creek is mapped in detail in the DFIRM mapping update, with Zone A and Zone AEfloodplain shown across portions <strong>of</strong> Mill Creek. The original H&H analysis was performedin 1979. The hydrologic modeling was performed using TR-20, L-PTIII, and RegressionEquations 73, 75, and 77. Hydraulic routing performed was steady state and used the WSP-2modeling application.Appendix A includes a comparison <strong>of</strong> FEMA’s effective floodplain mapping from updatedDFIRM panels with inundation areas developed for the <strong>DWP</strong>.3.23.1.5 Stormwater Problem DataCommunities, agencies (e.g., IDOT, CCHD), and stakeholders submitted Form B questionnaireresponse data to the <strong>District</strong> summarizing known stormwater problems within theirjurisdictions. Stormwater problems were classified as regional or local based upon the criteriadescribed in Section 1 <strong>of</strong> the report. Table 3.23.3 summarizes the Form B data for Mill Creek.3.23.1.6 Near-Term Planned Projects<strong>Water</strong>shed communities, agencies, and stakeholders were asked about near-term plannedprojects so that the implementation <strong>of</strong> near-term flood control projects by others is consideredin development <strong>of</strong> the <strong>DWP</strong>. The Village <strong>of</strong> Orland Park is in the design phase <strong>of</strong> improvementsto existing stormwater detention basins located upstream <strong>of</strong> Mill Creek near135th Street and 86th Avenue. Models were not available at the time <strong>of</strong> <strong>DWP</strong> development,so the improvements were not included in baseline conditions in the H&H models. The improvementsare intended to address reported problem OP7, and this is noted in the <strong>DWP</strong>.3-140
3. TRIBUTARY CHARACTERISTICS AND ANALYSIS3.23.2 <strong>Water</strong>shed Analysis3.23.2.1 Hydrologic Model DevelopmentSubbasin Delineation. The Mill Creek tributary area was delineated based upon LiDAR topographicdata developed by Cook County in 2003. The original delineation <strong>of</strong> Mill Creek wasreviewed against the Cook County topographic data and aerials. No modification to thesubwatershed boundary was necessary. Forty-five subbasins were delineated for the MillCreek tributary area, with an average subbasin area <strong>of</strong> 152 acres.TABLE 3.23.3Community Response Data for Mill CreekProblemIDMunicipalityProblems asReported byLocal AgencyLocationProblemDescriptionLocal/RegionalResolutionin <strong>DWP</strong>OP1OrlandParkPavement floodingSouthwestHighway and135th St.Flooding severaltimes per yearRegionalProject MICR-4addresses thisproblem.OP13OrlandParkPavement floodingRte 7(SouthwestHwy) at Rte45 (LaGrange Rd.)IDOT reported pavementfloodingRegionalProject MICR-4addresses thisproblem.OP14OrlandParkPavement floodingRoute 7 at145th St. to148th St.IDOT reported pavementfloodingLocalProblem not locatedon a regionalwaterway.This is a localproblem.OP7OrlandParkPondingStrawberryLn. (ParkviewEstates)Flooding due to <strong>of</strong>fsiteflows from outsidevillageRegionalVillage has contractedwithCBBEL to developa project toaddress thisproblem.PP5PalosParkOverbank flooding,basementflooding, waterquality, stormsewer capacity,bank erosion,wetland riparian,maintenance123rd St. betweenHobartAvenue andElm StreetFloodwater exceedsconveyance capacity,and erosion is alsoaffecting northernGroundhog SloughRegionalModel resultsshow roadwayflooding, but noproperty damage.Due to the availability<strong>of</strong> alternativeroutes, aresolution totransportationdamages hasbeen deemedunnecessary.PP6PalosParkOverbank flooding,basementflooding, ponding,storm sewercapacity, bankerosionSouthwestHwy between131st St. and135th St.Flooding due to insufficientcapacity reducesor preventsaccess to businessesin this areaRegionalProject MICR-4addresses thisproblem.3-141
CALUMET-SAG DETAILED WATERSHED PLANTABLE 3.23.3Community Response Data for Mill CreekProblemIDMunicipalityProblems asReported byLocal AgencyLocationProblemDescriptionLocal/RegionalResolutionin <strong>DWP</strong>PP8PalosParkOverbank flooding,basementflooding, stormsewer capacity,bank erosionKinvarraDrive andWild CherryLane (9845Wild CherryLane)Excessive floodwatersresult in flooding <strong>of</strong> anumber <strong>of</strong> houses atleast 3 times in the last10 years. Streammaintenance is requireddownstream toaddress sedimentationand debris.RegionalProject MICR-2addresses thisproblem.PT2PalosTownshipPondingHalfway between104thAve. and IndianTrail Dr.on LakelandDr.Ponding Local Problem not locatedon a regionalwaterway.This is a localproblem.PT3PalosTownshipPondingWest end <strong>of</strong>Bernice Dr.near 104thAve. and131st St.Ponding Local Problem not locatedon a regionalwaterway.This is a localproblem.PT4PalosTownshipPondingIntersection<strong>of</strong> StephenDr. and WalterDr.Ponding Local Problem not locatedon a regionalwaterway.This is a localproblem.PT8PalosTownshipMaintenanceNorth andEast <strong>of</strong> intersection<strong>of</strong>111th Street(Route 83)and 104thAvenueCCHD reported floodingdue to debrisblockages within apoorly maintainedditch on Forest PreservepropertyLocalProblem not locatedon a regionalwaterway.This is a localproblem.Hydrologic Parameter <strong>Cal</strong>culations. CNs were estimated for each subbasin based upon NRCSsoil data and 2001 CMAP land use data. This method is further described in Section 1.3.2,with lookup values for specific combinations <strong>of</strong> land use and soil data presented in AppendixC. An area-weighted average <strong>of</strong> the CN was generated for each subbasin.The lag time, used to convert excess precipitation into a run<strong>of</strong>f hydrograph, was assumed tobe 0.6 times the time <strong>of</strong> concentration for all subbasins. The time <strong>of</strong> concentration, or time <strong>of</strong>travel from the hydrologically most distant part <strong>of</strong> the subbasin, was estimated by usingstandard procedures assuming a length <strong>of</strong> sheet flow, shallow concentrated flow, and channelflow. In some instances, modification to parameter estimates was necessary to more accuratelycharacterize very flat or heavily sewered subwatersheds. Appendix G provides asummary <strong>of</strong> the hydrologic parameters used for subbasins in each subwatershed.3-142
3. TRIBUTARY CHARACTERISTICS AND ANALYSIS3.23.2.2 Hydraulic Model DevelopmentField Data, Investigation, and Existing Model Data. No hydraulic models that met <strong>District</strong> criteria,as identified in Section 6.3.3.2 <strong>of</strong> the CCSMP, were available for <strong>DWP</strong> development.Surveys <strong>of</strong> the open channel part <strong>of</strong> Mill Creek and all crossings were performed to characterizethe channel and near overbank channel geometry. Cross-sectional geometry in thenon-surveyed overbank area was obtained from Cook County topographic data and combinedwith the surveyed channel cross section. Field visits were performed to assess channeland overbank roughness characteristics, which were combined with information from photographsand aerial photography to assign modeled Manning’s n roughness coefficientsalong the modeled stream length.Boundary Conditions. Boundary condition elevations determined for the <strong>Cal</strong>umet-<strong>Sag</strong> Channelbased on output from the CWS model are included in Appendix E. The elevation producedby the CWS model for the 100-year storm at the outlet <strong>of</strong> Mill Creek was 584.64 feetNAVD 88, and was used as the downstream boundary condition for the Mill Creek model.Inflow. The drainage system <strong>of</strong> <strong>Cal</strong>umet-<strong>Sag</strong> Tributary B interacts with the Mill Creek drainagesystem. A railway ditch crosses what was previously a natural drainage divide betweenthe Mill Creek and <strong>Cal</strong>umet-<strong>Sag</strong> Tributary B subwatersheds. When water surface elevationsin Mill Creek reach an elevation <strong>of</strong> 667 feet NAVD 1988, Mill Creek overflows into the railroadditch, which flows to <strong>Cal</strong>umet-<strong>Sag</strong> Tributary B. The overflow hydrograph generated inthe Mill Creek hydraulic model was used as input to <strong>Cal</strong>umet-<strong>Sag</strong> Tributary B hydrologicmodel to properly represent existing conditions. This overflow results in flow <strong>of</strong> floodwatersacross the subwatershed divide and is reflected in an inundation area that crosses thesubwatershed divide in this location.3.23.2.3 <strong>Cal</strong>ibration and VerificationIn the hours following the August 20, 2007 storm, evidence <strong>of</strong> high water elevation markswas observed at four locations on Mill Creek West Branch. The rainfall data from ISWS gage16, which is the rainfall gage closest to the observed high water elevation, was obtained forthis time period. Gage 16 recorded 1.2 inches <strong>of</strong> rainfall over a 7-hour period. High watermarks during the September 13th – 14th, 2008 storm event were not recorded on the MillCreek watershed.Table 3.23.4 lists the locations and elevations <strong>of</strong> the field-observed water surface elevations.The model results are listed for both initial (pre-calibration) model results and calibratedmodel results (with the 10 percent reduction <strong>of</strong> the curve number values applied). The differencebetween the observed and calibrated model water surface elevations are generallyconsidered to be acceptable due to the margin <strong>of</strong> error associated with high water mark elevationdata. High water elevations are taken at a point in time when it is not certain that thepeak water elevation occurred. The comparison <strong>of</strong> observed and model result water surfaceelevations for the August 20, 2007 storm for the Mill Creek subwatershed serves as a verification<strong>of</strong> the curve number reduction made watershed-wide based on the calibration to theSeptember 13th – 14th, 2008 storm event.3-143
CALUMET-SAG DETAILED WATERSHED PLANTABLE 3.23.4Comparison <strong>of</strong> Observed and Model Result <strong>Water</strong> Surface Elevations for August 20, 2007 StormLocationObserved High<strong>Water</strong> SurfaceElevation (ft)Initial Model <strong>Cal</strong>ibrated ModelResults <strong>Water</strong> Results <strong>Water</strong> SurfaceElevation Surface Elevation (ft)(ft)Mill Creek West Branch at Creek Road 678.1 680.37 679.79Mill Creek West Branch at Wild CherryLane675.6 677.21 676.47Mill Creek West Branch at Windsor Drive 674.2 675.43 675.07Mill Creek West Branch at Hobart Drive 658.2 660.48 659.243.23.2.4 Existing Conditions EvaluationFlood Inundation Areas. Flood inundation areas were developed based on HEC-RAS watersurface elevations and Cook County topographic data. Figure 3.23.1, the tributary overviewfigure, shows inundation areas produced by the <strong>DWP</strong>’s hydraulic model for the 100-year,12-hour duration design storm.Hydraulic Pr<strong>of</strong>iles. Appendix H contains hydraulic pr<strong>of</strong>iles <strong>of</strong> existing conditions in the MillCreek system. Pr<strong>of</strong>iles are shown for the 2-, 5-, 10-, 25-, 50-, 100-, and 500-year recurrence intervaldesign storms.3.23.3 Development and Evaluation <strong>of</strong> Alternatives3.23.3.1 Problem DefinitionHydraulic model results were reviewed with inundation mapping to identify locationswhere property damage due to flooding is predicted. Table 3.23.5 summarizes major problemareas identified through modeling <strong>of</strong> Mill Creek.TABLE 3.23.5Modeled Problem Definition for Mill CreekProblemIDLocationRecurrenceInterval <strong>of</strong>Flooding (yr)AssociatedForm BResolution in <strong>DWP</strong>MPA20MPA21MPA22MPA23Area along the SouthwestHwy between LaGrangeRoad and 135th StreetArea around 87th Avenueand 127 th StreetArea around 96th Avenueand Wild Cherry LaneArea around Wild CherryLane and Windsor Drive25, 50, 100, 500 PP6, OP1 Project MICR-4 will reduceflooding in this area.50, 100, 500 Project MICR-4 will reduceflooding in this area.25, 50, 100, 500 PP8 Project MICR-2 will reduceflooding in this area.25, 50, 100, 500 PP8 Sufficient land was not availablein the area for potentialcapital projects that could addressthe problem. Such propertiesare candidates forprotection using nonstructuralflood control measures, suchas floodpro<strong>of</strong>ing or acquisition.3-144
3. TRIBUTARY CHARACTERISTICS AND ANALYSIS3.23.3.2 Damage AssessmentDamages due to flooding were calculatedfor Mill Creek in accordance withthe methodology described in Section1.4 and are summarized in Table 3.23.6.3.23.3.3 Technology ScreeningTABLE 3.23.6Estimated Damages for Mill CreekDamageCategoryEstimatedDamage ($)Property 2,390,000Erosion 0Flood control technologies werescreened to identify those most appropriateto address the flooding problemsin Mill Creek. Stormwater detention andconveyance improvements, along withlevees, were identified as potential technologiesfor addressing flood damages in the Mill Creek watershed. No damages were associatedwith the reach <strong>of</strong> Mill Creek downstream <strong>of</strong> where Mill Creek West Branch dischargesto the main branch <strong>of</strong> Mill Creek.NoteTransportation 849,300 Includes 15% applied toproperty damage andtransportation damagescalculated for flooding <strong>of</strong>Southwest HighwayRecreation 03.23.3.4 Alternative DevelopmentFlood Control Alternatives. Alternative solutions to regional flooding were developed andevaluated consistent with the methodology described in Section 1.4 <strong>of</strong> this report. Table3.23.7 summarizes flood control alternatives developed for Mill Creek.TABLE 3.23.7Flood Control Alternatives for Mill CreekAlternative Number Location DescriptionMICR-1MICR-2MICR-3MICR-4Flooding along SouthwestHighwayFlooding along rightoverbank <strong>of</strong> WBMCFlooding along MICRjust upstream <strong>of</strong> confluencewith WBMCFlooding along SouthwestHighway53 acre-feet detention basin at LaGrange Road and SouthwestHighway, 32 acre-feet detention basin at 131st Streetand Southwest Highway, and increased conveyance capacitythrough replacing 7 existing undersized culverts with 5-foot by10-foot box culverts between the two detention pondsLevee <strong>of</strong>f houses along right overbank to prevent flooding onMill Creek West Branch, provide compensatory storage onopen land adjacent to left overbank46 acre-feet detention along Mill Creek near 127th Street and87th Avenue. This alternative did not effectively reduce watersurface elevations in the flooding problem area, thus benefitsand costs were not developed.32 acre-feet detention basin at 131st Street and SouthwestHighway, and increased conveyance capacity through replacing7 existing undersized culverts with 5-foot by 10-foot boxculverts between the two detention pondsStormwater detention alternatives were modeled to address flooding problems along MillCreek and Mill Creek West Branch. Alternative MICR-1 consists <strong>of</strong> two detention basins:one located at the northeast corner <strong>of</strong> Southwest Highway and LaGrange Road and one locatedat the southeast corner <strong>of</strong> 131st Street and Southwest Highway. A tributary to MillCreek flows along Southwest Highway between these two areas. This tributary flowsthrough seven culverts, all <strong>of</strong> which are frequently overtopped during storm events. Alter-3-145
CALUMET-SAG DETAILED WATERSHED PLANnative MICR-1 replaces all seven culverts with 5-foot by 10-foot box culverts to increaseconveyance capacity. Alternative MICR-1 addresses the flooding described as problem areaMPA20 in Table 3.23.5. This alternative was effective at reducing flood damages in the areaand significantly reducing the frequency <strong>of</strong> overtopping <strong>of</strong> Southwest Highway. This alternativeis similar to the solution proposed in an IDOT report, but includes more storage inorder to address the 100-year storm event (Mackie Consultants, 2008).Alternative MICR-2 consists <strong>of</strong> a levee in the right overbank to prevent flooding in problemarea MPA22. The levee would require compensatory storage, which is proposed in an areain the left overbank opposite the levee. Model results showed that the alternative was effectivein protecting flooded structures in the right overbank area while preventing any increasein upstream or downstream water elevations.Alternative MICR-3 consists <strong>of</strong> 46 acre-feet <strong>of</strong> detention along Mill Creek near 127th Streetand 87th Avenue. Model results showed that this alternative and other similar storage alternativesanalyzed in nearby available areas were not effective in significantly loweringWSELs along Mill Creek. Also, the existing nearby diversion <strong>of</strong> flows from Mill Creek to<strong>Cal</strong>umet-<strong>Sag</strong> Tributary B limits the effectiveness <strong>of</strong> alternatives in this area as lowering theWSEL <strong>of</strong> Mill Creek just upstream <strong>of</strong> the diversion causes less diverted flow to <strong>Cal</strong>umet-<strong>Sag</strong>Tributary B, and does not lower Mill Creek WSELs downstream <strong>of</strong> the diversion. Downstream<strong>of</strong> Southwest Highway, Mill Creek enters Cook County Forest Preserve property.Hydraulic model results determined that the 90th Avenue culvert in this area creates abackwater which contributes to the MPA21 flooding problem area. The culvert size couldnot be increased without increasing downstream WSELs or providing a significant amount<strong>of</strong> detention in the area. The area was not considered for detention alternatives as it was onCook County Forest Preserve property.Alternative MICR-4 was analyzed as an alternative to MICR-1. This alternative consists <strong>of</strong>the same seven culvert replacements along Southwest Highway and the same 32-acre-feetdetention basin located at the corner <strong>of</strong> 131st Street and Southwest Highway without the 53-acre-feet detention basin at Southwest Highway and LaGrange Road that was proposed as apart <strong>of</strong> MICR-1. This alternative was nearly as effective at reducing flood damages in thearea and reducing the frequency <strong>of</strong> overtopping <strong>of</strong> Southwest Highway as MICR-1 at amuch lower cost.Erosion Control Alternatives. No erosion control alternatives were developed for Mill Creek.3.23.3.5 Alternative Evaluation and SelectionModeling analysis concluded that MICR-3 could not provide effective stormwater detentionresulting in flood damage reduction partly because <strong>of</strong> the diversion to <strong>Cal</strong>umet-<strong>Sag</strong> TributaryB. Both the MICR-2 and MICR-4, shown in Figures 3.23.2 and 3.23.3 respectively, alternativesdid lower WSEL and are recommended.Recommended alternatives result in reduced stage and/or flow along the modeled waterway.Table 3.23.8 provides a comparison <strong>of</strong> the modeled maximum WSEL, and modeledflow at the time <strong>of</strong> peak at representative locations along the waterway.3-146
3. TRIBUTARY CHARACTERISTICS AND ANALYSISTABLE 3.23.8Mill Creek Existing and Alternative Condition Flow and WSEL ComparisonExistingConditions MICR-2 MICR-4Location100-yrWSEL(ft)100-yrFlow(cfs)100-yrWSEL(ft)100-yrFlow(cfs)100-yrWSEL(ft)100-yrFlow(cfs)Mill Creek West Branch just upstream <strong>of</strong> WildCherry Ln. 679.97 509.83 679.97 509.83 679.97 509.82Mill Creek West Branch upstream <strong>of</strong> PowellRd. and 96th Ave. 678.33 569.83 678.33 569.83 678.33 569.69Mill Creek 100-ft upstream <strong>of</strong> 135th St. 673.91 347.97 673.91 347.97 673.46 312Mill Creek 100-ft upstream <strong>of</strong> Southwest Hwy 669.2 470.77 669.2 470.77 669.04 463.99Mill Creek 60-ft upstream <strong>of</strong> 123rd St. 652.11 524.58 652.11 524.58 652.06 510.99Mill Creek 50-ft upstream <strong>of</strong> 119th St. 628.29 1386.42 628.29 1386.42 628.16 1352.78A number <strong>of</strong> properties are at risk <strong>of</strong> shallow flooding during the 100-year flood event underexisting conditions or recommended alternative conditions. In addition, due to their locations,other properties' risk <strong>of</strong> flooding cannot be feasibly mitigated by structuralmeasures. Such properties are candidates for protection using nonstructural flood controlmeasures, such as flood-pro<strong>of</strong>ing or acquisition. These measures may be considered to addressdamages that are not fully addressed by capital projects recommended in the <strong>Cal</strong>umet-<strong>Sag</strong>Channel <strong>DWP</strong>.The alternatives listed in Table 3.23.7 were evaluated to determine their effectiveness andproduce data required for the countywide prioritization <strong>of</strong> watershed projects. Flood controlalternatives were modeled to evaluate their impact on water elevations and flood damages.A summary <strong>of</strong> B/C ratios, net benefits, total project costs, number <strong>of</strong> structures protected,and other relevant alternative data is provided in Table 3.23.9. Alternatives that did notproduce a significant change in inundation areas are not listed as benefits were negligible,and thus costs were not calculated for these alternatives.3.23.3.6 Data Required for Countywide Prioritization <strong>of</strong> <strong>Water</strong>shed ProjectsAppendix I presents conceptual level cost estimates for the recommended alternatives. Table3.23.9 lists alternatives analyzed in detail. The recommended alternatives are MICR-2and MICR-4, and are shown in Figures 3.23.2, and 3.23.3. A comparison <strong>of</strong> the existing conditionsand alternative conditions inundation mapping is included in these figures.3-147
CALUMET-SAG DETAILED WATERSHED PLANTABLE 3.23.9Mill Creek Project Alternative Matrix to Support <strong>District</strong> CIP PrioritizationProjectDescriptionB/CRatioNetBenefits ($)Total ProjectCost ($)CumulativeStructuresProtectedFundingPossibilities<strong>Water</strong> QualityBenefitRecommendedCommunitiesInvolvedMICR-1Increased conveyanceand storage0.04 601,900 14,541,200 3 IDOT SlightlyPositiveNoOrland ParkMICR-2 Levee and storage 0.2 409,600 2,003,400 6 SlightlyPositiveYesPalos ParkMICR-4Increased conveyanceand storage0.1 459,000 5,918,100 3 IDOT SlightlyPositiveYesOrland ParkNote: Net Benefits values do not include local benefits or non-economic benefits.3-148
3. TRIBUTARY CHARACTERISTICS AND ANALYSIS3.24 Mosquito CreekMosquito Creek is located in southwestern CookCounty, north <strong>of</strong> the <strong>Cal</strong>umet-<strong>Sag</strong> Channel, in theeastern part <strong>of</strong> the <strong>Cal</strong>umet-<strong>Sag</strong> Channel <strong>Water</strong>shed.Table 3.24.1 summarizes the areas <strong>of</strong> communitiesthat drain to Mosquito Creek, which isalso known as the Alsip Drainage Ditch. The MosquitoCreek subwatershed contains a mix <strong>of</strong> suburbandevelopment and a moderate amount <strong>of</strong>available open land. Most <strong>of</strong> the open land withinthe watershed is cemetery. The drainage area is0.9-square-miles. Figure 3.24.1 provides an overview<strong>of</strong> the tributary area <strong>of</strong> the subwatershed.Mosquito Creek is a mixture <strong>of</strong> open channel andlong sections <strong>of</strong> closed-conduit, and a considerableportion <strong>of</strong> the original tributary area has been divertedthrough sewer pipes to the <strong>Cal</strong>umet-<strong>Sag</strong>Channel. Table 3.24.2 lists the land use breakdownby area within the Mosquito Creek subwatershed.TABLE 3.24.1Communities Draining to Mosquito CreekCommunity Tributary Area (mi 2 )Alsip 0.91TABLE 3.24.2Land Use Distribution for Mosquito CreekAreaLand Use (acres) %Commercial/Industrial 185.9 32Forest/Open Land 171.7 29.6Residential 141.2 24.3Transportation/Utility 81 13.9Institutional 1.2 0.2<strong>Water</strong>/Wetland 0.1 03.24.1 Sources <strong>of</strong> Data3.24.1.1 Previous StudiesNo existing studies <strong>of</strong> Mosquito Creek were identified.3.24.1.2 <strong>Water</strong> Quality DataThe IEPA does not have any sites in the Ambient <strong>Water</strong> Quality Monitoring Network on MosquitoCreek. There are no reaches identified as impaired in the IEPA’s 2008 Integrated <strong>Water</strong>Quality Report, which includes the 303(d) and 305(b) lists. No TMDLs have been established forMosquito Creek. According to a USEPA water permit discharge query, there are no NPDESpermits issued by IEPA for discharges to Mosquito Creek. Municipalities discharging to MosquitoCreek are regulated by IEPA’s NPDES Phase II Stormwater Permit Program, which wascreated to improve the water quality <strong>of</strong> stormwater run<strong>of</strong>f from urban areas, and requires thatmunicipalities obtain permits for discharging stormwater and implement the six minimum controlmeasures for limiting run<strong>of</strong>f pollution to receiving systems.3.24.1.3 Wetland and Riparian AreasFigures 2.3.6 and 2.3.7 contain mapping <strong>of</strong> wetland and riparian areas in the <strong>Cal</strong>umet-<strong>Sag</strong>Channel <strong>Water</strong>shed. Wetland areas were identified using National Wetlands Inventory (NWI)mapping. NWI data includes 6.2 acres <strong>of</strong> wetland areas in the Mosquito Creek subwatershed.Riparian areas are defined as vegetated areas between aquatic and upland ecosystems adjacentto a waterway or body <strong>of</strong> water that provides flood management, habitat, and waterquality enhancement. Identified riparian environments <strong>of</strong>fer potential opportunities for restoration.3-149
CALUMET-SAG DETAILED WATERSHED PLAN3.24.1.4 Floodplain MappingFlood inundation areas supporting the NFIP were revised in 2008 as a part <strong>of</strong> FEMA’s MapModernization Program. Floodplain boundaries were revised based upon updated CookCounty topographic information; however, the effective models, which are used to estimateflood levels, were generally not updated. LOMRs were incorporated in the revised floodplains.Mosquito Creek is not mapped in detail in the DFIRM mapping update; it is currentlymapped as an unnumbered Zone A labeled as the Alsip Drainage Ditch. Therefore,there was no known model that meets the criteria established in Chapter 6 <strong>of</strong> the CCSMP foruse in the development <strong>of</strong> <strong>DWP</strong>s.Appendix A includes a comparison <strong>of</strong> FEMA’s effective floodplain mapping from updatedDFIRM panels with inundation areas developed for the <strong>DWP</strong>.3.24.1.5 Stormwater Problem DataCommunities, agencies (e.g., IDOT, CCHD), and stakeholders submitted Form B questionnaireresponse data to the <strong>District</strong> summarizing known stormwater problems within theirjurisdictions. There were no reported problems along Mosquito Creek.3.24.1.6 Near-Term Planned Projects<strong>Water</strong>shed communities, agencies, and stakeholders were asked about near-term plannedprojects so that the implementation <strong>of</strong> near-term flood control projects by others is consideredin development <strong>of</strong> the <strong>DWP</strong>. No near-term planned projects by others have been identifiedfor the Mosquito Creek subwatershed.3.24.2 <strong>Water</strong>shed Analysis3.24.2.1 Hydrologic Model DevelopmentBecause <strong>of</strong> the drainage pattern <strong>of</strong> Mosquito Creek, with a series <strong>of</strong> local drainageways intermittentwith sewers, but no continuous defined open channel, the subwatershed wasmodeled with hydrologic modeling only. CNs were estimated for each subbasin based uponNRCS soil data and 2001 CMAP land use data. This method is further described in Section1.3.2, with lookup values for specific combinations <strong>of</strong> land use and soil data presented inAppendix C. An area-weighted average <strong>of</strong> the CN was generated for each subbasin.The lag time, used to convert excess precipitation into a run<strong>of</strong>f hydrograph, was assumed tobe 0.6 times the time <strong>of</strong> concentration for all subbasins. The time <strong>of</strong> concentration, or time <strong>of</strong>travel from the hydrologically most distant part <strong>of</strong> the subbasin, was estimated by usingstandard procedures assuming a length <strong>of</strong> sheet flow, shallow concentrated flow, and channelflow. In some instances, modification to parameter estimates was necessary to more accuratelycharacterize very flat or heavily sewered subwatersheds. Appendix G provides asummary <strong>of</strong> the hydrologic parameters used for subbasins in each subwatershed.3.24.3 Development and Evaluation <strong>of</strong> AlternativesThere were no regional problem areas reported or identified through modeling <strong>of</strong> MosquitoCreek, so no alternatives were developed.3-150
3. TRIBUTARY CHARACTERISTICS AND ANALYSIS3.25 Navajo CreekNavajo Creek is located in southwestern CookCounty, south <strong>of</strong> the <strong>Cal</strong>umet-<strong>Sag</strong> Channel, inthe central part <strong>of</strong> the <strong>Cal</strong>umet-<strong>Sag</strong> Channel<strong>Water</strong>shed. Table 3.25.1 lists the areas <strong>of</strong> communitiesthat drain to Navajo Creek. Figure3.25.1 is an overview <strong>of</strong> the tributary area <strong>of</strong>the subwatershed. Reported stormwater problemareas, flood inundation areas, and proposedalternative projects are also shown, andare discussed in the following subsections.The population density <strong>of</strong> the Navajo Creeksubwatershed is relatively high with a mix <strong>of</strong>suburban development and little available openland. The drainage area is roughly 2.9 squaremiles and heavily sewered. Navajo Creek is anatural open-channel stream, except in areas locatedbetween 76th Avenue and Harlem Avenuewhere it passes through a City <strong>of</strong> PalosHeights storm sewer system. Navajo Creek dischargesinto the <strong>Cal</strong>umet-<strong>Sag</strong> Channel. Table3.25.2 lists the land use breakdown by areawithin the Navajo Creek subwatershed.TABLE 3.25.1Communities Draining to Navajo CreekCommunity Tributary Area (mi 2 )Palos Heights 2.21Unincorporated/ForestPreserve0.56Orland Park 0.08Palos Park 0.02TABLE 3.25.2Land Use Distribution for Navajo CreekLand Use Category Area (acres) %Residential 1,175.8 64.1Forest/Open Land 462.8 25.2Institutional 104.5 5.7Commercial/Industrial 48.7 2.7Transportation/Utility 29.2 1.6<strong>Water</strong>/Wetland 12.7 0.73.25.1 Sources <strong>of</strong> Data3.25.1.1 Previous StudiesNo studies <strong>of</strong> Navajo Creek were identified for consideration as a component <strong>of</strong> <strong>DWP</strong> development.3.25.1.2 <strong>Water</strong> Quality DataThe IEPA does not have any sites in the Ambient <strong>Water</strong> Quality Monitoring Network onNavajo Creek. There are no reaches identified as impaired in the IEPA’s 2008 Integrated <strong>Water</strong>Quality Report, which includes the 303(d) and 305(b) lists. No TMDLs have been establishedfor Navajo Creek. Lake Arrowhead is located within the Navajo Creek <strong>Water</strong>shed. Itis an upstream lake that is tributary to Navajo Creek. Lake Arrowhead is listed as impairedfor mercury in the IEPA’s 2008 Integrated <strong>Water</strong> Quality Report. Its identification number isIL_RHZE and its designated use is fish consumption. According to a USEPA water permitdischarge query, there are no NPDES permits issued by IEPA for discharges to NavajoCreek. Municipalities discharging to Navajo Creek are regulated by IEPA’s NPDES Phase IIStormwater Permit Program, which was created to improve the water quality <strong>of</strong> stormwaterrun<strong>of</strong>f from urban areas, and requires that municipalities obtain permits for dischargingstormwater and implement the six minimum control measures for limiting run<strong>of</strong>f pollutionto receiving systems.3-151
CALUMET-SAG DETAILED WATERSHED PLAN3.25.1.3 Wetland and Riparian AreasFigures 2.3.6 and 2.3.7 contain mapping <strong>of</strong> wetland and riparian areas in the <strong>Cal</strong>umet-<strong>Sag</strong>Channel <strong>Water</strong>shed. Wetland areas were identified using National Wetlands Inventory (NWI)mapping. NWI data includes roughly 52.3 acres <strong>of</strong> wetland areas in the Navajo Creek subwatershed.Riparian areas are defined as vegetated areas between aquatic and upland ecosystemsadjacent to a waterway or body <strong>of</strong> water that provides flood management, habitat, andwater quality enhancement. Identified riparian environments <strong>of</strong>fer potential opportunities forrestoration.3.25.1.4 Floodplain MappingFlood inundation areas supporting the NFIP were revised in 2008 as a part <strong>of</strong> FEMA’s MapModernization Program. Floodplain boundaries were revised based upon updated CookCounty topographic information, but the effective models used to estimate flood levels generallywere not updated. LOMRs were incorporated in the revised floodplains.Navajo Creek is mapped in detail in the DFIRM mapping update, with Zone AE floodplaindefined for the length <strong>of</strong> Navajo Creek. According to the FIS, the original hydrologic andhydraulic analysis was performed in 1978. The hydrologic modeling was performed by usingRegression Equations 73 and L-PTIII. Hydraulic routing performed was steady state andused the WSP-2 modeling application.Appendix A includes a comparison <strong>of</strong> FEMA’s effective floodplain mapping from updatedDFIRM panels with inundation areas developed for the <strong>DWP</strong>.3.25.1.5 Stormwater Problem DataCommunities, agencies (e.g., IDOT, CCHD), and stakeholders submitted Form B questionnaireresponse data to the <strong>District</strong> summarizing known stormwater problems within theirjurisdictions. Table 3.25.3 lists reported problems along Navajo Creek. In several cases, separateForm B entries submitted by Palos Heights were combined into a single problem area.This was typically done with individual properties located in the same vicinity that werelisted in multiple locations on Form B questionnaires.3.25.1.6 Near-Term Planned Projects<strong>Water</strong>shed communities, agencies, and stakeholders were asked about near-term plannedprojects so that the implementation <strong>of</strong> near-term flood control projects by others is consideredin development <strong>of</strong> the <strong>DWP</strong>. No near-term planned projects by others have been identifiedfor the Navajo Creek subwatershed.3.25.2 <strong>Water</strong>shed Analysis3.25.2.1 Hydrologic Model DevelopmentSubbasin Delineation. The Navajo Creek tributary area was delineated based upon LiDAR topographicdata developed by Cook County in 2003. Thirteen subbasins were delineated forthe Navajo Creek area, with an average subbasin area <strong>of</strong> 143 acres and a total drainage area <strong>of</strong>2.9 square miles. Storage provided by Lake Arrowhead was included in the hydrologic model.3-152
3. TRIBUTARY CHARACTERISTICS AND ANALYSISHydrologic Parameter <strong>Cal</strong>culations. CNs were estimated for each subbasin based upon NRCSsoil data and 2001 CMAP land use data. This method is further described in Section 1.3.2,with lookup values for specific combinations <strong>of</strong> land use and soil data presented in AppendixC. An area-weighted average <strong>of</strong> the CN was generated for each subbasin.The lag time, used to convert excess precipitation into a run<strong>of</strong>f hydrograph, was assumed tobe 0.6 times the time <strong>of</strong> concentration for all subbasins. The time <strong>of</strong> concentration, or time <strong>of</strong>travel from the hydrologically most distant part <strong>of</strong> the subbasin, was estimated by usingstandard procedures assuming a length <strong>of</strong> sheet flow, shallow concentrated flow, and channelflow. In some instances, modification to parameter estimates was necessary to more accuratelycharacterize very flat or heavily sewered subwatersheds. Appendix G provides asummary <strong>of</strong> the hydrologic parameters used for subbasins in each subwatershed.TABLE 3.25.3Community Response Data for Navajo CreekProblemIDProblems asReported by LocalAgency Location Problem DescriptionPH2 Ponding 12605 Melvina Ave. Ponding in ROWabout 2 to 5 times ayearPH3 Ponding Palos MeadowsSubdivision near131st Street and71st Avenue (includes13013 OakPark Avenue).PH4 Ponding 12500 McCarthy Rd.and on CarmichaelDr. west <strong>of</strong> 76thAve.PH5 Ponding 21 Country SquireCt. near 76th Ave.and College Dr.PH6 Ponding 12601 Harold Ave.,12542 74th Ave.,and 12542 75thAve.PH7 Ponding 124th Avenue and69th Court; and12217 68th CourtPH8Basementflooding, pondingFlooding throughoutneighborhood 2 to 5times a yearStorm sewer restrictionat McCarthy Rd.and ponding atnearby school detentionpondPonding in ROW andfront yard, 2 to 5times a yearPonding in ROW 2 to5 times a yearPonding in ROW 2 to5 times a year12002 Harold Ave. Basement and backyardflooding due narrowconveyance <strong>of</strong>overflow from 76thAvenueLocal/RegionalLocalRegionalLocalLocalLocalLocalLocalResolutionin <strong>DWP</strong>Problem not locatedon a regionalwaterway. This isa local problem.Project NVCR-3addresses thisproblem.Problem not locatedon a regionalwaterway. This is alocal problem.Problem not locatedon a regionalwaterway. This isa local problem.Problem not locatedon a regionalwaterway. This isa local problem.Problem not locatedon a regionalwaterway. This isa local problem.Problem not locatedon a regionalwaterway. This isa local problem.3-153
CALUMET-SAG DETAILED WATERSHED PLANTABLE 3.25.3Community Response Data for Navajo CreekProblemIDProblems asReported by LocalAgency Location Problem DescriptionLocal/RegionalResolutionin <strong>DWP</strong>PH9 Ponding 12102,12232,12303, and 1231271st AvenuePH10 Ponding 12333 69th Ave.near Navajo Creekand Oak Park Ave.and College Dr.Ponding in ROW 2 to5 times a yearFlooding in streetROW in front <strong>of</strong> residence,about 2 to 5times a yearPH12 Ponding 12911 71st Court Sewer backupcaused by high NavajoCreek Elevation2 to 5 times a yearPH13 Ponding 13032 71st Ave. Flooding in backyard2 to 5 times a yearPH14 Ponding 6843 EvergreenAve.PH15 Ponding Approximately 150 ftwest <strong>of</strong> 76th Avenueon north side <strong>of</strong>McIntosh DrivePonding in ROW 2 to5 times a yearFlooding 2 to 5 timesa yearPH16 Flooding 11938 68th Ct. Flooding in ROW 2 to5 times a yearPH17Overbankflooding,basementfloodingNashville Ave. and125th St.PH18 Flooding 127th Street and70th AvenuePH19PH20Basementflooding, ponding,stormsewer capacityPonding,pavementfloodingApproximately 150 ftnorth <strong>of</strong> 131st Streeton west side <strong>of</strong> CypressLane12001 73rd Ct.,12151 73rd Ave.,and 12412 73rdAve.Flooding in ROW 2 to5 times a yearNavajo Creek elevationaffects this areaFlooding 2 to 5 timesa yearFlooding in ROW 2 to5 times a yearLocalProblem not locatedon a regionalwaterway. This isa local problem.Local Problem not locatedon a regionalwaterway. This isa local problem.Local Problem not locatedon a regionalwaterway. This isa local problem.RegionalLocalLocalLocalRegionalRegionalLocalLocalProject NVCR-3addresses thisproblem.Problem not locatedon a regionalwaterway. This isa local stormsewer problem.Problem not locatedon a regionalwaterway. This isa local stormsewer problem.Problem not locatedon a regionalwaterway. This isa local stormsewer problem.Project NVCR-5will reduce floodingin this area.Project NVCR-5will reduce floodingin this area.Problem not locatedon a regionalwaterway. This isa local stormsewer problem.Problem not locatedon a regionalwaterway. This isa local stormsewer problem.3-154
3. TRIBUTARY CHARACTERISTICS AND ANALYSISTABLE 3.25.3Community Response Data for Navajo CreekProblemIDProblems asReported by LocalAgency Location Problem DescriptionLocal/RegionalResolutionin <strong>DWP</strong>PH21Storm sewercapacity7350 Choctaw Rd. Flooding in backyard2 to 5 times a yearLocalProblem not locatedon a regionalwaterway. This isa local stormsewer problem.PH22 Ponding 12224 CheyenneDr.Ponding in ROW 2 to5 times a yearLocalProblem not locatedon a regionalwaterway. This isa local stormsewer problem.PH23 Ponding 12250 76th Ave.and 12223 RichardAve.Ponding in ROW 2 to5 times a yearLocalProblem not locatedon a regionalwaterway. This isa local stormsewer problem.3.25.2.2 Hydraulic Model DevelopmentField Data, Investigation, and Existing Model Data. No hydraulic models that met <strong>District</strong> criteria,as identified in Section 6.3.3.2 <strong>of</strong> the CCSMP, were available for <strong>DWP</strong> development.The open channel <strong>of</strong> Navajo Creek and all crossings were surveyed to characterize thechannel and near overbank geometry. Cross-sectional geometry in the non-surveyed overbankarea was obtained from Cook County topographic data and combined with the surveyedchannel cross section. Field visits were performed to assess channel and overbankroughness characteristics, which were combined with information from photographs andaerial photography to assign modeled Manning’s n roughness coefficient to the stream.Field survey information is available in Appendix D.Boundary Conditions. Appendix E contains boundary condition elevations determined forthe <strong>Cal</strong>umet-<strong>Sag</strong> Channel based on output from the Chicago <strong>Water</strong>way model. The elevationproduced by the CWS model for the 100-year storm at the outlet <strong>of</strong> Navajo Creek was585.02 feet NAVD 88, roughly 4 feet above the invert <strong>of</strong> Navajo Creek near its confluencewith the <strong>Cal</strong>umet-<strong>Sag</strong> Channel. This relatively shallow depth indicates that the downstreamstage on Navajo Creek is controlled not by the receiving system, but by its own capacity toconvey flows received from its tributary area. Normal depth assuming a friction slope <strong>of</strong>0.005 was used as a downstream boundary condition for Navajo Creek.3.25.2.3 <strong>Cal</strong>ibration and VerificationIn the hours following the August 20, 2007 storm, evidence <strong>of</strong> a high water elevation wasobserved at the downstream end <strong>of</strong> Navajo Creek, 240 feet downstream <strong>of</strong> College Drive.The rainfall data from ISWS gage 16, which is the rainfall gage closest to the observed highwater elevation, was obtained for this time period. Gage 16 recorded 1.2 inches <strong>of</strong> rainfallover a 7-hour period. High water marks during the September 13th – 14th, 2008 storm eventwere not recorded on the Navajo Creek watershed.3-155
CALUMET-SAG DETAILED WATERSHED PLANTable 3.25.4 lists the location and elevation <strong>of</strong> the field-observed water surface elevation andthe peak modeled water surface elevation. The model results are listed for both initial (precalibration)model results and calibrated model results (with the 10 percent reduction <strong>of</strong>curve number values applied). The difference between the observed and calibrated modelwater surface elevations are generally considered to be acceptable due to the margin <strong>of</strong> errorassociated with high water mark elevation data. High water elevations are taken at a pointin time when it is not certain that the peak water elevation occurred. The comparison <strong>of</strong> observedand model result water surface elevations for the August 20th, 2007 storm for theNavajo Creek subwatershed serves as a verification <strong>of</strong> the curve number reduction madewatershed-wide based on the calibration to the September 13th – 14th, 2008 storm event.TABLE 3.25.4Comparison <strong>of</strong> Observed and Model Result <strong>Water</strong> Surface Elevations for August 20, 2007 Storm EventLocationObserved High <strong>Water</strong>Surface Elevation (ft)Initial Model Results<strong>Water</strong> SurfaceElevation (ft)<strong>Cal</strong>ibrated ModelResults <strong>Water</strong>Surface Elevation (ft)240 feet downstream <strong>of</strong>College Drive585.0 586.01 585.693.25.2.4 Existing Conditions EvaluationFlood Inundation Areas. Figure 3.25.1 shows inundation areas produced by the <strong>DWP</strong>’s hydraulicmodel for the 100-year, 12-hour duration design storm.Hydraulic Pr<strong>of</strong>iles. Appendix H contains hydraulic pr<strong>of</strong>iles <strong>of</strong> existing conditions in the NavajoCreek system. Pr<strong>of</strong>iles are shown for the 2-, 5-, 10-, 25-, 50-, 100-, and 500-year recurrenceinterval design storms.3.25.3 Development and Evaluation <strong>of</strong> Alternatives3.25.3.1 Problem DefinitionHydraulic model results were reviewed with inundation mapping to identify locationswhere property damage due to flooding is predicted. Table 3.25.5 summarizes problem areasidentified through hydraulic modeling <strong>of</strong> Navajo Creek.TABLE 3.25.5Modeled Problem Definition for Navajo CreekProblemIDLocationRecurrenceInterval (yr) <strong>of</strong>FloodingAssociatedForm BResolution in <strong>DWP</strong>MPA25Area east <strong>of</strong> Harlem Avenue, around127th Street5, 10, 25, 50,100, 500PH18Project NVCR-5 willreduce flooding inthis area.MPA26Area around S. Oak Park Avenue north<strong>of</strong> W. 125th Street25, 50, 100, 500 PH17 Project NVCR-5 willreduce flooding inthis area.3-156
3. TRIBUTARY CHARACTERISTICS AND ANALYSISTABLE 3.25.5Modeled Problem Definition for Navajo CreekProblemIDLocationRecurrenceInterval (yr) <strong>of</strong>FloodingAssociatedForm BResolution in <strong>DWP</strong>MPA27Northeast side <strong>of</strong> Trinity Christian College500 Project NVCR-5 willreduce flooding inthis area.3.25.3.2 Damage AssessmentEconomic damages were defined followingthe protocol defined in Chapter 6.6 <strong>of</strong> theCCSMP. No erosion or recreation damagesdue to flooding were identified for NavajoCreek. Transportation damages were estimatedas 15 percent <strong>of</strong> property damages. Table3.25.6 lists the damage assessment forexisting conditions.TABLE 3.25.6Estimated Damages for Navajo CreekDamageCategoryEstimatedDamage ($)Property 2,817,200Erosion 0NoteTransportation 497,100 Assumed as 15%<strong>of</strong> property damagedue to flooding3.25.3.3 Technology ScreeningFlood control technologies were screened to identify those most appropriate for addressingthe flooding problems in Navajo Creek. Increased conveyance or storage was identified asthe principal technologies applicable for addressing stormwater problems in Navajo Creek.3.25.3.4 Alternative DevelopmentFlood Control Alternatives. Alternative solutions to regional flooding and streambank erosionproblems were developed and evaluated consistent with the methodology described inSection 1.4 <strong>of</strong> this report. Table 3.25.7 provides a summary <strong>of</strong> flood and erosion control alternativesdeveloped for Navajo Creek.Based on community feedback, flood damage reduction alternatives developed for NavajoCreek were focused on detention facilities and channel diversions. The City <strong>of</strong> Palos Heightssuggested several potential locations for detention facilities. These included a Lake Arrowheadexpansion by raising an existing forest preserve pathway by one additional foot, asteep ravine area near Misty Meadow Drive and Kirkcaldy Court, and along a downstreamportion <strong>of</strong> Navajo Creek on Trinity Christian College property. The City <strong>of</strong> Palos Heightsalso suggested Harlem Avenue, 70th Avenue, and Oak Park Avenue as potential channeldiversion alignment locations.Alternatives are described in Table 3.25.7. Figure 3.25.2 shows the locations and a summary<strong>of</strong> the alternatives described in Table 3.25.7. Alternatives NVCR-1, NVCR-2, and NVCR-4involve large amounts <strong>of</strong> excavation to construct stormwater detention facilities. AlternativeNVCR-3 does not involve significant excavation, but rather is a minor modification to an existingpond to provide a small amount <strong>of</strong> additional detention volume. Alternatives NVCR-5, NVCR-6, NVCR-7, and NVCR-8 require significant conveyance infrastructure to deliverflows from Navajo Creek to the <strong>Cal</strong>umet-<strong>Sag</strong> Channel. Regulatory approval from regulatory3-157
CALUMET-SAG DETAILED WATERSHED PLANagencies such as IDNR and the USACE would be required. The increased conveyancewould involve new outfalls with additional flow to the <strong>Cal</strong>umet-<strong>Sag</strong> Channel. Other alternativesrecommended in the <strong>DWP</strong> include storage and will result in lower peak dischargerates at points where tributaries discharge to the <strong>Cal</strong>umet-<strong>Sag</strong> Channel. All flows from individualtributaries are relatively small in comparison to total flow within the <strong>Cal</strong>umet-<strong>Sag</strong>Channel.Erosion Control Alternatives. There were no erosion control alternatives analyzed for NavajoCreek.3.25.3.5 Alternative Evaluation and SelectionAlternatives included in Table 3.25.7 were evaluated to determine their effectiveness andproduce data required for the countywide prioritization <strong>of</strong> watershed projects. Flood controlalternatives were modeled to evaluate their impact on water elevations and flood damages.Table 3.25.10 provides a summary <strong>of</strong> B/C ratio, net benefits, total project costs, number <strong>of</strong>structures protected, and other relevant alternative data.Alternatives that did not produce a significant change in inundation areas (NVCR-1, NVCR-2, NVCR-4, NVCR-6, and NVCR-9) are not listed as benefits were negligible, and thus costswere not calculated for these alternatives. NVCR-3 consists <strong>of</strong> expanding Lake Arrowheadby raising an existing forest preserve pathway by a height <strong>of</strong> one additional foot. Hydrologicmodel results demonstrated that this alternative effectively prevents the 100-yearstorm event from overtopping, thus preventing flooding problems related to Lake Arrowheadovertopping immediately downstream <strong>of</strong> Lake Arrowhead.Although alternative NVCR-8 has a higher B/C ratio, alternative NVCR-5 is recommendedbecause there is the potential <strong>of</strong> cost-sharing with the City <strong>of</strong> Palos Heights, which indicatedthrough community feedback that an alignment along Harlem Avenue may provide a potentialopportunity for the City to address its local problems. NVCR-7 is not recommendedbecause it addresses the same problem area as NVCR-5, which has a better B/C ratio.NVCR-11, which is the combination <strong>of</strong> NVCR-5 and NVCR-8, was analyzed separately inorder to determine the benefits realized by the construction <strong>of</strong> both diversions. NVCR-11 resultedin a lower B/C ratio than NVCR-5, so NVCR-5 alone was recommended.3-158
3. TRIBUTARY CHARACTERISTICS AND ANALYSISTABLE 3.25.7Flood Control Alternatives for Navajo CreekAlternativeNumber Location DescriptionNVCR-1NVCR-2NVCR-3NVCR-4Harlem Avenue andNavajo CreekTrinity Christian College(between MenomoneeParkway and 122ndStreet)Lake Arrowhead Expansionon CookCounty Forest Preserveproperty southeast <strong>of</strong>131st Street and HarlemAvenueArea northeast <strong>of</strong> MistyMeadow Drive and KirkcaldyCourtProposed 23 acre-foot detention pond at Harlem Avenue nearNavajo Creek outfall from City <strong>of</strong> Palos Heights storm sewer ina current area <strong>of</strong> open space. This alternative did not effectivelyreduce water surface elevations in the flooding problem area,thus benefits and costs were not developed.Two online ponds totaling 180 acre-feet <strong>of</strong> detention on TrinityChristian College property. Considered concurrently with AlternativeNVCR-1. This alternative did not effectively reduce watersurface elevations in the flooding problem area, thus benefitsand costs were not developed.Expansion <strong>of</strong> Lake Arrowhead by raising existing forest preservepathway by 1 foot, creating 16 acre-feet <strong>of</strong> additional detention.Proposed 22 acre-feet pond located upstream <strong>of</strong> Navajo Creekand cut into a steep ravine in a residential area. This alternativedid not effectively reduce water surface elevations in the floodingproblem area, thus benefits and costs were not developed.NVCR-5 Harlem Avenue Channel diversion at intersection <strong>of</strong> creek and Harlem Avenue.The pipe diameter was maximized to fit along entire route toNavajo Creek, while maintaining a minimum 2 feet <strong>of</strong> cover.NVCR-6 76th Avenue Channel diversion at intersection <strong>of</strong> creek and 76th Avenue.The pipe diameter was maximized to fit along entire route toNavajo Creek, while maintaining a minimum 2 feet <strong>of</strong> cover.This alternative did not effectively reduce water surface elevationsin the flooding problem area, thus benefits and costs werenot developed.NVCR-7 70th Avenue Channel diversion at intersection <strong>of</strong> creek and 70th Avenue.The pipe diameter was maximized to fit along entire route toNavajo Creek, while maintaining a minimum 2 feet <strong>of</strong> cover.NVCR-8 Oak Park Avenue Channel diversion at intersection <strong>of</strong> creek and Oak Park Avenue.The pipe diameter was maximized to fit along entire routeto Navajo Creek, while maintaining a minimum 2 feet <strong>of</strong> coverNVCR-9NVCR-11Between Harlem Aveand Menominee ParkwayBetween Harlem Aveand Menominee ParkwayIncrease various combinations <strong>of</strong> culvert sizes within the problemarea in attempt to reduce flooding. This alternative did noteffectively reduce water surface elevations in the flooding problemarea, thus benefits and costs were not developed.Channel diversions along Harlem Ave and Channel diversionalong Oak Park AveRecommended alternatives result in reduced stage and/or flow along the modeled waterway.Table 3.25.8 provides a comparison <strong>of</strong> the modeled maximum WSEL, and modeledflow at the time <strong>of</strong> peak at representative locations along the waterway.A number <strong>of</strong> properties are at risk <strong>of</strong> shallow flooding during the 100-year flood event underexisting conditions or recommended alternative conditions. In addition, due to their locations,other properties' risk <strong>of</strong> flooding cannot be feasibly mitigated by structural3-159
CALUMET-SAG DETAILED WATERSHED PLANmeasures. Such properties are candidates for protection using nonstructural flood controlmeasures, such as flood-pro<strong>of</strong>ing or acquisition. These measures may be considered to addressdamages that are not fully addressed by capital projects recommended in the <strong>Cal</strong>umet-<strong>Sag</strong>Channel <strong>DWP</strong>.TABLE 3.25.8Navajo Creek Existing and Alternative Condition Flow and WSEL ComparisonExisting ConditionsNVCR-3 NVCR-5LocationStationMaxWSEL(ft)MaxFlow(cfs)MaxWSEL(ft)MaxFlow(cfs)MaxWSEL(ft)MaxFlow(cfs)Lake Arrowhead N/A 630.2 228.9 630.6* 18.3 630.2 228.9Upstream <strong>of</strong> 76thAve. 14417 634.17 326.23 634.17 326.23 634.17 326.29Upstream <strong>of</strong> 70thAve. 8914 617.87 859.99 617.87 859.99 617.52 650.54230-ft downstream<strong>of</strong> Oak Park Ave. 6218 612.33 1027.11 612.33 1027.11 611.83 801.22230-ft upstream <strong>of</strong>College Dr. 974 596.19 1139.85 596.19 1139.85 595.78 891.08Confluence with<strong>Cal</strong>umet-<strong>Sag</strong>Channel 272 585.99 1149.00 585.99 1149.00 585.37 896.16* Alternative NVCR-3 consists <strong>of</strong> raising the berm elevation at Lake Arrowhead from 630 ft to631 ft to contain the 100-year storm event within Lake Arrowhead.Hydraulic modeling results identified two roadway crossings (state route, US highway, orfour-lane road or greater) where Navajo Creek overtops for storm events <strong>of</strong> 100-year recurrenceinterval and below. Table 3.25.9 below lists the two locations and provides a summary<strong>of</strong> the depth <strong>of</strong> road flooding for existing conditions and with recommended alternatives.Limited available land and topography prevented the reduction <strong>of</strong> flooding <strong>of</strong> College Driveto less than 0.5 feet <strong>of</strong> depth under alternative conditions.TABLE 3.25.9Navajo Creek Road Overtopping SummaryRoad CrossingRoadElevation50-yr Depth<strong>of</strong> flooding100-yr Depth<strong>of</strong> flooding127th Street 618.9 0.5 0.8127th Street (with alternative NVCR-5) 618.9 0.1 0.4College Drive 594.6 0.2 1.0College Drive (with alternative NVCR-5) 594.6 0.6Note: Blank entry indicates that road crossing does not overtop for that particular storm event.Although College Drive experiences overtopping greater than 0.5 feet under alternative conditions,alternate routes are available.3-160
3. TRIBUTARY CHARACTERISTICS AND ANALYSIS3.25.3.6 Data Required for Countywide Prioritization <strong>of</strong> <strong>Water</strong>shed ProjectsAppendix I presents conceptual level cost estimates for the recommended alternatives. Table3.25.10 lists alternatives analyzed in detail. The recommended alternatives are NVCR-3,raising <strong>of</strong> the berm downstream <strong>of</strong> Lake Arrowhead and NVCR-5, construction <strong>of</strong> a channeldiversion from Navajo Creek to the <strong>Cal</strong>umet-<strong>Sag</strong> Channel beneath Harlem Avenue. The location<strong>of</strong> NVCR-3 is shown in Figure 3.25.2 and the location <strong>of</strong> NVCR-5 is shown in Figure3.25.3. A comparison <strong>of</strong> the existing conditions and alternative conditions inundation mappingis included in these figures.3-161
CALUMET-SAG DETAILED WATERSHED PLANTABLE 3.25.10Navajo Creek Project Alternative Matrix to Support <strong>District</strong> CIP PrioritizationProjectDescriptionB/CRatioNet Benefits($)Total ProjectCost ($)CumulativeStructuresProtectedFundingPossibilities<strong>Water</strong> QualityBenefitRecommendedCommunitiesInvolvedNVCR-3Raise Lake Arrowhead berm three feet toprovide one-foot <strong>of</strong> additional storageand two feet <strong>of</strong> freeboard0.69 98,700 143,900 15 No Impact Yes PalosHeightsNVCR-5 Harlem Avenue channel diversion 0.15 1,148,300 7,903,100 29 No Impact Yes PalosHeightsNVCR-7 70th Avenue channel diversion 0.12 693,500 5,721,300 19 No Impact No PalosHeightsNVCR-8 Oak Park Avenue channel diversion 0.21 873,600 4,085,000 19 No Impact No PalosHeightsNVCR-11Channel diversion along Harlem Ave andChannel diversion along Oak Park Ave0.14 1,678,000 11,988,100 33 No Impact No PalosHeightsNote: Net Benefits values do not include local benefits or non-economic benefits.3-162
3. TRIBUTARY CHARACTERISTICS AND ANALYSIS3.26 Oak Lawn CreekOak Lawn Creek is located in southwestern CookCounty, north <strong>of</strong> the <strong>Cal</strong>umet-<strong>Sag</strong> Channel, in thenorthern part <strong>of</strong> the <strong>Cal</strong>umet-<strong>Sag</strong> Channel <strong>Water</strong>shed.Table 3.26.1 lists the area <strong>of</strong> each communitytributary to Oak Lawn Creek. The populationdensity <strong>of</strong> the Oak Lawn Creek subwatershed isrelatively high with a mix <strong>of</strong> urban developmentand little available open land. Figure 3.26.1 is anoverview <strong>of</strong> the tributary area <strong>of</strong> the subwatershed.Reported stormwater problem areas, floodinundation areas, and proposed alternative projectsare also shown in the figure and discussed inthe following subsections.The drainage area is 3.7 square miles. A stormwaterdetention pond, known as Lake Oak Lawn,is located at the upstream end <strong>of</strong> the openchannelpart <strong>of</strong> Oak Lawn Creek, which consistsprimarily <strong>of</strong> a manmade channel parallel to theNorfolk and Western Railroad. Oak Lawn Creekdischarges into West Stony Creek. Table 3.26.2lists the land use breakdown by area within theOak Lawn Creek subwatershed.TABLE 3.26.1Communities Draining to Oak Lawn CreekCommunity Tributary Area (mi 2 )Oak Lawn 3.08Burbank 0.36Chicago Ridge 0.18Hometown 0.05TABLE 3.26.2Land Use Distribution for Oak Lawn CreekLand Use Category Area (acres) %Residential 1,582 67.5Commercial/Industrial 499 21.3Institutional 144.5 6.2Forest/Open Land 94.8 4.0Transportation/Utility 21.5 0.9<strong>Water</strong>/Wetland 1.9 0.13.26.1 Sources <strong>of</strong> Data3.26.1.1 Previous StudiesNo studies <strong>of</strong> Oak Lawn Creek were identified for consideration as a component <strong>of</strong> <strong>DWP</strong>development.3.26.1.2 <strong>Water</strong> Quality DataThe IEPA does not have any sites in the Ambient <strong>Water</strong> Quality Monitoring Network on OakLawn Creek. There are no reaches identified as impaired in the IEPA’s 2008 Integrated <strong>Water</strong>Quality Report, which includes the CWA 303(d) and 305(b) lists. No TMDLs have been establishedfor Oak Lawn Creek. According to a USEPA water permit discharge query, there are noNPDES permits issued by IEPA for discharges to Oak Lawn Creek. Municipalities dischargingto Oak Lawn Creek are regulated by IEPA’s NPDES Phase II Stormwater Permit Program,which was created to improve the water quality <strong>of</strong> stormwater run<strong>of</strong>f from urban areas, andrequires that municipalities obtain permits for discharging stormwater and implement the sixminimum control measures for limiting run<strong>of</strong>f pollution to receiving systems.3.26.1.3 Wetland and Riparian AreasFigures 2.3.6 and 2.3.7 contain mapping <strong>of</strong> wetland and riparian areas in the <strong>Cal</strong>umet-<strong>Sag</strong>Channel <strong>Water</strong>shed. Wetland areas were identified using National Wetlands Inventory (NWI)3-163
CALUMET-SAG DETAILED WATERSHED PLANmapping. NWI data includes 3.4 acres <strong>of</strong> wetland areas in the Oak Lawn Creek subwatershed.Riparian areas are defined as vegetated areas between aquatic and upland ecosystems adjacentto a waterway or body <strong>of</strong> water that provides flood management, habitat, and water quality enhancement.Identified riparian environments <strong>of</strong>fer potential opportunities for restoration.3.26.1.4 Floodplain MappingFlood inundation areas supporting the NFIP were revised in 2008 as a part <strong>of</strong> FEMA’s MapModernization Program. Floodplain boundaries were revised based upon updated CookCounty topographic information, but the effective models used to estimate flood levels generallywere not updated. LOMRs were incorporated in the revised floodplains.Oak Lawn Creek is mapped in detail in the DFIRM mapping update, with Zone AE floodplaindefined for the length <strong>of</strong> Oak Lawn Creek. According to the FIS, the original hydrologicand hydraulic analysis was performed in 1979. The hydrologic modeling was performed byusing Regression Equations 73 and 74, and L-PTIII. Hydraulic routing performed was steadystate and used the WSP-2 modeling application.Appendix A includes a comparison <strong>of</strong> FEMA’s effective floodplain mapping from updatedDFIRM panels with inundation areas developed for the <strong>DWP</strong>.3.26.1.5 Stormwater Problem DataCommunities, agencies (e.g., IDOT, CCHD), and stakeholders submitted Form B questionnaireresponse data to the <strong>District</strong> summarizing known stormwater problems within theirjurisdictions. Table 3.26.3 lists reported problems along Oak Lawn Creek, which includeflooding and erosion problems. Problem OL7 includes bank erosion that threatens residentialstructures. There are about 12 homes in the area within 30 feet <strong>of</strong> the eroding streambank and another 3 homes where the bank is actively eroding but still farther than 30 feetfrom structures. The channel bank has a slope <strong>of</strong> approximately 2:1 and a 16-foot depth, creatingsignificant shear stresses during flooding conditions when the creek overtops thebanks. Several residents have relocated fences a distance <strong>of</strong> at least 5 feet numerous timesdue to loss <strong>of</strong> land.TABLE 3.26.3Community Response Data for Oak Lawn CreekProblemIDMunicipalityProblems asReported byLocal Agency Location Problem DescriptionLocal/RegionalResolution in <strong>DWP</strong>OL7OakLawnSevere bankerosion, sedimentation,maintenance,water quality,overbankfloodingOak Lawn Creekbetween Mayfieldand Central avenues(near 99thStreet and MenardAvenue)Severe bank erosionsuch that residentialstructures are threatenedalong Oak LawnCreek.Regional Project OLCR-3 willaddress this erosionproblem on a regionalwaterway thatthreatens structuresby stabilizing streambanks.3-164
3. TRIBUTARY CHARACTERISTICS AND ANALYSISTABLE 3.26.3Community Response Data for Oak Lawn CreekProblemIDMunicipalityProblems asReported byLocal Agency Location Problem DescriptionLocal/RegionalResolution in <strong>DWP</strong>OL8OakLawnStorm sewercapacity,bank erosion,sedimentation,waterquality, overbankfloodingLake Oak Lawnalong East andWest Shore DriveSevere bank erosionsuch that shorelines,adjacent walks, andstructures risk failing.Poorer water quality andloss <strong>of</strong> wildlife habitatdue to increased sedimentationfrom bankerosion.Regional Project OLCR-1 expansion<strong>of</strong> Lake OakLawn will includeaddressing existingerosion and sedimentationproblemswithin Lake OakLawn, and reduceflooding.3.26.1.6 Near-Term Planned Projects<strong>Water</strong>shed communities, agencies, and stakeholders were asked about near-term plannedprojects so that the implementation <strong>of</strong> near-term flood control projects by others is consideredin development <strong>of</strong> the <strong>DWP</strong>. No near-term planned projects by others have been identifiedfor the Oak Lawn Creek subwatersheds.3.26.2 <strong>Water</strong>shed Analysis3.26.2.1 Hydrologic Model DevelopmentSubbasin Delineation. The Oak Lawn Creek tributary area was delineated based upon LiDARtopographic data developed by Cook County in 2003. Twenty-one subbasins were delineatedfor the Oak Lawn Creek area, with an average subbasin area <strong>of</strong> 112 acres and a total drainagearea <strong>of</strong> 3.7 square miles.Hydrologic Parameter <strong>Cal</strong>culations. CNs were estimated for each subbasin based upon NRCSsoil data and 2001 CMAP land use data. This method is further described in Section 1.3.2,with lookup values for specific combinations <strong>of</strong> land use and soil data presented in AppendixC. An area-weighted average <strong>of</strong> the CN was generated for each subbasin.The lag time, used to convert excess precipitation into a run<strong>of</strong>f hydrograph, was assumed tobe 0.6 times the time <strong>of</strong> concentration for all subbasins. The time <strong>of</strong> concentration, or time <strong>of</strong>travel from the hydrologically most distant part <strong>of</strong> the subbasin, was estimated by usingstandard procedures assuming a length <strong>of</strong> sheet flow, shallow concentrated flow, and channelflow. In some instances, modification to parameter estimates was necessary to more accuratelycharacterize very flat or heavily sewered subwatersheds. Appendix G provides asummary <strong>of</strong> the hydrologic parameters used for subbasins in each subwatershed.3.26.2.2 Hydraulic Model DevelopmentField Data, Investigation, and Existing Model Data. No hydraulic models that met <strong>District</strong> criteria,as identified in Section 6.3.3.2 <strong>of</strong> the CCSMP, were available for <strong>DWP</strong> development. Theopen channel <strong>of</strong> Oak Lawn Creek and all crossings were surveyed to characterize the channeland near overbank geometry. Cross-sectional geometry in the non-surveyed overbank areawas obtained from Cook County topographic data and combined with the surveyed channelcross section. Field visits were performed to assess channel and overbank roughness charac-3-165
CALUMET-SAG DETAILED WATERSHED PLANteristics, which were combined with information from photographs and aerial photography toassign modeled Manning’s n roughness coefficient to the stream. Storage provided by LakeOak Lawn was included in the hydraulic modeling.Boundary Conditions. The Oak Lawn Creek model was combined with the Stony Creekmodel, with Oak Lawn Creek directly tributary to West Stony Creek.3.26.2.3 <strong>Cal</strong>ibration and VerificationNo measured or observed stages were available for Oak Lawn Creek to support model calibration.<strong>Cal</strong>ibration and verification <strong>of</strong> the Stony Creek model is discussed in Section3.28.2.3. Results <strong>of</strong> the hydraulic model did show overbank flooding <strong>of</strong> areas consistent withpast observed flooding in the Village <strong>of</strong> Oak Lawn. Curve numbers were reduced by10 percent for existing and alternative conditions analysis based upon the calibration <strong>of</strong>streams with monitoring data as described in Section 1.3.8.3.26.2.4 Existing Conditions EvaluationFlood Inundation Areas. Figure 3.26.1 shows inundation areas produced by the <strong>DWP</strong>’s hydraulicmodel for the 100-year, 12-hour duration design storm.Hydraulic Pr<strong>of</strong>iles. Appendix H contains hydraulic pr<strong>of</strong>iles <strong>of</strong> existing conditions in the OakLawn Creek system. Pr<strong>of</strong>iles are shown for the 2-, 5-, 10-, 25-, 50-, 100-, and 500-year recurrenceinterval design storms.3.26.3 Development and Evaluation <strong>of</strong> Alternatives3.26.3.1 Problem DefinitionHydraulic model results were reviewed with inundation mapping to identify locationswhere property damage due to flooding is predicted. Table 3.26.4 summarizes problem areasidentified through hydraulic modeling <strong>of</strong> Oak Lawn Creek.3-166
3. TRIBUTARY CHARACTERISTICS AND ANALYSISTABLE 3.26.4Modeled Problem Definition for Oak Lawn CreekProblemIDLocationRecurrenceInterval (yr) <strong>of</strong>FloodingAssociatedForm BResolution in <strong>DWP</strong>MPA28MPA29MPA30Area surrounding Lake Oak Lawn(bounded by Central Avenue, 95thStreet, 54th Avenue, and EdisonAvenue)Area between Mayfield Avenue and54th Avenue, south <strong>of</strong> Oak LawnCreek, and north <strong>of</strong> 101st StreetArea between Ridgeland Avenue andCentral Avenue, north <strong>of</strong> Oak LawnCreek, and south <strong>of</strong> 97th Street100 OL8 Project OLCR-1 willinclude addressing existingerosion andsedimentation problemswithin Lake OakLawn, and reduceflooding. Sufficient landwas not available toaddress all flooding inthis area. Such propertiesare candidates forprotection using nonstructuralflood controlmeasures, such asflood-pro<strong>of</strong>ing or acquisition.25, 50, 100 Sufficient land was notavailable to reduceflooding in this area.Such properties arecandidates for protectionusing nonstructuralflood control measures,such as floodpro<strong>of</strong>ingor acquisition.25, 50, 100 Projects STCR-2 andSTCR-3 will reduceflooding in this area.3.26.3.2 Damage AssessmentEconomic damages were defined following theprotocol defined in Chapter 6.6 <strong>of</strong> the CCSMP.No recreation damages due to flooding wereidentified for Oak Lawn Creek. Erosion damageswere determined based on the values <strong>of</strong>structures located within 30-feet <strong>of</strong> areas <strong>of</strong> activeerosion. Transportation damages were estimatedas 15 percent <strong>of</strong> property damages.Table 3.26.5 lists the damage assessment for existingconditions.TABLE 3.26.5Estimated Damages for Oak Lawn CreekDamageCategoryEstimatedDamage ($)Property 6,268,400Erosion 3,081,000NoteTransportation 940,300 Assumed as 15%<strong>of</strong> property damagedue to flooding3.26.3.3 Technology ScreeningFlood control technologies were screened to identify those most appropriate for addressing theflooding problems in Oak Lawn Creek. Increased conveyance or storage was identified as theprincipal technologies applicable for addressing stormwater problems in Oak Lawn Creek.3-167
CALUMET-SAG DETAILED WATERSHED PLANTABLE 3.26.6Flood Control and Erosion Control Alternatives for Oak Lawn CreekProblemAlternative Addressed Location DescriptionOLCR-1 Flooding Lake Oak Lawn Construct 30 acre-feet <strong>of</strong> additional stormwaterdetention by expanding Lake Oak Lawnfurther north to 95th Street through existingpark land and one commercial property on95th Street.OLCR-2 Flooding Lake Oak Lawn Construct 80 acre-feet <strong>of</strong> additional stormwaterdetention by expanding Lake Oak Lawnfurther north to 95th Street through existingpark land and one commercial property on95th Street. This alternative also assumesproperty acquisition <strong>of</strong> 24 neighboring homes.This alternative was deemed infeasible basedon community feedback, thus benefits andcosts were not developed.OLCR-3 Erosion Oak Lawn Creek betweenMayfield Avenueand Central AvenueStabilize banks <strong>of</strong> Oak Lawn Creek at its confluencewith Stony Creek to prevent structuralfailure <strong>of</strong> channel banks.3.26.3.4 Alternative DevelopmentFlood Control Alternatives. Alternative solutions to regional flooding and streambank erosionproblems were developed and evaluated consistent with the methodology described inSection 1.4 <strong>of</strong> this report. Table 3.26.6 summarizes flood and erosion control alternatives developedfor Oak Lawn Creek.Based on community feedback, stormwater detention alternatives developed for Oak LawnCreek were focused on the area surrounding Lake Oak Lawn and also within a park at 99thStreet and Meade Avenue. Modeling showed that detention at the 99th Street and MeadeAvenue location did not significantly lower WSELs in Oak Lawn Creek. Modeling showedthat alternative OLCR-1, which consists <strong>of</strong> a 30 acre-feet expansion <strong>of</strong> Lake Oak Lawn, didreduce WSELs and flood damages.In conjunction with the expansion <strong>of</strong> Lake Oak Lawn, the existing erosion problems in thearea will also be addressed through proper stabilization <strong>of</strong> the expanded lake. The 30 acrefeetexpansion assumes that the lake can be widened by taking a portion <strong>of</strong> both West ShoreDrive and East Shore Drive and making the streets narrower for one-way traffic only. It isalso possible to expand the lake an additional 30 acre-feet without taking a portion <strong>of</strong> thestreets, but this would involve taking all park land to the north. Alternative OLCR-2 wasmodeled, but was not considered further due to community feedback regarding the requirement<strong>of</strong> land currently occupied by 24 existing residences.Erosion Control Alternative. The alternative proposed to address the erosion problems alongOak Lawn Creek will provide hard armoring <strong>of</strong> the bank where erosion is occurring.Roughly 2,200 feet <strong>of</strong> armoring is required to address the problem area. This armoring isconceptually developed to include costs consistent with traditional approaches to armoringsuch as concrete walls. As an alternative to using concrete, there are other hard-armoringerosion protection techniques available to stabilize Oak Lawn Creek that will give a more3-168
3. TRIBUTARY CHARACTERISTICS AND ANALYSISnatural appearance than concrete. Given its urban setting with limited space available, thestraight alignment <strong>of</strong> Oak Lawn Creek will likely have to remain. However, through the use<strong>of</strong> rock and geotextile fabric, a hard-armoring protection technique can be designed to protectthe slope in a more aesthetically pleasing way. This type <strong>of</strong> bank treatment will bekeyed-in for toe-<strong>of</strong>-slope protection and there will be transitions to the natural slope at thedownstream end <strong>of</strong> the problem area near the Stony Creek Golf Course. The treatment willbe scaled to the gradient <strong>of</strong> the slope and the shear stresses to which the slope is exposed.3.26.3.5 Alternative Evaluation and SelectionAlternatives included in Table 3.26.6 were evaluated to determine their effectiveness andproduce data required for the countywide prioritization <strong>of</strong> watershed projects. Flood controlalternatives were evaluated through H&H modeling to evaluate their effect on water elevationsand flood damages. Erosion control alternatives were evaluated through field investigationsto recommend appropriate stream bank stabilization alternatives. Table 3.26.9provides a summary B/C ratio, net benefits, total project costs, number <strong>of</strong> structures protected,and other relevant alternative data. Alternatives that did not produce a significantchange in inundation areas are not listed as benefits were negligible, and thus costs were notcalculated for these alternatives.Recommended alternatives result in reduced stage and/or flow along the modeled waterway.Table 3.26.7 provides a comparison <strong>of</strong> the modeled maximum WSEL, and modeledflow at the time <strong>of</strong> peak at representative locations along the waterway.TABLE 3.26.7Oak Lawn Creek Existing and Alternative Condition Flow and WSEL ComparisonExisting ConditionsOLCR-1LocationStationMaxWSEL (ft)Max Flow(cfs)Max WSEL(ft)Max Flow(cfs)Southeast corner <strong>of</strong> 95th St. and 54th St. 5771 605.65 919.28 605.35 901.56Parkside Ave and Edison Ave 4856 598.26 875.52 598.17 857.0599th St and Mayfield Ave. 2823 595.74 623.85 595.73 618.45Confluence with Stony Creek 155 595.22 526.02 595.20 531.18Hydraulic modeling results identified one roadway crossing (state route, US highway, orfour-lane road or greater) where Oak Lawn Creek overtops for storm events <strong>of</strong> 100-year recurrenceinterval and below by a depth <strong>of</strong> 0.5 feet or greater. Table 3.26.8 below provides asummary <strong>of</strong> the depth <strong>of</strong> road flooding for existing conditions and with recommended alternatives.Following implementation <strong>of</strong> alternative OLCR-1, the model results show thatthere will be a minimal decrease in the depth <strong>of</strong> flooding for each storm event. Lack <strong>of</strong>available space and the topography <strong>of</strong> the area prevented the development <strong>of</strong> alternativesthat could further reduce the flooding.3-169
CALUMET-SAG DETAILED WATERSHED PLANA number <strong>of</strong> properties are at risk <strong>of</strong> shallow flooding during the 100-year flood event underexisting conditions or recommended alternative conditions. In addition, due to their locations,other properties' risk <strong>of</strong> flooding cannot be feasibly mitigated by structuralmeasures. Such properties are candidates for protection using nonstructural flood controlmeasures, such as flood-pro<strong>of</strong>ing or acquisition. These measures may be considered to addressdamages that are not fully addressed by capital projects recommended in the <strong>Cal</strong>umet-<strong>Sag</strong>Channel <strong>DWP</strong>.TABLE 3.26.8Oak Lawn Creek Road Overtopping SummaryRoad CrossingRoadElevation5-yrDepth <strong>of</strong>flooding10-yrDepth <strong>of</strong>flooding25-yrDepth <strong>of</strong>flooding50-yrDepth <strong>of</strong>flooding100-yrDepth <strong>of</strong>floodingCentral Avenue 594.6 0.5 1.5 2.8 3.6 4.4Central Avenue(with alternative) 594.6 0.3 1.4 2.7 3.5 4.3Note: Although Central Avenue experiences overtopping, alternate routes are available.3.26.3.6 Data Required for Countywide Prioritization <strong>of</strong> <strong>Water</strong>shed ProjectsAppendix I presents conceptual level cost estimates for the recommended alternatives. Table3.26.9 lists recommended alternatives analyzed in detail. The recommended alternativesare OLCR-1 and OLCR-3, shown in Figures 3.26.2 and 3.26.3 respectively. A comparison <strong>of</strong>the existing conditions and alternative conditions inundation mapping is included in thesefigures.3-170
3. TRIBUTARY CHARACTERISTICS AND ANALYSISTABLE 3.26.9Oak Lawn Creek Project Alternative Matrix to Support <strong>District</strong> CIP PrioritizationAlternativeDescriptionB/CRatioNet Benefits($)Total ProjectCost ($)CumulativeStructuresProtectedFundingPossibilities<strong>Water</strong> QualityBenefit Recommended Communities InvolvedOLCR-1Lake Oak LawnExpansion(30 additional ac-ft)0.07 450,000 6,306,100 35 SlightlyPositiveYesOak LawnOLCR-3Stabilize Oak LawnCreek betweenMayfield Ave andCentral Ave0.42 3,081,000 7,299,200 15 SlightlyPositiveYesOak LawnNote: Net Benefits values do not include local benefits or non-economic benefits.3-171
3. TRIBUTARY CHARACTERISTICS AND ANALYSIS3.27 Spring CreekSpring Creek is a regional waterway located insouthwestern Cook County, in the southern part<strong>of</strong> the <strong>Cal</strong>umet-<strong>Sag</strong> Channel <strong>Water</strong>shed. The totaldrainage area <strong>of</strong> the Spring Creek subwatershedis 2.6 square miles, which includes somedrainage area from Will County. Table 3.27.1summarizes the communities within CookCounty that drain to Spring Creek. Figure 3.27.1is an overview <strong>of</strong> the tributary area <strong>of</strong> the subwatershed.Reported stormwater problem areas,flood inundation areas, and proposed alternativeprojects are also shown and discussed in thefollowing subsections.The Spring Creek subwatershed contains a mix<strong>of</strong> suburban development with some openspace. Table 3.27.2 summarizes the land use distributionwithin the Spring Creek subwatershed.3.27.1 Sources <strong>of</strong> DataTABLE 3.27.1Communities Draining to Spring CreekCommunity Tributary Area (mi 2 )Orland Park 1.75Unincorporated/ForestPreserve0.85TABLE 3.27.2Land Use Distribution for Spring CreekLand Use Category Area (acres) %Agricultural 651 32.6Commercial/Industrial 90 4.5Forest/Open Land 453 22.7Institutional 44 2.2Residential 612 30.6<strong>Water</strong>/Wetland 147 7.43.27.1.1 Previous StudiesWill County recently created H&H models <strong>of</strong> existing conditions in Spring Creek to examinefloodplain areas and channel improvements for part <strong>of</strong> Spring Creek in Will County. Themodel extent does not contain the part <strong>of</strong> Spring Creek in Cook County and does not beginat the county line, and therefore, did not contribute directly to the development <strong>of</strong> the <strong>Cal</strong>umet-<strong>Sag</strong>Channel <strong>DWP</strong>.3.27.1.2 <strong>Water</strong> Quality DataThe IEPA does not have any sites in the Ambient <strong>Water</strong> Quality Monitoring Network onSpring Creek. Spring Creek is identified as impaired in the IEPA’s 2008 Integrated <strong>Water</strong>Quality Report, which includes the 303(d) and 305(b) lists. Spring Creek is on the IEPA’s303(d) list due to total manganese, total phosphorous, sedimentation and siltation. NoTMDLs have been established for Spring Creek. According to a USEPA water permit dischargequery, there is one NPDES permit issued by IEPA to the Andrew Corporation in OrlandPark for discharges to Spring Creek. Municipalities discharging to Spring Creek areregulated by IEPA’s NPDES Phase II Stormwater Permit Program, which was created toimprove the water quality <strong>of</strong> stormwater run<strong>of</strong>f from urban areas, and requires that municipalitiesobtain permits for discharging stormwater and implement the six minimum controlmeasures for limiting run<strong>of</strong>f pollution to receiving systems.3.27.1.3 Wetland and Riparian AreasFigures 2.3.6 and 2.3.7 contain mapping <strong>of</strong> wetland and riparian areas in the <strong>Cal</strong>umet-<strong>Sag</strong>Channel <strong>Water</strong>shed. Wetland areas were identified using National Wetlands Inventory (NWI)3-173
CALUMET-SAG DETAILED WATERSHED PLANmapping. NWI data for 2001 identify 181.6 acres <strong>of</strong> wetland areas in the Spring Creek Tributaryarea. Riparian areas are defined as vegetated areas between aquatic and upland ecosystemsadjacent to a waterway or body <strong>of</strong> water that provides flood management, habitat, and waterquality enhancement. Identified riparian environments <strong>of</strong>fer potential opportunities for restoration.3.27.1.4 Floodplain MappingFlood inundation areas supporting the NFIP were revised in 2008 as a part <strong>of</strong> FEMA’s MapModernization Program. Floodplain boundaries were revised based upon updated CookCounty topographic information, but the effective models used to estimate flood levels generallywere not updated. LOMRs were incorporated into revised floodplain areas.Spring Creek is mapped in detail in the DFIRM mapping update, with Zone AE floodplainshown across the length <strong>of</strong> Spring Creek. The original hydrologic and hydraulic analyseswere performed in 1976. The hydrologic modeling used Regression Equations 73 and 75.The hydraulic routing was steady state and used the WSP-2 modeling application.Appendix A includes a comparison <strong>of</strong> FEMA’s effective floodplain mapping from updatedDFIRM panels with inundation areas developed for the <strong>DWP</strong>.3.27.1.5 Stormwater Problem DataCommunities, agencies (e.g., IDOT, CCHD), and stakeholders submitted Form B questionnaireresponse data to the <strong>District</strong> summarizing known stormwater problems within theirjurisdictions. Stormwater problems were classified as regional or local based upon the criteriadescribed in Section 1 <strong>of</strong> the report. Table 3.27.3 summarizes the Form B data for SpringCreek.TABLE 3.27.3Community Response Data for Spring CreekProblemIDMunicipalityProblems asReported byLocal AgencyLocationProblemDescriptionLocal/RegionalResolutionin <strong>DWP</strong>OT1OrlandTownshipOverbankflooding, ponding114th Courtand 157thStreetHeavy rainscause overflow<strong>of</strong> Spring Creekinto adjacentsubdivisionRegionalProject SPCR-1 willraise 157th Street toreduce frequency <strong>of</strong>transportation damageOP10OrlandParkMaintenance,overbankfloodingDelugaWoods subdivisionbetween155thand 159thStreetsLack <strong>of</strong> maintenancein unincorporatedarearesults in overbankfloodingRegionalModel results did notshow property damagedue to flooding from aregional waterway inthis area. Streammaintenance is recommended.OP4OrlandParkPavementfloodingSouthwestHighway at151st StreetIDOT reportedpavement floodingLocalProblem not locatedalong a regional waterway.This is a localproblem3-174
3. TRIBUTARY CHARACTERISTICS AND ANALYSIS3.27.1.6 Near-Term Planned Projects<strong>Water</strong>shed communities, agencies, and stakeholders were asked about near-term plannedprojects so that the implementation <strong>of</strong> near-term flood control projects by others is consideredin development <strong>of</strong> the <strong>DWP</strong>. No near-term planned projects by others have been identifiedfor the Spring Creek subwatershed.3.27.2 <strong>Water</strong>shed Analysis3.27.2.1 Hydrologic Model DevelopmentSubbasin Delineation. The Spring Creek subwatershed was delineated based upon LiDAR topographicdata developed by Cook County in 2003. The subwatershed drainage area includes0.07 square mile <strong>of</strong> area in Will County that drain into Cook County. This area had availableLiDAR topographic data and was delineated in the same manner as the drainage area withinCook County.Fifteen subbasins were delineated for the Spring Creek Tributary area, with an average area<strong>of</strong> 111 acres and a total drainage area <strong>of</strong> 2.6 square miles.Hydrologic Parameter <strong>Cal</strong>culations. CNs were estimated for each subbasin based upon NRCSsoil data and 2001 CMAP land use data. This method is further described in Section 1.3.2,with lookup values for specific combinations <strong>of</strong> land use and soil data presented in AppendixC. An area-weighted average <strong>of</strong> the CN was generated for each subbasin.The lag time, used to convert excess precipitation into a run<strong>of</strong>f hydrograph, was assumed tobe 0.6 times the time <strong>of</strong> concentration for all subbasins. The time <strong>of</strong> concentration, or time <strong>of</strong>travel from the hydrologically most distant part <strong>of</strong> the subbasin, was estimated by usingstandard procedures assuming a length <strong>of</strong> sheet flow, shallow concentrated flow, and channelflow. In some instances, modification to parameter estimates was necessary to more accuratelycharacterize very flat or heavily sewered subwatersheds. Appendix G provides asummary <strong>of</strong> the hydrologic parameters used for subbasins in each subwatershed.3.27.2.2 Hydraulic Model DevelopmentField Data, Investigation, and Existing Model Data. No hydraulic models that met <strong>District</strong> criteria,as identified in Section 6.3.3.2 <strong>of</strong> the CCSMP, were available for <strong>DWP</strong> development.The open channel <strong>of</strong> Spring Creek and all crossings were surveyed to characterize the channeland near overbank geometry. Cross-sectional geometry in the non-surveyed overbankarea was obtained from Cook County topographic data and combined with the surveyedchannel cross section. Field visits were performed to assess channel and overbank roughnesscharacteristics, which were combined with information from photographs and aerialphotography to assign modeled Manning’s n roughness coefficient to the stream. AppendixD contains field survey information in digital form.Boundary Conditions. The downstream extent <strong>of</strong> the Spring Creek model is the point atwhich Spring Creek drains into Will County. The slope <strong>of</strong> the main channel there is 0.00083.Normal depth based on this slope was set as the boundary condition for Spring Creek at thepoint <strong>of</strong> discharge into Will County.3-175
CALUMET-SAG DETAILED WATERSHED PLAN3.27.2.3 <strong>Cal</strong>ibration and VerificationNo measured or observed stages were available for Spring Creek to compare model results.Curve numbers were reduced by 10 percent for existing and alternative conditions analysisbased upon the calibration <strong>of</strong> streams with monitoring data as described in Section 1.3.8.3.27.2.4 Existing Conditions EvaluationFlood Inundation Areas. Flood inundation areas were developed based on HEC-RAS watersurface elevations and Cook County topographic data. Figure 3.27.1 shows inundation areasfor the 100-year, 12-hour duration design storm.Hydraulic Pr<strong>of</strong>iles. Appendix H contains hydraulic pr<strong>of</strong>iles <strong>of</strong> existing conditions in theSpring Creek system. Pr<strong>of</strong>iles are shown for the 2-, 5-, 10-, 25-, 50-, 100-, and 500-year recurrenceinterval design storms.3.27.3 Development and Evaluation <strong>of</strong> Alternatives3.27.3.1 Model Problem DefinitionHydraulic model results were reviewed with inundation mapping to identify locationswhere property damage due to flooding is predicted. No property damage due to floodingwas identified in the Spring Creek subwatershed. Overtopping <strong>of</strong> 157th Street, which providesthe only means <strong>of</strong> access to a subdivision west <strong>of</strong> Spring Creek, was identified as amodeled problem area, as shown in Table 3.27.4. The overtopping <strong>of</strong> this local road wasconsidered a regional problem because as the only means <strong>of</strong> access to a subdivision, overtopping<strong>of</strong> this road by flooding would cut <strong>of</strong>f emergency access to the entire subdivision.TABLE 3.27.4Modeled Problem Definition for Spring CreekProblemIDLocationRecurrenceInterval <strong>of</strong>Flooding (yr)AssociatedForm BResolutionin <strong>DWP</strong>MPA33157th Street crossing <strong>of</strong>Spring Creek10, 25, 50, 100 OT1 Project SPCR-1 will raise 157thStreet to reduce frequency <strong>of</strong> transportationdamage3.27.3.2 Damage AssessmentEconomic damages were defined following the protocol defined in Chapter 6.6 <strong>of</strong> theCCSMP. No property damage due to flooding is predicted based upon existing conditionsH&H modeling analysis. No erosion or recreation damages were identified for SpringCreek. Transportation damages were explicitly calculated for Spring Creek as the crossing <strong>of</strong>157th Street was identified by modeling and WPC members as a frequent flooding issuepreventing the only means <strong>of</strong> access to a subdivision west <strong>of</strong> Spring Creek. Transportationdamages were calculated using the method outlined in “What is a Benefit?” was used(FEMA 2001), using the same period <strong>of</strong> analysis and discount rate used for property damagedue to flooding calculations. Table 3.27.5 lists the existing conditions damages for SpringCreek.3-176
3. TRIBUTARY CHARACTERISTICS AND ANALYSIS3.27.3.3 Technology ScreeningFlood control technologies werescreened to identify those most appropriateto address the floodingproblems in the Spring Creek subwatershed.Conveyance improvements,increased storage, and leveeswere considered to address theMPA33 problem at the 157th Streetcrossing.TABLE 3.27.5Estimated Damages for Spring CreekDamageCategoryEstimatedDamage ($)Property 0Erosion 0NoteTransportation 24,100 Specific transportation damagescalculated for emergencyaccess restrictions at157th Street.Recreation 03.27.3.4 Alternative DevelopmentFlood Control Alternatives. Alternative solutions to regional flooding were developed andevaluated to address the damages estimated in Table 3.27.5 consistent with the methodologydescribed in Section 1.4 <strong>of</strong> this report. Table 3.27.6 summarizes the flood control alternativesdeveloped for Spring Creek.TABLE 3.27.6Flood Control Alternatives for Spring CreekAlternative Location DescriptionSPCR-1SPCR-2SPCR-3Spring Creek at157th StreetSpring Creek from157th Street to 159thStreetSpring Creek at157th StreetRaise 157th Street to prevent overtopping, replace culvert with largerculvert, and construct upstream restrictor and weir with same hydraulicsas existing conditions.Dredge Spring Creek to increase conveyance. This alternative did noteffectively reduce water surface elevations in the flooding problemarea, thus benefits and costs were not developed.Raise Road and provide in-line storage to lower downstream WSELand prevent 157th Street from flooding. This alternative caused an increasein upstream water surface elevations, thus benefits and costswere not developed.Erosion Control Alternatives. No erosion control alternatives were developed for SpringCreek.3.27.3.5 Alternative Evaluation and SelectionAlternative SPCR-1 addresses transportation damages associated with the overtopping <strong>of</strong>157th Street by raising the road. The hydraulic structure at the crossing would be designedto maintain existing hydraulic conditions upstream and downstream <strong>of</strong> 157th Street. Theculvert would be replaced with two large box culverts with capacity to convey the 100-yeardesign storm. Upstream <strong>of</strong> the road, a weir is proposed to be built to the existing elevation<strong>of</strong> the road, with a low flow pipe equal in size to the existing culvert. Noneconomic criteriais a significant factor in development and consideration <strong>of</strong> this alternative for recommendationas community feedback from Orland Township indicated that frequent flooding <strong>of</strong>157th Street cuts <strong>of</strong>f emergency access to an Orland Township neighborhood.SPCR-2 involves dredging parts <strong>of</strong> Spring Creek, as suggested by WPC members. This alternativehad little impact on modeled WSELs because downstream restrictions limitedconveyance capacity. Damages and a cost estimate were not defined for this alternative.3-177
CALUMET-SAG DETAILED WATERSHED PLANModel results determined that SPCR-3 increased upstream stage, and therefore cannot berecommended in the <strong>DWP</strong>.Alternatives included in Table 3.27.6 were evaluated to determine their effectiveness andproduce data required for the countywide prioritization <strong>of</strong> watershed projects. Flood controlalternatives were modeled to evaluate their impact on water elevations and flood damages.Table 3.27.8 provides a summary B/C ratio, net benefits, total project costs, number <strong>of</strong> structuresprotected, and other relevant alternative data. Alternatives that did not produce a significantchange in inundation areas are not listed, as benefits were negligible, and so costswere not calculated for these alternatives.Table 3.27.7 below provides a summary <strong>of</strong> the depth <strong>of</strong> road flooding for the 157th Streetcrossing for existing conditions and with recommended alternatives.TABLE 3.27.7Spring Creek Road Overtopping SummaryRoad CrossingRoadElevation25-yr Depth<strong>of</strong> Flooding50-yr Depth<strong>of</strong> Flooding100-yr Depth<strong>of</strong> Flooding157th Street 690.1 0.6 1.2 1.6157th Street (with alternative SPCR-1) 693.1Note: Blank entry indicates that road crossing does not overtop for that particular storm event.3.27.3.6 Data Required for Countywide Prioritization <strong>of</strong> <strong>Water</strong>shed ProjectsAppendix I presents conceptual level cost estimates for the recommended alternatives. Table3.27.8 lists alternatives analyzed in detail. Alternative SPCR-1 is recommended to addresstransportation damages. Figure 3.27.2 shows the location <strong>of</strong> recommended alternativeSPCR-1 and a comparison <strong>of</strong> the inundation mapping for existing conditions and with therecommended alternative.3-178
3. TRIBUTARY CHARACTERISTICS AND ANALYSISTABLE 3.27.8Spring Creek Project Alternative Matrix to Support <strong>District</strong> CIP PrioritizationProjectDescriptionB/CRatioNetBenefits($)TotalProjectCost ($)CumulativeStructuresProtectedFundingPossibilities<strong>Water</strong>QualityBenefitRecommendedCommunitiesInvolvedSPCR-1 Raise 157th street 0.02 24,100 1,053,800 0 Orland Township No Impact Yes Orland TownshipNote: Net Benefits values do not include local benefits or non-economic benefits.3-179
3. TRIBUTARY CHARACTERISTICS AND ANALYSIS3.28 Stony CreekStony Creek, which consists <strong>of</strong> an East andWest Branch, is located in southwestern CookCounty, north <strong>of</strong> the <strong>Cal</strong>umet-<strong>Sag</strong> Channeland in the northern part <strong>of</strong> the <strong>Cal</strong>umet-<strong>Sag</strong>Channel <strong>Water</strong>shed. East Stony Creek andWest Stony Creek are connected at their upstreamextent through the Cicero Avenuestorm sewer. The area is near 111th Street andCicero Avenue in Alsip. Five major tributariesdischarge into Stony Creek, making up a 40.5square mile area. Oak Lawn Creek, MelvinaDitch, Lucas Diversion Ditch, and Lucas Ditchflow into West Stony Creek. Merrionette ParkDitch flows into East Stony Creek. Each tributarywaterway was analyzed in detail and isdiscussed separately in this report. MosquitoCreek also flows into East Stony Creek, but itwas not analyzed in detail since most <strong>of</strong> thatarea is drained by storm sewer systems.Figures 3.28.1a, 3.28.1b, and 3.28.1c show theareas directly tributary to Stony Creek (but donot include major tributary subwatersheds,which are addressed in separate sections <strong>of</strong>this report). Table 3.28.1 lists the communitieslocated in areas directly tributary to the StonyCreek subwatershed. Areas directly tributaryto Stony Creek in general are heavily drainedby storm sewer systems. Figures 3.28.1a,3.28.1b, and 3.28.1c show an overview <strong>of</strong> thetributary area <strong>of</strong> the subwatershed. Reportedstormwater problem areas, flood inundationareas, and proposed alternative projects arealso shown and discussed in the followingsubsections. Table 3.28.2 lists the land usebreakdown by area within the Stony Creeksubwatershed.TABLE 3.28.1Communities Draining to Stony CreekCommunityTributaryArea (mi 2 )Oak Lawn 8.52Burbank 4.12Palos Hills 3.96Evergreen Park 3.10Bedford Park 2.57Chicago Ridge 2.2Bridgeview 2.14Hickory Hills 1.46Chicago 5.03Worth 0.82Unincorporated/Forest Preserve 1.89Justice 0.12Hometown 0.05Alsip 3.22Blue Island 1.14Merrionette Park 0.39Note: This list includes community areas tributary tothe entire Stony Creek system. It includes upstreammajor tributaries, such as Melvina Ditch, which arealso discussed separately in this report.TABLE 3.28.2Land Use Distribution for Stony CreekLand Use Category Area (acres) %Residential 14,916 57.5Commercial/Industrial 4,506.8 17.4Forest/Open Land 3,971 15.3Institutional 1,404 5.4Transportation/Utility 889.2 3.43.28.1 Sources <strong>of</strong> Data<strong>Water</strong>/Wetland 180 0.7Agricultural 69 0.33.28.1.1 Previous StudiesThe USACE produced an extensive study <strong>of</strong> Stony Creek in 2001. The study included thedevelopment <strong>of</strong> a hydrologic (HEC-1) and hydraulic (UNET) model <strong>of</strong> Stony Creek. TheUSACE’s hydrologic model was referred to during the development <strong>of</strong> an updated hydro-3-181
CALUMET-SAG DETAILED WATERSHED PLANlogic model for the <strong>Cal</strong>umet-<strong>Sag</strong> Channel <strong>DWP</strong>. The USACE’s hydraulic model was obtainedand converted to HEC-RAS and used to support the <strong>DWP</strong> development.The USACE study analyzed several project alternatives to address flooding in the StonyCreek basin, but none is known to be implemented. The alternatives analyzed by theUSACE as a part <strong>of</strong> its study were reviewed, and the information was used in conceptualizingalternatives for the <strong>DWP</strong>. In some cases, alternatives described in this report include featuresconsistent with those developed and evaluated by the USACE.3.28.1.2 <strong>Water</strong> Quality DataThe IEPA does not have any sites in the Ambient <strong>Water</strong> Quality Monitoring Network onStony Creek. There are also no reaches identified as impaired in the IEPA’s 2008 Integrated <strong>Water</strong>Quality Report (which includes the CWA 303[d] and 305[b] lists). No TMDLs have been establishedfor Stony Creek. According to a USEPA water permit discharge query, there are noNPDES permits issued by IEPA for discharges to Stony Creek. Municipalities discharging toStony Creek are regulated by IEPA’s NPDES Phase II Stormwater Permit Program, which wascreated to improve the water quality <strong>of</strong> stormwater run<strong>of</strong>f from urban areas, and requires thatmunicipalities obtain permits for discharging stormwater and implement the six minimumcontrol measures for limiting run<strong>of</strong>f pollution to receiving systems.3.28.1.3 Wetland and Riparian AreasFigures 2.3.6 and 2.3.7 contain mapping <strong>of</strong> wetland and riparian areas in the <strong>Cal</strong>umet-<strong>Sag</strong>Channel <strong>Water</strong>shed. Wetland areas were identified using National Wetlands Inventory (NWI)mapping. NWI data includes roughly 295.5 acres <strong>of</strong> wetland areas in the Stony Creek subwatershed(including Stony Creek tributaries described with additional detail in this report such asthe Melvina Ditch tributary). Riparian areas are defined as vegetated areas between aquatic andupland ecosystems adjacent to a waterway or body <strong>of</strong> water that provides flood management,habitat, and water quality enhancement. Identified riparian environments <strong>of</strong>fer potential opportunitiesfor restoration.3.28.1.4 Floodplain MappingFlood inundation areas supporting the NFIP were revised in 2008 as a part <strong>of</strong> FEMA’s MapModernization Program. Floodplain boundaries were revised based upon updated CookCounty topographic information; however, the effective models, which are used to estimateflood levels, were generally not updated. LOMRs were incorporated into revised floodplainareas. Stony Creek is mapped in detail in the DFIRM mapping update, with Zone AE floodplainshown across the length <strong>of</strong> Stony Creek. The original H&H analysis was performedbetween 1978 and 1980. The hydrologic modeling was performed by using Regression Equations73 and 74, L-PTIII, and TR-20. Hydraulic routing performed was steady state and usedthe WSP-2 modeling application.Appendix A includes a comparison <strong>of</strong> FEMA’s effective floodplain mapping from updatedDFIRM panels with inundation areas developed for the <strong>DWP</strong>.3-182
3. TRIBUTARY CHARACTERISTICS AND ANALYSISTABLE 3.28.3Community Response Data for Stony CreekProblemIDMunicipalityProblems asReported byLocal Agency Location Problem DescriptionLocal/RegionalResolutionin <strong>DWP</strong>CP1<strong>Cal</strong>umetParkPavementfloodingI-57 at127th St.(Burr OakAve.)IDOT reportedpavement floodingLocalProblem not locatedon a regional waterway.This is a localproblem.CP2<strong>Cal</strong>umetPark, ChicagoPavementfloodingI-57 at119th St.IDOT reportedpavement floodingLocalProblem not locatedon a regional waterway.This is a localproblem.OL1 Oak Lawn Maintenance CentralAvenue, 1/4mile south<strong>of</strong> 103rdStreetSiltation observed insouth culvert barrelRegionalSiltation may be addressedthroughmaintenance activitiesOL2 Oak Lawn Bank Erosion Stony Creekbetween103rd Streetand CentralAvenueResident reportserosion, <strong>District</strong> fieldstaff observed severalexposed outfallsRegionalErosion problem doesnot threaten structuresor conveyance<strong>of</strong> Stony Creek. Notaddressed by <strong>DWP</strong>.OL3Oak Lawn,ChicagoPavementFloodingPulaskiRoad and102ndStreetIDOT reportedpavement floodingLocalProblem not locatedon a regional waterway.This is a localproblem.OL5 Oak Lawn OverbankFlooding,BasementFlooding,Ponding, <strong>Water</strong>Quality,Storm SewerCapacity99th Streetto 103rdStreet betweenCicero AvenueandCentralAvenueHigh water stageson West StonyCreek may limitdrainage capacity <strong>of</strong>Oak Lawn sewersLocalProblem not locatedon a regional waterway.This is a localproblem.OL6 Oak Lawn Sedimentation,BankErosion,Maintenance102ndStreet andMerrimacAvenue(near Metratracks)Severe bank erosion,bank collapse,and sedimentationat confluence <strong>of</strong> OakLawn Creek andStony CreekRegionalProject STCR-10 willaddress erosion problemthat threatensconveyance capacity<strong>of</strong> Stony Creek bystabilizing banks, removingsediment, andrepairing culvert.OL9 Oak Lawn OverbankFlooding,Storm SewerCapacity,Bank Erosion,Sedimentation,<strong>Water</strong> QualityWolfe WildlifeRefuge(from CiceroAvenue and111th Streetto CentralAvenue and105thStreet)Bank erosion alongStony Creek West inwildlife preservecauses additionalsedimentation, reducingstorm sewercapacity and contributingto overbankflooding in the areaRegionalProject STCR-3 (expansion<strong>of</strong> WolfeWildlife Refuge detention)will reduceflooding in this area.3-183
CALUMET-SAG DETAILED WATERSHED PLANTABLE 3.28.3Community Response Data for Stony CreekProblemIDMunicipalityProblems asReported byLocal Agency Location Problem DescriptionLocal/RegionalResolutionin <strong>DWP</strong>WO1 Worth PavementfloodingRidgelandAvenue at111th StreetIDOT reportedpavement floodingLocalProblem not locatedon a regional waterway.This is a localstorm sewer systemproblem.WO2 Worth Bank Erosion Stony CreekbetweenOak Lawnand 76thAvenueStream bank is inneed <strong>of</strong> stabilizationand debris removalto restore the naturalconveyance <strong>of</strong>Stony CreekRegionalRemoval <strong>of</strong> debris tobe addressed bystream maintenance.Field assessment didnot find erosion problem.WO4 Worth Ponding,pavementflooding75th Avenueat109th StreetPavement floodingand property floodingLocalProblem not locatedon a regional waterway.This is a localstorm sewer systemproblem.AL1 Alsip Bank Erosion,Sedimentation115th Streetand StonyCreek culvert,justwest <strong>of</strong>Cicero AvenueSevere erosion atnortheast embankment,wing wall partiallyrestrictingopening <strong>of</strong> east barrel<strong>of</strong> culvertRegionalThis is a maintenanceissue. No structuraldamages associatedwith bank erosion.AL2 Alsip PavementFloodingRoute 50(CiceroAve) at119th StreetIDOT reportedpavement floodingLocalProblem not locatedon a regional waterway.This is a localstorm sewer systemproblem.AL3 Alsip Storm SewerFlow Restriction,BankErosion,Sedimentation113th Streetand LamonAvenueSiltation <strong>of</strong> EastStony Creek from115th Street North to11200 Street interfereswith drainage<strong>of</strong> a dry detentionpond contributing toa mosquito breedingproblemRegionalField assessmentidentified no structuraldamages associatedwith bank erosion.Alternatives STCR-4and STCR-7 will reducestage in ditch,reducing extent <strong>of</strong>problem.OL4Oak Lawn,ChicagoPavementFloodingPulaskiRoad and104th StreetIDOT reportedpavement floodingLocalProblem not locatedon a regional waterway.This is a localstorm sewer systemproblem.3.28.1.5 Stormwater Problem DataCommunities, agencies (e.g., IDOT, CCHD), and stakeholders submitted Form B questionnaireresponse data to the <strong>District</strong> summarizing known stormwater problems within theirjurisdictions. Table 3.28.3 summarizes reported problem areas reviewed as a part <strong>of</strong> the<strong>DWP</strong> development. Problems are classified in Table 3.28.3 as regional or local. This classificationis based on a process described in Section 1 <strong>of</strong> this report.3-184
3. TRIBUTARY CHARACTERISTICS AND ANALYSIS3.28.1.6 Near-Term Planned Projects<strong>Water</strong>shed communities, agencies, and stakeholders were asked about near-term plannedprojects so that the implementation <strong>of</strong> near-term flood control projects by others is consideredin development <strong>of</strong> the <strong>DWP</strong>. No near-term planned projects by others have been identifiedfor the Stony Creek subwatershed.3.28.2 <strong>Water</strong>shed Analysis3.28.2.1 Hydrologic Model DevelopmentSubbasin Delineation. The Stony Creek tributary area was delineated based primarily upon2003 Cook County LiDAR generated topographic data. Delineated basins were spot checkedagainst available storm sewer mapping to confirm drainage patterns. Table 3.28.4 summarizesthe total drainage area, number <strong>of</strong> subbasins, and average subbasin size for East and WestStony Creek and subwatersheds that drain to them.TABLE 3.28.4Stony Creek System Subbasin SummaryDrainage AreaSubbasin(mi 2 )Number <strong>of</strong> ModeledSubbasinsAverage Modeled SubbasinSize (acres)East Stony Creek a 6.9 34 130West Stony Creek a 11.2 55 130Total 18.1 89Major Tributaries to Stony Creek (in addition to directly tributary areas)Merrionette Park Ditch 4.2 25 108Melvina Ditch 8.4 37 146Oak Lawn Creek 3.7 21 112Lucas Ditch 2.7 14 124Lucas Diversion Ditch 3.4 25 87Total 22.4 122a Areas directly tributary to East and West Stony Creek. They do not include areas drained by other tributaryareas summarized in report.Significant parts <strong>of</strong> the Merrionette Park Ditch, Melvina Ditch, and East Stony Creek subwatershedsare drained by combined sewer systems. These areas were included in the hydrologicmodel with diversions created to simulate the approximate interceptor capacity <strong>of</strong>sewers. Where available, interceptor capacities were assumed based on information obtainedfrom hydraulic models <strong>of</strong> the City <strong>of</strong> Chicago’s combined sewer system developed in 2008 asa part <strong>of</strong> the city’s citywide H&H Modeling Program. These areas appear to have been excludedfrom hydrologic models developed to support the production <strong>of</strong> FEMA regulatoryfloodplain mapping.3-185
CALUMET-SAG DETAILED WATERSHED PLANThere are two significant reservoirs in the Melvina Ditch subwatershed: Melvina Ditch reservoirand Bedford Park reservoir. Both reservoirs were included in the hydrologic model. Storageprovided by Lake Oak Lawn and two ponds within the St. Casimir Cemetery propertywere included in the hydraulic modeling.Hydrologic Parameter <strong>Cal</strong>culations. CNs were estimated for each subbasin based upon NRCSsoil data and 2001 CMAP land use data. This method is further described in Section 1.3.2,with lookup values for specific combinations <strong>of</strong> land use and soil data presented in AppendixC. An area-weighted average <strong>of</strong> the CN was generated for each subbasin.The lag time, used to convert excess precipitation into a run<strong>of</strong>f hydrograph, was assumed tobe 0.6 times the time <strong>of</strong> concentration for all subbasins. The time <strong>of</strong> concentration, or time <strong>of</strong>travel from the hydrologically most distant part <strong>of</strong> the subbasin, was estimated by usingstandard procedures assuming a length <strong>of</strong> sheet flow, shallow concentrated flow, and channelflow. In some instances, modification to parameter estimates was necessary to more accuratelycharacterize very flat or heavily sewered subwatersheds. Appendix G provides asummary <strong>of</strong> the hydrologic parameters used for subbasins in each subwatershed.3.28.2.2 Hydraulic Model DevelopmentField Data, Investigation, and Existing Model Data. The existing USACE hydraulic model <strong>of</strong>Stony Creek met <strong>District</strong> criteria, as identified in Section 6.3.3.2 <strong>of</strong> the CCSMP, and wastherefore used to support <strong>DWP</strong> development. Three cross sections were surveyed on StonyCreek and compared with cross-sectional data included in the USACE’s model. The surveyedcross sections were located near Lucas Ditch and Lucas Diversion Ditch confluencesin Palos Hills. It was determined that there was a good correlation between recently surveyedcross-sectional data and cross-sectional data included in the USACE model. Field visitswere performed to assess channel and overbank roughness characteristics at severallocations along Stony Creek. These were then compared with information on photographsand aerial photography to review and accept modeled Manning’s n roughness coefficientsincluded in the USACE model.Boundary Conditions. The Stony Creek hydraulic model has two downstream boundary conditionsdefined at the downstream ends <strong>of</strong> East and West Stony Creek, where they dischargeinto the <strong>Cal</strong>umet-<strong>Sag</strong> Channel. Fixed water surface elevations for each <strong>of</strong> the various designstorms modeled were established as downstream boundary conditions. The water surfaceelevations were based on model output from the <strong>District</strong>’s CWS model. Appendix E containsa summary <strong>of</strong> the boundary conditions analysis performed to support <strong>DWP</strong> model development.<strong>Cal</strong>ibration and Verification. Stony Creek model results are compared in Table 3.28.5 belowwith stream crest gage results provided by the IDNR Office <strong>of</strong> <strong>Water</strong> Resources (OWR) fromthe storm that occurred on September 13th-14th, 2008. Curve numbers were reduced by 10percent for existing and alternative conditions based upon the calibration <strong>of</strong> streams withmonitoring data as described in Section 1.3.8. The model results are listed for both initial(pre-calibration) model results and calibrated model results (with the 10 percent reduction<strong>of</strong> curve number values applied). The difference between the observed and calibrated modelwater surface elevations are generally considered to be within an acceptable margin <strong>of</strong> error.3-186
3. TRIBUTARY CHARACTERISTICS AND ANALYSISHigh water elevations are taken at a point in time when it is not certain that the peak waterelevation occurred.TABLE 3.28.5Comparison <strong>of</strong> Observed and Predicted Stage for Stony Creek, 9/13/2008 Storm EventLocation DescriptionHWMorGagePeakWSE(ft)HEC-RASRiverStationUnmodifiedSimulatedPeakWSE (ft)Differencebetweenobservedand unmodifiedWSE (ft)Simulatedpeak WSE(ft) withCNsmodifiedto 0.9 *CNsDifferencebetweenobservedand modifiedWSE(ft)Source <strong>of</strong>HWMWest Stony Creek 80'downstream <strong>of</strong> railroadbridge near confluencewith Oak Lawn CreekWest Stony Creek atVirginia RoadWest Stony Creek atRoberts RoadEast Stony Creek at115th StreetEast Stony Creek atKostner AvenueOak Lawn Creek, atLake Oak Lawn3.842 591.55 592.69 1.14 592.16 0.61 IDNRGage 53.166 590.60 591.34 0.74 590.82 0.22 IDNRGage 31.412 587.75 588.38 0.63 587.93 0.18 IDNRGage 13.617 588.78 588.51 -0.27 588.19 -0.59 IDNRGage 82.688 587.47 588.14 0.67 587.75 0.28 IDNRGage 95771 598.88 599.72 0.84 599.34 0.46 Village <strong>of</strong>Oak LawnobservationNote: Stony Creek river stations are in miles, and Oak Lawn Creek river stations are in feetAs a further verification step, <strong>DWP</strong> Stony Creek hydraulic model results were also comparedwith USACE Stony Creek hydraulic model results. Table 3.28.6 summarizes the water surfaceelevations identified by both the <strong>DWP</strong> and USACE Stony Creek hydraulic models. The elevationsidentified in <strong>DWP</strong> modeling are generally consistent with the USACE model results forthe 100-year design storm, with higher elevations in some areas and lower elevations in otherareas.3.28.2.3 Existing Conditions EvaluationFlood Inundation Areas. Figure 3.28.1 shows inundation areas produced by the <strong>DWP</strong>’s hydraulicmodel for the 100-year, 12-hour duration design storm. The FEMA DFIRM modelinghad a total drainage area to Stony Creek <strong>of</strong> 31.3 square miles as compared to the <strong>DWP</strong> drainagearea which was 40.5 square miles. The difference in drainage area likely contributesgreatly to the difference between <strong>DWP</strong> inundation areas and the FEMA DFIRM floodplain areas.3-187
CALUMET-SAG DETAILED WATERSHED PLANTABLE 3.28.6Comparison <strong>of</strong> <strong>DWP</strong> and USACE Model Results for 100-Year Design StormLocationModelRiver Station<strong>DWP</strong> HEC-RASModel Results WSEL(ft)Army Corps UNETModel ResultsWSEL (ft)80th Avenue (Roberts Road) 1.376 590.5 590.5Harlem Avenue 2.507 592.1 592.9*Virginia Avenue 3.166 593.4 594.2About 420 feet downstream <strong>of</strong> Ridgeland AvenueAbout 940 feet upstream <strong>of</strong> RidgelandAvenueApprox.3.561Approx.3.832593.6 594.4595.1 595.2*Central Avenue 4.769 595.4 595.6Wolfe Wildlife Refuge 5.331 595.4 595.7115th Street 3.67 592.2 591.9Kostner Avenue 2.688 592.1 591.1*Interpolated from nearby cross-sectional values.Hydraulic Pr<strong>of</strong>iles. Appendix H contains hydraulic pr<strong>of</strong>iles <strong>of</strong> existing conditions in theStony Creek system. Pr<strong>of</strong>iles are shown for the 2-, 5-, 10-, 25-, 50-, 100-, and 500-year recurrenceinterval design storms.3.28.3 Development and Evaluation <strong>of</strong> Alternatives3.28.3.1 Problem DefinitionHydraulic model results were reviewed with inundation mapping to identify locationswhere property damage due to flooding is predicted. Table 3.28.7 summarizes major problemareas identified through hydraulic modeling <strong>of</strong> Stony Creek.TABLE 3.28.7Modeled Problem Definition for Stony CreekProblemIDLocationRecurrenceInterval (yr) <strong>of</strong>FloodingAssociatedForm BResolution in <strong>DWP</strong>MPA34MPA35MPA36Area bounded by Kedzie AvenueBurr Oak Avenue, <strong>Cal</strong>ifornia Avenueand Vermont StreetArea along East Stony Creek betweenKedzie Avenue and MerrionettePark DitchArea along East Stony Creek betweenKostner Avenue and CrawfordAvenue, north <strong>of</strong> 123rd Street25, 50, 100,50025, 50, 100,500Project STCR-7 will reduceflooding in this area.Project STCR-7 will reduceflooding in this area.100, 500 Project STCR-7 will reduceflooding in this area.3-188
3. TRIBUTARY CHARACTERISTICS AND ANALYSISTABLE 3.28.7Modeled Problem Definition for Stony CreekProblemIDMPA37MPA38MPA39MPA40MPA41LocationArea near 111th and Cicero Avenueat East and West Stony confluenceArea bounded by 107th Street, LaramieAvenue, 101st Street, and MarshallAvenueArea south <strong>of</strong> 99th Street betweenOak Lawn Creek and Melvina DitchArea between Melvina Ditch and Tri-State TollwayArea between Tri-State Tollway andLucas Diversion DitchRecurrenceInterval (yr) <strong>of</strong>Flooding25, 50, 100,50025, 50, 100,50025, 50, 100,500AssociatedForm BAL1OL1, OL2,OL9CR1, CR3,OL6Resolution in <strong>DWP</strong>Project STCR-2 will reduceflooding in this area. Sufficientland was not availableto address all floodingin this area. Such propertiesare candidates for protectionusing nonstructuralflood control measures,such as flood-pro<strong>of</strong>ing oracquisition.Projects STCR-2, STCR-3,and STCR-4 will reduceflooding in this area. Sufficientland was not availableto address all floodingin this area. Such propertiesare candidates for protectionusing nonstructuralflood control measures,such as flood-pro<strong>of</strong>ing oracquisition.Projects STCR-3 andSTCR-8 will reduce floodingin this area. Sufficientland was not available toaddress all flooding in thisarea. Such properties arecandidates for protectionusing nonstructural floodcontrol measures, such asflood-pro<strong>of</strong>ing or acquisition.50, 100, 500 Projects STCR-3 andSTCR-8 will reduce floodingin this area. Sufficientland was not available toaddress all flooding in thisarea. Such properties arecandidates for protectionusing nonstructural floodcontrol measures, such asflood-pro<strong>of</strong>ing or acquisition.5, 10, 25, 50,100, 500WO2Project STCR-8 will reduceflooding in this area. Sufficientland was not availableto address all floodingin this area. Such propertiesare candidates for protectionusing nonstructuralflood control measures,such as flood-pro<strong>of</strong>ing oracquisition.3-189
CALUMET-SAG DETAILED WATERSHED PLANTABLE 3.28.7Modeled Problem Definition for Stony CreekProblemIDLocationRecurrenceInterval (yr) <strong>of</strong>FloodingAssociatedForm BResolution in <strong>DWP</strong>MPA14Area between Lucas Ditch confluenceand West Stony Creek confluencewith <strong>Cal</strong>umet-<strong>Sag</strong> Channel3.28.3.2 Damage Assessment5, 10, 25, 50,100, 500PHI3Project LUDT-5 will protectproperties from flooding.Sufficient land was notavailable to address allflooding in this area. Suchproperties are candidatesfor protection using nonstructuralflood controlmeasures, such as floodpro<strong>of</strong>ingor acquisition.Economic damages were defined followingthe protocol defined in Chapter 6.6 <strong>of</strong> theCCSMP. No erosion or recreation damagesdue to flooding were identified for StonyCreek. Transportation damages were estimatedas 15 percent <strong>of</strong> property damages.Table 3.28.8 lists the damage assessment forexisting conditions.3.28.3.3 Technology ScreeningTABLE 3.28.8Estimated Damages for Stony CreekDamageCategoryEstimatedDamage ($)Property 24,046,400Erosion 0Flood control technologies were screened toidentify those most appropriate for addressing the flooding problems in the Stony Creeksubwatershed. Increased conveyance or storage was identified as the principal technologiesapplicable for addressing stormwater problems in Stony Creek.3.28.3.4 Alternative DevelopmentFlood Control Alternatives. Alternative solutions to regional flooding and streambank erosionproblems were developed and evaluated consistent with the methodology described inSection 1.4 <strong>of</strong> this report. Table 3.28.9 summarizes flood and erosion control alternatives developedfor Stony Creek. Based on the feedback from watershed communities, a review <strong>of</strong>previous studies, and a consideration <strong>of</strong> large open tracts <strong>of</strong> land, stormwater detention alternativesdeveloped for Stony Creek were focused on areas surrounding the intersection <strong>of</strong>111th Street and Cicero Avenue. The area contains parts <strong>of</strong> St. Casimir Cemetery, a retail developmentthat includes a K-Mart store, and the Wolfe Wildlife Refuge.NoteTransportation 3,607,000 Assumed as 15% <strong>of</strong>property damagedue to flooding3-190
3. TRIBUTARY CHARACTERISTICS AND ANALYSISTABLE 3.28.9Flood Control and Erosion Control Alternatives for Stony CreekAlternativeNumberProblemAddressed Location DescriptionSTCR-1 Flooding St. CasimirCemeterySTCR-2 Flooding St. CasimirCemeterySTCR-3 Flooding Wolfe WildlifeRefugeSTCR-4 Flooding K-Mart ParkingLot near 111thStreet andCicero AvenueSTCR-5 Flooding Melvina Ditchand West StonyCreek confluenceSTCR-6 Flooding Melvina Ditchand West StonyCreek confluenceSTCR-7 Flooding <strong>Cal</strong>ifornia AvenueCulvertSTCR-8 Flooding Harlem Avenueand Stony CreekSTCR-9 Flooding ComED ROWand Stony CreekSTCR-10 Erosion Confluence <strong>of</strong>Oak LawnCreek andStony CreekSTCR-11 Flooding Confluence <strong>of</strong>Lucas Ditch andStony CreekConstruct 850 acre-feet <strong>of</strong> stormwater detention and conveyancefacilities required to collect West and East Stony Creek flows.Construct detention area 12 feet deep to allow gravity dewatering.This alternative requires significant conveyance facilities to collectflows into the stormwater detention basin. The Kilpatrick andCicero Avenue existing sewers would be rerouted to the stormwaterdetention basin as a part <strong>of</strong> this alternative. This alternativewas considered to be beyond the limits <strong>of</strong> feasible constructability,thus benefits and costs were not developed.Construct 400 acre-feet <strong>of</strong> stormwater detention and conveyancefacilities required to collect West and East Stony Creek flows.Construct detention area 12 feet deep to allow gravity dewatering.This alternative requires significant conveyance facilities to collectflows into the stormwater detention basin. The Kilpatrick andCicero Avenue existing sewers would be rerouted to the stormwaterdetention basin as a part <strong>of</strong> this alternative.Expand Wolfe Wildlife Refuge Lake by 87 acre-feet. This includesexcavation in two locations along West Stony Creek betweenCentral Avenue and Cicero Avenue in Oak Lawn. Construct leveesalong Stony Creek (at elevation 597 feet, from Lawler Avenuewest to Long Avenue, and at elevation 595 feet from Long Avenueto Central Avenue, and possibly low level levee along the southside <strong>of</strong> Stony Creek).Incorporate stormwater detention facility into redevelopment <strong>of</strong> K-Mart parking lot area near intersection <strong>of</strong> 111th Street and CiceroAvenue. Construct 39 acre-feet <strong>of</strong> stormwater detention at this site.Construct closed conduit diversion that conveys part <strong>of</strong> the flowsfrom Melvina Ditch to Stony Creek and relieves flooding alongStony Creek through a more hydraulically efficient alignment. Thisalternative is consistent with one developed and evaluated by theUSACE. This alternative did not effectively reduce water surfaceelevations in the flooding problem area, thus benefits and costswere not developed.Construct open channel diversion that conveys part <strong>of</strong> the flowsfrom Melvina Ditch to Stony Creek and relieves flooding alongStony Creek through a more hydraulically efficient alignment. Thiswas modeled with proposed detention basins adjacent to the realignedstream to mitigate for increased peak flows to StonyCreek from increased conveyance capacity.Enlarge an existing conduit that crosses underneath <strong>Cal</strong>iforniaAvenue to convey part <strong>of</strong> the flows from Stony Creek to the <strong>Cal</strong>umet-<strong>Sag</strong>Channel.Construct closed conduit diversion that conveys part <strong>of</strong> the flowsfrom Stony Creek to the <strong>Cal</strong>umet-<strong>Sag</strong> Channel.Construct closed conduit diversion that conveys part <strong>of</strong> the flowsfrom Stony Creek to the <strong>Cal</strong>umet-<strong>Sag</strong> Channel.Stabilize banks <strong>of</strong> Oak Lawn Creek at its confluence with StonyCreek to prevent structural failure <strong>of</strong> channel banks and floodingdamages and excavate sediment where bank has fallen intoStony Creek creating a blockage <strong>of</strong> flow.Construct levee along north side <strong>of</strong> Stony Creek downstream <strong>of</strong>Lucas Ditch to protect against area flooding.3-191
CALUMET-SAG DETAILED WATERSHED PLANAlternatives STCR-1 through STCR-4, summarized in Table 3.28.9, were evaluated individuallyand together to determine their effectiveness in reducing flooding along Stony Creek andthe downstream end <strong>of</strong> other major tributaries. They were considered as critical parts <strong>of</strong> conveyanceimprovement alternatives developed for the East Stony Creek, West Stony Creek, LucasDitch, and Lucas Diversion Ditch subwatersheds.The alternatives described in Table 3.28.9 require significant conveyance infrastructure todeliver flows to the alternative stormwater detention facilities and make several assumptionson feasibility <strong>of</strong> construction. Alternatives 1 through 4 require significant conveyanceinfrastructure to deliver flows to proposed stormwater detention facilities. AlternativesSTCR-5 through STCR-9 are conveyance improvement alternatives that divert flows to the<strong>Cal</strong>umet-<strong>Sag</strong> Channel. Regulatory approval from regulatory agencies such as IDNR and theUSACE would be required. Other alternatives recommended in the <strong>DWP</strong> include storageand will result in lower peak discharge rates at points where tributaries discharge to the<strong>Cal</strong>umet-<strong>Sag</strong> Channel. All flows from individual tributaries are relatively small in comparisonto the total flow within the <strong>Cal</strong>umet-<strong>Sag</strong> Channel.Erosion Control Alternative. The alternative proposed to address the erosion problems near theconfluence <strong>of</strong> Oak Lawn Creek and Stony Creek will provide hard armoring <strong>of</strong> the bank whereerosion is occurring. Roughly 1,000 feet <strong>of</strong> armoring is required to address the problem area.The armoring is conceptually developed to include costs consistent with traditional approachesto armoring, such as concrete walls. As an alternative to using concrete, there are other hardarmoringerosion protection techniques available to stabilize Stony Creek that will give a morenatural appearance than concrete. Given the limited space available, the existing alignment <strong>of</strong>Stony Creek will likely have to remain. However, through the use <strong>of</strong> rock and geotextile fabric,a hard-armoring protection technique can be designed to protect the slope in a more aestheticallypleasing way. This type <strong>of</strong> bank treatment will be keyed-in for toe-<strong>of</strong>-slope protection andthere will be transitions to the natural slope at the downstream end <strong>of</strong> the problem area nearthe confluence with Oak Lawn Creek. The treatment will be scaled to the gradient <strong>of</strong> the slopeand the shear stresses to which the slope is exposed. This alternative also includes costs for theremoval <strong>of</strong> sediment buildup at the problem area caused by eroding stream banks.3.28.3.5 Alternative Evaluation and SelectionAlternatives listed in Table 3.28.9 were evaluated to determine their effectiveness and toproduce data for the countywide prioritization <strong>of</strong> watershed projects. Flood control alternativeswere modeled to evaluate their impact on water surface elevations and flood damages.Erosion control alternatives were evaluated through field investigations to recommend appropriatestreambank stabilization alternatives. Table 3.28.12 provides a summary B/C ratio,net benefits, total project costs, number <strong>of</strong> structures protected, and other relevantalternative data.Hydraulic modeling results identified four roadway crossings (state route, US highway, orfour-lane road or greater) where Stony Creek overtops for storm events <strong>of</strong> 100-year recurrenceinterval and below by a depth <strong>of</strong> greater than 0.5 feet. Table 3.28.10 lists the four locationsand provides a summary <strong>of</strong> the depth <strong>of</strong> road flooding for existing conditions andwith recommended alternatives. Following implementation <strong>of</strong> alternatives STCR-4, STCR-7,and STCR-8, model results show that two roadway crossings will have a 100-year depth <strong>of</strong>flooding <strong>of</strong> less than 0.5 feet <strong>of</strong> depth. The remaining two roadway crossings will have re-3-192
3. TRIBUTARY CHARACTERISTICS AND ANALYSISduced depths <strong>of</strong> flooding, but limited available space and topography in the area preventedalternatives from further reducing the depth <strong>of</strong> flooding.TABLE 3.28.10Stony Creek Road Overtopping SummaryRoad CrossingRoad Elevation25-yr Depth<strong>of</strong> Flooding50-yr Depth<strong>of</strong> Flooding100-yr Depth<strong>of</strong> FloodingCrawford Avenue 590.2 0.1 1.7Crawford Avenue (with alternatives) 590.2111th Street 594.0 0.5 1.4111th Street (with alternatives) 594.0 0.4Central Avenue 592.1 1.2 2.3 3.2Central Avenue (with alternatives) 592.1 0.9 2.3Ridgeland Avenue 592.2 0.5 1.6 2.6Ridgeland Avenue (with alternatives) 592.2 0.4 1.8Note: Blank entry indicates that road crossing does not overtop for that particular storm event.Note: Although Ridgeland Avenue and Central Avenue experience overtopping with alternatives, alternativeroutes are available.Modeling analysis concluded that STCR-1, STCR-2, STCR-3, STCR-4, STCR-7, STCR-8, andSTCR-9 were effective at reducing flood damages. STCR-1 was not considered further becausethe 850 acre-foot size is at the limits <strong>of</strong> feasibility. A more detailed analysis to determinethe optimal size <strong>of</strong> a detention basin at the St. Casimir Cemetery site should be carriedout during the design process should STCR-2 be selected for implementation. If STCR-2,STCR-3, and STCR-4 are selected for implementation and will be constructed at the sametime, it is recommended that they are planned, engineered, and constructed as one combinedproject. This will save on mobilization costs and ensure that each project is properlycoordinated given their adjacent locations and that the projects may involve construction <strong>of</strong>new pipes leading to and from the proposed ponds. The combined alternative is listed inTable 3.28.12 as STCR-2b.Recommended alternatives result in reduced stage and/or flow along the modeled waterway.Table 3.28.11 provides a comparison <strong>of</strong> the modeled maximum WSEL, and modeledflow at the time <strong>of</strong> peak at representative locations along the waterway.A number <strong>of</strong> properties are at risk <strong>of</strong> shallow flooding during the 100-year flood event underexisting conditions or recommended alternative conditions. In addition, due to their locations,other properties' risk <strong>of</strong> flooding cannot be feasibly mitigated by structuralmeasures. Such properties are candidates for protection using nonstructural flood controlmeasures, such as flood-pro<strong>of</strong>ing or acquisition. These measures may be considered to addressdamages that are not fully addressed by capital projects recommended in the <strong>Cal</strong>umet-<strong>Sag</strong>Channel <strong>DWP</strong>.3.28.3.6 Data Required for Countywide Prioritization <strong>of</strong> <strong>Water</strong>shed ProjectsAppendix I presents conceptual level cost estimates for the recommended alternatives. Table3.28.12 lists alternatives analyzed in detail as part <strong>of</strong> <strong>DWP</strong> development.3-193
CALUMET-SAG DETAILED WATERSHED PLANThe recommended alternatives for Stony Creek are alternatives STCR-2, STCR-3, STCR-4,STCR-7, STCR-8, and STCR-10. STCR-8 is recommended over STCR-9 because <strong>of</strong> better constructionfeasibility. As the B/C ratios <strong>of</strong> both STCR-8 and STCR-9 are similar, it is recommendedthat the route <strong>of</strong> a diversion for this area <strong>of</strong> West Stony Creek be determinedduring a more detailed design study. This set <strong>of</strong> alternatives includes more than 500 acrefeet<strong>of</strong> stormwater detention, two major conveyance projects, and one streambank stabilizationproject. STCR-6 is not recommended because the benefits associated with straighteningMelvina Ditch were found to be minimal.Figures 3.28.2 through 3.28.7 show the locations and a summary <strong>of</strong> the recommended alternativesdescribed in Table 3.28.12. Figures 3.28.2 through 3.28.7 also show comparisons <strong>of</strong>the existing condition and alternative condition inundation areas. Additional alternativeswere analyzed within the major tributaries to East Stony Creek and West Stony Creek, suchas Oak Lawn Creek and Lucas Ditch. Those alternatives are discussed in each individualtributary section. Alternatives that did not produce a significant change in inundation areasare not listed as benefits were negligible, and thus costs were not calculated for these alternatives.3-194
3. TRIBUTARY CHARACTERISTICS AND ANALYSISTABLE 3.28.11Stony Creek Existing and Alternative Condition Flow and WSEL ComparisonExistingConditions STCR-2 STCR-3 STCR-4 STCR-7 STCR-8LocationStationMaxWSEL(ft)MaxFlow(cfs)MaxWSEL(ft)MaxFlow(cfs)MaxWSEL(ft)MaxFlow(cfs)MaxWSEL(ft)MaxFlow(cfs)MaxWSEL(ft)MaxFlow(cfs)MaxWSEL(ft)MaxFlow(cfs)Upstream end <strong>of</strong> StonyCreek West400-ft upstream <strong>of</strong> CentralAve.Major Ave. and EdgeLake Dr.Downstream <strong>of</strong> OaklawnCreek confluenceDownstream <strong>of</strong> MelvinaDitch confluence300-ft downstream <strong>of</strong>Southwest HwyDownstream <strong>of</strong> Lucas DiversionDitch confluence300-ft downstream <strong>of</strong>Roberts Rd.Downstream <strong>of</strong> LucasDitch confluence150-ft upstream <strong>of</strong> 115thSt.1000-ft downstream <strong>of</strong>Kostner Ave.Downstream <strong>of</strong> MerrionettePark Ditch confluenceSoutheast <strong>of</strong> Kedzie Ave.and 127th St.Downstream end <strong>of</strong> StonyCreek East5.68 595.39 329.65 594.67 91.59 595.37 29.04 595.35 45.90 595.38 319.74 595.37 329.574.88 595.36 709.14 594.66 478.25 595.33 718.60 595.32 698.91 595.35 704.13 595.33 737.794.65 595.34 746.45 594.63 525.80 595.31 755.21 595.30 742.58 595.33 743.31 595.31 775.203.84 595.08 1273.05 594.44 1122.64 595.05 1264.62 595.04 1263.48 595.07 1271.24 595.03 1312.723.58 593.55 1795.76 593.12 1640.54 593.53 1790.47 593.52 1787.03 593.55 1793.12 593.42 1692.532.96 593.16 1702.53 592.77 1574.89 593.12 1689.39 593.13 1685.79 593.16 1700.07 593.04 1738.851.64 591.00 2458.27 590.75 2315.10 590.96 2431.15 590.97 2440.00 591.00 2456.31 590.50 2185.841.34 590.41 2481.43 590.17 2339.45 590.37 2456.67 590.38 2465.00 590.41 2480.10 589.95 2211.510.41 587.40 2960.64 587.24 2829.51 587.37 2936.08 587.38 2944.97 587.40 2959.60 587.09 2706.453.72 592.21 95.98 592.05 64.93 592.18 95.86 592.19 98.33 591.35 160.54 592.21 97.722.54 592.12 310.27 591.97 383.67 592.09 307.96 592.10 307.28 591.15 411.00 592.12 309.921.54 591.75 840.82 591.54 846.04 591.72 837.11 591.73 837.93 590.22 1053.87 591.75 840.650.95 591.18 919.14 590.96 912.79 591.16 914.00 591.17 915.86 589.00 1183.08 591.18 918.800.30 590.92 1051.46 590.70 1029.15 590.90 1043.67 590.91 1047.02 588.17 1478.52 590.92 1051.303-195
CALUMET-SAG DETAILED WATERSHED PLANTABLE 3.28.12Stony Creek Project Alternative Matrix to Support <strong>District</strong> CIP PrioritizationProjectSTCR-2STCR-2bSTCR-3Description400 ac-ft reservoir at St.Casimir CemeterySTCR-2, STCR-3, and STCR-4combined87 ac-ft detention pond atWolfe Wildlife RefugeSTCR-4 39 ac-ft detention pond at K-Mart siteSTCR-6STCR-7STCR-8STCR-9STCR-10STCR-11Realign Melvina Ditch confluencewith Stony CreekEnlarge <strong>Cal</strong>ifornia Avenue culvertConstruct closed-conduit diversionalong ComEd ROWConstruct Harlem Ave channeldiversionStabilization <strong>of</strong> erosion problemarea near Stony Creek andOak Lawn Creek confluenceLevee downstream <strong>of</strong> LucasDitch – West Stony Creek confluenceB/CRatio Net Benefits ($)Total ProjectCost ($)CumulativeStructuresProtectedFundingPossibilities<strong>Water</strong>QualityBenefitRecommendedCommunitiesInvolved0.25 12,203,700 48,496,800 666 USACE Positive Yes Alsip, OakLawn, Chicago0.22 13,364,900 60,515,100 804 USACE, Village<strong>of</strong> OakLawnPositive No Alsip, OakLawn, Chicago0.1 735,100 7,691,000 55 USACE Positive Yes Alsip, OakLawn, Chicago0.05 206,600 4,327,300 20 USACE, Village<strong>of</strong> OakLawnSlightlyPositive0.01 86,100 10,983,600 21 USACE NoImpact0.11 364,200 3,428,900 86 USACE NoImpact0.18 1,146,600 6,286,400 44 USACE NoImpact0.2 2,654,800 13,597,300 160 USACE NoImpactYesNoYesYesNoAlsip, OakLawn, ChicagoChicagoRidge, OakLawnPalos HillsPalos HillsPalos Hills* * 2,754,800 0 Positive Yes Oak Lawn0.02 63,800 3,219,600 3 USACE NoImpactNotes: Net Benefits values do not include local benefits or non-economic benefits.Alternative STCR-10 is recommended because it is an erosion problem that if left to continue threatens to significantly constrict Stony Creek flow.NoPalos Hills3-196
3. TRIBUTARY CHARACTERISTICS AND ANALYSIS3.29 Tinley Creek TABLE 3.29.1Tinley Creek is located in southwestern CookCounty, south <strong>of</strong> the <strong>Cal</strong>umet-<strong>Sag</strong> Channel, in thesoutheastern part <strong>of</strong> the <strong>Cal</strong>umet-<strong>Sag</strong> Channel <strong>Water</strong>shed.The drainage area <strong>of</strong> the Tinley Creek is12.91 square miles, with 2.3 square miles in BocaRio Ditch and 0.25 square mile in Arroyo Ditch.Table 3.29.1 summarizes the land area <strong>of</strong> communitieswithin the Tinley Creek subwatershed. Themiddle <strong>of</strong> Tinley Creek, including the confluencewith Boca Rio Ditch, is within Cook County ForestPreserve. The upstream part, as well as its tributariesBoca Rio Ditch and Arroyo Ditch, is largelyresidential. Table 3.29.2 summarizes the land usedistribution within Tinley Creek.Figures 3.29.1a and 3.29.1b are an overview <strong>of</strong> thetributary area <strong>of</strong> the Tinley Creek subwatershed.Reported stormwater problem areas, flood inundationareas, and proposed alternative projects arealso shown and discussed in the following subsections.3.29.1 Sources <strong>of</strong> Data3.29.1.1 Previous StudiesAn HSPF model <strong>of</strong> the Tinley Creek watershed isunder development by the USGS to predict run<strong>of</strong>fvolumes and use in a water-quality analysis <strong>of</strong> theTinley Creek subwatershed. The model was notavailable during the <strong>DWP</strong> development.3.29.1.2 <strong>Water</strong> Quality DataIEPA does not have any sites in the Ambient <strong>Water</strong>Quality Monitoring Network on Tinley Creek.Communities Draining to Tinley CreekCommunity/TributaryUnincorporated/ForestPreserveTributary Area(mi 2 )5.62Orland Park 4.2Oak Forest 1.18Orland Hills 0.86Tinley Park 0.6Matteson 0.17Crestwood 0.14Palos Heights 0.13Alsip 0.01Note: Includes areas tributary to Boca RioDitch and Arroyo DitchTABLE 3.29.2Land Use Distribution for Tinley CreekAreaLand Use Category (acres) %Forest/Open Land 4,002.9 48.5Residential 3,352.9 40.6Commercial/Industrial 487.8 5.9<strong>Water</strong>/Wetland 135.1 1.6Agricultural 126.3 1.5Institutional 95 1.2Transportation/Utility 58.7 0.7Note: Area includes Boca Rio Ditch and ArroyoDitchThe IEPA’s 2008 Integrated <strong>Water</strong> Quality Report, which includes the CWA 303(d) and 305(b)lists Tinley Creek as impaired for its designated use supporting aquatic life, with the cause<strong>of</strong> impairment listed as unknown. No TMDLs have been established for Tinley Creek. Accordingto a USEPA water permit discharge query, there are no NPDES permits issued byIEPA for discharges to Tinley Creek. Municipalities discharging to Tinley Creek are regulatedby IEPA’s NPDES Phase II Stormwater Permit Program, which was created to improvethe water quality <strong>of</strong> stormwater run<strong>of</strong>f from urban areas, and requires that municipalitiesobtain permits for discharging stormwater and implement the six minimum control measuresfor limiting run<strong>of</strong>f pollution to receiving systems.3-197
CALUMET-SAG DETAILED WATERSHED PLAN3.29.1.3 Wetland and Riparian AreasFigures 2.3.6 and 2.3.7 contain mapping <strong>of</strong> wetland and riparian areas in the <strong>Cal</strong>umet-<strong>Sag</strong>Channel <strong>Water</strong>shed. NWI data includes 517 acres <strong>of</strong> wetland areas in the Tinley CreekTributary area. Riparian areas are defined as vegetated areas between aquatic and uplandecosystems adjacent to a waterway or body <strong>of</strong> water that provides flood management, habitat,and water quality enhancement. Identified riparian environments <strong>of</strong>fer potential opportunitiesfor restoration.3.29.1.4 Floodplain MappingFlood inundation areas supporting the NFIP were revised in 2008 as a part <strong>of</strong> FEMA’s MapModernization Program. Floodplain boundaries were revised based upon updated CookCounty topographic information, but the effective models used to estimate flood levels generallywere not updated. LOMRs were incorporated in the revised floodplains. The originalH&H analysis was performed in 1976. The hydrologic modeling was performed by using L-PTIII and Regression Equation 77. Hydraulic routing was performed using the WSP-2 modelingapplication.Appendix A includes a comparison <strong>of</strong> FEMA’s effective floodplain mapping from updatedDFIRM panels with inundation areas developed for the <strong>DWP</strong>.3.29.1.5 Stormwater Problem DataTable 3.29.3 summarizes reported problem areas reviewed as a part <strong>of</strong> the <strong>DWP</strong> development.The problem area data was obtained primarily from Form B questionnaire response data providedby watershed communities, agencies, and stakeholders to the <strong>District</strong>. Problems are classifiedin Table 3.29.3 as regional or local. This classification is based on a process described inSection 1 <strong>of</strong> this report.3.29.1.6 Near-Term Planned Projects<strong>Water</strong>shed communities, agencies, and stakeholders were asked about near-term plannedprojects so that the implementation <strong>of</strong> near-term flood control projects by others is consideredin development <strong>of</strong> the <strong>DWP</strong>. The Village <strong>of</strong> Orland Park noted that engineering serviceshad been contracted for replacement <strong>of</strong> culverts and sediment removal in the Fernwayarea, which is just downstream <strong>of</strong> 88th Avenue. The Village reiterated at the June 4, 2008,WPC coordination meeting that several culverts will be replaced in kind. In fall 2007, sedimentwas observed at some culverts during a field survey in this extent <strong>of</strong> Tinley Creek.This sediment was not included in the baseline model.3.29.2 <strong>Water</strong>shed Analysis3.29.2.1 Hydrologic Model DevelopmentSubbasin Delineation. The Tinley Creek tributary area was delineated based primarily uponLiDAR topographic data developed by Cook County in 2003. Part <strong>of</strong> the Tinley Creek basinis adjacent to the Little <strong>Cal</strong>umet watershed. Initial boundaries <strong>of</strong> the <strong>Cal</strong>umet-<strong>Sag</strong> boundaryand Little <strong>Cal</strong>umet boundary were compared, and discrepancies identified. Discrepanciesgenerally were minor and resolved by manual review <strong>of</strong> topographic data and consultationwith local communities and other watershed planning consultants.3-198
3. TRIBUTARY CHARACTERISTICS AND ANALYSISTABLE 3.29.3Community Response Data for Tinley CreekProblemIDMunicipalityProblems asReported byLocal Agency Location Problem DescriptionLocal/RegionalResolutionin <strong>DWP</strong>BR1BremenTownshipMaintenanceRidgelandAve. from135th St. to147th St.Debris and siltation<strong>of</strong> box culvert dueto alignment <strong>of</strong>Tinley Creek(CCHD)RegionalSiltation not noted infield survey. May havebeen addressedthrough maintenanceactivities.BR2BremenTownshipMaintenance143rd St.from 82ndAve. to HarlemAve.Overbank floodingdue to lack <strong>of</strong>maintenance inForest PreserveLocalProblem not locatedon a regional waterway.CW2 Crestwood Maintenance Central Ave.from 127thSt. to 135thSt.Embankmentsneed repair anddebris in embankmentand waterwayRegionalProject TICR-3 recommendsthe construction<strong>of</strong> a leveeupstream <strong>of</strong> CentralAvenue.CW3Alsip,Crestwood,WorthTownshipOverbankflooding,basementfloodingBetween129th St. and<strong>Cal</strong>umet-<strong>Sag</strong>Channel,west <strong>of</strong> CentralAve.Overbank floodingduring heavy rain,attributed in part todouble bend inTinley Creek justdownstream <strong>of</strong>Central AvenueRegionalTICR-3 protectsdownstream structuresfrom damagesdue to flooding. Modification<strong>of</strong> channelalignment would increasedownstreamflooding, and causeerosion risk due toincreased velocity.OH1Orland Hills,Orland ParkOverbankflooding,ponding, waterquality,bank erosion,wetland riparianTinley Creekat 88th Ave.Culvert and channeldownstream <strong>of</strong>88th Avenue havesediment andvegetation whichreduces conveyanceRegionalTICR-5 addressessedimentation upstream<strong>of</strong> 188 th StreetOH2 Orland Hills Overbankflooding,ponding, waterquality,bank erosion,wetland riparianLake Lorinand along167th Streetbetween 91stAve. and HavenAve.Lake Lorin vegetation,sedimentation,and outletcondition reducesTinley Creek conveyancein thisareaRegionalMaintenance <strong>of</strong> LakeLorin recommendedto preserve storagecapacity. Sufficientland was not availablein the area for potentialcapital projectsthat could addressproblem. Such propertiesare candidates forprotection using nonstructuralflood controlmeasures, such asflood-pro<strong>of</strong>ing or acquisition.3-199
CALUMET-SAG DETAILED WATERSHED PLANTABLE 3.29.3Community Response Data for Tinley CreekProblemIDMunicipalityProblems asReported byLocal Agency Location Problem DescriptionLocal/RegionalResolutionin <strong>DWP</strong>OP15 Orland Park Sedimentation,Overbankflooding167th St. and88th Ave.(Fernwayarea)Sedimentation andculvert restrictionsresult in frequentoverbank flooding<strong>of</strong> the Fernwayarea. Village hascontracted engineeringfor culvertreplacement andsediment removalRegionalOrland Park hasplanned solution toreplace culverts andremove sediment inthis region. Includedin baseline modelconditions.OP2 Orland Park PavementfloodingRoute 43(HarlemAve.) between151stSt. and 153rdSt.IDOT reportedpavement floodingLocalProblem not locatedon a regional waterway.This is a localproblemOP5 Orland Park Bank erosion,sedimentation151st St. andOrland BrookDr.Significant erosionand sedimentationresults in flow restrictionRegionalTICR-7 will stabilizebanks to address thiserosion problem on aregional waterwaythat threatens structures.OP8 Orland Park OverbankfloodingTinley Creekat 82nd Ave.Overbank floodingdue to undersizedculvert alongTinley Creek andlack <strong>of</strong> maintenancedownstreamRegionalModel results did notconfirm that roadwayflooding in this area isassociated with regionalwaterways.Previous observations<strong>of</strong> flooding in this areamay be the result <strong>of</strong> acondition already addressedor associatedwith local drainageproblems.PH1PalosHeightsOverbankflooding135th St.from HarlemAve. toRidgelandAve.Pavement floodingdue to high stagesin the channel, 28known occurrenceLocalProblem not locatedon a regional waterway.This is a localproblemPH11BremenTownship,PalosHeightsPavementfloodingRoute 43(HarlemAve.) at135th St.IDOT reportedpavement floodingLocalProblem not locatedon a regional waterway.This is a localproblemTable 3.29.4 summarizes the total drainage area, number <strong>of</strong> modeled subbasins, and averagesubbasin size for Tinley Creek and its tributaries.3-200
3. TRIBUTARY CHARACTERISTICS AND ANALYSISTABLE 3.29.4Tinley Creek System Subbasin SummarySubbasinDrainageArea(mi 2 )Number <strong>of</strong>ModeledSubbasinsAverage ModeledSubbasin Size(acres)Tinley Creek 10.37 55 120.35Major Tributaries to Tinley CreekBoca Rio Ditch 2.29 15 99.11Arroyo Ditch 0.25 1 156.87Total 12.91 71 116.37Hydrologic Parameter <strong>Cal</strong>culations.CNs were estimated for each subbasinbased upon NRCS soil dataand 2001 CMAP land use data. Thismethod is further described in Section1.3.2, with lookup values forspecific combinations <strong>of</strong> land useand soil data presented in AppendixC. An area-weighted average <strong>of</strong> theCN was generated for each subbasin.The lag time, used to convert excessprecipitation into a run<strong>of</strong>f hydrograph,was assumed to be 0.6 times the time <strong>of</strong> concentration for all subbasins. The time <strong>of</strong>concentration, or time <strong>of</strong> travel from the hydrologically most distant part <strong>of</strong> the subbasin,was estimated by using standard procedures assuming a length <strong>of</strong> sheet flow, shallow concentratedflow, and channel flow. In some instances, modification to parameter estimateswas necessary to more accurately characterize very flat or heavily sewered subwatersheds.Appendix G provides a summary <strong>of</strong> the hydrologic parameters used for subbasins in eachsubwatershed.3.29.2.2 Hydraulic Model DevelopmentField Data, Investigation, and Existing Model Data. No hydraulic models that met the <strong>District</strong>criteria for use in the <strong>DWP</strong>, as identified in Section 6.3.3.2 <strong>of</strong> the CCSMP, were available for<strong>DWP</strong> development. Surveys <strong>of</strong> the open channel part <strong>of</strong> Tinley Creek and all crossings wereperformed to characterize the channel and near overbank geometry. Cross-sectional geometryin the non-surveyed overbank area was obtained from Cook County topographic dataand combined with the surveyed channel cross section. Field visits were performed to assesschannel and overbank roughness characteristics, which were combined with informationfrom photographs and aerial photography to assign modeled Manning’s n roughness coefficientsalong the modeled stream length.Boundary Conditions. Tinley Creek is tributary to the <strong>Cal</strong>umet-<strong>Sag</strong> Channel. Appendix Esummarizes the modeled elevation <strong>of</strong> the <strong>Cal</strong>umet-<strong>Sag</strong> Channel for the modeled recurrenceinterval storms. The estimated elevation for the 100-year storm at the outlet <strong>of</strong> Tinley Creekwas 585.18 feet NAVD 88, roughly 4 feet above the invert <strong>of</strong> Tinley Creek near its confluencewith the <strong>Cal</strong>umet-<strong>Sag</strong> channel. This relatively shallow depth indicates that downstreamstage on Tinley Creek is controlled not by the receiving system but by its own capacity toconvey flows received from its tributary area. Normal depth assuming a friction slope <strong>of</strong>0.001 was thus used as a downstream boundary condition for Tinley Creek.3.29.2.3 <strong>Cal</strong>ibration and VerificationObserved Data. USGS Stream Gage 5536500 is located on Tinley Creek at its 135th Streetcrossing. Approximately 11.2 square miles <strong>of</strong> the Tinley Creek system is tributary to thisgage location. The gage record spans from September 26, 1951 to the present. The recordwas reviewed to identify recent storms <strong>of</strong> significant intensity for comparison with modelresults. Based upon a review <strong>of</strong> recorded flows, several generally discrete rainfall eventsthat resulted in significant flows were identified for use in model calibration. Only events3-201
CALUMET-SAG DETAILED WATERSHED PLANwithin the last 10 years were considered to minimize differences due to watershed development.Table 3.29.5 summarizes selected flow events.Four ISWS rain gages are TABLE 3.29.5located in the Tinley Creek Flow Eventssubwatershed area. Thiessenpolygons were used to Dateassign rain gages to eachsubwatershed. Figure 2.3.1shows the Tinley Creeksubwatersheds and their assignedISWS rainfall gage.Table 3.29.6 summarizes the12-hour rainfall accumulationand associated recurrenceinterval stormapproximation for each gage and modeled storm.Peak MonitoredFlow (cfs)Note6/10/2006 385 No rainfall in the month preceding theevent9/13/2006 1,210 Four significant rainfall events in preceding15 days.8/23/2007 584 Larger, second event <strong>of</strong> August 2007.9/13/2008 906 Four significant rainfall events in preceding15 days.TABLE 3.29.6Summary <strong>of</strong> 12-Hour Rainfall Accumulation and Associated Recurrence Interval Storm Approximations6/10/2006 9/13/2006 8/23/2007 9/13/2008GageAreaDepth(in)RecurrenceDepth(in)RecurrenceDepth(in)RecurrenceDepth(in)Recurrence16 2.28 2.65 2 yr 1.59 4 month 1.48 4 month 3.21 5-yr17 2.56 2.11 < 1 yr 1.9 < 9 month 1.25 2 month 3.59 5-10 yr20 4.45 2.29 1 yr 2.64 2 yr 1.41 3-month n/a n/a21 3.63 2.52 2yr 1.23 2 month 1.48 4 month 3.08 2-5 yrThe four events listed in Table 3.29.6 were reviewed to determine each event’s suitability foruse in calibration. The review determined that the 9/13/2006 and 8/23/2007 events werenot suitable for use in calibration because <strong>of</strong> extreme rainfall variability, high antecedentmoisture conditions evident in the comparison <strong>of</strong> stream flow with run<strong>of</strong>f volume(80 percent <strong>of</strong> rainfall was measured as streamflow), and multiple peak events are difficultto simulate accurately using SCS hydrology. The 6/10/2006 and the 9/13/2008 events hadless rainfall variability, span a range <strong>of</strong> storm magnitudes, and were single-peaked eventswell- suited to simulation with SCS hydrology. These events were considered for calibrationand are summarized below.<strong>Cal</strong>ibration Results. The September 13, 2008 storm was evaluated using the existing conditionsmodel. The event lasted for approximately two days, and consisted <strong>of</strong> three periods <strong>of</strong>more intense rainfall.3-202
3. TRIBUTARY CHARACTERISTICS AND ANALYSISTABLE 3.29.79/13/2008 Monitored and Modeled Flow and Stage for Tinley CreekModel RunPeak Stage(ft)Run<strong>of</strong>f Volume(ac-ft)Difference inPeak Stage (ft)Difference in Run<strong>of</strong>fVolume (ac-ft)Monitored 615.6 1995.4 N/A N/AOriginal Model 616.5 2780.5 -0.9 39.3%Revised Model 616.1 2277.2 -0.5 14.1%The highest stage was reported, coinciding with the third peak.A comparison <strong>of</strong> modeled and recorded stage and flow indicated that the model was overpredicting these parameters. Modification <strong>of</strong> hydrologic and hydraulic variables that affectstage and flow were considered as described in Section 1.3.8. As described, the model curvenumbers were reduced by 10 percent from the originally calculated values. This resulted inan improved correlation between the modeled and monitored run<strong>of</strong>f volume and stage. Table3.29.7 provides a comparison <strong>of</strong> monitored and modeled stage and run<strong>of</strong>f volume, includingboth the original and revised hydrologic model results. Figure 3.29.2 provides acomparison <strong>of</strong> modeled and monitored stage for the same event.FIGURE 3.29.2Tinley Creek <strong>Cal</strong>ibration for September 13, 2008 StormThe calibrated model results show a better correlation <strong>of</strong> stage, particularly for the two mostintense portions <strong>of</strong> the events. For the first peak, the original model over predicts stage byapproximately 1.5 ft, and this difference is reduced to less than half a foot with the revised3-203
CALUMET-SAG DETAILED WATERSHED PLANmodel. In the periods <strong>of</strong> less rainfall, the modeled stage decreases more rapidly than themonitored stage. This behavior may be due in part to the shape <strong>of</strong> the standard SCS unithydrograph. Hydraulic routing attenuates the unit hydrograph shape, but not to the extentthat the model hydrograph at the gage location matches the receding limb.The June 10, 2006 storm was utilized for model calibration because it was a relatively isolated,single peaked event causing significant flow in Tinley Creek. The recurrence interval<strong>of</strong> the rainfall data recorded ranges from 2 months to 2 years for the gages utilized for theTinley Creek hydrologic model. Based upon the 9/13/2008 calibration event, the model wasevaluated using the model with curve numbers reduced by 10 percent from the originallycalculated values, as described below.TABLE 3.29.86/10/2006 Monitored and Modeled Flow and Stage for Tinley CreekModel RunPeak Stage(ft)Run<strong>of</strong>fVolume (ac-ft)Difference in PeakStage (ft)Difference in Run<strong>of</strong>fVolume (ac-ft)Monitored 613.47 434.5 N/A N/ARevised Model 612.95 384.3 -0.52 -11.6%Figure 3.29.3 shows the monitored and revised model flows and stage for the June 10, 2006storm. Table 3.29.8 summarizes the difference between monitored and modeled flow andstage for the June 10, 2006 storm.FIGURE 3.29.3Tinley Creek <strong>Cal</strong>ibration for June 10, 2006 Storm(cfs)Flow45040035030025020015010050Monitored FlowModeled FlowMonitored StageModeled Stage614613.5613612.5612611.5611610.5610609.5609NAVD88)Stage (ft0608.56/10/2006 0:00 6/10/2006 6:00 6/10/2006 12:00 6/10/2006 18:00 6/11/2006 0:003-204
3. TRIBUTARY CHARACTERISTICS AND ANALYSISModeled stage is under-predicted by roughly 0.5 ft, with flow slightly under-predicted aswell. The period preceding the June 10, 2006 was very dry, and initial abstractions based resultingfrom dry soil may contribute to the slight under-prediction. The small difference betweenmodeled and monitored stage suggests that the Tinley Creek model generallyprovides accurate stage and flow estimates for smaller events like the June 10, 2006 storm.Modifications to Model Input. As shown in Tables 3.29.7 and 3.29.8 and in Figures 3.29.2 and3.29.3, a revised model with curve number values reduced by 10 percent from the originalvalues was found to best represent stage and overall run<strong>of</strong>f volume for the storms considered.Although this resulted in a slight under-prediction <strong>of</strong> flow and stage for the 6/10/2006event, relatively dry antecedent conditions may have resulted in slightly less run<strong>of</strong>f thanwould be generally expected. The revised model was used for design event simulation andalternative evaluation.3.29.2.4 Existing Conditions EvaluationFlood Inundation Areas. Figure 3.29.1 shows inundation areas produced by the hydraulicmodel for the 100-year, 12-hour duration design storm.Hydraulic Pr<strong>of</strong>iles. Appendix H contains hydraulic pr<strong>of</strong>iles <strong>of</strong> existing conditions in theTinley Creek system. Pr<strong>of</strong>iles are shown for the 2-, 5-, 10-, 25-, 50-, 100-, and 500-year recurrenceinterval design storms.3.29.3 Development and Evaluation <strong>of</strong> Alternatives3.29.3.1 Modeled Problem DefinitionHydraulic model results were reviewed with inundation mapping to identify locationswhere property damage due to flooding is predicted. Table 3.29.9 summarizes problem areasidentified through hydraulic modeling <strong>of</strong> Tinley Creek.TABLE 3.29.9Modeled Problem Definition for Tinley CreekProblemIDLocationRecurrenceInterval <strong>of</strong>Flooding (yr)AssociatedForm BResolution in <strong>DWP</strong>MPA42MPA43MPA44Between 127th Streetand 129th Street, west<strong>of</strong> Central Ave.Several hundred feetupstream and downstream<strong>of</strong> Tee BrookDrive crossingAlong Tinley Creek between88th Ave. andLaurel Drive50,100 CW2, CW3 Project TICR-3 addresses theflooding in this area.100 Risk <strong>of</strong> flooding cannot be feasiblymitigated by structural measures.Such properties are candidates forprotection using nonstructuralflood control measures, such asflood-pro<strong>of</strong>ing or acquisition.10, 25, 50, 100 OH1, OP15 Project TICR-5 addresses sedimentationproblem in this area.3-205
CALUMET-SAG DETAILED WATERSHED PLANTABLE 3.29.9Modeled Problem Definition for Tinley CreekProblemIDLocationRecurrenceInterval <strong>of</strong>Flooding (yr)AssociatedForm BResolution in <strong>DWP</strong>MPA45MPA46Upstream <strong>of</strong> 167th anddownstream <strong>of</strong> HobartAve.Along Tinley Creek betweenHobart Avenueand 94th Ave.25, 50, 100 OH2 Maintenance <strong>of</strong> Lake Lorin recommendedto preserve storagecapacity. Sufficient land was notavailable in the area for potentialcapital projects that could addressproblem. Such properties arecandidates for protection usingnonstructural flood control measures,such as flood-pro<strong>of</strong>ing oracquisition.25, 50, 100 Maintenance <strong>of</strong> Lake Lorin recommendedto preserve storagecapacity. Sufficient land was notavailable in the area for potentialcapital projects that could addressproblem. Such properties arecandidates for protection usingnonstructural flood control measures,such as flood-pro<strong>of</strong>ing oracquisition.Problem MPA42 at Tinley Creek’s crossing <strong>of</strong> Central Avenue is located just upstream <strong>of</strong>where Tinley Creek makes two significant bends. The HEC-RAS modeling s<strong>of</strong>tware used forexisting conditions and alternatives analysis is a one-dimensional model, which does notconsider energy or momentum losses due to rapid change in transverse channel geometryor flow direction. The 1D model may not fully account for these losses.3.29.3.2 Damage AssessmentDamages were defined following theprotocol defined in Chapter 6.6 <strong>of</strong>the CCSMP. No recreation damagesdue to flooding were identified forTinley Creek. Transportation damageswere estimated as 15 percent <strong>of</strong>property damages. Erosion damageswere determined for erosion problemsthat threaten structures alongTinley Creek between 160th Streetand 151st Street in Orland Park. Fivehomes and one structure within anapartment complex were determinedto be threatened by erosion becausethese structures were located withinthirty feet <strong>of</strong> an active erosion zone.TABLE 3.29.10Estimated Damages for Tinley CreekDamageCategoryEstimatedDamage ($)Property 2,438,200Erosion -structuresErosion –roadway andutilities: OrlanBrook DriveNote8,457,800 Structures at risk due to erosion249,700 Cost to replace Orlan BrookDrive and utilities between160 th Street and 159 th Streetthreatened by erosion <strong>of</strong>Tinley CreekTransportation 365,700 Assumed as 15% <strong>of</strong> propertydamage due to floodingRecreation 03-206
3. TRIBUTARY CHARACTERISTICS AND ANALYSIS3.29.3.3 Technology ScreeningFlood control technologies were screened to identify those most appropriate to address theflooding problems in the Tinley Creek subwatershed. Increased conveyance or storage wasidentified as the principal technologies applicable for addressing stormwater problems inTinley Creek. Levees were also identified as a potential technology for protecting properties.3.29.3.4 Alternative DevelopmentStormwater improvement alternatives were developed to address regional stormwaterproblems identified in Tables 3.29.11 and 3.29.13, with the aim <strong>of</strong> reducing damages due tostormwater.Flood Control Alternatives. Alternative solutions to regional flooding and streambank erosionwere developed and evaluated consistent with the methodlogy described in Section 1.4<strong>of</strong> this report. Table 3.29.11 summarizes flood and erosion control alternatives for TinleyCreek.TABLE 3.29.11Flood Control and Erosion Control Alternatives for Tinley CreekAlternative Location DescriptionTICR-1TICR-2TICR-3TICR-3BTICR-4TICR-512900 South Central AvenueForest Preserve near intersection<strong>of</strong> JustamereRoad and 143rd Street12900 South Central Avenue12900 South Central Avenue12900 South Central Avenue88th Avenue Upstream <strong>of</strong>Lake LorinConstruct 96-inch channel diversion under Central Avenue to<strong>Cal</strong>umet-<strong>Sag</strong> ChannelCreate weir/impoundment to reduce downstream flows.Construct 4.5-foot levee 1,200 feet long on northwest channel bankand construct 4.5-foot levee 2,000 feet long on southeast channelbank <strong>of</strong> Tinley Creek approaching Central Avenue. Obtain floodeasement on Cook County Forest Preserve property.Construct 4.5-foot levee 1,200 feet long on northwest channel bank<strong>of</strong> Tinley Creek approaching Central Avenue. Obtain easement andconstruct a 45 acre-feet detention pond on Cook County ForestPreserve property to <strong>of</strong>fset lost floodplain areaRepair, as necessary, 1,400-foot embankment along east side <strong>of</strong>Tinley Creek downstream <strong>of</strong> Central Avenue. This alternative didnot effectively reduce water surface elevations in the flooding problemarea, thus benefits and costs were not developed.Dredge sediment in channel between 88th Avenue and Lake Lorin.TICR-6 Lake Lorin Increase storage potential <strong>of</strong> Lake Lorin. This alternative did noteffectively reduce water surface elevations in the flooding problemarea, thus benefits and costs were not developed.TICR-7TICR-8Tinley Creek between OrioleCourt and 151st StreetTinley Creek between160th Street and 86th AvenueStabilize using hard-armoring or other acceptable technology toprevent erosion problems that threaten structures between OrioleCourt and 151st Street.Stabilize using hard-armoring or other acceptable technology toprevent erosion problems that threaten structures between 160thStreet and 86th Avenue.3-207
CALUMET-SAG DETAILED WATERSHED PLANErosion Control Alternatives. Two erosion control alternatives, TICR-7 and TICR-8, were developedfor Tinley Creek to address the erosion problems that threaten structures alongTinley Creek between 160th Street and 151st Street in Orland Park. The alternatives proposedto address the erosion problems along Tinley Creek will provide hard armoring <strong>of</strong> thebank where erosion is occurring. For TICR-7, the project includes 700 feet <strong>of</strong> armoring upstream<strong>of</strong> Tee Brooke Drive on both sides <strong>of</strong> Tinley Creek, and 300 feet <strong>of</strong> armoring on oneside <strong>of</strong> Tinley Creek within the Quail Hollow Drive apartment complex just south <strong>of</strong> 151stStreet in Orland Park. For TICR-8, the project includes 450 feet <strong>of</strong> armoring on one side <strong>of</strong>Tinley Creek along Orlan Brook Drive between 160th Street and 159th Street, and 1,550 feet<strong>of</strong> armoring on both sides <strong>of</strong> Tinley Creek downstream <strong>of</strong> 159th Street to 86th Avenue. Forboth alternatives, the armoring is conceptually developed to include costs consistent withtraditional approaches to armoring such as concrete walls. As an alternative to using concrete,there are other hard-armoring erosion protection techniques available to stabilizeTinley Creek that will give a more natural appearance than concrete. Given its suburban settingwith limited space available, and structures located nearby, the current alignment <strong>of</strong>Tinley Creek will likely have to largely remain. However, through the use <strong>of</strong> rock and geotextilefabric, a hard-armoring protection technique can be designed to protect the slope in amore aesthetically pleasing way. This type <strong>of</strong> bank treatment will be keyed-in for toe-<strong>of</strong>slopeprotection and there will be transitions to the natural slope at the upstream anddownstream ends <strong>of</strong> each project area. The treatment will be scaled to the gradient <strong>of</strong> theslope and the shear stresses to which the slope is exposed.3.29.3.5 Alternative Evaluation and SelectionTICR-1 considered construction <strong>of</strong> a channel diversion beneath Central Avenue to divertflow and lower flood stages in and around problem MPA42. Some agencies familiar withthe area had noted the possibility <strong>of</strong> an existing 48-inch diversion pipe in this location. Fieldreconnaissance and communication with the Village <strong>of</strong> Crestwood determined that no suchdiversion exists. Modeling analysis showed that while the construction <strong>of</strong> a channel diversionwould reduce flood stages, the embankment on the north side <strong>of</strong> Tinley Creek approachingCentral Avenue would still overtop during a 100-year design storm. As thisalternative would only partially address damages, other alternatives were considered andthis alternative is not recommended.TICR-2 considered the impact <strong>of</strong> impounding Tinley Creek to an elevation <strong>of</strong> 645 feet withinthe Forest Preserve. The effectiveness <strong>of</strong> an impoundment is predicted to be greater thanTICR-1. A much smaller volume <strong>of</strong> floodwater is estimated to overtop the embankmentnorth <strong>of</strong> Tinley Creek approaching Central Avenue during a 100-year design storm. Thisproject is not recommended because TICR-3 addresses the same problem area and providescomplete protection, addressing all damages.TICR-3 includes a levee roughly 4.5 feet high on the north side <strong>of</strong> Tinley Creek approachingCentral Avenue. In addition, a second 4.5-foot high levee is proposed on the south side <strong>of</strong>Tinley Creek to protect structures at risk <strong>of</strong> flooding. Both proposed levees provide threefeet <strong>of</strong> freeboard above the modeled 100-yr WSEL, protecting the residential area north <strong>of</strong>Tinley Creek and problem area MPA42 from damages. A small pumping station is also recommendedto dewater the area behind the levee to the south <strong>of</strong> Tinley Creek. In the absence<strong>of</strong> compensatory measures, the water surface upstream <strong>of</strong> the levee would rise slightly, but3-208
3. TRIBUTARY CHARACTERISTICS AND ANALYSISthe upstream land includes one school, protected by the proposed levee, and areas withinthe Cook County Forest Preserve. The rise in WSEL in this area may be contained within afloodplain easement as allowed under IDNR regulation 3708.70.d.12. TICR-3 is recommendedin favor <strong>of</strong> TICR-3B, described below, because it provides increased benefits, whileminimizing impact on upstream Cook County Forest Preserve lands. Coordination with theForest Preserve may result in cooperation to achieve both regional flood control and ForestPreserve priorities in the area.The volume <strong>of</strong> lost floodplain storage was estimated to be 45 acre-feet, based on a rough estimate<strong>of</strong> 1.5 feet <strong>of</strong> flooding over a 30-acre downstream area. TICR-3b includes the cost <strong>of</strong> thelevee and the cost to construct a 45 acre-feet detention facility to provide compensatory storage.Since the Tinley Creek subwatershed boundaries are very narrow at the proposed leveelocation, and land use transitions to the Forest Preserve 2,000 feet upstream, this storage locationis proposed within the Forest Preserve. The site was chosen because the low slope in thearea reduces the excavation volume required, and the space is relatively more open thannearby more densely forested areas. Alternative locations providing sufficient compensatorystorage could not be identified outside <strong>of</strong> Cook County Forest Preserve. The proposed storagelocation is not online <strong>of</strong> Tinley Creek, but in the overbank area, and unlike TICR-2 does notimpound Tinley Creek itself, or raise the WSEL <strong>of</strong> Tinley Creek within the Cook County ForestPreserve. TICR-3b is not a recommended alternative in this area because <strong>of</strong> the impact tothe forest preserve caused by the compensatory storage is required.TICR-4 involves the repair <strong>of</strong> the embankment along the east bank <strong>of</strong> Tinley Creek on thedownstream side <strong>of</strong> Central Avenue. No damages were estimated in the overbank region inthis area, due in part to the modeled impact <strong>of</strong> the existing embankment in this area, and soTICR-4 was not considered in detail. If this embankment were allowed to degrade, floodwaterscould escape the right overbank region <strong>of</strong> Tinley Creek and cause roadway flooding.TICR-5 considered the removal <strong>of</strong> accumulated sediment from a 1,500-foot reach <strong>of</strong> TinleyCreek between the outlet <strong>of</strong> Lake Lorin and 88th Avenue. Survey data obtained 350 feetdownstream <strong>of</strong> the Lake Lorin outlet indicate a channel invert <strong>of</strong> 697.61 feet, roughly 1 ftabove the lower <strong>of</strong> the surveyed invert <strong>of</strong> 696.61 feet on the discharge pipe from Lake Lorin.Reported problems OH1 and OP15 refer to sedimentation in 88th avenue and downstream,which were not included in the modeled baseline conditions because <strong>of</strong> the Village <strong>of</strong> OrlandPark has plans to address this issue, which was consequently not included in baseline conditions.Dredging between 88th Avenue and Lake Lorin results in the most significant WSELreductions along the dredged reach, although property damage due to flooding has not beenreported adjacent to the dredged reach. Minor reductions in peak WSEL (approximately 0.1ft) are predicted in this and adjacent reaches. One structure is estimated to be removed fromthe 100-year inundation area due to TICR-5, with other damages associated with minor peakWSEL reductions for the modeled storms.TICR-6 includes several scenarios considering expansion <strong>of</strong> the storage volume <strong>of</strong> LakeLorin. The most aggressive alternative would involve clearing some <strong>of</strong> the vegetation restrictingflow along with the addition <strong>of</strong> roughly 16 acre-feet <strong>of</strong> storage on the baseball fieldnorthwest <strong>of</strong> the lake. Preliminary evaluation <strong>of</strong> these alternatives indicated very minor impactson calculated damages. Damages upstream <strong>of</strong> 167th Street are located along a stretch<strong>of</strong> Tinley Creek with significant gradient, and the stream rises quickly above the level definedat the 167th Street crossing controlled by Lake Lorin. Downstream damages are not3-209
CALUMET-SAG DETAILED WATERSHED PLANsignificantly reduced either, as Lake Lorin is still predicted to overtop for high magnituderainfall events. The relative ineffectiveness <strong>of</strong> additional storage is most likely because it isonline with Tinley Creek. The 12-hour duration storm used for analysis within the <strong>Cal</strong>umet-<strong>Sag</strong> Channel <strong>Water</strong>shed results in significant storage being used within Lake Lorin beforethe peak <strong>of</strong> the storm. It is possible that additional storage in Lake Lorin would providemore significant benefits for high magnitude events <strong>of</strong> shorter duration.TICR-7 is recommended to address erosion damages associated with erosion problems thatthreaten structures between Oriole Court and 151st Street in Orland Park. TICR-8 is recommendedto address erosion damages associated with erosion problems that threaten structuresbetween 160th Street and 86th Avenue in Orland Park.WPC member feedback suggested the idea <strong>of</strong> pumping Lake Lorin to provide additionalstorage. The grade <strong>of</strong> Tinley Creek downstream <strong>of</strong> Lake Lorin does not permit lowering theoutlet pipe to provide additional storage, but the lake could be pumped in advance <strong>of</strong>storms to make additional storage capacity available for flood attenuation. Although technicallyfeasible, this alternative is complicated logistically, as operators would be required toidentify pumping thresholds based on weather forecasts to provide the additional storage.The high maintenance cost for this suggestion, combined with logistical difficulty, excludedit from further consideration.Recommended alternatives result in reduced stage and/or flow along the modeled waterway.Table 3.29.12 provides a comparison <strong>of</strong> the modeled maximum WSEL, and modeledflow at the time <strong>of</strong> peak at representative locations along the waterway.A number <strong>of</strong> properties are at risk <strong>of</strong> shallow flooding during the 100-year flood event underexisting conditions or recommended alternative conditions. In addition, due to their locations,other properties' risk <strong>of</strong> flooding cannot be feasibly mitigated by structuralmeasures. Such properties are candidates for protection using nonstructural flood controlmeasures, such as flood-pro<strong>of</strong>ing or acquisition. These measures may be considered to addressdamages that are not fully addressed by capital projects recommended in the <strong>Cal</strong>umet-<strong>Sag</strong>Channel <strong>DWP</strong>.3.29.3.6 Data Required for Countywide Prioritization <strong>of</strong> <strong>Water</strong>shed ProjectsAppendix I presents conceptual level cost estimates for the recommended alternatives. Table3.29.13 lists alternatives analyzed in detail. TICR-3, levves with a flood easement, andTICR-5, the dredging <strong>of</strong> a 1,500 ft length <strong>of</strong> Tinley Creek are recommended, and shown inFigures 3.29.4 and 3.29.5, respectively. These figures also show a comparison <strong>of</strong> the existingconditions to the alternative conditions inundation mapping with the implementation <strong>of</strong>TICR-3 and TICR-5. Figures 3.29.6 and 3.29.7, respectively, show the recommended erosioncontrol alternatives TICR-7 and TICR-8.3-210
3. TRIBUTARY CHARACTERISTICS AND ANALYSISTABLE 3.29.12Tinley Creek Existing and Alternative Condition Flow and WSEL ComparisonExisting Conditions TICR-3 TICR-5LocationStationMaxWSEL (ft)MaxFlow(cfs)MaxWSEL(ft)MaxFlow(cfs)MaxWSEL(ft)Max Flow(cfs)Tinley Creek100-ft downstream<strong>of</strong>167th St.Tinley Creekcrossing at163rd St.Tinley Creek170-ft downstream<strong>of</strong> 86thAve.Tinley Creek50-ft upstream<strong>of</strong>151st St.Tinley Creek50-ft downstream<strong>of</strong> 82ndAve.Tinley Creek130-ft upstream<strong>of</strong>RidgelandAve.Tinley Creek100-ft upstream<strong>of</strong>Central Ave.Tinley Creek70-ft downstream<strong>of</strong><strong>Cal</strong>umet-<strong>Sag</strong>Rd. and127th St.58572 702.53 174.20 702.53 174.21 702.38 202.8352956 697.76 184.77 697.76 184.81 697.67 178.7648131 683.56 667.97 683.56 667.97 683.54 662.2843469 672.34 920.21 672.34 920.19 672.32 913.5637894 661.70 1578.47 661.70 1578.50 661.68 1571.8518787 628.95 1908.13 629.34 2130.52 628.95 1906.673565 604.87 2712.00 604.78 2660.19 604.86 2704.08462 592.88 2946.70 592.82 2918.71 592.86 2936.663-211
CALUMET-SAG DETAILED WATERSHED PLANTABLE 3.29.13Tinley Creek Project Alternative Matrix to Support <strong>District</strong> CIP PrioritizationProject Description B/C RatioNet Benefits($)Total ProjectCost ($)CumulativeStructuresProtectedFundingPossibilities<strong>Water</strong>QualityBenefit Recommended Communities InvolvedTICR-1 Channel Diversion 0.05 244,300 4,957,900 5 USACE No Impact No Crestwood, Alsip, UnincorporatedCookCountyTICR-2Forest preserve impoundment0.54 1,682,900 3,104,200 28 USACE Mixed No Crestwood, Alsip, UnincorporatedCookCountyTICR-3 Levee 0.72 1,982,000 2,764,400 42 USACE No Impact Yes Crestwood, Alsip, UnincorporatedCookCountyTICR-3BLevee and compensatorystorage0.32 1,933,700 6,032,300 40 USACE SlightlyPositiveNoCrestwood, Alsip, UnincorporatedCookCountyTICR-5Dredge sediment inchannel between88th Avenue andLake Lorin1.26 142,600 112,800 4 USACE No Impact Yes Orland Hills, OrlandParkTICR-7Stabilize erosion <strong>of</strong>Tinley Creek betweenOriole Courtand 151st Street1.03 1,524,700 1,479,700 6 SlightlyPositiveYesOrland ParkTICR-8Stabilize erosion <strong>of</strong>Tinley Creek between160th Streetand 86th Avenue1.55 7,164,900 4,627,200 8 USACE SlightlyPositiveYesOrland ParkNote: Net Benefits values do not include local benefits or non-economic benefits.3-212
4. <strong>Water</strong>shed Action PlanThis section summarizes the <strong>DWP</strong> recommendations. The recommendations and supportinginformation will be considered by the <strong>District</strong>’s Board <strong>of</strong> Commissioners in their prioritization<strong>of</strong> a countywide Stormwater Capital Improvement Program (CIP). The recommendationswithin the <strong>DWP</strong> consist <strong>of</strong> maintenance activities (Section 4.1) and recommendedcapital improvements (Section 4.2).4.1 <strong>Water</strong>shed Maintenance ActivitiesReview <strong>of</strong> reported stormwater problem data indicated that certain types <strong>of</strong> maintenanceactivities would be helpful in preventing these stormwater problems. The <strong>District</strong>, throughits maintenance activities, has been actively removing blockages such as tree limbs andwoody debris from channels throughout the Cook County. Local communities have reportedbenefits from these maintenance activities. It is recommended that the <strong>District</strong> maintenanceactivities be continued to address ongoing future maintenance needs.Modeling analysis performed as part <strong>of</strong> the <strong>DWP</strong> generally revealed that dredging accumulatedsediment was not effective in significantly reducing damages due to regional overbankflooding problems. In a few cases where dredging was found to have a regional benefit, itwas recommended as a part <strong>of</strong> the <strong>DWP</strong>’s CIP. Significant regulatory challenges exist withdredging projects. Sedimentation is a dynamic process that is affected by soil protectivemeasures taken in upland tributary areas as well as dynamic streambank conditions. The<strong>District</strong>’s <strong>Water</strong>shed Management Ordinance will define standard practices for erosion protectionon construction sites. Best management practices in upland areas should be pairedwith stream maintenance measures to reduce sediment delivered to waterways to reducethe need for extensive dredging programs.Stormwater improvement projects recommended in the <strong>Cal</strong>umet-<strong>Sag</strong> Channel <strong>DWP</strong> includingdetention basins, channel diversions, or erosion control armoring, will require ongoingmaintenance after construction. Costs associated with maintenance over a 50-year life-cycleperiod were included in cost estimates. It is recommended that the <strong>District</strong> develop maintenanceplans for capital improvements, and where applicable, execute agreements with localgovernments, delegating certain maintenance responsibilities. Maintenance agreements willfollow current <strong>District</strong> practice, where the <strong>District</strong> is responsible for operation and maintenance<strong>of</strong> structural, electrical, and mechanical facilities and grounds are the responsibility <strong>of</strong>partnering organizations.Table 4.1.1 lists all problem area locations where standard stream maintenance activities arerecommended including debris and blockage removal, removal <strong>of</strong> silt from culverts, and removal<strong>of</strong> sediment from stream channels. There is one location that has been identified withinthe watershed where a stream within the Cook County Forest Preserve has not been properlymaintained, causing conveyance restrictions that could indirectly contribute to flooding <strong>of</strong>residences. It is recommended that the <strong>District</strong> work with the Forest Preserve to ensure that aproper grade is maintained on these channels to avoid potential problems in the future. Thiswill require debris removal, and may require some dredging. The location is listed below in4-1
CALUMET-SAG DETAILED WATERSHED PLANTable 4.1.1 along with the approximate gradient to be maintained. If dredging is performed,permits may be required from regulatory agencies such as USACE and IDNR and downstreamimpact must be considered.TABLE 4.1.1Summary <strong>of</strong> Problem Areas where Debris Removal or Other Maintenance is RecommendedProblem Area ID Tributary LocationOF3 Boca Rio Ditch Boca Rio Ditch at 151st Street inOak ForestType <strong>of</strong> MaintenanceActivity RequiredRemove debris and clearchannelPrivate property owner refusesaccessLT4 I&M Canal Stephen Street and north <strong>of</strong> TalcottStreet in Lemont TownshipHH5 I&M Tributary D I&M Tributary D between KeanAvenue and 87th StreetOP11 Long Run Creek 143rd Street and Wolf Road inOrland ParkOP12 Marley Creek Marley Creek at 108th Avenue inOrland ParkOP3 Marley Creek Marley Creek near CameronParkway in Orland ParkOP6 Marley Creek Marley Creek from AnthonyDrive to Meade Street in OrlandParkCR1 Melvina Ditch Melvina Ditch and West StonyCreek confluence in ChicagoRidgeRemove debris and clearchannelRegrade channel to aslope <strong>of</strong> 0.35% on CookCounty Forest PreservePropertyRemove debris and clearchannel <strong>of</strong> sedimentationRemove debris and siltfrom box culverts and surroundingareaRemove debris and clearchannelRemove debris and clearchannelRemove debris and clearchannelOP8 Tinley Creek Tinley Creek at 82nd Ave Remove debris downstreamOP10 Spring Creek Spring Creek just upstream <strong>of</strong>155th Street and between 155thStreet and 159th Street in OrlandTownshipOL1 Stony Creek Stony Creek near Central Avenue,¼ mile south <strong>of</strong> 103rdStreet in Oak LawnWO2 Stony Creek Stony Creek between Oak Lawnand 76th Avenue in WorthRemove debris and clearchannelRemove debris and clearchannel, including silt inand around culvertsRemove debris and clearchannelAL1 Stony Creek Stony Creek at 115th Street Remove debris and clearchannel; and repairstreambank4-2
4. WATERSHED ACTION PLAN4.2 Recommended Capital ImprovementsTable 4.2.1 lists all recommended improvements for the <strong>Cal</strong>umet-<strong>Sag</strong> Channel <strong>DWP</strong>. The<strong>District</strong> will use data presented here to support prioritization <strong>of</strong> a countywide stormwaterCIP.4.3 Implementation PlanAlternatives listed in Table 4.2.1 can be constructed independently. However, in some cases,benefits associated with construction <strong>of</strong> several alternatives within a subwatershed will exceedthe sum <strong>of</strong> the benefits <strong>of</strong> individual alternatives. The data presented in Table 4.2.1,along with noneconomic factors, will allow the <strong>District</strong> to prioritize its CIP and to implementprojects. A number <strong>of</strong> alternatives in Table 4.2.1 require the acquisition <strong>of</strong> land thatcurrently may be unavailable. It is recommended that upon selecting an alternative for implementation,the <strong>District</strong> identify land acquisition needs and procedures.4-3
4. WATERSHED ACTION PLANTABLE 4.2.1<strong>Cal</strong>umet-<strong>Sag</strong> Channel <strong>Water</strong>shed Prioritization Matrixa- Benefits include 6 acres <strong>of</strong> wetland restorationb- Project does not include existing regional financial benefits, but is recommended as a preventative measure because further bank failure risks a severe channel flow restriction within Stony Creek.4-5
5. Summary and ConclusionsThe <strong>Cal</strong>umet-<strong>Sag</strong> Channel <strong>DWP</strong> was developed in coordination with the <strong>Cal</strong>umet-<strong>Sag</strong>Channel WPC. The coordination focused on integrating community knowledge <strong>of</strong> stormwaterproblems and ideas for feasible solutions into the <strong>District</strong>’s regional stormwater plan. Allstormwater problem data received from stakeholders was recorded in a spatial database,and classified as local or regional according to the criteria defined in Section 1. Hydrologicand hydraulic models were developed to estimate flow and stage along regional waterwaysand assess the frequency and depth <strong>of</strong> flooding problems for a range <strong>of</strong> modeled recurrenceintervals. Inundation mapping was developed for the 2-, 5-, 10, 25, 50, 100-year, and 500-year modeled storm events, identifying areas estimated to be at risk <strong>of</strong> flooding. Modeledwater depths and inundation mapping were used to help estimate damages due to floodingwithin each tributary.Stormwater improvements were developed to address regional problems throughout the<strong>Cal</strong>umet-<strong>Sag</strong> Channel <strong>Water</strong>shed. Appropriate tributary-specific technologies werescreened considering their applicability for addressing problem areas, constructability in thearea required, and regulatory feasibility. The potential impact <strong>of</strong> future development conditionson recommended alternatives was considered. Damage estimates for proposed alternativeswere performed to evaluate the alternative’s effectiveness at reducing regionalstormwater damages. The difference in damages between existing and alternative conditionswas quantified as the alternative’s benefit. In addition to numeric benefits, severalother criteria were noted for each alternative, such as the number <strong>of</strong> structures protected,water-quality benefit, and wetland and riparian areas affected. Conceptual level cost estimateswere developed to estimate the construction and maintenance cost <strong>of</strong> proposed alternativesover a 50-year period. The estimated benefits were divided by the conceptual cost todevelop a B/C ratio for each alternative.Figure 5.1 illustrates the potential <strong>of</strong> alternatives within the <strong>DWP</strong> to address regional damagesthroughout the watershed, ordered by increasing existing conditions damages. A logarithmicscale is used so that the wide range <strong>of</strong> estimated damages, ranging from $24,100 forSpring Creek to $32,400,500 for Stony Creek, can be displayed on a single graph. The columnsindicate the extent to which recommended alternatives address estimated damages,while the red B/C symbols indicate the B/C ratio. As an example, the recommended StonyCreek alternatives address 45 percent <strong>of</strong> estimated damages (indicated by the column),which corresponds to a benefit <strong>of</strong> $14,498,600. In contrast, 66 percent <strong>of</strong> the damages along<strong>Cal</strong>umet-<strong>Sag</strong> Tributary B are addressed, but this results in $669,700 <strong>of</strong> benefit, or 4.6 percent<strong>of</strong> benefits <strong>of</strong> recommended Stony Creek alternatives.Recommended alternatives are estimated to reduce regional damages by $36,220,000 over a50-year period, at an estimated cost <strong>of</strong> $159,018,400. Estimated damage reductions result fromproposed stormwater improvements that increase storage in the watershed, thereby reducingpeak flows and stage, increasing conveyance to receiving systems (only if increased flows donot cause downstream damages), or channel protection measures to reduce erosion damages.Floodpro<strong>of</strong>ing alternatives, though feasible for addressing isolated shallow flooding issues,5-1
CALUMET-SAG DETAILED WATERSHED PLANare not included in the summary statistics below due to the individualized way in which suchmeasures would be implemented. Benefits from proposed projects are not distributed evenlythroughout the watershed, but generally concentrated in subwatersheds with greater existingconditions damages where capital improvement projects are able to address greater existingconditions damages. Differences in the amount <strong>of</strong> available land for storage alternatives alsocontribute to differences in benefits between subwatersheds. Recommended solutions do notgenerally address all damages from the 100-year inundation areas, as sufficient land is not alwayspresent in locations that can reduce floodwaters to eliminate inundation <strong>of</strong> structuresalong regional waterways.FIGURE 5.1<strong>Cal</strong>umet-<strong>Sag</strong> Channel <strong>Water</strong>shed Alternative SummaryStormwater problems, whether identified by stakeholders or identified by modeling <strong>of</strong>intercommunity waterways, indicate a need for regional stormwater management solutionsthroughout the <strong>Cal</strong>umet-<strong>Sag</strong> Channel <strong>Water</strong>shed. Although problems are concentrated inthe more intensively developed, flatter northern section <strong>of</strong> the watershed, significantstormwater problems exist throughout the watershed. If constructed, the recommended alternativesin Table 4.2.1 are expected significantly to reduce stormwater damages, althoughdamages are expected to persist within the watershed even following construction <strong>of</strong> thoseprojects. However, implementation <strong>of</strong> the recommended projects should reduce the number<strong>of</strong> homes and businesses adversely affected by flooding, and also the severity <strong>of</strong> damages.Communities can continue to work toward reducing stormwater damage by ensuring thatdevelopment is responsibly managed with consideration given to potential stormwater impactsand the existing stormwater problems within the watershed.5-2
6. ReferencesChristopher B. Burke Engineering, LTD. 1997. Flood Mitigation Studies Final Report. May.Consoer, Townsend & Associates/<strong>Metropolitan</strong> <strong>Water</strong> <strong>Reclamation</strong> <strong>District</strong> <strong>of</strong> <strong>Greater</strong> Chicago.1968. Preliminary Report on Melvina Ditch.Engineering Resource Associates, Inc. 2006. Construction and Maintenance <strong>of</strong> Dams: DamSafety Permit for Castle Bowl Retention Facility.Federal Emergency Management Agency (FEMA). 2003. Guidelines and Specifications for FloodHazard Mapping, Appendix A: Guidance for Aerial Mapping.FEMA. 2001. “What is a Benefit?” Guidance on Benefit Cost Analysis <strong>of</strong> Hazard Mitigation Projects.Huff, Floyd Al, and James R. Angel. 1992. Rainfall Frequency Atlas <strong>of</strong> the Midwest. Illinois State<strong>Water</strong> Survey, Champaign, Bulletin 71.Illinois Department <strong>of</strong> Transportation. 1980. Strategic Planning Study for Flood Control, Justice,Illinois. September.Illinois Environmental Protection Agency. 2008. Integrated <strong>Water</strong> Quality Report.Knight Infrastructure with Cook County Highway Department. 2004. Drainage Report: 96thStreet Detention Pond Capacity Investigation and 88th / 86th Avenue Reconstruction 103rd Streetto 87th Street. May.Mackie Consultants, LLC. 2008. Drainage Investigation, Illinois Route 7 (Southwest Highway),131st Street to 139th Street. January.<strong>Metropolitan</strong> <strong>Water</strong> <strong>Reclamation</strong> <strong>District</strong> <strong>of</strong> <strong>Greater</strong> Chicago (<strong>District</strong>). 2007. Cook CountyStormwater Management Plan.<strong>Metropolitan</strong> <strong>Water</strong> <strong>Reclamation</strong> <strong>District</strong> <strong>of</strong> <strong>Greater</strong> Chicago (<strong>District</strong>). 2006. M&O FacilitiesHandbook.National Oceanic and Atmospheric Administration (NOAA). 2001. Guidelines for EstablishingGPS-Derived Ellipsoid Heights (Standards: 2 CM and 5 CM). Technical Memorandum NOSNGS-58. Version 4.3.Patrick Engineering. 2006. Drainage Investigation: Patrick Engineering (2006)/Cook CountyHighway Department: Study <strong>of</strong> Roberts Road Storm Sewer from Archer Avenue to 111th Street.Stanley Consultants. 1987. Final Draft: Project Planning Study for Flood Control, Hickory HillsIllinois. July.U.S. Army Corps <strong>of</strong> Engineers. 2006. HEC-HMS Technical Reference Manual.U.S. Army Corps <strong>of</strong> Engineers. 2003. Technical Guidance Memorandum EGM 04-01.6-1
CALUMET-SAG DETAILED WATERSHED PLANU.S. Army Corps <strong>of</strong> Engineers. 2001 Stony Creek, Oak Lawn, Illinois Detailed Project Report.October.United States Department <strong>of</strong> Agriculture, Natural Resource Conservation Service. 1986. UrbanHydrology for Small <strong>Water</strong>sheds. Technical Release No. 55. June.United States Geologic Survey. 2004. Estimating Flood-Peak Discharge Magnitude and Frequenciesfor Rural Streams in Illinois.6-2