AGSTATS-Executive Su.. - Ministry Of Agriculture, Food and ...
AGSTATS-Executive Su.. - Ministry Of Agriculture, Food and ...
AGSTATS-Executive Su.. - Ministry Of Agriculture, Food and ...

You also want an ePaper? Increase the reach of your titles
YUMPU automatically turns print PDFs into web optimized ePapers that Google loves.
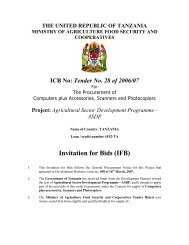
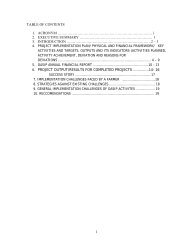
United Republic of Tanzania<strong>Ministry</strong> of <strong>Agriculture</strong> <strong>Food</strong> Security <strong>and</strong> Cooperatives1086420Mz Cr Nc Tot<strong>AGSTATS</strong> FOR FOOD SECURITYVOLUME 1: The 2010/11Preliminary <strong>Food</strong> Crop Production Forecast for2011/12 <strong>Food</strong> SecurityEXECUTIVE SUMMARY180160154 153148140120132 130126122117 116 115 114111109 109 108 1061009895 9490 898060402040RukwaMbeyaRuvumaMtwaraIringaKigomaKageraKilimanjaroSingidaDodomaMorogoroTANZANIALindiTaboraManyaraTangaMaraMwanzaCoastArushaShinyangaDar es SalaamCrop Monitoring <strong>and</strong> Early Warning<strong>Ministry</strong> of <strong>Agriculture</strong> <strong>Food</strong> Security <strong>and</strong> CooperativesP.O. Box 9192,Tel 2865950,Fax 2865951E-Mail: dnfs@kilimo.go.tzDar es Salaam, TanzaniaDar es Salaam June, 2011
Preliminary Forecast of <strong>Food</strong> CropProduction for 2010/11&Preliminary Forecast of <strong>Food</strong>Security for 2011/12Main Highlights The 2010/11 Preliminary <strong>Food</strong> Crop Production Forecast amounts 12,810,818 tonnesgrain equivalent <strong>and</strong> requirement for 2011/12 amounts 11,499,414 tonnes. In terms ofcereals <strong>and</strong> non-cereals, a self sufficiency status 1 of 94% implying a sizeable deficitamounting 413,739 tonnes <strong>and</strong> a surplus status of 140% implying a surplus amounting1,725,143 tonnes are respectively achievable. In effect, a net food situation involvingthe 2010/11 production is such that a self sufficiency ratio of 111% or a food surplusamounting 1,311,404 tonnes is attainable 2 . Compared to previous season, production increase of 4% has been observed in totaldue to fairly good rains 3 in respect of timely onset <strong>and</strong> a fairly appropriate distributionexperienced over most unimodal regions. Even then, a substantial decrease ofapproximately 8% is notable in cereals. The positive non-cereal <strong>and</strong> negative cerealchange amidst the prevailing climate change regime is worth further enquiry. An analysis of carryover stocks (COS) shows that, on the eve of new marketing year2011/12 (i.e. the midnight of 1/06/11) a total of 787,908 tonnes food stock was carriedover into 2011/12 marketing year of which 189,966 tonnes was held in NFRA(National <strong>Food</strong> Reserve Agency) warehouses while 203,988 tonnes was held by privatestockists <strong>and</strong> 393,954 tonnes was estimated as farm retention. Added to the 1,311,404tonnes preliminary forecast of food surplus arrived at as above, the total food available,over <strong>and</strong> above national requirement is 2,099,312 tonnes. Stability in this forecast will depend on 2011/12 vuli performance which continues tonegatively stagger around 60%. Though without quantification, the performance overthe 2010/11 masika season whose effect on flowering <strong>and</strong> grain-filling stages towardsmaturity in bimodal areas is normally significant, may also negatively imply a drawdownin the indicated harvestable tonnage. It is notable; therefore, that the forecast issensitive to vuli performance <strong>and</strong> the remaining part of masika beyond 31/05/11beyond the deadline of data valid for this report. These are the two areas which arelikely to affect the production figure at the final forecast in November, 2011. Thedraw-down in the case of vuli may rise to the tune of 450,000 tonnes cognizant ofrecent experiences 4 ! At sub-national level SSR analysis warns of 6 deficit regions 5 . Furthermore, thoughself sufficient or surplus, further warnings are focused to 10 additional regions bearingpockets of food shortage. Indicative of farming sector performance, a total of 161 The status measured by a self-sufficiency ratio (SSR), which indicates the ability of farmers, given productiondecision <strong>and</strong> marketing business environment, to manage <strong>and</strong> feed local population as well as meet otherrequirements of the same. SSR is expressed in percentage terms whereby
Preliminary Forecast of <strong>Food</strong> CropProduction for 2010/11&Preliminary Forecast of <strong>Food</strong>Security for 2011/12regions send out worrying signals to local authorities that a total of 56 LGAs may bearvulnerable population over the coming marketing year. The identified vulnerableareas will need to be subjected to an in-depth vulnerability assessment for interventionpreparedness in case. In view of the increased number of deficit regions <strong>and</strong> vulnerable areas <strong>and</strong> since thereis an alarming cereal gap in the country (413,439 tonnes) food crop exportation willhave to be temporarily halted for 6 months so that the government will have an ampletime to closely follow-up on the food situation in the country.The ForecastDuring the months of May-June, 2011 the National <strong>Food</strong> Security Division (CropMonitoring <strong>and</strong> Early Warning) carried out a regular preliminary food cropproduction forecast survey to ascertain food crop harvest status for 2010/11 <strong>and</strong> thecorresponding availability for 2010/11. Interest was to determine the preliminarystatus concluded through capturing the effect of factors affecting crop productionthat ruled over the growth stages from seed germination to maturity.The exercise involved collection of the 2010/11 data <strong>and</strong> information from all thedistricts of mainl<strong>and</strong> Tanzania in collaboration with Regional AgriculturalAdvisors (RAAs) <strong>and</strong> the District Agricultural <strong>and</strong> Livestock Development<strong>Of</strong>ficers (DALDOs). The process made use of regular tools that facilitate theroutine retrieval system while monitoring field crop performance as well as marketperformance in respect of food availability <strong>and</strong> price signaling for early warningfor food security. Accordingly <strong>and</strong> appropriately, production forecast was madefor 2010/11 crop season <strong>and</strong> food security forecast was made for 2011/12marketing year. The retrieval tools used focused at 1. Management based Snapshortinformation, 2. Crop target implementation status, 3. In-field cropphenological assessment, 4. Pest prevalence assessment, 5. Market <strong>Food</strong>Availability assessment 6. Rainfall availability assessment <strong>and</strong> 7. Vulnerabilitydetection assessment.An analysis covering these retrieval areas was undertaken <strong>and</strong> results are subjectmatter of this report presented in different volumes. The results concentrate onnational <strong>and</strong> regional level food status with main highlights of regions <strong>and</strong> districtsbearing vulnerable areas. For clarity purposes, we are pleased to note that WRS1 6<strong>and</strong> TSA 7 have also been critically analysed <strong>and</strong> results are also part of this6 WRS1 is a weekly retrieval system tool that captures district level targets vs. implementation of area planted <strong>and</strong>expected production in 12 main food crops as compiled by DALDOs.7 TSA is an analytical procedure that assesses snapshot stories summarising food crop performance, WRS1-5 <strong>and</strong>cash crop performance as recorded by field level experts <strong>and</strong> concludes with field level perception of expected foodPage 3
Preliminary Forecast of <strong>Food</strong> CropProduction for 2010/11&Preliminary Forecast of <strong>Food</strong>Security for 2011/12presentation as Volume 2 <strong>and</strong> Volume 3 respectively banking on field intimacyinvolving MAFC experts <strong>and</strong> field teams at regional as well as at district levels.From the analysis, it has been found that 12,810,818 tonnes of food crops will beavailable from farm production comprised of 6,786,605 tonnes of cereals 8 <strong>and</strong>6,024,217 tonnes of non-cereals 9 (Table 1, Figure 1, Appendix 1 <strong>and</strong> Appendix 2)<strong>and</strong> will meet national food requirement amounting 11,499,414 tonnes of food by111 percent implying a 1,311,404 tonnes of surplus food (Table 1, Appendix 2).Figure 1: Tanzania Preliminary <strong>Food</strong> Production Forecast byCrop in 2010/11 (Proportions of 12,810,818 Tonnes)Cassava8%Potatoes13% Maize33%SSR = 111%Banana12%Pulses14%Wheat1%Rice11%Sorghum6%Millets2%situation. This analysis offers a good debate ground linking between SSR <strong>and</strong> the local level expectations of foodsecurity situation appropriate for data dissemination seminars.8 The cereal crops covered under CMEWS include maize, sorghum, millets, rice <strong>and</strong> wheat.9 The non-cereals include pulses, cassava, banana <strong>and</strong> potatoesPage 4
Preliminary Forecast of <strong>Food</strong> CropProduction for 2010/11&Preliminary Forecast of <strong>Food</strong>Security for 2011/12Table 1: The 2010/11 Preliminary <strong>Food</strong> Crop Production versus 2011/12Requirement, Gap/<strong>Su</strong>rplus Analysis <strong>and</strong> Self sufficiency Ratios at national levelCereals Production (Tonnes) 6,786,602Requirement (Tonnes) 7,200,341Gap/<strong>Su</strong>rplus (Tonnes) -413,739SSR - Cereals (%) 94Non-cereals Production (Tonnes) 6,024,217Requirement (Tonnes) 4,299,073Gap/<strong>Su</strong>rplus (Tonnes) 1,725,143SSR - Non-cereals (%) 140Total <strong>Food</strong> Production (Tonnes) 12,810,818Requirement (Tonnes) 11,499,414Gap/<strong>Su</strong>rplus (Tonnes) 1,311,404SSR - Total (%) 111An analysis of Carryover stocks (COS) shows that, on the eve of new marketingyear a total of 787,908 tonnes food stock was carried over into 2011/12 marketingyear of which 189,966 tonnes was held in NFRA premises while 203,988 tonneswas held by private stockists <strong>and</strong> 393,954 tonnes was estimated as farm retention(Figure 2).Page 5
Preliminary Forecast of <strong>Food</strong> CropProduction for 2010/11&Preliminary Forecast of <strong>Food</strong>Security for 2011/12Figure 2: Carry-Over Stocks Analysis 31 st May, 2011 (Tonnes)Private,203,988Farmret,393,954787,908TonnesPublic,189,966Added to the 1,311,404 tonnes preliminary forecast of food surplus arrived at asabove, the total food available, over <strong>and</strong> above national requirement is 2,099,312tonnes.Time series analysis shows that, compared to previous season, production increaseof 4% is expected in total (81% in wheat, 40% in potatoes, 34% in pulses, 7% inbanana <strong>and</strong> 7% in cassava) probably attributed to fairly good rains in respect oftimely onset <strong>and</strong> a fairly appropriate distribution experienced in the areas growingthese crops. Even then, a decrease of approximately 8% is notable in cereals (16%in millets, 15% in rice <strong>and</strong> 8% in maize, the national staple) (See Appendix 7).Compared to trend values computed from 1992/93-2009/10 10 , all food cropcategories fall below whereby total tonnage falls below by 5%, cereals by 2% <strong>and</strong>non-cereals by 8%. Consistently, all non-cereals except for pulses st<strong>and</strong> below thetrend line by 10% (potatoes) – 13% (cassava) while all cereals except for maizest<strong>and</strong> positive by 3% (rice) – 17% (wheat). Trend values <strong>and</strong> other measures oftime series analysis for different crops are as per Appendix 7.At sub-national level, the 2010/11 production is expected to meet food requirementfor 2011/12 marketing year in 15 regions while deficit status is detected in 6regions namely (with SSR levels in brackets) Dar es Salaam (4%), Shinyanga10 a reasonable period of reliable food crop statisticsPage 6
Preliminary Forecast of <strong>Food</strong> CropProduction for 2010/11&Preliminary Forecast of <strong>Food</strong>Security for 2011/12(89%), Arusha (90%), Coast (94%), Mwanza (95%) <strong>and</strong> Mara (98%). The 15regions are categorized into 8 self sufficient regions with SSR level of 106%-117%<strong>and</strong> 7 surplus regions with SSR levels of 122%-154% (Figure 3, Appendix 2).Figure 3: Total <strong>Food</strong> <strong>Su</strong>pply Forecast for the 2011/12 Marketing Year(Based on 2010/11 Preliminary <strong>Food</strong> Crop Production Forecasts))Arusha (Deficit)Manyara (Self<strong>Su</strong>fficient)Page 7
Preliminary Forecast of <strong>Food</strong> CropProduction for 2010/11&Preliminary Forecast of <strong>Food</strong>Security for 2011/12VulnerabilityAn analysis of monthly routine retrieval system (RRS1) <strong>and</strong> management basedsnapshot information (TSA), vulnerable hotspots have been detected in 56 districtsin 16 regions including both the 6 definitely deficit regions, 6 self sufficientregions <strong>and</strong> 4 surplus regions. Vulnerability ranks highest in Shinyanga, Arusha<strong>and</strong> Mwanza where over one third of all detected vulnerable districts are locatedfollowed an intermixture of 7 self sufficient cum deficit regions of Kilimanjaro,Manyara, Mara, Tabora, Dar es Salaam, Singida, Coast <strong>and</strong> Dodoma <strong>and</strong> finallythe bottom lying bit of 5 mainly surplus regions composed of Iringa, Kagera,Mbeya, Mtwara <strong>and</strong> Tanga. Categorically, the deficit regions bear 30 districtswhile self sufficient regions bear 19 districts <strong>and</strong> the surplus regions bear 7 districtswith vulnerable areas.Recommendations From above, a total of 56 districts in 16 regions are identified as containingvulnerable areas <strong>and</strong> will need to be subjected to an in-depth vulnerabilityassessment for necessary intervention by Government. In view of the increased number of deficit regions <strong>and</strong> vulnerable areas <strong>and</strong>since there is an alarming cereal gap in the country (413,439 tonnes) foodcrop exportation will have to be temporarily halted for 6 months so that thegovernment will have an ample time to closely follow-up on the foodsituation in the country.Page 8
Preliminary Forecast of <strong>Food</strong> CropProduction for 2010/11&Preliminary Forecast of <strong>Food</strong>Security for 2011/12Page 9
Preliminary Forecast of <strong>Food</strong> CropProduction for 2010/11&Preliminary Forecast of <strong>Food</strong>Security for 2011/12Page 10
Preliminary Forecast of <strong>Food</strong> CropProduction for 2010/11&Preliminary Forecast of <strong>Food</strong>Security for 2011/12Page 11
Preliminary Forecast of <strong>Food</strong> CropProduction for 2010/11&Preliminary Forecast of <strong>Food</strong>Security for 2011/12Page 12
Preliminary Forecast of <strong>Food</strong> CropProduction for 2010/11&Preliminary Forecast of <strong>Food</strong>Security for 2011/12Page 13
Preliminary Forecast of <strong>Food</strong> CropProduction for 2010/11&Preliminary Forecast of <strong>Food</strong>Security for 2011/12Page 14
Preliminary Forecast of <strong>Food</strong> CropProduction for 2010/11&Preliminary Forecast of <strong>Food</strong>Security for 2011/12Page 15
Preliminary Forecast of <strong>Food</strong> CropProduction for 2010/11&Preliminary Forecast of <strong>Food</strong>Security for 2011/12TOTAL FOOD SUPPLY FORECAST FOR 2011/12 MARKETING YEAR (BASEDON THE 2010/11 PRELIMINARY FOOD CROP PRODUCTION FORECAST)Arusha (Deficit)Manyara (Self<strong>Su</strong>fficient)In summary:Based on the 2010/11 Preliminary <strong>Food</strong> Crop Production Forecast<strong>Su</strong>rvey, Tanzania, during 2011/12, will be 111% self sufficient.Specifically, there is evidence to indicate that: 6 regions will bedefinitely deficit, 8 regions will be definitely self-sufficient <strong>and</strong> 7regions will be definitely surplus. Here <strong>and</strong> there, pockets ofvulnerable areas are signaled in 56 districts in 16 regions.Page 16
Preliminary Forecast of <strong>Food</strong> CropProduction for 2010/11&Preliminary Forecast of <strong>Food</strong>Security for 2011/12Page 17