Adolescence
Adolescence
Adolescence
- No tags were found...

Create successful ePaper yourself
Turn your PDF publications into a flip-book with our unique Google optimized e-Paper software.
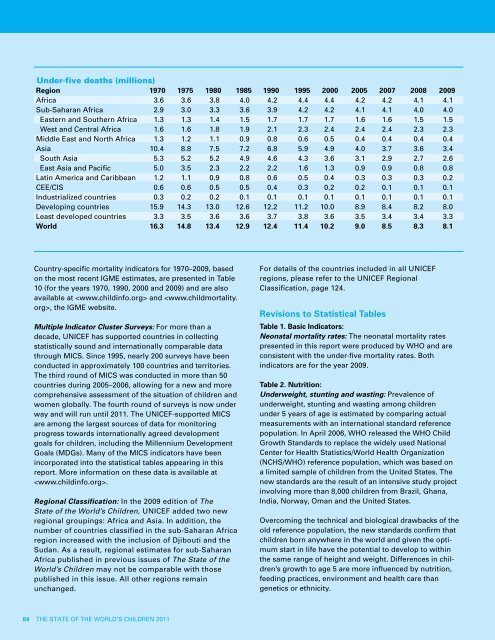
Under-five deaths (millions)Region 1970 1975 1980 1985 1990 1995 2000 2005 2007 2008 2009Africa 3.6 3.6 3.8 4.0 4.2 4.4 4.4 4.2 4.2 4.1 4.1Sub-Saharan Africa 2.9 3.0 3.3 3.6 3.9 4.2 4.2 4.1 4.1 4.0 4.0Eastern and Southern Africa 1.3 1.3 1.4 1.5 1.7 1.7 1.7 1.6 1.6 1.5 1.5West and Central Africa 1.6 1.6 1.8 1.9 2.1 2.3 2.4 2.4 2.4 2.3 2.3Middle East and North Africa 1.3 1.2 1.1 0.9 0.8 0.6 0.5 0.4 0.4 0.4 0.4Asia 10.4 8.8 7.5 7.2 6.8 5.9 4.9 4.0 3.7 3.6 3.4South Asia 5.3 5.2 5.2 4.9 4.6 4.3 3.6 3.1 2.9 2.7 2.6East Asia and Pacific 5.0 3.5 2.3 2.2 2.2 1.6 1.3 0.9 0.9 0.8 0.8Latin America and Caribbean 1.2 1.1 0.9 0.8 0.6 0.5 0.4 0.3 0.3 0.3 0.2CEE/CIS 0.6 0.6 0.5 0.5 0.4 0.3 0.2 0.2 0.1 0.1 0.1Industrialized countries 0.3 0.2 0.2 0.1 0.1 0.1 0.1 0.1 0.1 0.1 0.1Developing countries 15.9 14.3 13.0 12.6 12.2 11.2 10.0 8.9 8.4 8.2 8.0Least developed countries 3.3 3.5 3.6 3.6 3.7 3.8 3.6 3.5 3.4 3.4 3.3World 16.3 14.8 13.4 12.9 12.4 11.4 10.2 9.0 8.5 8.3 8.1Country-specific mortality indicators for 1970–2009, basedon the most recent IGME estimates, are presented in Table10 (for the years 1970, 1990, 2000 and 2009) and are alsoavailable at and , the IGME website.Multiple Indicator Cluster Surveys: For more than adecade, UNICEF has supported countries in collectingstatistically sound and internationally comparable datathrough MICS. Since 1995, nearly 200 surveys have beenconducted in approximately 100 countries and territories.The third round of MICS was conducted in more than 50countries during 2005–2006, allowing for a new and morecomprehensive assessment of the situation of children andwomen globally. The fourth round of surveys is now underway and will run until 2011. The UNICEF-supported MICSare among the largest sources of data for monitoringprogress towards internationally agreed developmentgoals for children, including the Millennium DevelopmentGoals (MDGs). Many of the MICS indicators have beenincorporated into the statistical tables appearing in thisreport. More information on these data is available at.Regional Classification: In the 2009 edition of TheState of the World’s Children, UNICEF added two newregional groupings: Africa and Asia. In addition, thenumber of countries classified in the sub-Saharan Africaregion increased with the inclusion of Djibouti and theSudan. As a result, regional estimates for sub-SaharanAfrica published in previous issues of The State of theWorld’s Children may not be comparable with thosepublished in this issue. All other regions remainunchanged.For details of the countries included in all UNICEFregions, please refer to the UNICEF RegionalClassification, page 124.Revisions to Statistical TablesTable 1. Basic Indicators:Neonatal mortality rates: The neonatal mortality ratespresented in this report were produced by WHO and areconsistent with the under-five mortality rates. Bothindicators are for the year 2009.Table 2. Nutrition:Underweight, stunting and wasting: Prevalence ofunderweight, stunting and wasting among childrenunder 5 years of age is estimated by comparing actualmeasurements with an international standard referencepopulation. In April 2006, WHO released the WHO ChildGrowth Standards to replace the widely used NationalCenter for Health Statistics/World Health Organization(NCHS/WHO) reference population, which was based ona limited sample of children from the United States. Thenew standards are the result of an intensive study projectinvolving more than 8,000 children from Brazil, Ghana,India, Norway, Oman and the United States.Overcoming the technical and biological drawbacks of theold reference population, the new standards confirm thatchildren born anywhere in the world and given the optimumstart in life have the potential to develop to withinthe same range of height and weight. Differences in children’sgrowth to age 5 are more influenced by nutrition,feeding practices, environment and health care thangenetics or ethnicity.84THE STATE OF THE WORLD’S CHILDREN 2011