Adolescence
Adolescence Adolescence
STATISTICAL TABLESEconomic and social statistics on the countries and territories of the world,with particular reference to children’s well-being.OVERVIEWThis reference guide presents the most recent key statistics on child survival, developmentand protection for the world’s countries, territories and regions in a single volume. For thefirst time this year, two new tables have been included:• Table 11: Adolescents• Table 12: EquityThe Adolescents table provides data relevant to this specific age group. The indicatorsinclude: proportion of the total population that are 10–19 years old; current marital status ofgirls aged 15–19; percentage of girls aged 20–24 who gave birth before age 18; adolescentfertility; attitudes towards domestic violence of girls and boys aged 15–19; secondaryeducation; and HIV/AIDS knowledge of adolescents.The Equity table provides data on disparities by household wealth for four indicators –birth registration, skilled attendant at delivery, underweight prevalence and immunization –as well as disparity data by area of residence (urban and rural) for use of improved sanitationfacilities.The statistical tables presented in this volume help to meet the demand for timely, reliable,comparable and comprehensive data on the state of the world’s children. They also supportUNICEF’s focus on progress and results on internationally agreed goals and compacts onchildren’s rights and development. UNICEF is the lead agency responsible for globalmonitoring of the Millennium Declaration child-related goals as well as MillenniumDevelopment Goals and indicators; the organization is also a key partner in the UnitedNations’ work on monitoring these targets and indicators.All of the numbers presented in this reference guide are available online at and . The data will alsobe available via the UNICEF global statistical databases at . Pleaserefer to these websites for the latest versions of the statistical tables and for any updatesor corrigenda subsequent to printing.82THE STATE OF THE WORLD’S CHILDREN 2011
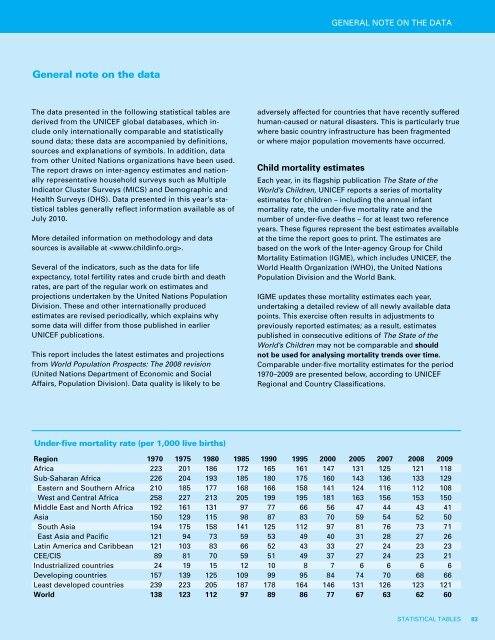
GENERAL NOTE ON THE DATAGeneral note on the dataThe data presented in the following statistical tables arederived from the UNICEF global databases, which includeonly internationally comparable and statisticallysound data; these data are accompanied by definitions,sources and explanations of symbols. In addition, datafrom other United Nations organizations have been used.The report draws on inter-agency estimates and nationallyrepresentative household surveys such as MultipleIndicator Cluster Surveys (MICS) and Demographic andHealth Surveys (DHS). Data presented in this year’s statisticaltables generally reflect information available as ofJuly 2010.More detailed information on methodology and datasources is available at .Several of the indicators, such as the data for lifeexpectancy, total fertility rates and crude birth and deathrates, are part of the regular work on estimates andprojections undertaken by the United Nations PopulationDivision. These and other internationally producedestimates are revised periodically, which explains whysome data will differ from those published in earlierUNICEF publications.This report includes the latest estimates and projectionsfrom World Population Prospects: The 2008 revision(United Nations Department of Economic and SocialAffairs, Population Division). Data quality is likely to beadversely affected for countries that have recently sufferedhuman-caused or natural disasters. This is particularly truewhere basic country infrastructure has been fragmentedor where major population movements have occurred.Child mortality estimatesEach year, in its flagship publication The State of theWorld’s Children, UNICEF reports a series of mortalityestimates for children – including the annual infantmortality rate, the under-five mortality rate and thenumber of under-five deaths – for at least two referenceyears. These figures represent the best estimates availableat the time the report goes to print. The estimates arebased on the work of the Inter-agency Group for ChildMortality Estimation (IGME), which includes UNICEF, theWorld Health Organization (WHO), the United NationsPopulation Division and the World Bank.IGME updates these mortality estimates each year,undertaking a detailed review of all newly available datapoints. This exercise often results in adjustments topreviously reported estimates; as a result, estimatespublished in consecutive editions of The State of theWorld’s Children may not be comparable and shouldnot be used for analysing mortality trends over time.Comparable under-five mortality estimates for the period1970–2009 are presented below, according to UNICEFRegional and Country Classifications.Under-five mortality rate (per 1,000 live births)Region 1970 1975 1980 1985 1990 1995 2000 2005 2007 2008 2009Africa 223 201 186 172 165 161 147 131 125 121 118Sub-Saharan Africa 226 204 193 185 180 175 160 143 136 133 129Eastern and Southern Africa 210 185 177 168 166 158 141 124 116 112 108West and Central Africa 258 227 213 205 199 195 181 163 156 153 150Middle East and North Africa 192 161 131 97 77 66 56 47 44 43 41Asia 150 129 115 98 87 83 70 59 54 52 50South Asia 194 175 158 141 125 112 97 81 76 73 71East Asia and Pacific 121 94 73 59 53 49 40 31 28 27 26Latin America and Caribbean 121 103 83 66 52 43 33 27 24 23 23CEE/CIS 89 81 70 59 51 49 37 27 24 23 21Industrialized countries 24 19 15 12 10 8 7 6 6 6 6Developing countries 157 139 125 109 99 95 84 74 70 68 66Least developed countries 239 223 205 187 178 164 146 131 126 123 121World 138 123 112 97 89 86 77 67 63 62 60STATISTICAL TABLES 83
- Page 40 and 41: ADOLESCENT VOICESAct responsibly:Nu
- Page 42 and 43: past decade, though not all of them
- Page 44 and 45: Yet other initiatives against child
- Page 46 and 47: PERSPECTIVEChernobyl 25 years later
- Page 48: Adolescents are deeply concernedabo
- Page 51 and 52: OPPORTUNITIESrisk of climate change
- Page 53 and 54: Poverty, unemploymentand globalizat
- Page 55 and 56: PERSPECTIVEThe effects of climate c
- Page 57 and 58: high-level competencies that are in
- Page 59 and 60: a window for possible economic deve
- Page 61 and 62: ADOLESCENT VOICESReclaim Tijuana:Pu
- Page 63 and 64: are exacerbating those risks, inclu
- Page 65 and 66: sentencing wherever possible, inclu
- Page 67 and 68: e stranded in poverty by conflict o
- Page 70 and 71: HALLENGES ANDOver the course of the
- Page 72 and 73: gated by age, disability, sex, ethn
- Page 74 and 75: FOCUS ONPreparing adolescents for a
- Page 76 and 77: the Ministry of Education, in colla
- Page 78 and 79: exactly ‘youth participation’ l
- Page 80 and 81: spaces as part of Aprendiz, the ‘
- Page 82 and 83: PERSPECTIVEAdolescent girls:The bes
- Page 84 and 85: ADOLESCENT VOICESFrom victims to ac
- Page 86 and 87: ReferencesCHAPTER 11United Nations,
- Page 88 and 89: 19United Nations Children’s Fund,
- Page 92 and 93: Under-five deaths (millions)Region
- Page 94 and 95: STATISTICAL TABLESapproach is not t
- Page 96 and 97: TABLE 1. BASIC INDICATORSCountries
- Page 98 and 99: TABLE 1. BASIC INDICATORSUnder-5mor
- Page 100 and 101: TABLE 2. NUTRITIONCountries and ter
- Page 102 and 103: TABLE 2. NUTRITIONCountries and ter
- Page 104 and 105: TABLE 3. HEALTHCountries and territ
- Page 106 and 107: TABLE 3. HEALTH% of populationusing
- Page 108 and 109: TABLE 4. HIV/AIDSCountries and terr
- Page 110 and 111: TABLE 4. HIV/AIDSEstimatedadult HIV
- Page 112 and 113: TABLE 5. EDUCATIONCountries and ter
- Page 114 and 115: TABLE 5. EDUCATIONPrimary schoolNum
- Page 116 and 117: TABLE 6. DEMOGRAPHIC INDICATORSCoun
- Page 118 and 119: TABLE 6. DEMOGRAPHIC INDICATORSPopu
- Page 120 and 121: TABLE 7. ECONOMIC INDICATORSCountri
- Page 122 and 123: TABLE 7. ECONOMIC INDICATORSCountri
- Page 124 and 125: TABLE 8. WOMENCountries andterritor
- Page 126 and 127: TABLE 8. WOMENCountries andterritor
- Page 128 and 129: TABLE 9. CHILD PROTECTIONChild labo
- Page 130 and 131: TABLE 9. CHILD PROTECTIONChild labo
- Page 132 and 133: Summary indicatorsAverages presente
- Page 134 and 135: TABLE 10. THE RATE OF PROGRESSCount
- Page 136 and 137: TABLE 10. THE RATE OF PROGRESSUnder
- Page 138 and 139: TABLE 11. ADOLESCENTSCountries and
GENERAL NOTE ON THE DATAGeneral note on the dataThe data presented in the following statistical tables arederived from the UNICEF global databases, which includeonly internationally comparable and statisticallysound data; these data are accompanied by definitions,sources and explanations of symbols. In addition, datafrom other United Nations organizations have been used.The report draws on inter-agency estimates and nationallyrepresentative household surveys such as MultipleIndicator Cluster Surveys (MICS) and Demographic andHealth Surveys (DHS). Data presented in this year’s statisticaltables generally reflect information available as ofJuly 2010.More detailed information on methodology and datasources is available at .Several of the indicators, such as the data for lifeexpectancy, total fertility rates and crude birth and deathrates, are part of the regular work on estimates andprojections undertaken by the United Nations PopulationDivision. These and other internationally producedestimates are revised periodically, which explains whysome data will differ from those published in earlierUNICEF publications.This report includes the latest estimates and projectionsfrom World Population Prospects: The 2008 revision(United Nations Department of Economic and SocialAffairs, Population Division). Data quality is likely to beadversely affected for countries that have recently sufferedhuman-caused or natural disasters. This is particularly truewhere basic country infrastructure has been fragmentedor where major population movements have occurred.Child mortality estimatesEach year, in its flagship publication The State of theWorld’s Children, UNICEF reports a series of mortalityestimates for children – including the annual infantmortality rate, the under-five mortality rate and thenumber of under-five deaths – for at least two referenceyears. These figures represent the best estimates availableat the time the report goes to print. The estimates arebased on the work of the Inter-agency Group for ChildMortality Estimation (IGME), which includes UNICEF, theWorld Health Organization (WHO), the United NationsPopulation Division and the World Bank.IGME updates these mortality estimates each year,undertaking a detailed review of all newly available datapoints. This exercise often results in adjustments topreviously reported estimates; as a result, estimatespublished in consecutive editions of The State of theWorld’s Children may not be comparable and shouldnot be used for analysing mortality trends over time.Comparable under-five mortality estimates for the period1970–2009 are presented below, according to UNICEFRegional and Country Classifications.Under-five mortality rate (per 1,000 live births)Region 1970 1975 1980 1985 1990 1995 2000 2005 2007 2008 2009Africa 223 201 186 172 165 161 147 131 125 121 118Sub-Saharan Africa 226 204 193 185 180 175 160 143 136 133 129Eastern and Southern Africa 210 185 177 168 166 158 141 124 116 112 108West and Central Africa 258 227 213 205 199 195 181 163 156 153 150Middle East and North Africa 192 161 131 97 77 66 56 47 44 43 41Asia 150 129 115 98 87 83 70 59 54 52 50South Asia 194 175 158 141 125 112 97 81 76 73 71East Asia and Pacific 121 94 73 59 53 49 40 31 28 27 26Latin America and Caribbean 121 103 83 66 52 43 33 27 24 23 23CEE/CIS 89 81 70 59 51 49 37 27 24 23 21Industrialized countries 24 19 15 12 10 8 7 6 6 6 6Developing countries 157 139 125 109 99 95 84 74 70 68 66Least developed countries 239 223 205 187 178 164 146 131 126 123 121World 138 123 112 97 89 86 77 67 63 62 60STATISTICAL TABLES 83


