Adolescence
Adolescence
Adolescence
- No tags were found...

You also want an ePaper? Increase the reach of your titles
YUMPU automatically turns print PDFs into web optimized ePapers that Google loves.
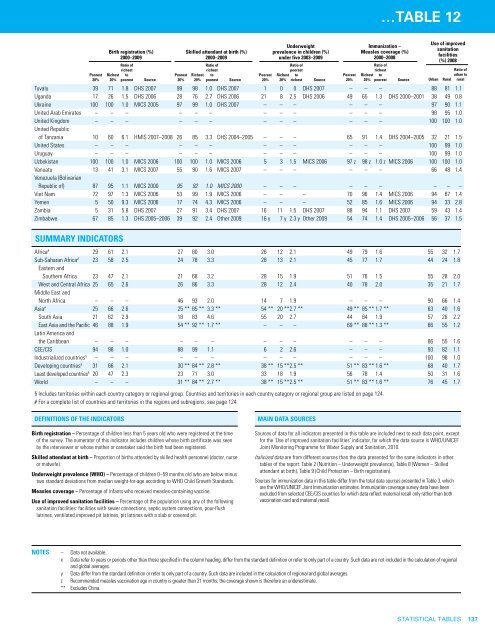
…TABLE 12Birth registration (%)2000–2009Ratio ofrichestPoorest Richest to20% 20% poorest SourceTuvalu 39 71 1.8 DHS 2007 99 98 1.0 DHS 2007 1 0 0 DHS 2007 – – – 88 81 1.1Uganda 17 26 1.5 DHS 2006 28 76 2.7 DHS 2006 21 8 2.5 DHS 2006 49 65 1.3 DHS 2000–2001 38 49 0.8Ukraine 100 100 1.0 MICS 2005 97 99 1.0 DHS 2007 – – – – – – 97 90 1.1United Arab Emirates – – – – – – – – – – – – 98 95 1.0United Kingdom – – – – – – – – – – – – 100 100 1.0United Republicof Tanzania 10 60 6.1 HMIS 2007–2008 26 85 3.3 DHS 2004–2005 – – – 65 91 1.4 DHS 2004–2005 32 21 1.5United States – – – – – – – – – – – – 100 99 1.0Uruguay – – – – – – – – – – – – 100 99 1.0Uzbekistan 100 100 1.0 MICS 2006 100 100 1.0 MICS 2006 5 3 1.5 MICS 2006 97 z 98 z 1.0 z MICS 2006 100 100 1.0Vanuatu 13 41 3.1 MICS 2007 55 90 1.6 MICS 2007 – – – – – – 66 48 1.4Venezuela (BolivarianRepublic of) 87 95 1.1 MICS 2000 95 92 1.0 MICS 2000 – – – – – – – – –Viet Nam 72 97 1.3 MICS 2006 53 99 1.9 MICS 2006 – – – 70 96 1.4 MICS 2006 94 67 1.4Yemen 5 50 9.3 MICS 2006 17 74 4.3 MICS 2006 – – – 52 85 1.6 MICS 2006 94 33 2.8Zambia 5 31 5.8 DHS 2007 27 91 3.4 DHS 2007 16 11 1.5 DHS 2007 88 94 1.1 DHS 2007 59 43 1.4Zimbabwe 67 85 1.3 DHS 2005–2006 39 92 2.4 Other 2009 16 y 7 y 2.3 y Other 2009 54 74 1.4 DHS 2005–2006 56 37 1.5SUMMARY INDICATORSSkilled attendant at birth (%)2000–2009Ratio ofrichestPoorest Richest to20% 20% poorest SourceUnderweightprevalence in children (%)under five 2003–2009Ratio ofpoorestPoorest Richest to20% 20% richest SourceImmunization –Measles coverage (%)2000–2008Ratio ofrichestPoorest Richest to20% 20% poorest SourceAfrica # 29 61 2.1 27 80 3.0 26 12 2.1 49 79 1.6 55 32 1.7Sub-Saharan Africa # 23 58 2.5 24 78 3.3 28 13 2.1 45 77 1.7 44 24 1.8Eastern andSouthern Africa 23 47 2.1 21 68 3.2 28 15 1.9 51 76 1.5 55 28 2.0West and Central Africa 25 65 2.6 26 86 3.3 28 12 2.4 40 78 2.0 35 21 1.7Middle East andNorth Africa – – – 46 93 2.0 14 7 1.9 – – – 90 66 1.4Asia # 25 66 2.6 25 ** 85 ** 3.3 ** 54 ** 20 ** 2.7 ** 49 ** 85 ** 1.7 ** 63 40 1.6South Asia 21 62 2.9 18 83 4.6 55 20 2.7 44 84 1.9 57 26 2.2East Asia and the Pacific 46 88 1.9 54 ** 92 ** 1.7 ** – – – 69 ** 88 ** 1.3 ** 66 55 1.2Latin America andthe Caribbean – – – – – – – – – – – – 86 55 1.6CEE/CIS 94 98 1.0 88 99 1.1 6 2 2.6 – – – 93 82 1.1Industrialized countries § – – – – – – – – – – – – 100 98 1.0Developing countries § 31 66 2.1 30 ** 84 ** 2.8 ** 38 ** 15 ** 2.5 ** 51 ** 83 ** 1.6 ** 68 40 1.7Least developed countries § 20 47 2.3 23 71 3.0 33 18 1.9 56 78 1.4 50 31 1.6World – – – 31 ** 84 ** 2.7 ** 38 ** 15 ** 2.5 ** 51 ** 83 ** 1.6 ** 76 45 1.7§ Includes territories within each country category or regional group. Countries and territories in each country category or regional group are listed on page 124.# For a complete list of countries and territories in the regions and subregions, see page 124.Use of improvedsanitationfacilities(%) 2008Ratio ofurban toUrban Rural ruralDEFINITIONS OF THE INDICATORSBirth registration – Percentage of children less than 5 years old who were registered at the timeof the survey. The numerator of this indicator includes children whose birth certificate was seenby the interviewer or whose mother or caretaker said the birth had been registered.Skilled attendant at birth – Proportion of births attended by skilled health personnel (doctor, nurseor midwife).Underweight prevalence (WHO) – Percentage of children 0–59 months old who are below minustwo standard deviations from median weight-for-age according to WHO Child Growth Standards.Measles coverage – Percentage of infants who received measles-containing vaccine.Use of improved sanitation facilities – Percentage of the population using any of the followingsanitation facilities: facilities with sewer connections, septic system connections, pour-flushlatrines, ventilated improved pit latrines, pit latrines with a slab or covered pit.MAIN DATA SOURCESSources of data for all indicators presented in this table are included next to each data point, exceptfor the ‘Use of improved sanitation facilities’ indicator, for which the data source is WHO/UNICEFJoint Monitoring Programme for Water Supply and Sanitation, 2010.Italicized data are from different sources than the data presented for the same indicators in othertables of the report: Table 2 (Nutrition – Underweight prevalence), Table 8 (Women – Skilledattendant at birth), Table 9 (Child Protection – Birth registration).Sources for immunization data in this table differ from the total data sources presented in Table 3, whichare the WHO/UNICEF Joint Immunization estimates. Immunization coverage survey data have beenexcluded from selected CEE/CIS countries for which data reflect maternal recall only rather than bothvaccination card and maternal recall.NOTES – Data not available.x Data refer to years or periods other than those specified in the column heading, differ from the standard definition or refer to only part of a country. Such data are not included in the calculation of regionaland global averages.y Data differ from the standard definition or refer to only part of a country. Such data are included in the calculation of regional and global averages.z Recommended measles vaccination age in country is greater than 21 months; the coverage shown is therefore an underestimate.** Excludes China.STATISTICAL TABLES 137