Cornell University 2011-2012 Annual Report - DFA Home - Cornell ...
Cornell University 2011-2012 Annual Report - DFA Home - Cornell ...
Cornell University 2011-2012 Annual Report - DFA Home - Cornell ...

You also want an ePaper? Increase the reach of your titles
YUMPU automatically turns print PDFs into web optimized ePapers that Google loves.
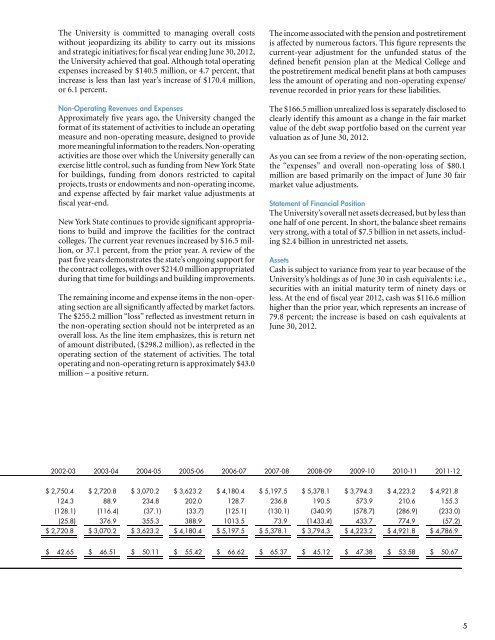
The <strong>University</strong> is committed to managing overall costswithout jeopardizing its ability to carry out its missionsand strategic initiatives; for fiscal year ending June 30, <strong>2012</strong>,the <strong>University</strong> achieved that goal. Although total operatingexpenses increased by $140.5 million, or 4.7 percent, thatincrease is less than last year’s increase of $170.4 million,or 6.1 percent.Non-Operating Revenues and ExpensesApproximately five years ago, the <strong>University</strong> changed theformat of its statement of activities to include an operatingmeasure and non-operating measure, designed to providemore meaningful information to the readers. Non-operatingactivities are those over which the <strong>University</strong> generally canexercise little control, such as funding from New York Statefor buildings, funding from donors restricted to capitalprojects, trusts or endowments and non-operating income,and expense affected by fair market value adjustments atfiscal year-end.New York State continues to provide significant appropriationsto build and improve the facilities for the contractcolleges. The current year revenues increased by $16.5 million,or 37.1 percent, from the prior year. A review of thepast five years demonstrates the state’s ongoing support forthe contract colleges, with over $214.0 million appropriatedduring that time for buildings and building improvements.The remaining income and expense items in the non-operatingsection are all significantly affected by market factors.The $255.2 million “loss” reflected as investment return inthe non-operating section should not be interpreted as anoverall loss. As the line item emphasizes, this is return netof amount distributed, ($298.2 million), as reflected in theoperating section of the statement of activities. The totaloperating and non-operating return is approximately $43.0million – a positive return.The income associated with the pension and postretirementis affected by numerous factors. This figure represents thecurrent-year adjustment for the unfunded status of thedefined benefit pension plan at the Medical College andthe postretirement medical benefit plans at both campusesless the amount of operating and non-operating expense/revenue recorded in prior years for these liabilities.The $166.5 million unrealized loss is separately disclosed toclearly identify this amount as a change in the fair marketvalue of the debt swap portfolio based on the current yearvaluation as of June 30, <strong>2012</strong>.As you can see from a review of the non-operating section,the “expenses” and overall non-operating loss of $80.1million are based primarily on the impact of June 30 fairmarket value adjustments.Statement of Financial PositionThe <strong>University</strong>’s overall net assets decreased, but by less thanone half of one percent. In short, the balance sheet remainsvery strong, with a total of $7.5 billion in net assets, including$2.4 billion in unrestricted net assets.AssetsCash is subject to variance from year to year because of the<strong>University</strong>’s holdings as of June 30 in cash equivalents: i.e.,securities with an initial maturity term of ninety days orless. At the end of fiscal year <strong>2012</strong>, cash was $116.6 millionhigher than the prior year, which represents an increase of79.8 percent; the increase is based on cash equivalents atJune 30, <strong>2012</strong>.2002-03 2003-04 2004-05 2005-06 2006-07 2007-08 2008-09 2009-10 2010-11 <strong>2011</strong>-12$ 2,750.4 $ 2,720.8 $ 3,070.2 $ 3,623.2 $ 4,180.4 $ 5,197.5 $ 5,378.1 $ 3,794.3 $ 4,223.2 $ 4,921.8124.3 88.9 234.8 202.0 128.7 236.8 190.5 573.9 210.6 155.3(128.1) (116.4) (37.1) (33.7) (125.1) (130.1) (340.9) (578.7) (286.9) (233.0)(25.8) 376.9 355.3 388.9 1013.5 73.9 (1433.4) 433.7 774.9 (57.2)$ 2,720.8 $ 3,070.2 $ 3,623.2 $ 4,180.4 $ 5,197.5 $ 5,378.1 $ 3,794.3 $ 4,223.2 $ 4,921.8 $ 4,786.9$ 42.65 $ 46.51 $ 50.11 $ 55.42 $ 66.62 $ 65.37 $ 45.12 $ 47.38 $ 53.58 $ 50.675