THERMOECONOMICS - Vocat International Ltd
THERMOECONOMICS - Vocat International Ltd
THERMOECONOMICS - Vocat International Ltd
Create successful ePaper yourself
Turn your PDF publications into a flip-book with our unique Google optimized e-Paper software.
2<br />
Copyright: John Bryant, VOCAT <strong>International</strong> <strong>Ltd</strong> 2012, for personal use only.<br />
format to the ideal gas equation. Pikler (1954) has highlighted the<br />
connections between the velocity of circulation and temperature.<br />
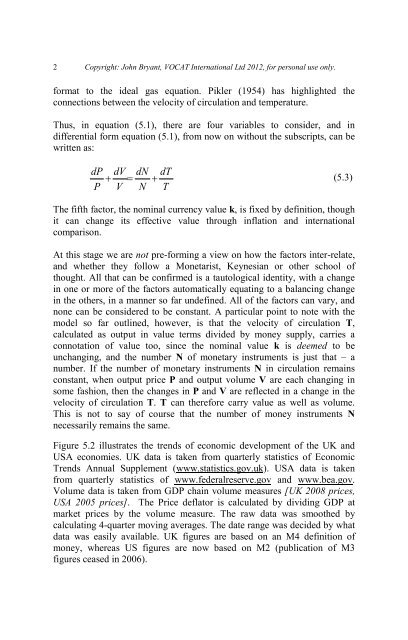
Thus, in equation (5.1), there are four variables to consider, and in<br />
differential form equation (5.1), from now on without the subscripts, can be<br />
written as:<br />
dP dV dN dT<br />
+ = +<br />
(5.3)<br />
P V N T<br />
The fifth factor, the nominal currency value k, is fixed by definition, though<br />
it can change its effective value through inflation and international<br />
comparison.<br />
At this stage we are not pre-forming a view on how the factors inter-relate,<br />
and whether they follow a Monetarist, Keynesian or other school of<br />
thought. All that can be confirmed is a tautological identity, with a change<br />
in one or more of the factors automatically equating to a balancing change<br />
in the others, in a manner so far undefined. All of the factors can vary, and<br />
none can be considered to be constant. A particular point to note with the<br />
model so far outlined, however, is that the velocity of circulation T,<br />
calculated as output in value terms divided by money supply, carries a<br />
connotation of value too, since the nominal value k is deemed to be<br />
unchanging, and the number N of monetary instruments is just that – a<br />
number. If the number of monetary instruments N in circulation remains<br />
constant, when output price P and output volume V are each changing in<br />
some fashion, then the changes in P and V are reflected in a change in the<br />
velocity of circulation T. T can therefore carry value as well as volume.<br />
This is not to say of course that the number of money instruments N<br />
necessarily remains the same.<br />
Figure 5.2 illustrates the trends of economic development of the UK and<br />
USA economies. UK data is taken from quarterly statistics of Economic<br />
Trends Annual Supplement (www.statistics.gov.uk). USA data is taken<br />
from quarterly statistics of www.federalreserve.gov and www.bea.gov.<br />
Volume data is taken from GDP chain volume measures [UK 2008 prices,<br />
USA 2005 prices]. The Price deflator is calculated by dividing GDP at<br />
market prices by the volume measure. The raw data was smoothed by<br />
calculating 4-quarter moving averages. The date range was decided by what<br />
data was easily available. UK figures are based on an M4 definition of<br />
money, whereas US figures are now based on M2 (publication of M3<br />
figures ceased in 2006).


