Operating Instructions - Snap-on Equipment
Operating Instructions - Snap-on Equipment Operating Instructions - Snap-on Equipment
PC Meters/GraphOrder—Specifies which measurements to include in the strip chart and in whatorder.Add button—To add an item to the Order list, select the item in theMeter Selection list and press Add.Remove button—To remove an item from the Order list, select theitem in the Order list and press Remove.Up button—To move an item up in the Order list, select the item in theOrder list and press Up until the item is in the desired position.Down button—To move an item down in the Order list, select the itemin the Order list and press Down until the item is in the desiredposition.Trace Color—Sets the color of the trace for each item being plotted. To changethe color, select the item in the Order list and double-click the Trace Color box.Choose the new color from the color selector.Scale Reading by x—Allows you to scale the actual reading of an item by a factorof x. The default factor is 1. For example, if you select HC in the Order list andchange the scale factor to 10, the instantaneous value is multiplied by 10 when thepoint is plotted on the strip chart. Put in max Y divided by max reading expected.Manual Meters / Strip Chart ResultsThe results window allows you to view and print the results obtained. When youselect Save on the Test Actions menu of the Manual Meters or Strip Chart window,the results are displayed on the Single Save tab of the Test Results window asshown in Figure 3C-5.Figure 3C-5: Single Save Test Results3C-8
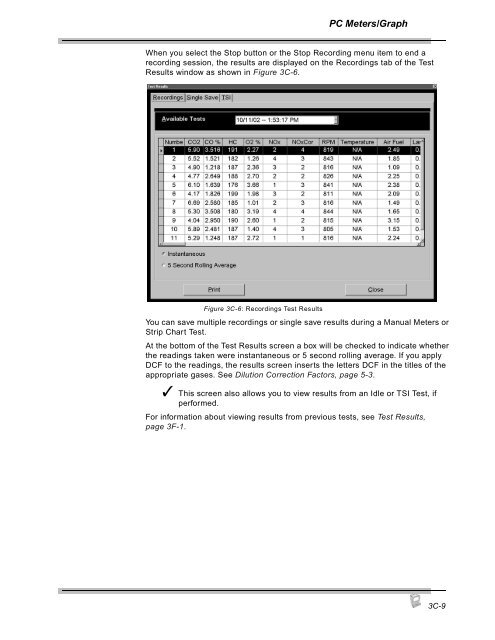
PC Meters/GraphWhen you select the Stop button or the Stop Recording menu item to end arecording session, the results are displayed on the Recordings tab of the TestResults window as shown in Figure 3C-6.Figure 3C-6: Recordings Test ResultsYou can save multiple recordings or single save results during a Manual Meters orStrip Chart Test.At the bottom of the Test Results screen a box will be checked to indicate whetherthe readings taken were instantaneous or 5 second rolling average. If you applyDCF to the readings, the results screen inserts the letters DCF in the titles of theappropriate gases. See Dilution Correction Factors, page 5-3.✓ This screen also allows you to view results from an Idle or TSI Test, ifperformed.For information about viewing results from previous tests, see Test Results,page 3F-1.3C-9
- Page 65 and 66: Pocket PCMaintenance2GThis section
- Page 67 and 68: Pocket PC Maintenance6. Press OK to
- Page 69 and 70: Pocket PC MaintenanceIf the reading
- Page 71 and 72: Pocket PC Maintenance✓ Always mak
- Page 73 and 74: Pocket PC Maintenance3. Remove the
- Page 75 and 76: Pocket PC MaintenanceSetupThis sect
- Page 77 and 78: Pocket PC MaintenanceRPM/Temp Kit
- Page 79 and 80: Pocket PC MaintenanceTSI / Idle Set
- Page 81 and 82: Pocket PC MaintenanceStandardsThe S
- Page 83 and 84: Pocket PC MaintenanceFigure 2G-23:
- Page 85 and 86: Pocket PC MaintenanceBoard Diagnost
- Page 87 and 88: Pocket PC MaintenanceTo perform the
- Page 89 and 90: Pocket PC Maintenance7. Press the S
- Page 91 and 92: Pocket PC MaintenanceFigure 2G-34:
- Page 93 and 94: Pocket PC MaintenanceLow Out FlowTh
- Page 95 and 96: Pocket PCOther Functions2HAboutThis
- Page 97 and 98: 3Using FGA with the PCThe Flexible
- Page 99 and 100: 3APC Software OverviewThe PC versio
- Page 101 and 102: PC Software OverviewCommands 1-10Co
- Page 103 and 104: PC Software OverviewCommandsFigure
- Page 105 and 106: 3BPC SoftwareInstallationThe Flexib
- Page 107 and 108: PC Software Installation5. If this
- Page 109 and 110: 3CPC Meters/Strip ChartThis chapter
- Page 111 and 112: PC Meters/GraphGas Bench MenuThe Ga
- Page 113 and 114: PC Meters/GraphStrip ChartTo view t
- Page 115: PC Meters/GraphStrip Chart Display
- Page 119 and 120: PC Meters/GraphTachometerUse the Ta
- Page 121 and 122: PC Automatic Tests3DTSI TestThis se
- Page 123 and 124: PC Automatic TestsTachometer Config
- Page 125 and 126: PC Automatic TestsIdle RPM TestFGA
- Page 127 and 128: PC Automatic TestsTSI Results16. Th
- Page 129 and 130: 3EPC Customer/VehicleFGA is designe
- Page 131 and 132: PC Customer/VehicleInformation bar
- Page 133 and 134: PC Customer/VehicleWhen the desired
- Page 135 and 136: 3FPC ResultsThe Test Results window
- Page 137 and 138: 3GPC MaintenanceGas CalibrationThis
- Page 139 and 140: PC Maintenance5. Attach the calibra
- Page 141 and 142: PC MaintenanceNew NO x SensorNew NO
- Page 143 and 144: PC MaintenanceShop InformationThe S
- Page 145 and 146: PC MaintenanceThe Setup window cont
- Page 147 and 148: PC MaintenanceTSI Test SetupThe TSI
- Page 149 and 150: PC MaintenanceZero Purge Time(s)—
- Page 151 and 152: PC MaintenanceDiagnosticsService ut
- Page 153 and 154: PC Other Functions3HThis chapter co
- Page 155 and 156: 4General MaintenanceThis chapter ad
- Page 157 and 158: General MaintenanceOptionsPart Numb
- Page 159 and 160: General Maintenance3. Select the Ig
- Page 161 and 162: General MaintenanceWhen using the O
- Page 163 and 164: General Maintenance—Push the gray
- Page 165 and 166: General MaintenanceWhen FGA softwar
PC Meters/GraphWhen you select the Stop butt<strong>on</strong> or the Stop Recording menu item to end arecording sessi<strong>on</strong>, the results are displayed <strong>on</strong> the Recordings tab of the TestResults window as shown in Figure 3C-6.Figure 3C-6: Recordings Test ResultsYou can save multiple recordings or single save results during a Manual Meters orStrip Chart Test.At the bottom of the Test Results screen a box will be checked to indicate whetherthe readings taken were instantaneous or 5 sec<strong>on</strong>d rolling average. If you applyDCF to the readings, the results screen inserts the letters DCF in the titles of theappropriate gases. See Diluti<strong>on</strong> Correcti<strong>on</strong> Factors, page 5-3.✓ This screen also allows you to view results from an Idle or TSI Test, ifperformed.For informati<strong>on</strong> about viewing results from previous tests, see Test Results,page 3F-1.3C-9


