Section 5: Financial InformationTable 16 : Derivation of 2009-2010 Budget Allocation62(Thousands of Dollars) Salary O&M Sub-total CapitalVote-NettedRevenueContributions2008-09 Total Budget 303,194.0 195,083.4 498,277.4 198,372.5 (50,058.0) 4,881.0 651,472.9External Funding:Fuel <strong>Business</strong> Case - (25,000.0) (25,000.0) - - - (25,000.0)2008-09 Risk (08-09 ERC, Eff. Cut) - (10,227.2) (10,227.2) - - - (10,227.2)Science, FAM & NAFO Ships Funding (36,496.7) (18,790.0) (55,286.7) - - - (55,286.7)Real Property at College - (2,085.7) (2,085.7) - - - (2,085.7)NIF, Net - 494.8 494.8 - - - 494.8MSOC DND Sunset (1,145.0) (21.0) (1,166.0) - - - (1,166.0)IPY Sunset - (9,020.8) (9,020.8) - - - (9,020.8)Great Lakes MSET Sunset (2,399.5) (1,547.9) (3,947.4) - - - (3,947.4)RCMP Great Lakes MSOC 2009-10 678.3 1,409.5 2,087.8 - - - 2,087.8Vote Conversions:Science, FAM & NAFO Refit Vote Conv. - (6,032.8) (6,032.8) - - - (6,032.8)DND MSOC From C&P - (508.2) (508.2) - - - (508.2)IMSO G&C - 300.0 300.0 - - - 300.0Temporary 08-09 Salary Conv. (9,222.5) 11,067.0 1,844.5 - - - 1,844.5Dalhousie University G&C Sunset - 30.0 30.0 - - (30.0) -CCGA G&C - (187.0) (187.0) - - 187.0 -New Funding:Round 25 SO, EX & FI 4,363.6 - 4,363.6 - - - 4,363.6MSPV Funding 2,083.0 7,098.8 9,181.8 27,166.7 - - 36,348.5Arctic Remission Order - - - - 100.0 - 100.0Reprofiles & Funding Sunsets:MSPV Reprofile - - - (77,320.0) - - (77,320.0)AIS sunset - - - (1,745.6) - - (1,745.6)AIS ARLU Reprofile - - - 4,735.5 - - 4,735.5ACV Reprofile - - - (5,725.8) - - (5,725.8)Carry-forward - (5,722.7) (5,722.7) - - - (5,722.7)Other 2.7 542.9 545.6 - - - 545.62009-10 Main Estimates 261,057.9 136,883.1 397,941.0 145,483.3 (49,958.0) 5,038.0 498,504.3External Funding:Lay Day to Science (1,127.6) - (1,127.6) - - - (1,127.6)Lay Day to FAM (699.0) - (699.0) - - - (699.0)Science Fleet Funding 24,011.4 10,779.1 34,790.5 - - - 34,790.5FAM Fleet Funding 11,946.9 7,045.5 18,992.4 - - - 18,992.4NAFO Fleet Funding 4,564.3 2,401.3 6,965.6 - - - 6,965.6Science Refit - 4,050.0 4,050.0 - - - 4,050.0FAM Refit - 985.0 985.0 - - - 985.0NAFO Refit - 997.8 997.8 - - - 997.8Economic Action <strong>Plan</strong> - - - 90,000.0 - - 90,000.0PSAT (Sec. Tact. Comm. Trial) - Fleet - 730.8 730.8 - - - 730.8Salary / O&M Conversion 1,028.6 (1,234.6) (206.0) - - - (206.0)Real Property at College - 2,085.7 2,085.7 - - - 2,085.7College Minor Capital - 362.0 362.0 - - - 362.0Fiscal Frmk. Not Yet Appropriated - - - 26,162.0 - - 26,162.0Anticipated Repro. of Fiscal Frmk. - - - (16,562.0) - - (16,562.0)Anticipated Carry Forward - 5,003.2 5,003.2 11,322.7 - - 16,325.9Permanent Reductions:Efficiency Cut (Estimated) - (1,117.3) (1,117.3) - - - (1,117.3)2009-10 Budget Allocation 300,782.5 168,971.6 469,754.1 256,406.0 (49,958.0) 5,038.0 681,240.1Total<strong>Canadian</strong> <strong>Coast</strong> <strong>Guard</strong> — www.ccg-gcc.gc.ca
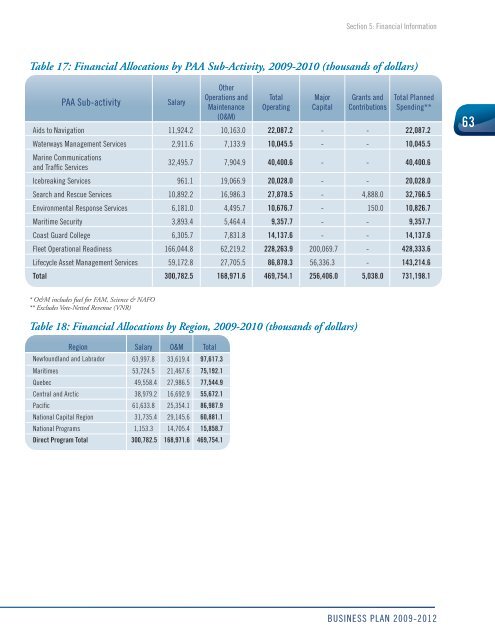
Section 5: Financial InformationTable 17: Financial Allocations by PAA Sub-Activity, 2009-2010 (thousands of dollars)PAA Sub-activitySalaryOtherOperations andMaintenance(O&M)TotalOperatingMajorCapitalGrants andContributionsTotal <strong>Plan</strong>nedSpending**Aids to Navigation 11,924.2 10,163.0 22,087.2 - - 22,087.2Waterways Management Services 2,911.6 7,133.9 10,045.5 - - 10,045.5Marine Communicationsand Traffic Services32,495.7 7,904.9 40,400.6 - - 40,400.6Icebreaking Services 961.1 19,066.9 20,028.0 - - 20,028.0Search and Rescue Services 10,892.2 16,986.3 27,878.5 - 4,888.0 32,766.5Environmental Response Services 6,181.0 4,495.7 10,676.7 - 150.0 10,826.7Maritime Security 3,893.4 5,464.4 9,357.7 - - 9,357.7<strong>Coast</strong> <strong>Guard</strong> College 6,305.7 7,831.8 14,137.6 - - 14,137.6Fleet Operational Readiness 166,044.8 62,219.2 228,263.9 200,069.7 - 428,333.6Lifecycle Asset Management Services 59,172.8 27,705.5 86,878.3 56,336.3 - 143,214.6Total 300,782.5 168,971.6 469,754.1 256,406.0 5,038.0 731,198.163* O&M includes fuel for FAM, Science & NAFO** Excludes Vote-Netted Revenue (VNR)Table 18: Financial Allocations by Region, 2009-2010 (thousands of dollars)Region Salary O&M TotalNewfoundland and Labrador 63,997.8 33,619.4 97,617.3Maritimes 53,724.5 21,467.6 75,192.1Quebec 49,558.4 27,986.5 77,544.9Central and Arctic 38,979.2 16,692.9 55,672.1Pacific 61,633.8 25,354.1 86,987.9National Capital Region 31,735.4 29,145.6 60,881.1National Programs 1,153.3 14,705.4 15,858.7Direct Program Total 300,782.5 168,971.6 469,754.1BUSINESS PLAN 2009-2012